Attached files
| file | filename |
|---|---|
| EX-32.2 - EXHIBIT 32.2 - LUBYS INC | lub_83116xex32-2.htm |
| EX-32.1 - EXHIBIT 32.1 - LUBYS INC | lub_83116xex32-1.htm |
| EX-31.2 - EXHIBIT 31.2 - LUBYS INC | lub_83116xex31-2.htm |
| EX-31.1 - EXHIBIT 31.1 - LUBYS INC | lub_83116xex31-1.htm |
| EX-23.1 - EXHIBIT 23.1 - LUBYS INC | lub_83116xex23-1.htm |
| EX-21 - EXHIBIT 21 - LUBYS INC | lub_83116xex21.htm |
| EX-10.W - EXHIBIT 10.W - LUBYS INC | lub_83116xex10-w.htm |
UNITED STATES
SECURITIES AND EXCHANGE COMMISSION
WASHINGTON, D.C. 20549
____________________________________
FORM 10-K
S | ANNUAL REPORT PURSUANT TO SECTION 13 OR 15(d) OF THE SECURITIES EXCHANGE ACT OF 1934 |
For the Fiscal Year Ended August 31, 2016
☐ | TRANSITION REPORT PURSUANT TO SECTION 13 OR 15(d) OF THE SECURITIES EXCHANGE ACT OF 1934 |
For the Transition Period From to
____________________________________
Commission file number 001-08308
Luby's, Inc.
(Exact name of registrant as specified in its charter)
Delaware | 74-1335253 |
(State or other jurisdiction of incorporation or organization) | (IRS Employer Identification Number) |
13111 Northwest Freeway, Suite 600
Houston, Texas 77040
(Address of principal executive offices, including zip code)
(713) 329-6800
(Registrant’s telephone number, including area code)
Securities registered pursuant to Section 12(b) of the Act:
Title of Each Class | Name of Each Exchange on which registered | |
Common Stock ($0.32 par value per share) | New York Stock Exchange | |
Securities registered pursuant to Section 12(g) of the Act: None
Indicate by check mark if the registrant is a well-known seasoned issuer, as defined in Rule 405 of the Securities Act. Yes ☐ No S
Indicate by check mark if the registrant is not required to file reports pursuant to Section 13 or Section 15(d) of the Act. Yes ☐ No S
Indicate by check mark whether the registrant (1) has filed all reports required to be filed by Section 13 or 15(d) of the Securities Exchange Act of 1934 during the preceding 12 months (or for such shorter period that the registrant was required to file such reports) and (2) has been subject to such filing requirements for the past 90 days. Yes S No ☐
Indicate by check mark whether the registrant has submitted electronically and posted on its corporate Web site, if any, every Interactive Data File required to be submitted and posted pursuant to Rule 405 of Regulation S-T during the preceding 12 months (or for such shorter period that the registrant was required to submit and post such files). Yes S No ☐
Indicate by check mark if disclosure of delinquent filers pursuant to Item 405 of Regulation S-K is not contained herein, and will not be contained, to the best of the registrant’s knowledge, in definitive proxy or information statements incorporated by reference in Part III of this Form 10-K or any amendment to this Form 10-K. S
Indicate by check mark whether the registrant is a large accelerated filer, an accelerated filer, a non-accelerated filer or a smaller reporting company. See the definitions of “large accelerated filer,” “accelerated filer” and “smaller reporting company” in Rule 12b-2 of the Exchange Act. (Check one):
Large accelerated filer ☐ | Accelerated filer S |
Non-accelerated filer ☐ | Smaller reporting company ☐ |
Indicate by check mark whether the registrant is a shell company (as defined in Rule 12b-2 of the Exchange Act). Yes ☐ No S
The aggregate market value of the shares of common stock of the registrant held by nonaffiliates of the registrant as of March 9, 2016, was approximately $93,638,100 (based upon the assumption that directors and executive officers are the only affiliates).
As of November 9, 2016, there were 28,971,670 shares of the registrant’s common stock outstanding.
DOCUMENTS INCORPORATED BY REFERENCE
Portions of the following document are incorporated by reference into the designated parts of this Form 10-K:
Definitive Proxy Statement relating to 2017 annual meeting of shareholders (in Part III)
1
Luby’s, Inc.
Form 10-K
Year ended August 31, 2016
Table of Contents
Page | ||
2
Additional Information
We file reports with the Securities and Exchange Commission (“SEC”), including annual reports on Form 10-K, quarterly reports on Form 10-Q, and current reports on Form 8-K. The public may read and copy any materials we file with the SEC at the SEC’s Public Reference Room at 100 F Street, N.E., Washington, D.C. 20549. The public may obtain information on the operation of the Public Reference Room by calling the SEC at 1-800-SEC-0330. We are an electronic filer, and the SEC maintains an Internet site at http://www.sec.gov that contains the reports, proxy and information statements, and other information that we file electronically. Our website address is www.lubysinc.com. Please note that our website address is provided as an inactive textual reference only. We make available free of charge through our website the annual report on Form 10-K, quarterly reports on Form 10-Q, current reports on Form 8-K, and all amendments to those reports as soon as reasonably practicable after such material is electronically filed with or furnished to the SEC. The information provided on our website is not part of this report, and is therefore not incorporated by reference unless such information is specifically referenced elsewhere in this report.
Compliance with New York Stock Exchange Requirements
We submitted to the New York Stock Exchange (“NYSE”) the CEO certification required by Section 303A.12(a) of the NYSE’s Listed Company Manual with respect to our fiscal year ended August 26, 2015. We expect to submit the CEO certification with respect to our fiscal year ended August 31, 2016 to the NYSE within 30 days after our annual meeting of shareholders. We are filing as an exhibit to this Form 10-K the certifications required by Section 302 of the Sarbanes-Oxley Act of 2002.
3
FORWARD-LOOKING STATEMENTS
This Annual Report on (this "Form 10-K”) contains statements that are “forward-looking statements” within the meaning of Section 27A of the Securities Act of 1933, as amended, and Section 21E of the Securities Exchange Act of 1934, as amended. All statements contained in this Form 10-K, other than statements of historical facts, are “forward-looking statements” for purposes of these provisions, including any statements regarding:
• | future operating results; |
• | future capital expenditures, including expected reductions in capital expenditures; |
• | future debt, including liquidity and the sources and availability of funds related to debt; |
• | plans for our new prototype restaurants; |
• | plans for expansion of our business; |
• | scheduled openings of new units; |
• | closing existing units; |
• | effectiveness of management’s disposal plans; |
• | future sales of assets and the gains or losses that may be recognized as a result of any such sales; and |
• | continued compliance with the terms of our 2016 Credit Agreement. |
In some cases, investors can identify these statements by forward-looking words such as “anticipate,” “believe,” “could,” “estimate,” “expect,” “intend,” “outlook,” “may” “should,” “will,” and “would” or similar words. Forward-looking statements are based on certain assumptions and analyses made by management in light of their experience and perception of historical trends, current conditions, expected future developments and other factors we believe are relevant. Although management believes that our assumptions are reasonable based on information currently available, those assumptions are subject to significant risks and uncertainties, many of which are outside of our control. The following factors, as well as the factors set forth in Item 1A of this Form 10-K and any other cautionary language in this Form 10-K, provide examples of risks, uncertainties, and events that may cause our financial and operational results to differ materially from the expectations described in our forward-looking statements:
• | general business and economic conditions; |
• | the impact of competition; |
• | our operating initiatives, changes in promotional, couponing and advertising strategies and the success of management’s business plans; |
• | fluctuations in the costs of commodities, including beef, poultry, seafood, dairy, cheese, oils and produce; |
• | ability to raise menu prices and customers acceptance of changes in menu items; |
• | increases in utility costs, including the costs of natural gas and other energy supplies; |
• | changes in the availability and cost of labor, including the ability to attract qualified managers and team members; |
• | the seasonality of the business; |
• | collectability of accounts receivable; |
• | changes in governmental regulations, including changes in minimum wages and healthcare benefit regulation; |
• | the effects of inflation and changes in our customers’ disposable income, spending trends and habits; |
• | the ability to realize property values; |
• | the availability and cost of credit; |
• | weather conditions in the regions in which our restaurants operate; |
• | costs relating to legal proceedings; |
• | impact of adoption of new accounting standards; |
• | effects of actual or threatened future terrorist attacks in the United States; |
• | unfavorable publicity relating to operations, including publicity concerning food quality, illness or other health concerns or labor relations; and |
• | the continued service of key management personnel. |
Each forward-looking statement speaks only as of the date of this Form 10-K, and we undertake no obligation to publicly update or revise any forward-looking statements, whether as a result of new information, future events or otherwise. Investors should be aware that the occurrence of the events described above and elsewhere in this Form 10-K could have material adverse effect on our business, results of operations, cash flows, and financial condition.
4
PART I
Item 1. Business
Overview
Luby’s, Inc. is a multi-branded company operating in the restaurant industry and in the contract food services industry. Our primary brands include Luby’s Cafeteria, Fuddruckers - World’s Greatest Hamburgers® and Luby’s Culinary Contract Services. Other brands we operate include Cheeseburger in Paradise and Bob Luby’s Seafood.
In this Form 10-K, unless otherwise specified, “Luby’s,” “we,” “our,” “us” and “Company” refer to Luby’s, Inc., Luby's Fuddruckers Restaurants, LLC, a Texas Limited Liability Company ("LFR") and the consolidated subsidiaries of Luby’s, Inc. References to “Luby’s Cafeteria” refer specifically to the Luby’s Cafeteria brand restaurant.
Our Company’s vision is that our guests, employees and shareholders are extremely loyal to our restaurant brands and value them as a significant part of their lives. We want our company’s performance to make it a leader wherever it operates and in its sector of our industry.
We are headquartered in Houston, Texas. Our corporate headquarters is located at 13111 Northwest Freeway, Suite 600, Houston, Texas 77040, and our telephone number at that address is (713) 329-6800. Our website is www.lubysinc.com. The information on our website is not, and shall not be deemed to be, a part of this annual report on Form 10-K or incorporated into any of our other filings with the SEC.
As of November 9, 2016, we operated 174 restaurants located throughout the United States, as set forth in the table below. These establishments are located in close proximity to retail centers, business developments and residential areas. Of the 174
restaurants, 91 are located on property that we own and 83 are located on property that we lease. Six locations consist of a side-by-side Luby’s Cafeteria and Fuddruckers restaurant, to which we refer herein as a “Combo location”.
Total | ||
Texas: | ||
Houston Metro | 54 | |
San Antonio Metro | 17 | |
Rio Grande Valley | 13 | |
Dallas/Fort Worth Metro | 14 | |
Austin | 9 | |
Other Texas Markets | 19 | |
California | 10 | |
Maryland | 5 | |
Arizona | 5 | |
Illinois | 4 | |
Virginia | 4 | |
Georgia | 3 | |
Indiana | 2 | |
Mississippi | 2 | |
Wisconsin | 2 | |
Other States | 11 | |
Total | 174 | |
As of November 9, 2016, we operated 23 locations through our Culinary Contract Services (“CCS”). Of the 23 locations, 16 are in Texas: 14 are in Houston, 1 is in Dallas, and 1 is in San Antonio. For the remaining 7 CCS locations, we operate 1 location in each of the following states: Florida, Georgia, Louisiana, Massachusetts, Missouri, North Carolina, and Oklahoma. CCS provides food service management to healthcare and corporate dining facilities.
5
As of November 9, 2016, we had 48 franchisees operating 111 Fuddruckers restaurants in locations as set forth in the table below. Our largest five franchisees own five to 12 restaurants each. Seventeen franchise owners each own two to four restaurants. The twenty-six remaining franchise owners each own one restaurant.
Fuddruckers Franchises | ||
Texas: | ||
Dallas/Fort Worth Metro | 10 | |
Other Texas Markets | 10 | |
California | 7 | |
Connecticut | 1 | |
Florida | 8 | |
Georgia | 2 | |
Iowa | 1 | |
Louisiana | 3 | |
Maine | 1 | |
Maryland | 2 | |
Massachusetts | 4 | |
Michigan | 4 | |
Missouri | 3 | |
Montana | 5 | |
Nebraska | 1 | |
Nevada | 2 | |
New Jersey | 2 | |
New Mexico | 4 | |
North Carolina | 2 | |
North Dakota | 2 | |
Oklahoma | 1 | |
Oregon | 1 | |
Pennsylvania | 4 | |
South Carolina | 7 | |
South Dakota | 2 | |
Tennessee | 3 | |
Virginia | 3 | |
Wisconsin | 1 | |
International: | ||
Canada | 1 | |
Colombia | 3 | |
Dominican Republic | 2 | |
Italy | 4 | |
Mexico | 2 | |
Panama | 2 | |
Puerto Rico | 1 | |
Total | 111 | |
In November 1997, a prior owner of the Fuddruckers - World’s Greatest Hamburgers® brand granted to a licensee the exclusive right to use the Fuddruckers proprietary marks, trade dress, and system to develop Fuddruckers restaurants in a territory consisting of certain countries in Africa, the Middle East, and parts of Asia. As of November 9, 2016, this licensee operates 34 restaurants that are licensed to use the Fuddruckers proprietary marks in Saudi Arabia, Egypt, Lebanon, United Arab Emirates, Qatar, Jordan, Bahrain, Kuwait, Morocco, and Malaysia. The Company does not receive revenue or royalties from these restaurants.
6
For additional information regarding our restaurant locations, please read “Properties” in Item 2 of Part I of this report.
Luby’s, Inc. (formerly, Luby’s Cafeterias, Inc.) was founded in 1947 in San Antonio, Texas. The Company was originally incorporated in Texas in 1959, with nine cafeterias in various locations, under the name Cafeterias, Inc. It became a publicly held corporation in 1973, and became listed on the NYSE in 1982.
Luby’s, Inc. was reincorporated in Delaware on December 31, 1991 and was restructured into a holding company on February 1, 1997, at which time all of the operating assets were transferred to Luby’s Restaurants Limited Partnership, a Texas limited partnership composed of two wholly owned, indirect subsidiaries. On July 9, 2010, Luby’s Restaurants Limited Partnership was converted into LFR. All restaurant operations are conducted by LFR.
On July 26, 2010, we, through our subsidiary, LFR, completed the acquisition of substantially all of the assets of Fuddruckers, Inc., Magic Brands, LLC and certain of their affiliates (collectively, “Fuddruckers”) for approximately $63.1 million in cash. LFR also assumed certain of Fuddruckers’ obligations, real estate leases and contracts. Upon the completion of the acquisition, LFR became the owner and operator of 56 Fuddruckers locations and three Koo Koo Roo Chicken Bistro (“Koo Koo Roo”) locations with franchisees operating an additional 130 Fuddruckers locations.
On December 6, 2012, we completed the acquisition of all of the Membership Units of Paradise Restaurant Group, LLC and certain of their affiliates, collectively known as Cheeseburger in Paradise, for approximately $10.3 million in cash plus customary working capital adjustments. We assumed certain of Cheeseburger in Paradise obligations, real estate leases and contracts and became the owners of 23 full service Cheeseburger in Paradise restaurants located in 14 states.
On August 27, 2014, the Company completed an internal restructuring of certain affiliates of the Luby’s Cafeteria business, whereby these companies were merged with and into LFR, as the successor. The principal purpose of these events was to simplify the Luby’s corporate structure. Following these events, the Company’s restaurant operations continue to be conducted by LFR and Paradise Cheeseburger, LLC. Our operating restaurant locations remain unchanged by these events.
Luby’s Cafeteria Operations
At Luby’s Cafeterias, our mission is to serve our guests convenient, great tasting meals in a friendly environment that makes everyone feel welcome and at home. We do things The Luby’s Way, which means we cook to order from scratch using real food, real ingredients prepared fresh daily, and our employees and our company get involved and support the fabric of our local communities. We buy local produce as much as possible. We promise to breathe life into the experience of dining out and make every meal meaningful. We were founded in San Antonio, Texas in 1947.
Our cafeteria food delivery model allows customers to select freshly-prepared items from our serving line including entrées, vegetables, salads, desserts, breads and beverages before transporting their selected items on serving trays to a table or booth of their choice in the dining area. Each restaurant offers 15 to 22 entrées, 12 to 14 vegetable dishes, 8 to 10 salads, and 10 to 12 varieties of desserts daily.
Luby’s Cafeteria’s product offerings are Americana-themed home-style classic made-from-scratch favorites priced to appeal to a broad range of customers, including those customers that focus on fast wholesome choices, quality, variety and affordability. We have had particular success among families with children, shoppers, travelers, seniors, and business people looking for a quick, freshly prepared meal at a fair price. All of our restaurants sell food-to-go orders which comprise approximately 13% of our Luby's Cafeteria restaurant sales.
Menus are reviewed periodically and new offerings and seasonal food preferences are regularly incorporated. Each restaurant is operated as a separate unit under the control of a general manager who has responsibility for day-to-day operations, including food production and personnel employment and supervision. Restaurants generally have a staff of one general manager, one associate manager and one to two assistant managers including wait staff. We grant authority to our restaurant managers to direct the daily operations of their stores and, in turn, we compensate them on the basis of their performance. We believe this strategy is a significant factor contributing to the profitability of our restaurants. Each general manager is supervised by an area leader. Each area leader is responsible for approximately 7 to 10 units, depending on location.
The number of Luby’s restaurants, which includes one Bob Luby’s Seafood restaurant, was 92 at fiscal year-end 2016.
7
New Luby’s Restaurants
In 2007, we developed and opened an updated prototype ground-up new construction Luby's Cafeteria. Since then we have rebuilt three locations and newly developed four locations according to this prototype.
In 2012, we opened a prototype ground-up new construction combination Luby’s and Fuddruckers restaurant location featuring a Luby’s Cafeteria and a Fuddruckers Restaurant on the same property with a common wall but separate kitchens and dining areas (“Combo location”). Since 2012, we built five more Combo locations; four in fiscal year 2014; and one in fiscal year 2015.
We anticipate using and further modifying both of these prototype designs as we execute our strategy to build new restaurants in markets where we believe we can achieve superior restaurant cash flows.
Fuddruckers
At Fuddruckers, our mission is to serve the World’s Greatest Hamburgers® using only 100% fresh, never frozen, all American premium beef, buns baked daily in our kitchens, and the freshest, highest quality ingredients on our “you top it” produce bar. With a focus on excellent food, attentive guest service and an inviting atmosphere, we are committed to making every guest happy, one burger at a time! Fuddruckers restaurants feature casual, welcoming dining areas where Americana-themed décor is featured. Fuddruckers was founded in San Antonio, Texas in 1980.
While Fuddruckers’ signature burger and fries accounts for the majority of its restaurant sales, its menu also includes exotic burgers, such as buffalo and elk, steak sandwiches, various grilled and breaded chicken breast sandwiches, hot dogs, a variety of salads, chicken tenders, fish sandwiches, hand breaded onion rings, soft drinks, handmade milkshakes, and bakery items. A variety of over 100 carbonated soft drinks, Powerade®, and flavored waters are offered through Coke Freestyle®self-service dispensers. Additionally, beer and wine are served and, generally, account for less than 2% of restaurant sales. Food-to-go sales comprise approximately 8% of Fuddruckers restaurant sales.
Restaurants generally have one general manager with two or three assistant managers and a number of full-time and part-time associates working in overlapping shifts. Since Fuddruckers generally utilizes a self-service concept, similar to fast casual, it typically does not employ waiters or waitresses. Fuddruckers restaurant operations are currently divided into a total of ten areas, each supervised by an area leader. On average, each area leader supervises five to nine restaurants.
In fiscal year 2016, we opened three new Fuddruckers restaurants and closed three Fuddruckers restaurants. The number of Fuddruckers restaurants was 75 at fiscal year-end 2016.
Cheeseburger in Paradise
Cheeseburger in Paradise is known for its inviting beach-party atmosphere, its big, juicy burgers, salads, coastal fare, and other tasty and unique items. Cheeseburger in Paradise is a full-service island-themed restaurant and bar developed ten years ago in collaboration with legendary entertainer Jimmy Buffet based on one of his most popular songs. The restaurants also feature a unique tropical-themed island bar with many televisions and tasty “boat drinks.” As of our fiscal year-end 2016, we operated eight of the original Cheeseburger in Paradise locations.
Culinary Contract Services
Our Culinary Contract Services segment consists of a business line servicing healthcare, higher education and corporate dining clients. The healthcare accounts are full service and typically include in-room delivery, catering, vending, coffee service and retail dining. Our mission is to re-define the contract food industry by providing tasty and healthy menus with customized solutions for healthcare, senior living, business and industry and higher education facilities. We seek to provide the quality of a restaurant dining experience in an institutional setting. At of fiscal year-end 2016, we had contracts with 15 long-term acute care hospitals, three acute care hospitals, two business and industry clients, one children's hospital, one behavioral hospital, one medical office building, and one freestanding coffee venue located inside an office building. We have the unique ability to deliver quality services that include facility design and procurement as well as nutrition and branded food services to our clients.
8
Franchising
Fuddruckers offers franchises in markets where it deems expansion to be advantageous to the development of the Fuddruckers concept and system of restaurants. A standard franchise agreement generally has an initial term of 20 years. Franchise agreements typically grant franchisees an exclusive territorial license to operate a single restaurant within a specified area, usually a four-mile radius surrounding the franchised restaurant. Luby’s management will continue developing its relationships with our franchisees over the coming years and beyond.
Franchisees bear all direct costs involved in the development, construction and operation of their restaurants. In exchange for a franchise fee, we provide franchise assistance in the following areas: site selection, prototypical architectural plans, interior and exterior design and layout, training, marketing and sales techniques, assistance by a Fuddruckers “opening team” at the time a franchised restaurant opens, and operations and accounting guidelines set forth in various policies and procedures manuals.
All franchisees are required to operate their restaurants in accordance with Fuddruckers standards and specifications, including controls over menu items, food quality and preparation. We require the successful completion of our training program by a minimum of three managers for each franchised restaurant. In addition, franchised restaurants are evaluated regularly for compliance with franchise agreements, including standards and specifications through the use of periodic, unannounced on-site inspections, and standards evaluation reports.
The number of franchised restaurants was 113 at fiscal year-end 2016 and 106 at fiscal year-end 2015.
For additional information regarding our business segments, please read Notes 1 and 2 to the consolidated financial statements included in Part II, Item 8 of this Form 10-K.
Strategic Focus
Our strategic focus is to generate consistent and sustainable same-store sales growth and improved store level profit. We want our company’s performance to make it a leader wherever it operates and in its sector of our industry. We strive to provide attractive returns on shareholder capital. From an operating standpoint, we support this strategic focus through the following:
1. | Consistently successful execution: Every day, with every guest, at every restaurant we operate. |
2. | Growing our human capital: Our team members are the most critical factor in ensuring our Company’s success. Our relentless focus as a company must be inspiring and developing our team members to delight our guests. |
3. | Raising awareness of our brand: Our restaurants provide guests in our local communities with memories of family, friends, childhood, a great date, a memorable birthday, or a significant accomplishment. The most reliable ways to grow and sustain our business is to perpetuate word of mouth and remain involved in the community. We must share our story with our guests in our restaurants. This allows new guests to learn our brand story and also reaffirms it with legacy and loyal guests. Loyal guests spread and preach the word about our brand. Our most loyal guests typically agree to be in our E-club and download our app so we can communicate with them and reward them. |
4. | Improving restaurant appearances: We recognize the importance of remodeling our legacy restaurants to remain relevant and appealing to keep loyal guests coming back and draw new ones in, and to convert occasional guests into loyal fans who give us free word-of-mouth advertising and ultimately to increase sales and profitability. |
We remain focused on the key drivers of our businesses to achieve operational excellence of our brands and to efficiently manage costs to grow profitability and enhance shareholder value.
9
Intellectual Property
Luby’s, Inc. owns or is licensed to use valuable intellectual property including trademarks, service marks, patents, copyrights, trade secrets and other proprietary information, including the Luby’s and Fuddruckers logos, trade names and trademarks, which are of material importance to our business. Depending on the jurisdiction, trademarks, and service marks generally are valid as long as they are used and/or registered. Patents, copyrights, and licenses are of varying durations. The success of our business depends on the continued ability to use existing trademarks, service marks, and other components of our brands in order to increase brand awareness and further develop branded products. We take prudent actions to protect our intellectual property.
Employees
As of November 9, 2016, we had an active workforce of 7,988 employees consisting of restaurant management employees, non-management restaurants employees, CCS management employees, CCS non-management employees, and office and facility service employees. Employee relations are considered to be good. We have never had a strike or work stoppage, and we are not subject to collective bargaining agreements.
Item 1A. Risk Factors
An investment in our common stock involves a high degree of risk. Investors should consider carefully the risks and uncertainties described below, and all other information included in this Form 10-K, before deciding whether to invest in our common stock. Additional risks and uncertainties not currently known to us or that we currently deem immaterial may also become important factors that may harm our business, financial condition or results of operations. The occurrence of any of the following risks could harm our business, financial condition, and results of operations. The trading price of our common stock could decline due to any of these risks and uncertainties, and investors may lose part or all of their investment.
General economic factors may adversely affect our results of operations.
The impact of inflation on food, labor and other aspects of our business can adversely affect our results of operations. Commodity inflation in food, beverages, and utilities can also impact our financial performance. Although we attempt to offset the effects of inflation through periodic menu price increases, cost controls, and incremental improvement in operating margins, we may not be able to completely eliminate such effects, which could adversely affect our results of operations.
Our ability to service our debt obligations is primarily dependent upon our future financial performance.
As of August 31, 2016, we had shareholders’ equity of approximately $166 million compared to approximately:
• | $37.0 million of long-term debt; |
• | $76.7 million of minimum operating and capital lease commitments; and |
• | $1.3 million of standby letters of credit. |
Our ability to meet our debt service obligations depends on our ability to generate positive cash flows from operations and proceeds for assets held for sale.
If we are unable to service our debt obligations, we may have to:
• | delay spending on maintenance projects and other capital projects, including new restaurant development; |
• | sell assets; |
• | restructure or refinance our debt; or |
• | sell equity securities. |
Our debt, and the covenants contained in the instruments governing our debt, could:
• | result in a reduction of our credit rating, which would make it more difficult for us to obtain additional financing on acceptable terms; |
• | require us to dedicate a substantial portion of our cash flows from operating activities to the repayment of our debt and the interest associated with our debt; |
• | limit our operating flexibility due to financial and other restrictive covenants, including restrictions on incurring additional debt and creating liens on our properties; |
10
• | place us at a competitive disadvantage compared with our competitors that have relatively less debt; |
• | expose us to interest rate risk because certain of our borrowings are at variable rates of interest; and |
• | make us more vulnerable to downturns in our business. |
If we are unable to service our debt obligations, we may not be able to sell equity securities, sell additional assets, or restructure or refinance our debt. Our ability to generate sufficient cash flow from operating activities to pay the principal of and interest on our indebtedness is subject to market conditions and other factors which are beyond our control.
We face the risk of adverse publicity and litigation, which could have a material adverse effect on our business and financial performance.
We may from, time to time, be the subject of complaints or litigation from customers alleging illness, injury or other food quality, health or operational concerns. Unfavorable publicity relating to one or more of our restaurants or to the restaurant industry in general may taint public perception of the Luby’s Cafeteria and Fuddruckers brands. Multi-unit restaurant businesses can be adversely affected by publicity resulting from poor food quality, illness, or other health concerns or operating issues stemming from one or a limited number of restaurants. Publicity resulting from these allegations may materially adversely affect our business and financial performance, regardless of whether the allegations are valid or whether we are liable. In addition, we are subject to employee claims alleging injuries, wage and hour violations, discrimination, harassment or wrongful termination. In recent years, a number of restaurant companies have been subject to lawsuits, including class action lawsuits, alleging violations of federal and state law regarding workplace, employment, and similar matters. A number of these lawsuits have resulted in the payment of substantial damages by the defendants. Regardless of whether any claims against us are valid or whether we are ultimately determined to be liable, claims may be expensive to defend, and may divert time and money away from our operations and hurt our financial performance. A judgment significantly in excess of our insurance coverage, if any, for any claims could materially adversely affect our financial condition or results of operations.
We are subject to risks related to the provision of employee healthcare benefits, worker’s compensation and employee injury claims.
Health insurance coverage is provided through fully-insured contracts with insurance carriers. Insurance premiums are a shared cost between the Company and covered employees. The liability for covered health claims is borne by the insurance carriers per the terms of each policy contract.
Workers’ compensation coverage is provided through “self-insurance” by LFR. We record expenses under the plan based on estimates of the costs of expected claims, administrative costs, stop-loss insurance premiums, and expected trends. These estimates are then adjusted each year to reflect actual costs incurred. Actual costs under these plans are subject to variability that is dependent upon demographics and the actual costs of claims made. In the event our cost estimates differ from actual costs, we could incur additional unplanned costs, which could adversely impact our financial condition.
In March 2010, comprehensive healthcare reform legislation under the Patient Protection and Affordable Care Act (the "Affordable Care Act") and Healthcare Education and Affordability Reconciliation Act was passed and signed into law. Among other things, the healthcare reform legislation includes mandated coverage requirements, eliminates pre-existing condition exclusions and annual and lifetime maximum limits, restricts the extent to which policies can be rescinded, and imposes new and significant taxes on health insurers and healthcare benefits. Although requirements were phased in over a period of time, the most impactful provisions began in the third quarter of fiscal 2015.
Due to the breadth and complexity of the healthcare reform legislation, the lack of implementing regulations in some cases, and interpretive guidance, and the phased-in nature of the implementation, it is difficult to predict the overall impact of the healthcare reform legislation on our business and the businesses of our franchisees over the coming years. Possible adverse effects of the healthcare reform legislation include reduced revenues, increased costs and exposure to expanded liability and requirements for us to revise the ways in which we conduct business or risk of loss of business. It is also possible that healthcare plans offered by other companies with which we compete for employees will make us less attractive to our current or potential employees. And in any event, implementing the requirements of the Affordable Care Act has imposed some additional administrative costs on us, and those costs may increase over time. In addition, our results of operations, financial position and cash flows could be materially adversely affected. Our franchisees face the potential of similar adverse effects, and many of them are small business owners who may have significant difficulty absorbing the increased costs.
11
We face intense competition, and if we are unable to compete effectively or if customer preferences change, our business, financial condition and results of operations may be adversely affected.
The restaurant industry is intensely competitive and is affected by changes in customer tastes and dietary habits and by national, regional and local economic conditions and demographic trends. New menu items, concepts, and trends are constantly emerging. Our Luby’s Cafeteria and Fuddruckers brands offer a large variety of entrées, side dishes and desserts and our continued success depends, in part, on the popularity of our cuisine and cafeteria-style dining. A change away from this cuisine or dining style could have a material adverse effect on our results of operations. Changing customer preferences, tastes and dietary habits can adversely affect our business and financial performance. We compete on quality, variety, value, service, concept, price, and location with well-established national and regional chains, as well as with locally owned and operated restaurants. We face significant competition from family-style restaurants, fast-casual restaurants, and buffets as well as fast food restaurants. In addition, we also face growing competition as a result of the trend toward convergence in grocery, delicatessen, and restaurant services, particularly in the supermarket industry, which offers “convenient meals” in the form of improved entrées and side dishes from the delicatessen section. Many of our competitors have significantly greater financial resources than we do. We also compete with other restaurants and retail establishments for restaurant sites and personnel. We anticipate that intense competition will continue. If we are unable to compete effectively, our business, financial condition, and results of operations may be adversely affected.
Our growth plan may not be successful.
Depending on future economic conditions, we may not be able to open new restaurants in current or future fiscal years. Our ability to open and profitably operate new restaurants is subject to various risks such as the identification and availability of suitable and economically viable locations, the negotiation of acceptable terms for the purchase or lease of new locations, the need to obtain all required governmental permits (including zoning approvals) on a timely basis, the need to comply with other regulatory requirements, the availability of necessary contractors and subcontractors, the availability of construction materials and labor, the ability to meet construction schedules and budgets, the ability to manage union activities such as picketing or hand billing which could delay construction, increases in labor and building materials costs, the availability of financing at acceptable rates and terms, changes in weather or other acts of God that could result in construction delays and adversely affect the results of one or more restaurants for an indeterminate amount of time, our ability to hire and train qualified management personnel and general economic and business conditions. At each potential location, we compete with other restaurants and retail businesses for desirable development sites, construction contractors, management personnel, hourly employees and other resources.
If we are unable to successfully manage these risks, we could face increased costs and lower than anticipated revenues and earnings in future periods. We may be evaluating acquisitions or engaging in acquisition negotiations at any given time. We cannot be sure that we will be able to continue to identify acquisition candidates on commercially reasonable terms or at all. If we make additional acquisitions, we also cannot be sure that any benefits anticipated from the acquisition will actually be realized. Likewise, we cannot be sure that we will be able to obtain necessary financing for acquisitions. Such financing could be restricted by the terms of our debt agreements or it could be more expensive than our current debt. The amount of such debt financing for acquisitions could be significant and the terms of such debt instruments could be more restrictive than our current covenants. In addition, a prolonged economic downturn would adversely affect our ability to open new stores or upgrade existing units and we may not be able to maintain the existing number of restaurants in future fiscal years. We may not be able to renew existing leases and various other risks could cause a decline in the number of restaurants in future fiscal years, which could adversely affect our results of operations.
Non-performance under the debt covenants in our revolving credit facility could adversely affect our ability to respond to changes in our business.
On November 8, 2016, we refinanced our outstanding long-term debt of $37.0 million with a new senior secured $65.0 million credit agreement which includes a $35.0 million five-year term loan and an up to $30.0 million bank revolver. At the time of the refinancing, our long term debt balance was $42.0 million, of which $7.0 million was outstanding on our new bank revolver. Our debt covenants require certain minimum levels of financial performance as well as certain financial ratios. Our failure to comply with these covenants could result in an event of default that, if not cured or waived, could result in the acceleration of our loans outstanding and affect our ability to refinance by the termination date of November 8, 2021. For a more detailed discussion of our credit agreement please review the footnotes to our financial statements located in Part II, Item 8 of this Form 10-K.
12
Regional events can adversely affect our financial performance.
Many of our restaurants and franchises are located in Texas, California and in the northern United States. Our results of operations may be adversely affected by economic conditions in Texas, California or the northern United States or the occurrence of an event of terrorism or natural disaster in any of the communities in which we operate. Also, given our geographic concentration, negative publicity relating to our restaurants could have a pronounced adverse effect on our overall revenues. Although we generally maintain property and casualty insurance to protect against property damage caused by casualties and natural disasters, inclement weather, flooding, hurricanes, and other acts of God, these events can adversely impact our sales by discouraging potential customers from going out to eat or by rendering a restaurant or CCS location inoperable for a significant amount of time.
An increase in the minimum wage and regulatory mandates could adversely affect our financial performance.
From time to time, the U.S. Congress and state legislatures have increased and will consider increases in the minimum wage. The restaurant industry is intensely competitive, and if the minimum wage is increased, we may not be able to transfer all of the resulting increases in operating costs to our customers in the form of price increases. In addition, because our business is labor intensive, shortages in the labor pool or other inflationary pressure could increase labor costs that could adversely affect our results of operations.
We may be required to recognize additional impairment charges.
We assess our long-lived assets in accordance with generally accepted accounting principles in the United States (“GAAP”) and determine when they are impaired. Based on market conditions and operating results, we may be required to record additional impairment charges, which would reduce expected earnings for the periods in which they are recorded.
We may not be able to realize our deferred tax assets.
Our ability to realize our deferred tax assets is dependent on our ability to generate taxable income in the future. If we are unable to generate enough taxable income in the future, we may be required to adjust our valuation allowance related to our remaining net deferred tax assets which would reduce expected earnings for the periods in which they are recorded.
We may be harmed by security risks we face in connection with our electronic processing and transmission of confidential customer and employee information.
We accept electronic payment cards for payment in our restaurants. During fiscal 2016, approximately 73% of our restaurant sales were attributable to credit and debit card transactions, and credit and debit card usage could continue to increase. A number of retailers have experienced actual or potential security breaches in which credit and debit card information may have been stolen, including a number of highly publicized incidents with well-known retailers in recent years.
We may in the future become subject to additional claims for purportedly fraudulent transactions arising out of the actual or alleged theft of credit or debit card information, and we may also be subject to lawsuits or other proceedings in the future relating to these types of incidents. Proceedings related to theft of credit or debit card information may be brought by payment card providers, banks and credit unions that issue cards, cardholders (either individually or as part of a class action lawsuit) and federal and state regulators. Any such proceedings could distract our management from running our business and cause us to incur significant unplanned losses and expenses. Consumer perception of our brand could also be negatively affected by these events, which could further adversely affect our results and prospects.
We also are required to collect and maintain personal information about our employees, and we collect information about customers as part of some of our marketing programs as well. The collection and use of such information is regulated at the federal and state levels, and the regulatory environment related to information security and privacy is increasingly demanding. At the same time, we are relying increasingly on cloud computing and other technologies that result in third parties holding significant amounts of customer or employee information on our behalf. If the security and information systems of ours or of outsourced third party providers we use to store or process such information are compromised or if we, or such third parties, otherwise fail to comply with these laws and regulations, we could face litigation and the imposition of penalties that could adversely affect our financial performance. Our reputation as a brand or as an employer could also be adversely affected from these types of security breaches or regulatory violations, which could impair our sales or ability to attract and keep qualified employees.
13
Labor shortages or increases in labor costs could adversely affect our business and results of operations and the pace of new restaurant openings.
Our success depends in part upon our ability to attract, motivate and retain a sufficient number of qualified employees, including regional managers, restaurant general managers and chefs, in a manner consistent with our standards and expectations. Qualified individuals that we need to fill these positions are in short supply and competition for these employees is intense. If we are unable to recruit and retain sufficient qualified individuals, our operations and reputation could be adversely affected. Additionally, competition for qualified employees could require us to pay higher wages, which could result in higher labor costs. Any increase in labor costs could adversely affect our results of operations.
If we are unable to anticipate and react to changes in food, utility and other costs, our results of operations could be materially adversely affected.
Many of the food and beverage products we purchase are affected by commodity pricing, and as such, are subject to price volatility caused by production problems, shortages, weather or other factors outside of our control. Our profitability depends, in part, on our successfully anticipating and reacting to changes in the prices of commodities. Therefore, we enter into purchase commitments with suppliers when we believe that it is advantageous for us to do so. If commodity prices were to increase, we may be forced to absorb the additional costs rather than transfer these increases to our customers in the form of menu price increases. Our success also depends, in part, on our ability to absorb increases in utility costs. Our operating results are affected by fluctuations in the price of utilities. Our inability to anticipate and respond effectively to an adverse change in any of these factors could have a material adverse effect on our results of operations.
Our business is subject to extensive federal, state and local laws and regulations.
The restaurant industry is subject to extensive federal, state and local laws and regulations. We are also subject to licensing and regulation by state and local authorities relating to health, healthcare, employee medical plans, sanitation, safety and fire standards, building codes and liquor licenses, federal and state laws governing our relationships with employees (including the Fair Labor Standards Act and applicable minimum wage requirements, overtime, unemployment tax rates, family leave, tip credits, working conditions, safety standards, healthcare and citizenship requirements), federal and state laws which prohibit discrimination, potential healthcare benefits legislative mandates, and other laws regulating the design and operation of facilities, such as the Americans With Disabilities Act of 1990.
As a publicly traded corporation, we are subject to various rules and regulations as mandated by the SEC and the NYSE. Failure to timely comply with these rules and regulations could result in penalties and negative publicity.
We are subject to federal regulation and certain state laws which govern the offer and sale of franchises. Many state franchise laws contain provisions that supersede the terms of franchise agreements, including provisions concerning the termination or non-renewal of a franchise. Some state franchise laws require that certain materials be registered before franchises can be offered or sold in that state. The failure to obtain or retain licenses or approvals to sell franchises could adversely affect us and the franchisees.
Termination of franchise agreements may disrupt restaurant performance.
Our franchise agreements are subject to termination by us in the event of default by the franchisee after applicable cure periods. Upon the expiration of the initial term of a franchise agreement, the franchisee generally has an option to renew the franchise agreement for an additional term. There is no assurance that franchisees will meet the criteria for renewal or will desire or be able to renew their franchise agreements. If not renewed, a franchise agreement, and payments required there under, will terminate. We may be unable to find a new franchisee to replace a non-renewing franchisee. Furthermore, while we will be entitled to terminate franchise agreements following a default that is not cured within the applicable grace period, if any, the disruption to the performance of the restaurants could adversely affect our business and revenues.
Franchisees may breach the terms of their franchise agreements in a manner that adversely affects the reputation of our brands.
Franchisees are required to conform to specified product quality standards and other requirements pursuant to their franchise agreements in order to protect our brands and to optimize restaurant performance. However, franchisees may receive through the supply chain or produce sub-standard food or beverage products, which may adversely impact the reputation of our brands. Franchisees may also breach the standards set forth in their respective franchise agreements. Any negative actions could have a corresponding material adverse effect on our business and revenues.
14
We might not fully realize the benefits from the acquisition of Cheeseburger in Paradise.
On December 6, 2012, we completed the acquisition of all the Membership Units of Paradise Restaurants Group, LLC and certain of their affiliates, collectively known as Cheeseburger in Paradise. The integration of the 23 Cheeseburger in Paradise restaurants into our operations presented significant difficulties and did not result in realization of the full benefits of synergies, cost savings and operational efficiencies that we expected. We closed 15 locations in fiscal 2014. We converted several closed Cheeseburger in Paradise locations to Fuddruckers and continue to consider this as an alternative for remaining closed locations. As of November 9, 2016 we continue to operate 8 locations as Cheeseburger in Paradise restaurants.
Our planned CCS expansion may not be successful.
Successful expansion of our CCS operations depends on our ability to obtain new clients as well as retain and renew our existing client contracts. Our ability to do so generally depends on a variety of factors, including the quality, price and responsiveness of our services, as well as our ability to market these services effectively and differentiate ourselves from our competitors. We may not be able to renew existing client contracts at the same or higher rates or our current clients may turn to competitors, cease operations, or elect to self-operate or terminate contracts with us. The failure to renew a significant number of our existing contracts could have a material adverse effect on our business and results of operations.
Failure to collect account receivables could adversely affect our results of operations.
A portion of our accounts receivable is concentrated in our CCS operations among several customers. In addition, our franchises generate significant accounts receivables. Failure to collect from several of these accounts receivable could adversely affect our results of operations.
If we lose the services of any of our key management personnel, our business could suffer.
The success of our business is highly dependent upon our key management personnel, particularly Christopher J. Pappas, our President and Chief Executive Officer, and Peter Tropoli, our Chief Operating Officer. The loss of the services of any key management personnel could have a material adverse effect upon our business.
Our business is subject to seasonal fluctuations, and, as a result, our results of operations for any given quarter may not be indicative of the results that may be achieved for the full fiscal year.
Our business is subject to seasonal fluctuations. Historically, our highest earnings have occurred in the third quarter of the fiscal year, as our revenues in most of our restaurants have typically been higher during the third quarter of the fiscal year. Similarly, our results of operations for any single quarter will not necessarily be indicative of the results that may be achieved for a full fiscal year.
Economic factors affecting financial institutions could affect our access to capital.
We refinanced our 2013 Credit Facility on November 8, 2016 to a new senior secured credit agreement and it matures on November 8, 2021. We may not be able to amend or renew the new facility with terms and conditions favorable to our operating needs.
We may not be able to adequately protect our intellectual property, which could harm the value of our brands and adversely affect our business.
Our ability to successfully implement our business plan depends in part on our ability to further build brand recognition using our trademarks, service marks, trade dress and other proprietary intellectual property, including our name and logos, and the unique ambience of our restaurants. If our efforts to protect our intellectual property are inadequate, or if any third party misappropriates or infringes on our intellectual property, either in print or on the internet, the value of our brands may be harmed, which could have a material adverse effect on our business and might prevent our brands from achieving or maintaining market acceptance. We may also encounter claims from prior users of similar intellectual property in areas where we operate or intend to conduct operations. This could harm our image, brand or competitive position and cause us to incur significant penalties and costs.
Item 1B. Unresolved Staff Comments
None.
15
Item 2. Properties
As of November 9, 2016, we operated 174 restaurants at 168 property locations, including one Fuddruckers restaurant that is temporarily closed for renovation. Six of the operating locations are Combo locations and are considered two restaurants. Two operating locations are primarily Luby’s Cafeterias, but also serve Fuddruckers hamburgers. One operating location is a Bob Luby’s Seafood Grill. Luby’s Cafeterias have seating capacity for 250 to 300 customers at each location while Fuddruckers locations generally seat 125 to 200 customers and Cheeseburger in Paradise locations generally seat 180 to 220.
We own the underlying land and buildings on which 69 of our Luby’s Cafeteria and 22 of our Fuddruckers restaurants are located. Five of these restaurant properties contain excess building space or an extra building on the property which have 10 tenants unaffiliated with Luby’s, Inc.
In addition to the owned locations, 23 Luby’s Cafeteria restaurants, 52 Fuddruckers restaurants, and 8 Cheeseburger in Paradise restaurants are held under 82 leases. The majority of the leases are fixed-dollar rentals, which require us to pay additional amounts related to property taxes, hazard insurance, and maintenance of common areas. Of the 82 restaurant leases, the current terms of eight expire in less than one year, 47 expire between one and five years, and 27 expire thereafter. Additionally, 67 leases can be extended beyond their current terms at our option. One of the leased properties has extra building space and currently has one tenant that offsets approximately $79,745 of lease and other expenses annually.
As of November 9, 2016, we have two leased properties we plan to develop for future use.
As of November 9, 2016, we had five owned non-operating properties with a carrying value of approximately $6.0 million in continuing operations recorded in property held for sale. In addition, we had one owned property with a carrying value of approximately $1.9 million and we had one leased property with a carrying value of zero, that are included in assets related to discontinued operations.
We currently have one owned other-use property which is used as a bake shop supporting our operating restaurants.
We also have three leased locations that have two third party tenants and two Fuddruckers franchisees.
Our corporate office is located on the Northwest Freeway in Houston, Texas in close proximity to many of our Houston restaurant locations. We have approximately 31,000 square feet of office space under lease through December 31, 2016, however, we are currently negotiating a new 5-year lease with our current landlord which will reduce our office space to approximately 26,000 square feet. We expect to execute the new lease on or before December 31, 2016.
We also lease approximately 60,000 square feet of warehouse space for in-house repair, fabrication and storage in Houston, Texas. In addition, we lease approximately 3,200 square feet of warehouse and office space in Arlington, Texas and an executive suite in North Andover, MA where we have additional legal personnel.
We maintain general liability insurance and property damage insurance on all properties in amounts which management believes provide adequate coverage.
Item 3. Legal Proceedings
From time to time, we are subject to various private lawsuits, administrative proceedings and claims that arise in the ordinary course of our business. A number of these lawsuits, proceedings and claims may exist at any given time. These matters typically involve claims from guests, employees and others related to issues common to the restaurant industry. We currently believe that the final disposition of these types of lawsuits, proceedings and claims will not have a material adverse effect on our financial position, results of operations or liquidity. It is possible, however, that our future results of operations for a particular fiscal quarter or fiscal year could be impacted by changes in circumstances relating to lawsuits, proceedings or claims.
Item 4. Mine Safety Disclosures
Not applicable.
16
PART II
Item 5. Market for Registrant’s Common Equity, Related Stockholder Matters and Issuer Purchases of Equity Securities
Stock Prices
Our common stock is traded on the NYSE under the symbol “LUB.” The following table sets forth, for the last two fiscal years, the high and low sales prices on the NYSE as reported in the consolidated transaction reporting system.
Fiscal Quarter Ended | High | Low | ||||
November 19, 2014 | 5.58 | 4.75 | ||||
February 11, 2015 | 5.33 | 4.37 | ||||
May 6, 2015 | 5.93 | 4.78 | ||||
August 26, 2015 | 5.30 | 4.52 | ||||
December 16, 2015 | 5.21 | 4.26 | ||||
March 9, 2016 | 5.01 | 3.71 | ||||
June 1, 2016 | 5.10 | 4.61 | ||||
August 31, 2016 | 5.10 | 4.47 | ||||
As of November 9, 2016, there were 2,144 holders of record of our common stock. No cash dividends have been paid on our common stock since fiscal year 2000, and we currently have no intention to pay a cash dividend on our common stock. On November 9, 2016, the closing price of our common stock on the NYSE was $4.18
17
.
Equity Compensation Plans
Securities authorized under our equity compensation plans as of August 31, 2016, were as follows:
(a) | (b) | (c) | ||||||||
Plan Category | Number of Securities to be Issued Upon Exercise of Outstanding Options, Warrants and Rights | Weighted- Average Exercise Price of Outstanding Options, Warrants and Rights | Number of Securities Remaining Available for Future Issuance Under Equity Compensation Plans Excluding Securities Reflected in Column (a) | |||||||
Equity compensation plans previously approved by security holders | 656,868 | $ | 4.76 | 2,156,511 | ||||||
Equity compensation plans not previously approved by security holders (1) | 29,627 | 0 | 0 | |||||||
Total | 686,495 | $ | 4.60 | 2,156,511 | ||||||
(1) Represents the Luby’s, Inc. Non-employee Director Phantom Stock Plan.
See Note 13, “Share-Based Compensation,” to our Consolidated Financial Statements included in Item 8 of Part II of this report.
The following graph compares the cumulative total stockholder return on our common stock for the five fiscal years ended August 31, 2016, with the cumulative total return on the S&P SmallCap 600 Index and an industry peer group index. The peer group index consists of Bob Evans Farms, Inc., CBRL Group, Inc., Denny’s Corporation, Red Robin Gourmet Burgers, Ruby Tuesday Inc., as well as, Darden Restaurants, Inc. These companies are multi-unit family and casual dining restaurant operators in the mid-price range.
The cumulative total shareholder return computations set forth in the performance graph assume an investment of $100 on August 31, 2011, and the reinvestment of all dividends. The returns of each company in the peer group index have been weighed according to that company’s stock market capitalization.
18
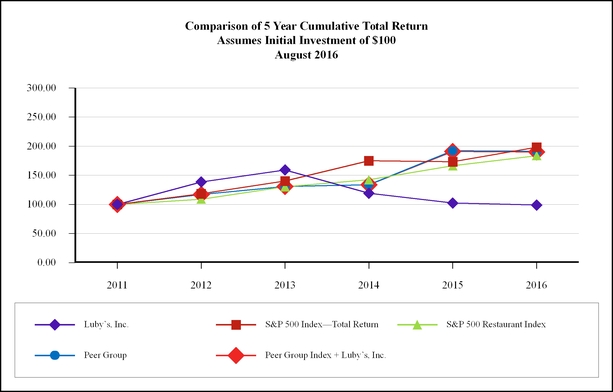
2011 | 2012 | 2013 | 2014 | 2015 | 2016 | |||||||||||||
Luby’s, Inc. | 100.00 | 138.68 | 159.34 | 119.12 | 102.42 | 98.90 | ||||||||||||
S&P 500 Index—Total Return | 100.00 | 118.31 | 140.21 | 175.11 | 173.38 | 198.40 | ||||||||||||
S&P 500 Restaurant Index | 100.00 | 109.00 | 130.32 | 142.20 | 166.37 | 183.82 | ||||||||||||
Peer Group Index Only | 100.00 | 116.87 | 130.62 | 133.98 | 192.11 | 191.37 | ||||||||||||
Peer Group Index + Luby’s, Inc. | 100.00 | 117.16 | 130.99 | 133.76 | 190.77 | 189.98 | ||||||||||||
19
Item 6. Selected Financial Data
FIVE-YEAR SUMMARY OF OPERATIONS
Fiscal Year Ended | ||||||||||||||||||||
August 31, 2016 | August 26, 2015 | August 27, 2014 | August 28, 2013 | August 29, 2012 | ||||||||||||||||
(371 days) | (364 days) | (364 days) | (364 days) | (364 days) | ||||||||||||||||
(In thousands, except per share data) | ||||||||||||||||||||
Sales | ||||||||||||||||||||
Restaurant sales | $ | 378,111 | $ | 370,192 | $ | 369,808 | $ | 361,291 | $ | 324,536 | ||||||||||
Culinary contract services | 16,695 | 16,401 | 18,555 | 16,693 | 17,711 | |||||||||||||||
Franchise revenue | 7,250 | 6,961 | 7,027 | 6,937 | 7,232 | |||||||||||||||
Vending revenue | 583 | 531 | 532 | 565 | 618 | |||||||||||||||
Total sales | 402,639 | 394,085 | 395,922 | 385,486 | 350,097 | |||||||||||||||
Income (loss) from continuing operations | (10,256 | ) | (1,616 | ) | (2,011 | ) | 4,479 | 7,398 | ||||||||||||
Loss from discontinued operations (a) | (90 | ) | (458 | ) | (1,436 | ) | (1,318 | ) | (645 | ) | ||||||||||
Net income (loss) | $ | (10,346 | ) | $ | (2,074 | ) | $ | (3,447 | ) | $ | 3,161 | $ | 6,753 | |||||||
Income (loss) per share from continuing operations: | ||||||||||||||||||||
Basic | $ | (0.35 | ) | $ | (0.05 | ) | $ | (0.06 | ) | $ | 0.16 | $ | 0.26 | |||||||
Assuming dilution | $ | (0.35 | ) | $ | (0.05 | ) | $ | (0.06 | ) | $ | 0.16 | $ | 0.26 | |||||||
Loss per share from discontinued operation: | ||||||||||||||||||||
Basic | $ | (0.00 | ) | $ | (0.02 | ) | $ | (0.06 | ) | $ | (0.05 | ) | $ | (0.02 | ) | |||||
Assuming dilution | $ | (0.00 | ) | $ | (0.02 | ) | $ | (0.06 | ) | $ | (0.05 | ) | $ | (0.02 | ) | |||||
Net income (loss) per share: | ||||||||||||||||||||
Basic | $ | (0.35 | ) | $ | (0.07 | ) | $ | (0.12 | ) | $ | 0.11 | $ | 0.24 | |||||||
Assuming dilution | $ | (0.35 | ) | $ | (0.07 | ) | $ | (0.12 | ) | $ | 0.11 | $ | 0.24 | |||||||
Weighted-average shares outstanding: | ||||||||||||||||||||
Basic | 29,226 | 28,974 | 28,812 | 28,618 | 28,351 | |||||||||||||||
Assuming dilution | 29,226 | 28,974 | 28,812 | 28,866 | 28,429 | |||||||||||||||
Total assets | $ | 252,225 | $ | 264,258 | $ | 275,435 | $ | 250,645 | $ | 230,889 | ||||||||||
Total debt | $ | 37,000 | $ | 37,500 | $ | 42,000 | $ | 19,200 | $ | 13,000 | ||||||||||
Number of restaurants at fiscal year end | 175 | 177 | 174 | 180 | 154 | |||||||||||||||
Number of franchised restaurants at fiscal year end | 113 | 106 | 110 | 116 | 125 | |||||||||||||||
Number of Culinary Contract Services contracts at fiscal year end | 24 | 23 | 25 | 21 | 18 | |||||||||||||||
Costs and Expenses | ||||||||||||||||||||
(As a percentage of restaurant sales) | ||||||||||||||||||||
Cost of food | 28.3 | % | 28.9 | % | 28.9 | % | 28.6 | % | 27.9 | % | ||||||||||
Payroll and related costs | 35.2 | % | 34.5 | % | 34.3 | % | 34.1 | % | 34.3 | % | ||||||||||
Other operating expenses | 16.1 | % | 17.1 | % | 16.8 | % | 16.4 | % | 15.4 | % | ||||||||||
Occupancy costs | 5.9 | % | 5.7 | % | 6.0 | % | 6.0 | % | 5.9 | % | ||||||||||
(a) For comparison purposes, fiscal 2013 and 2012 results have been adjusted to reflect the reclassification of certain Cheeseburger in Paradise leasehold locations to discontinued operations. See Note 10 to our consolidated financial statements in Part II, Item 8 in this Form 10-K for further discussion of discontinued operations.
20
Item 7. Management’s Discussion and Analysis of Financial Condition and Results of Operations
Management’s discussion and analysis of the financial condition and results of operations should be read in conjunction with the consolidated financial statements and footnotes for the fiscal years ended August 31, 2016 (“fiscal 2016”), August 26, 2015, (“fiscal 2015”), and August 27, 2014 (“fiscal 2014”) included in Part II, Item 8 of this Form 10-K.
The table on the following page sets forth selected operating data as a percentage of total revenues (unless otherwise noted) for the periods indicated. All information is derived from the accompanying Consolidated Statements of Operations. Percentages may not add due to rounding.
21
Fiscal Year Ended | |||||||||
August 31, 2016 | August 26, 2015 | August 27, 2014 | |||||||
(53 weeks) | (52 weeks) | (52 weeks) | |||||||
Restaurant sales | 93.9 | % | 93.9 | % | 93.4 | % | |||
Culinary contract services | 4.1 | % | 4.2 | % | 4.7 | % | |||
Franchise revenue | 1.8 | % | 1.8 | % | 1.8 | % | |||
Vending revenue | 0.1 | % | 0.1 | % | 0.1 | % | |||
TOTAL SALES | 100.0 | % | 100.0 | % | 100.0 | % | |||
STORE COSTS AND EXPENSES: | |||||||||
(As a percentage of restaurant sales) | |||||||||
Cost of food | 28.3 | % | 28.9 | % | 28.9 | % | |||
Payroll and related costs | 35.2 | % | 34.5 | % | 34.3 | % | |||
Other operating expenses | 16.1 | % | 17.1 | % | 16.8 | % | |||
Occupancy costs | 5.9 | % | 5.7 | % | 6.0 | % | |||
Vending revenue | (0.2 | )% | (0.1 | )% | (0.1 | )% | |||
Store level profit | 14.7 | % | 14.0 | % | 14.3 | % | |||
COMPANY COSTS AND EXPENSES (as a percentage of total sales) | |||||||||
Opening costs | 0.2 | % | 0.7 | % | 0.5 | % | |||
Depreciation and amortization | 5.4 | % | 5.4 | % | 5.1 | % | |||
Selling, general and administrative expenses | 10.5 | % | 9.8 | % | 10.3 | % | |||
Provision for asset impairments and restaurant closings, net | 0.4 | % | 0.2 | % | 0.7 | % | |||
Net Gain on disposition of property and equipment | (0.2 | )% | (1.1 | )% | (0.6 | )% | |||
Culinary Contract Services Costs (as a percentage of contract services sales) | |||||||||
Cost of culinary contract services | 89.6 | % | 90.2 | % | 90.8 | % | |||
Culinary income | 10.4 | % | 9.8 | % | 9.2 | % | |||
Franchise Operations Costs (as a percentage of franchise operations) | |||||||||
Cost of franchise operations | 25.9 | % | 24.0 | % | 24.7 | % | |||
Franchise income | 74.1 | % | 76.0 | % | 75.3 | % | |||
(As a percentage of total sales) | |||||||||
LOSS FROM OPERATIONS | (0.8 | )% | (0.2 | )% | (0.9 | )% | |||
Interest income | 0.0 | % | 0.0 | % | 0.0 | % | |||
Interest expense | (0.6 | )% | (0.6 | )% | (0.3 | )% | |||
Other income, net | 0.0 | % | 0.1 | % | 0.3 | % | |||
Loss before income taxes and discontinued operations | (1.4 | )% | (0.7 | )% | (0.9 | )% | |||
Provision (benefit) for income taxes | 1.2 | % | (0.3 | )% | (0.4 | )% | |||
Loss from continuing operations | (2.6 | )% | (0.4 | )% | (0.5 | )% | |||
Loss from discontinued operations, net of income taxes | 0.0 | % | (0.1 | )% | (0.4 | )% | |||
NET LOSS | (2.6 | )% | (0.5 | )% | (0.9 | )% | |||
22
Although store level profit, defined as restaurant sales plus vending revenue less cost of food, payroll and related costs, other operating expenses, and occupancy costs is a non-GAAP measure, we believe its presentation is useful because it explicitly shows the results of our most significant reportable segment. The following table reconciles between store level profit, a non-GAAP measure to loss from continuing operations, a GAAP measure:
Fiscal Year Ended | ||||||||||||
August 31, 2016 | August 26, 2015 | August 27, 2014 | ||||||||||
(53 weeks) | (52 weeks) | (52 weeks) | ||||||||||
(In thousands) | ||||||||||||
Store level profit | $ | 55,419 | $ | 51,763 | $ | 52,800 | ||||||
Plus: | ||||||||||||
Sales from culinary contract services | 16,695 | 16,401 | 18,555 | |||||||||
Sales from franchise revenue | 7,250 | 6,961 | 7,027 | |||||||||
Less: | ||||||||||||
Opening costs | 787 | 2,743 | 2,165 | |||||||||
Cost of culinary contract services | 14,955 | 14,786 | 16,847 | |||||||||
Cost of franchise operations | 1,877 | 1,668 | 1,733 | |||||||||
Depreciation and amortization | 21,889 | 21,407 | 20,101 | |||||||||
Selling, general and administrative expenses(a) | 42,422 | 38,759 | 40,707 | |||||||||
Provision for asset impairments and restaurant closings, net | 1,442 | 636 | 2,717 | |||||||||
Net Gain on disposition of property and equipment | (684 | ) | (3,994 | ) | (2,357 | ) | ||||||
Interest income | (4 | ) | (4 | ) | (6 | ) | ||||||
Interest expense | 2,247 | 2,337 | 1,247 | |||||||||
Other income, net | (186 | ) | (521 | ) | (1,101 | ) | ||||||
Provision (benefit) for income taxes | 4,875 | (1,076 | ) | (1,660 | ) | |||||||
Loss from continuing operations | $ | (10,256 | ) | $ | (1,616 | ) | $ | (2,011 | ) | |||
(a) Marketing and advertising expense included in Selling, general and administrative expenses was $5.6 million, $3.2 million, and $3.9 million in fiscal years 2016, 2015, and 2014, respectively.
The following table shows our restaurant unit count as of August 31, 2016 and August 26, 2015.
Restaurant Counts:
Fiscal 2016 Year Begin | Fiscal 2016 Openings | Fiscal 2016 Closings | Fiscal 2016 Year End | |||||||||
Luby’s Cafeterias(1) | 93 | — | (2 | ) | 91 | |||||||
Fuddruckers Restaurants(1) | 75 | 3 | (3 | ) | 75 | |||||||
Cheeseburger in Paradise | 8 | — | — | 8 | ||||||||
Other restaurants(2) | 1 | — | — | 1 | ||||||||
Total | 177 | 3 | (5 | ) | 175 | |||||||
(1) Includes 6 restaurants that are part of Combo locations
(2) Other restaurants include one Bob Luby’s Seafood
23
Overview
Description of the business
We generate revenues primarily by providing quality food to customers at our 92 Luby’s branded restaurants located mostly in Texas, 75 Fuddruckers restaurants located throughout the United States, 8 Cheeseburger in Paradise restaurants primarily located in the eastern United States, and 113 Fuddruckers franchises located primarily in the United States. On July 26, 2010, we became a multi-brand restaurant company with a national footprint through the acquisition of substantially all of the assets of Fuddruckers. The Fuddruckers acquisition added 59 Company-operated restaurants and a franchise network of 130 franchisee-operated units. This acquisition further expanded our family-friendly, value-oriented portfolio of restaurants located in close proximity to retail centers, business developments and residential areas. On December 6, 2012, we further expanded our brand family with the addition of the Cheeseburger in Paradise brand. This added full service restaurant and bar locations that complemented our core family-friendly brands and also provided an opportunity to acquire leasehold interests in certain locations with restaurant buildings that were well suited for conversion to our Fuddruckers brand. In addition to our restaurant business model, we also provide culinary contract services for organizations that offer on-site food service, such as healthcare facilities, colleges and universities, as well as businesses and institutions.
Business Strategy
In fiscal 2016, much of our strategic focus concentrated on further enhancing the guest experience at each of our restaurant brands, growing our Fuddruckers franchise network, and building our pipeline for new business within our Culinary Contract Services business segment.
At our Company-owned restaurants, we continued to re-invest in our core restaurants through exterior and interior remodels. We increased our efforts at attracting and retaining the most talented individuals to serve and engage with our guests in both restaurant management roles and front-line hourly restaurant team member roles. Key to our focus on human capital was investing in leadership development of our restaurant employees. In order to direct our energy into these efforts and also maintain acceptable debt levels, we opted to moderate the pace of our new restaurant construction: we opened three Fuddruckers in the fiscal year, two of which were conversions from our Cheeseburger in Paradise brand. Further, we closed five restaurants (two Luby's Cafeterias and three Fuddruckers) as part of our on-going efforts to focus attention and resources on the core set of restaurants in our portfolio which exhibit the most promise for enhanced profitability. We also increased our marketing and advertising investment by adding new sports sponsorships with the National Football League™ , Major League Baseball™, and professional soccer, particularly within our core market of Houston, Texas, where we have 54 restaurants in the metropolitan area. We continue to make these investments as part of our long-term strategy to increase our brand awareness and motivate new and more frequent guest visits.
In fiscal 2016, our Fuddruckers franchise business segment continued supporting our loyal franchisees and developing our franchisee pipeline both domestically and internationally. With 13 franchise location openings (seven domestic U.S. and six international) in fiscal 2016, we experienced the most new franchise store openings since acquiring the Fuddruckers brand in 2010. Our contract segment continues its focus on expanding the number of locations that we serve and developing business partnerships for the long-term, while servicing our existing agreements with our customized and high-level of client service. We are ensuring that we have the right corporate headcount and overhead to support each of our business segments while balancing our corporate overhead costs: on this front, we made significant strides in reducing overhead costs, including reduced headcount, corporate travel expense, and associated other overhead costs.
24
Financial and Operation Highlights for Fiscal 2016
Financial Performance
• | Total company sales increased approximately $8.6 million, or 2.2%, in fiscal 2016 compared to fiscal 2015, consisting primarily of an approximate $7.9 million increase in restaurant sales, an approximate $0.3 million increase in Culinary contract services sales, an approximate $0.3 million increase in franchise revenue, and a less than an approximate $0.1 million increase in vending revenue. The increase in restaurant sales included an approximate $5.1 million increase in sales at stand-alone Fuddruckers restaurants, an approximate $2.9 million increase in sales at stand-alone Luby’s Cafeterias and an approximate $0.5 million increase at sales from our Cheeseburger in Paradise restaurants, partially offset by an approximate $0.6 million decrease in sales from Combo locations. The approximate $7.9 million increase in total restaurant sales reflects one additional week of operations since fiscal 2016 comprised 53 weeks compared to fiscal 2015 which was comprised of a typical 52 weeks. The additional week of operations in fiscal 2016 generated approximately $6.7 million in restaurant sales. |
• | Total segment profit increased approximately $3.9 million to approximately $62.5 million in fiscal 2016 compared to approximately $58.7 million in fiscal 2015. The approximate $3.9 million increase in total segment profit resulted from an increase of approximately $3.7 million in Company-owned restaurant segment profit, an approximate $0.1 million increase in culinary contract services segment profit, and an approximate $0.1 million increase in franchise segment profit. The approximate $3.7 million increase in Company-owned restaurant segment profit resulted from restaurant sales and vending income increasing approximately $8.0 million with the cost of food, payroll and related costs, other operating expenses, and occupancy costs increasing approximately $4.3 million. |
• | Income or loss from continuing operations was a loss of approximately $10.3 million in fiscal 2016 compared to a loss of approximately $1.6 million in fiscal 2015. |
Operational Endeavors and Milestones
• | Core restaurant brands. Our core Luby’s Cafeteria and Fuddruckers brands continued to develop and evolve. While our core menu remains stable at our Luby’s Cafeterias, we introduce and rotate new menu offerings throughout the year to remain relevant to both our existing customer base and attract new customers. We offer a range of price points which include premium items featured on weekend nights as well as more price-sensitive manager specials throughout the week. In fiscal 2016, we also continued to promote our made-from-scratch cooking with many locally-sourced “from the farm” ingredients at our Luby’s Cafeterias with our “The Luby’s Way” slogan. “The Luby’s Way” signifies that we are dedicated to serving our guests only the best hand-crafted recipes, prepared fresh each day in our kitchens. We support local farmers and use only the freshest produce and highest quality ingredients. In efforts to motivate increased guest visits, we offered both broad and targeted promotional offers at various points during the year which included buy-one-get-one discounts, email blasts to our most loyal guests for an offer available on the following day, as well as offers highlighting our seasonal and on-going menu offerings in mail-outs to guests' homes. To enhance our research, our marketing efforts were supported with increased usage of billboard advertising in certain markets. |
At Fuddruckers, we continue to evolve the World’s Greatest Hamburgers®, with new specialty burger combinations and toppings and expanded offerings beyond the core hamburger. In fiscal 2016, we continued our enhanced guest service program whereby a designated restaurant employee engages guests throughout the dining room and ensures that all elements of the dining experience occur at our high standard. We continued to focus on speed of service and an enhanced ordering experience. To elevate the Fuddruckers brand, we continued to partner with the Houston Texans National Football League team, which has provided Fuddruckers with increased media mentions and exposure to past, present, and future customers. We furthered our use of technology to reach our guests utilizing new digital media campaigns and targeted advertising to guests' mobile devices. We continued to measure guest satisfaction through a number of survey and other guest interactions that helped us identify areas of excellence and areas for improvement. We are confident the focus on great food and enhanced service will in the long run lead to increased guest frequency and loyalty.
• | Franchise Network. As of August 31, 2016, we supported a franchise network of 113 Fuddruckers franchise locations with additional 97 locations under development agreements, of which 30 are scheduled to open by the end of fiscal 2018. For fiscal 2016, our franchisees opened 13 new Fuddruckers restaurants. Seven of the opened locations were in the United States, two in Colombia, two in Italy, one in Panama, and one in Mexico. For fiscal 2016, there were six Fuddruckers franchise locations that closed as franchise-operated restaurants. Our franchise network generated approximately $7.3 million in revenue in fiscal year 2016. |
25
• | Culinary Contract Services. Our CCS business generated approximately $16.7 million in revenue during fiscal 2016 compared to approximately $16.4 million in revenue during fiscal 2015. The approximate $0.3 million increase in revenue was primarily due to one additional week of operations in fiscal 2016 with openings and closings having minimal impact on total Culinary Contract Services revenue. We view this area as a long-term growth business that generally requires less capital investment and produces favorable percentage returns on invested capital. |
• | Cheeseburger in Paradise Location Strategy. At Cheeseburger in Paradise, we initiated a strategic plan in fiscal 2014 to revitalize the brand and improve results that included closing under-performing units, converting certain locations to Fuddruckers, and launching initiatives to improve restaurant performance at the remaining units. As of our fiscal year-end 2016, we operated eight of the original Cheeseburger in Paradise locations, completed eight conversions to Fuddruckers restaurants, selected two additional locations expected to be converted into Fuddruckers, sub-leased two locations to Fuddruckers franchisees, and had another three locations where the property lease has terminated. At the core eight locations that we operate with the Cheeseburger in Paradise brand, our focus is on building customer loyalty step by step. |
• | New Restaurant Openings. In fiscal year 2016, we opened three Fuddruckers restaurants. Two of these restaurants were previously operated as Cheeseburger in Paradise restaurants and one location is in a newly constructed retail space. |
• | Capital Spending. Purchases of property and equipment were approximately $18.3 million in fiscal 2016, down from approximately $20.4 million in fiscal 2015. These capital investments were funded through a combination of cash from operations, sale of property, and utilization of our revolving credit facility. Capital investments in fiscal 2016 included (1) approximately $1.2 million on new restaurant development; (2) approximately $8.2 million on the remodeling of existing restaurants and conversion of Cheeseburger in Paradise restaurants; and (3) approximately $8.9 million for recurring capital expenditures and technology infrastructure investments. Our debt balance at the end of fiscal 2016 was approximately $37.0 million. We remain committed to maintaining the attractiveness of all of our restaurant locations where we anticipate operating over the long term. In fiscal 2017, we anticipate making capital investments of up to $20 million, excluding the purchase of land, for recurring maintenance of all of our restaurant properties, for point of sale hardware associated with our technology infrastructure, and to fund our on-going remodeling program. |
Our long-term plan continues to focus on expanding each of our core brands, including the Fuddruckers franchise network, as well as growing our CCS business. We are also committed to making capital investments with suitable return characteristics. We plan to use cash generated from operations, combined with our borrowing capacity, when necessary, in order to seize these capital investment opportunities. We believe our operational execution has improved through our commitment to higher operating standards, and we believe that we are well-positioned to enhance shareholder value over the long term.
Accounting Periods
Our fiscal year ends on the last Wednesday in August. Accordingly, each fiscal year normally consists of 13 four-week periods, or accounting periods, accounting for 364 days in the aggregate. However, every fifth or sixth year, we have a fiscal year that consists of 53 weeks, accounting for 371 days in the aggregate. Fiscal year 2016 is such a year that contained 53 weeks, accounting for 371 days in the aggregate. In fiscal year 2015, and prior, each of the first three quarters of each fiscal year consisted of three four-week periods, while the fourth quarter normally consisted of four four-week periods. Beginning in fiscal year 2016, the first quarter consisted of four four-week periods, while the last three quarters will normally consist of three four-week periods. However, fiscal year 2016 is a fiscal year consisting of 53 weeks, accounting for 371 days in the aggregate. As such, the fourth quarter of fiscal year 2016 contained one five-week period, resulting in a 13-week fourth quarter, or 91 days in the aggregate. Comparability between quarters may be affected by the varying lengths of the quarters, as well as the seasonality associated with the restaurant business.
Same-Store Sales
The restaurant business is highly competitive with respect to food quality, concept, location, price, and service, all of which may have an effect on same-store sales. Our same-store sales calculation measures the relative performance of a certain group of restaurants. A store is included in this group of restaurants after it has been open for six complete consecutive quarters. The Cheeseburger in Paradise stores that were acquired in December 2012 were included in the same-store metric beginning with the first quarter fiscal 2015. Stores that close on a permanent basis are removed from the group in the fiscal quarter when operations cease at the restaurant, but remain in the same-store group for previously reported fiscal quarters. Although
26
management believes this approach leads to more effective year-over-year comparisons, neither the time frame nor the exact practice may be similar to those used by other restaurant companies. Same-store sales at our restaurant units increased 0.7% for fiscal 2016, increased 0.5% for fiscal 2015, and were unchanged for fiscal 2014.
The following table shows the same-store sales change for comparative historical quarters:
Fiscal 2016 | Fiscal 2015 | Fiscal 2014 | ||||||||||||||||||||||||||||||||||
Increase (Decrease) | Q4 | Q3 | Q2 | Q1 | Q4 | Q3 | Q2 | Q1 | Q4 | Q3 | Q2 | Q1 | ||||||||||||||||||||||||
Same-store sales | (0.5 | )% | (0.6 | )% | 2.2 | % | 1.4 | % | 0.7 | % | (1.1 | )% | 2.5 | % | (0.1 | )% | (1.0 | )% | 0.3 | % | 2.5 | % | (1.3 | )% | ||||||||||||
Discontinued Operations
On March 24, 2014, the Company announced that it has initiated a plan focused on improving cash flow from the acquired Cheeseburger in Paradise leasehold units. This underperforming Cheeseburger in Paradise leasehold disposal plan called for five or more locations to be closed by the end of fiscal 2014. In accordance with the plan, the entire fiscal activity of the applicable locations closed after the inception of the plan has been classified as discontinued operations. Results related to these same locations have also been classified as discontinued operations for all periods presented.
RESULTS OF OPERATIONS
Fiscal 2016 (53 weeks) compared to Fiscal 2015 (52 weeks)
Sales
Fiscal Year 2016 Ended | Fiscal Year 2015 Ended | Fiscal 2016 vs Fiscal 2015 | Fiscal Year 2014 Ended | Fiscal 2015 vs Fiscal 2014 | |||||||||||||
($000s) | August 31, 2016 | August 26, 2015 | Higher/(Lower) | August 27, 2014 | Higher/(Lower) | ||||||||||||
(53 weeks) | (52 weeks) | (53 weeks vs 52 weeks) | (52 weeks) | (52 weeks vs 52 weeks) | |||||||||||||
Restaurant sales | $ | 378,111 | $ | 370,192 | 2.1 | % | $ | 369,808 | 0.1 | % | |||||||
Culinary contract services | 16,695 | 16,401 | 1.8 | % | 18,555 | (11.6 | )% | ||||||||||
Franchise revenue | 7,250 | 6,961 | 4.2 | % | 7,027 | (0.9 | )% | ||||||||||
Vending revenue | 583 | 531 | 9.8 | % | 532 | (0.2 | )% | ||||||||||
TOTAL SALES | $ | 402,639 | $ | 394,085 | 2.2 | % | $ | 395,922 | (0.5 | )% | |||||||
Total company sales increased approximately $8.6 million, or 2.2%, in fiscal 2016 compared to fiscal 2015, consisting primarily of a $7.9 million increase in restaurant sales, a $0.3 million increase in Culinary contract services sales, a $0.3 million increase in franchise revenue, and less than a $0.1 million increase in vending revenue.
Total company sales decreased $1.8 million, or 0.5%, in fiscal 2015 compared to fiscal 2014, consisting primarily of an $2.2 million decrease in culinary contract service sales and a $0.1 million decrease in franchise revenue, offset by a $0.4 million increase in restaurant sales. The other component of total sales is vending revenue.
The Company operates with three reportable operating segments: Company-owned restaurants, franchise operations, and Culinary Contract Services.
27
Company-Owned Restaurants
Restaurant Sales
Restaurant Brand | Fiscal Year 2016 Ended | Fiscal Year 2015 Ended | Fiscal 2016 vs Fiscal 2015 | Fiscal Year 2014 Ended | Fiscal 2015 vs Fiscal 2014 | ||||||||||||
August 31, 2016 | August 26, 2015 | Higher/(Lower) | August 27, 2014 | Higher/(Lower) | |||||||||||||
(53 weeks) | (52 weeks) | (53 weeks vs 52 weeks) | (52 weeks) | (52 weeks vs 52 weeks) | |||||||||||||
Luby’s Cafeterias | $ | 229,880 | $ | 226,970 | 1.3 | % | $ | 231,132 | (1.8 | )% | |||||||
Fuddruckers Restaurants | 106,456 | 101,290 | 5.1 | % | 94,101 | 7.6 | % | ||||||||||
Combo locations | 23,107 | 23,734 | (2.6 | )% | 10,603 | 123.8 | % | ||||||||||
Cheeseburger in Paradise | 18,668 | 18,198 | 2.6 | % | 33,055 | (44.9 | )% | ||||||||||
Koo Koo Roo | — | — | 917 | (100.0 | )% | ||||||||||||
Restaurant Sales | $ | 378,111 | $ | 370,192 | 2.1 | % | $ | 369,808 | 0.1 | % | |||||||
Total restaurant sales increased approximately $7.9 million in fiscal 2016 compared to fiscal 2015. The increase in restaurant sales included a $5.1 million increase in sales at stand-alone Fuddruckers restaurants, a $2.9 million increase in sales at stand-alone Luby’s Cafeterias and a $0.5 million increase at sales from our Cheeseburger in Paradise restaurants, partially offset by a $0.6 million decrease in sales from Combo locations. The $7.9 million increase in total restaurant sales reflects one additional week of operations since fiscal 2016 comprised 53 weeks compared to fiscal 2015 which was comprised of a typical 52 weeks. The additional week of operations in fiscal 2016 generated approximately $6.7 million in restaurant sales.
The $5.1 million increase in sales at stand-alone Fuddruckers restaurants includes approximately $1.9 million in sales generated in the additional week and a net increase of three operating restaurants. On a same-store basis, Fuddruckers sales were approximately level for fiscal 2016 compared to fiscal 2015. Average spend per guest increased approximately 2.7% and was offset by a similar decrease in guest traffic.
The $2.9 million increase in sales at stand-alone Luby’s Cafeterias includes approximately $4.1 million in sales generated in the additional week and a 1.1% increase in same-store stand-alone Luby's Cafeteria sales, offset by a net reduction of four operating restaurants. The 1.1% increase in same-store sales includes a 3.0% increase in guest traffic partially offset by a 1.9% decrease in average spend per guest. The $0.5 million increase in sales from our Cheeseburger in Paradise restaurants includes approximately $0.3 million in sales generated in the additional week and a 0.8% increase in sales at the eight locations in operation, all of which are included in our same-store-grouping. The $0.6 million decrease in sales from Combo locations includes approximately $0.4 million in sales generated in the additional week offset by decreases in sales at two locations that experienced sales declines when compared against the months immediately following their opening when a high-volume of sales were generated.
Total restaurant sales increased approximately $0.4 million in fiscal 2015 compared to fiscal 2014. The increase in restaurant sales included a $13.1 million increase in sales from Combo locations, and a $7.2 million increase in sales at stand-alone Fuddruckers restaurants, mostly offset by a $14.8 million decrease at sales from our Cheeseburger in Paradise restaurants and a $4.2 million decrease in sales at stand-alone Luby’s Cafeterias. Fiscal 2014 also included a $0.9 million sales contribution from Koo Koo Roo locations that ceased operations prior to start of fiscal 2015. The $13.1 million increase in Combo location sales reflects a greater number of weeks of operations for these locations in fiscal 2015 compared to fiscal 2014 as our Combo locations grew from one at the beginning of fiscal 2014 to a total of six locations by the third quarter fiscal 2015. The $7.2 million increase in sales at Fuddruckers includes a $5.2 million increase in sales at seven locations that were previously operated as one of our other restaurant brands (six previously operated as Cheeseburger in Paradise locations and one previously operated as a Koo Koo Roo location). The $14.8 million decrease in sales from our Cheeseburger in Paradise restaurants primarily reflects fewer weeks of operation for this brand in fiscal 2015 compared to fiscal 2014 as 15 Cheeseburger in Paradise in restaurants were closed for conversion or disposal at various points in fiscal 2014. The $4.2 million decrease in sales at our stand-alone Luby’s Cafeterias primarily reflects the closure of three locations in fiscal 2014 and one location in fiscal 2015, partially offset by the opening of one new location in fiscal 2014 and a 0.6% increase in same-store Luby’s Cafeteria sales.
On a same store basis, restaurant sales increased 0.5% for fiscal 2015 compared to fiscal 2014. Same store sales at our Luby’s Cafeterias increased 0.6% and same store sales at our Fuddruckers restaurants increased 1.1% in fiscal 2015 compared to fiscal 2014 while same-store sales at our Cheeseburger in Paradise location decreased 2.9% and our one Combo location included in
28
the same-store group decreased 1.8%. The 0.6% increase in same store sales at our Luby’s Cafeteria restaurants includes a 1.6% increase in average spend per guest offset by a 1.0% decrease in guest traffic for fiscal 2015 compared to fiscal 2014. The 1.1% increase in same-store sales at our Fuddruckers restaurants reflects an increase in average spend per guest with a constant level of guest traffic for fiscal 2015 compared to fiscal 2014.
Cost of Food
Fiscal Year 2016 Ended | Fiscal Year 2015 Ended | Fiscal 2016 vs Fiscal 2015 | Fiscal Year 2014 Ended | Fiscal 2015 vs Fiscal 2014 | |||||||||||||
($000s) | August 31, 2016 | August 26, 2015 | Increase/ (Decrease) | August 27, 2014 | Increase/ (Decrease) | ||||||||||||
(53 weeks) | (52 weeks) | (53 vs 52 weeks) | (52 weeks) | (52 vs 52 weeks) | |||||||||||||
Cost of food | $ | 106,980 | $ | 107,051 | (0.1 | )% | $ | 106,747 | 0.3 | % | |||||||
As a percentage of restaurant sales | 28.3 | % | 28.9 | % | (0.6 | )% | 28.9 | % | 0.0 | % | |||||||
Cost of food, which is comprised of the cost associated with sale of food and beverage products that are consumed dining in our restaurants, as take-out, and as catering. Cost of food decreased approximately $0.1 million, or 0.1%, in fiscal 2016 compared to fiscal 2015. Cost of food is variable and generally fluctuates with sales volume. As a percentage of restaurant sales, food costs decreased 0.6% to 28.3% in fiscal 2016 compared to 28.9% in fiscal 2015. The Cost of food as percentage of sales decreased with lower food commodity costs, higher realized average menu prices at Fuddruckers, and continued careful food cost controls. At our Luby’s Cafeterias we experienced an approximate 3% decrease in our basket of food commodity purchases, occurring as a result of significant decreases in the cost of beef and cheese and, to a lesser extent dairy, butter, and fresh produce partially offset increases in the cost of oils and shortenings and to a lesser extent seafood. At our Fuddruckers restaurants we experienced an approximate 7% decrease in our basket of food commodity purchases, with significant decreases in the cost of beef having the greatest impact. Our cost of food, however, was also impacted by decreases in the cost of oils and shortenings, cheese, and dairy products, partially offset by higher other protein costs.
Cost of food increased approximately $0.3 million, or 0.3%, in fiscal 2015 compared to fiscal 2014. Cost of food is variable and generally fluctuates with sales volume. As a percentage of restaurant sales, food costs were 28.9% in fiscal 2015 and fiscal 2014. The Cost of food as percentage of sales was unchanged as we were able to offset higher food commodity costs with menu price increases and careful food cost controls. At our Luby’s Cafeterias we experienced an approximate 3% increase in our basket of food commodity purchases, occurring as a result of significant increases in the cost of beef and to a lesser extent poultry and eggs, partially offset by decreases in the cost of seafood, cheese, and oils and shortening. Average spend per Luby’s Cafeteria guest increased 1.6% as a result of selected menu price increases and changes in the mix of menu items offered and selected by our guests, thus offsetting the higher food commodity costs. At our Fuddruckers restaurants we experienced an approximate 8% increase in our basket of food commodity purchases, with significant increases in the cost of beef having the greatest impact. Our cost of food, however, was also impacted by significantly higher poultry, and eggs costs, partially offset by lower costs for seafood, pork, and oils and shortenings. Average spend per Fuddruckers guest increased 1.1% as the result of selected menu price increases and changes in the mix of menu items offered and selected by our guests which partially offset the higher food commodity costs.
Payroll and Related Costs
Fiscal Year 2016 Ended | Fiscal Year 2015 Ended | Fiscal 2016 vs Fiscal 2015 | Fiscal Year 2014 Ended | Fiscal 2015 vs Fiscal 2014 | |||||||||||||
($000s) | August 31, 2016 | August 26, 2015 | Increase/ (Decrease) | August 27, 2014 | Increase/ (Decrease) | ||||||||||||
(53 weeks) | (52 weeks) | (53 vs 52 weeks) | (52 weeks) | (52 vs 52 weeks) | |||||||||||||
Payroll and related costs | $ | 132,960 | $ | 127,692 | 4.1 | % | $ | 126,696 | 0.8 | % | |||||||
As a percentage of restaurant sales | 35.2 | % | 34.5 | % | 0.7 | % | 34.3 | % | 0.2 | % | |||||||
Payroll and related costs includes restaurant-level hourly wages, including overtime pay, and pay while training, as well as management salaries and incentive payments. Payroll and related costs also include the payroll taxes, workers’ compensation expense, group health insurance costs, and 401(k) matching expense for all restaurant-level hourly and management
29
employees. Payroll and related costs increased approximately $5.3 million, or 4.1%, in fiscal 2016 compared to fiscal 2015 due primarily to an additional week of operations in fiscal 2016 compared to fiscal 2015. Payroll and related costs as a percentage of restaurant sales increased 0.7% due to (1) higher average hourly wage rates reflective of market pressures; (2) a greater usage of overtime pay necessary to staff our restaurants to maintain a high level of guest service; and (3) higher average restaurant management compensation; partially offset by lower workers' compensation insurance expense.
Payroll and related costs increased approximately $1.0 million, or 0.8%, in fiscal 2015 compared to fiscal 2014. Payroll and related costs as a percentage of restaurant sales increased 0.2%, primarily as a result of (1) higher management labor costs as management positions were filled to ensure management coverage necessary to meet our guest service levels and (2) higher average management compensation.
Other Operating Expenses
Fiscal Year 2016 Ended | Fiscal Year 2015 Ended | Fiscal 2016 vs Fiscal 2015 | Fiscal Year 2014 Ended | Fiscal 2015 vs Fiscal 2014 | |||||||||||||
($000s) | August 31, 2016 | August 26, 2015 | Increase/ (Decrease) | August 27, 2014 | Increase/ (Decrease) | ||||||||||||
(53 weeks) | (52 weeks) | (53 vs 52 weeks) | (52 weeks) | (52 vs 52 weeks) | |||||||||||||
Other operating expenses | $ | 60,961 | $ | 63,133 | (3.4 | )% | $ | 62,048 | 1.7 | % | |||||||
As a percentage of restaurant sales | 16.1 | % | 17.1 | % | (1.0 | )% | 16.8 | % | 0.3 | % | |||||||
Other operating expenses primarily include restaurant-related expenses for utilities, repairs and maintenance, advertising, insurance, and services. Other operating expenses decreased approximately $2.2 million, or 3.4%, in fiscal 2016 compared to fiscal 2015. As a percentage of restaurant sales, Other operating expenses decreased 1.0% to 16.1% in fiscal 2016 compared to 17.1% in fiscal 2015. The 1.0% decrease in Other operating expenses as a percentage of restaurant sales was due to (1) a 0.7% decrease in repairs and maintenance cost; (2) a 0.3% decrease in utilities costs due to lower average utility rates; and (3) a 0.1% decrease in individual store marketing and advertising costs as advertising spend was re-directed into more corporate-wide marketing initiatives; partially offset by (4) a net 0.1% increase in restaurant supplies costs, restaurant services costs, insurance costs, and other restaurant operating costs.
Other operating expenses increased approximately $1.1 million, or 1.7%, in fiscal 2015 compared to fiscal 2014. As a percentage of restaurant sales, Other operating expenses increased 0.3% to 17.1% in fiscal 2015 compared to 16.8% in fiscal 2014. The 0.3% increase in Other operating expenses as a percentage of restaurant sales was due to (1) a 0.5% increase in repairs and maintenance cost; (2) a 0.1% increase in restaurants supplies and services costs; and (3) a 0.1% increase in marketing and advertising costs; partially offset by (4) a decrease of 0.4% in utilities costs as a percentage of restaurant sales due to lower average utility rates.
Occupancy Costs
Fiscal Year 2016 Ended | Fiscal Year 2015 Ended | Fiscal 2016 vs Fiscal 2015 | Fiscal Year 2014 Ended | Fiscal 2015 vs Fiscal 2014 | |||||||||||||
($000s) | August 31, 2016 | August 26, 2015 | Increase/ (Decrease) | August 27, 2014 | Increase/ (Decrease) | ||||||||||||
(53 weeks) | (52 weeks) | (53 vs 52 weeks) | (52 weeks) | (52 vs 52 weeks) | |||||||||||||
Occupancy costs | $ | 22,374 | $ | 21,084 | 6.1 | % | $ | 22,049 | (4.4 | )% | |||||||
As a percentage of restaurant sales | 5.9 | % | 5.7 | % | 0.2 | % | 6.0 | % | (0.3 | )% | |||||||
Occupancy costs include property lease expense, property taxes, and common area maintenance charges, property insurance, and permits and licenses. Occupancy costs increased $1.3 million in fiscal 2016 compared to fiscal 2015 due to a net increase of three restaurant locations, increased property tax expense at existing locations, increased property insurance expense at existing locations, and one additional week of operations in fiscal 2016. The occupancy costs of closed locations previously operated as Cheeseburger in Paradise, but selected for conversion to Fuddruckers restaurants in fiscal 2016 or beyond have been classified as pre-opening cost and reflected in our Opening costs expense line.
30
Occupancy costs decreased $1.0 million in fiscal 2015 compared to fiscal 2014, in large part due to closure of leased locations. The occupancy costs of closed locations previously operated as Cheeseburger in Paradise but selected for conversion to Fuddruckers restaurants in fiscal 2015 or beyond have been classified as pre-opening cost and reflected in our Opening costs expense line.
Franchise Operations Segment Profit
Fiscal Year 2016 Ended | Fiscal Year 2015 Ended | Fiscal 2016 vs Fiscal 2015 | Fiscal Year 2014 Ended | Fiscal 2015 vs Fiscal 2014 | |||||||||||||
($000s) | August 31, 2016 | August 26, 2015 | Increase/ (Decrease) | August 27, 2014 | Increase/ (Decrease) | ||||||||||||
(53 weeks) | (52 weeks) | (53 vs 52 weeks) | (52 weeks) | (52 vs 52 weeks) | |||||||||||||
Franchise revenue | $ | 7,250 | $ | 6,961 | 4.2 | % | $ | 7,027 | (0.9 | )% | |||||||
Cost of franchise operations | 1,877 | 1,668 | 12.5 | % | 1,733 | (3.8 | )% | ||||||||||
Franchise profit | $ | 5,373 | $ | 5,293 | 1.5 | % | $ | 5,294 | 0.0 | % | |||||||
Franchise profit as percent of Franchise revenue | 74.1 | % | 76.0 | % | (1.9 | )% | 75.3 | % | 0.7 | % | |||||||
We offer franchises for the Fuddruckers brand. Franchises are sold in markets where expansion is deemed advantageous to the development of the Fuddruckers concept and system of restaurants. Franchise revenue includes (1) franchise royalties and (2) franchise and area development agreement fees. Franchise revenue increased $0.3 million in fiscal 2016 compared to fiscal 2015 which included a $0.2 million increase in franchise fees and a $0.1 million increase in franchise royalties. Cost of franchise operations increased approximately $0.2 million, or 12.5%, in fiscal 2016 compared to fiscal 2015, primarily as a result of increased overhead cost to support franchise operations and the opening of new franchise locations. Franchisees opened six international locations (one in each of Mexico and Panama; two in each of Italy and Columbia) and seven domestic locations (one in each of Michigan, Montana, California, Florida, and Texas; and two in Virgina) in fiscal 2016. Franchise profit, defined as Franchise revenue less Cost of franchise operations, increased $0.1 million in fiscal 2016 compared to fiscal 2015. During fiscal 2016, we opened 13 franchise locations and there were six franchise units that closed on a permanent basis. We ended fiscal 2016 with 113 Fuddruckers franchise restaurants.
Franchise revenue decreased $66.0 thousand in fiscal 2015 compared to fiscal 2014, which included a $131 thousand decrease in franchise royalties offset by a $65 thousand increase in franchise fees. Cost of franchise operations increased approximately $0.1 million, or 3.8%, in fiscal 2015 compared to fiscal 2014, primarily as a result of increased overhead cost to support franchise operations and the opening of new franchise locations. Franchise profit, defined as Franchise revenue less Cost of franchise operations, was $5.3 million in fiscal 2015 and in fiscal 2014. During fiscal 2015, eight franchise locations opened and there were ten franchise units that closed on a permanent basis and two that were converted to company operated locations. We ended fiscal 2015 with 106 Fuddruckers franchise restaurants.
Culinary Contract Services Segment Profit
Culinary Contract Services is a business line servicing healthcare and corporate dining clients. The healthcare accounts are full service and typically include in-room delivery, catering, vending, coffee service and retail dining. This business line varied between 24 and 28 client locations through fiscal 2016 and between 21 and 26 client locations in fiscal 2015. In fiscal 2016 and fiscal 2015, we continued concentrating on clients able to enter into agreements where all operating costs are reimbursed to us and we charge a generally fixed fee. These agreements typically present lower financial risk to the company.
31
Fiscal Year 2016 Ended | Fiscal Year 2015 Ended | Fiscal 2016 vs Fiscal 2015 | Fiscal Year 2014 Ended | Fiscal 2015 vs Fiscal 2014 | |||||||||||||
($000s) | August 31, 2016 | August 26, 2015 | Increase/ (Decrease) | August 27, 2014 | Increase/ (Decrease) | ||||||||||||
(53 weeks) | (52 weeks) | (53 vs 52 weeks) | (52 weeks) | (52 vs 52 weeks) | |||||||||||||
Culinary contract services | $ | 16,695 | $ | 16,401 | 1.8 | % | $ | 18,555 | (11.6 | )% | |||||||
Cost of culinary contract services | 14,955 | 14,786 | 1.1 | % | 16,847 | (12.2 | )% | ||||||||||
Culinary contract profit | $ | 1,740 | $ | 1,615 | 7.7 | % | $ | 1,708 | (5.4 | )% | |||||||
Culinary contract profit as percent of Culinary contract services sales | 10.4 | % | 9.8 | % | 0.6 | % | 9.2 | % | 0.6 | % | |||||||
Culinary Contract Services revenue increased $0.3 million, or 1.8% in fiscal 2016 compared to fiscal 2015. The $0.3 million increase in revenue was primarily due to one additional week of operations in fiscal 2016 with openings and closings having minimal impact on total Culinary Contract Services revenue. Cost of Culinary Contract Services includes the food, payroll and related costs, other direct operating expenses associated with generating culinary contract sales, and the direct overhead costs (primarily salary and related costs) associated with the management of this business segment. Cost of Culinary Contract Services increased approximately $0.2 million, or 1.1%, in fiscal 2016 compared to fiscal 2015 due primarily to an increase in culinary contract sales volume related to an additional week of operations in fiscal 2016. Profit in our culinary contract services business (defined as Culinary Contract Services revenue less cost of Culinary Contract Services) increased in dollar terms by approximately $0.1 million and increased as a percent of Culinary Contract Services revenue to 10.4% in fiscal 2016 from 9.8% in fiscal 2015.
Culinary Contract Services revenue decreased $2.2 million, or 11.6%, in fiscal 2015 compared to fiscal 2014. While the number of locations has varied, we believe we operated with a stronger mix of clients. The decrease in revenue was primarily due to ceasing operations at two higher volume locations, only partially offset by newer smaller volume locations.
Cost of Culinary Contract Services includes the food, payroll and related costs, other direct operating expenses associated with generating culinary contract sales and the direct overhead costs (primarily salary and related costs) associated with the management of this business segment. Cost of Culinary Contract Services decreased approximately $2.1 million, or 12.2%, in fiscal 2015 compared to fiscal 2014 due to a decrease in culinary contract sales volume. Profit in our culinary contract services business (defined as Culinary Contract Services revenue less cost of Culinary Contract Services) decreased in dollar terms by approximately $0.1 million but increased as percent of Culinary Contract Services revenue to 9.8% in fiscal 2015 from 9.2% in fiscal 2014.
Opening Costs
Opening costs includes labor, supplies, occupancy, and other costs necessary to support the restaurant through its opening period. Opening costs were approximately $0.8 million in fiscal 2016 compared to approximately $2.7 million in fiscal 2015 and approximately $2.2 million in fiscal 2014.
Opening costs in fiscal 2016 included the costs of opening three Fuddruckers locations and the carrying costs (mainly rent, property taxes, and utilities) for two locations that were selected for possible conversion from Cheeseburger in Paradise restaurants to Fuddruckers restaurants. Opening costs in fiscal 2015 included the cost associated with opening one Combo location and nine stand-alone Fuddruckers restaurants, including one that opened just prior to the start of fiscal 2015. Opening costs in fiscal 2015 also included the carrying costs (mainly rent, property taxes, and utilities) for seven locations that were selected for conversion from Cheeseburger in Paradise to Fuddruckers; three of these locations opened as a Fuddruckers during fiscal 2015, two of these locations opened as a Fuddruckers subsequent to end of fiscal 2015. Opening costs in fiscal 2014, included the cost associated with opening four Combo locations, six stand-alone Fuddruckers restaurants and one stand-alone Luby’s Cafeteria. Also included in Opening costs were the carrying costs for property slated for development. Opening costs in fiscal 2014 included the cost associated with opening one Combo location and five stand-alone Fuddruckers restaurants.
32
Depreciation and Amortization
Fiscal Year 2016 Ended | Fiscal Year 2015 Ended | Fiscal 2016 vs Fiscal 2015 | Fiscal Year 2014 Ended | Fiscal 2015 vs Fiscal 2014 | |||||||||||||
($000s) | August 31, 2016 | August 26, 2015 | Increase/ (Decrease) | August 27, 2014 | Increase/ (Decrease) | ||||||||||||
(53 weeks) | (52 weeks) | (53 vs 52 weeks) | (52 weeks) | (52 vs 52 weeks) | |||||||||||||
Depreciation and amortization | $ | 21,889 | $ | 21,407 | 2.3 | % | $ | 20,101 | 6.5 | % | |||||||
As a percentage of restaurant sales | 5.8 | % | 5.8 | % | 0.0 | % | 5.4 | % | 0.4 | % | |||||||
Depreciation and amortization expense increased $0.5 million in fiscal 2016 compared to fiscal 2015 due primarily to the investments made in new locations and the capital we have used for remodeling existing locations as well as depreciation associated with additional infrastructure and technology assets. The increase in depreciation due to investments made in new locations as well as the capital we have used for remodeling existing locations was mostly offset by certain existing assets reaching the end of their depreciable lives during fiscal 2016.
Depreciation and amortization expense increased $1.3 million in fiscal 2015 compared to fiscal 2014 due primarily to the investments made in new locations as well as the capital we have used for remodeling existing locations as well as depreciation associated with additional infrastructure and technology assets. The increase in depreciation due to investments made in new locations as well as the capital we have used for remodeling existing locations was mostly offset by certain existing assets reaching the end of their depreciable lives during fiscal 2015.
Selling, General and Administrative Expenses
Fiscal Year 2016 Ended | Fiscal Year 2015 Ended | Fiscal 2016 vs Fiscal 2015 | Fiscal Year 2014 Ended | Fiscal 2015 vs Fiscal 2014 | |||||||||||||
($000s) | August 31, 2016 | August 26, 2015 | Increase/ (Decrease) | August 27, 2014 | Increase/ (Decrease) | ||||||||||||
(53 weeks) | (52 weeks) | (53 vs 52 weeks) | (52 weeks) | (52 vs 52 weeks) | |||||||||||||
General and administrative expenses | $ | 36,808 | $ | 35,557 | 3.5 | % | $ | 36,814 | (3.4 | )% | |||||||
Marketing and advertising expenses | 5,614 | 3,202 | 75.3 | % | 3,893 | (17.7 | )% | ||||||||||
Selling, general and administrative expenses | $ | 42,422 | $ | 38,759 | 9.5 | % | $ | 40,707 | (4.8 | )% | |||||||
As percent of total sales | 10.5 | % | 9.8 | % | 0.7 | % | 10.3 | % | (0.5 | )% | |||||||
Selling, general and administrative expenses include corporate salaries and benefits-related costs, including restaurant area leaders, share-based compensation, professional fees, travel and recruiting expenses and other office expenses. Selling, general and administrative expenses increased by approximately $3.7 million, or 9.5%, in fiscal 2016 compared to fiscal 2015. Increases in selling, general and administrative expense include (1) an approximate $2.4 million increase in marketing and advertising expense; (2) an approximate $0.7 million increase in outside professional service fees and employee moving costs; (3) a net increase of $0.4 million in salaries and benefits expense, health insurance costs and employee travel costs; and (4) an approximate net increase of $0.2 million in corporate supplies and other corporate overhead costs. Certain expenses, were impacted with the additional week of operations in fiscal 2016 with salaries and benefits expense for the additional week comprising the largest portion of this impact. The $2.4 million increase in marketing and advertising expenses is intended to motivate increased guest visits, increased frequency of visits and increased overall brand awareness. This includes sponsorships and partnerships with sports teams that we believe enhance our visibility and appeal within our core markets. As a percentage of total sales, Selling, general and administrative expenses increased to 10.5% in fiscal 2016 compared to 9.8% in fiscal 2015 primarily due to increases in the expenses enumerated above.
Selling, general and administrative expenses decreased by approximately $1.9 million or 4.8%, in fiscal 2015 compared to fiscal 2014. The decrease was due primarily to a decrease in outside professional services costs, decreased marketing and advertising expense, lower expenditures for corporate supplies, lower health insurance costs, lower general liability insurance
33
costs and a reduction in other corporate overhead costs; these cost reductions were partially offset by higher compensation expenses. As a percentage of total sales, Selling, general and administrative expenses decreased to 9.8% in fiscal 2015 compared to 10.3% in fiscal 2014 primarily due to decreases in the expenses enumerated above while total revenue remained relatively constant.
Provision for Asset Impairments and Restaurant Closings, net
The provision for asset impairment and restaurant closings, net, of approximately $1.4 million in fiscal 2016 reflects (1) a $1.2 million impairment for one owned Fuddruckers location and three leased Fuddruckers locations; (2) a $0.2 million charge for restaurant closings related to three Fuddruckers locations and one Luby's Cafeteria location; and (3) a $38 thousand impairment of Goodwill. The $0.2 million charge for restaurant closings includes the total amount of rent and other direct costs for the remaining period of time the properties will be unoccupied plus the value of the amount by which the rent we pay to the landlord exceeds any rent paid to us by a tenant under a sublease over the remaining period of the lease terms.
The asset impairment of approximately $0.6 million in fiscal 2015 reflects the impairment of three leased Fuddruckers locations.
The asset impairment of approximately $2.7 million in fiscal 2014 reflects the impairment of one operating Luby’s Cafeteria, two operating Fuddruckers restaurants, two operating Cheeseburger in Paradise restaurants and nine closed Cheeseburger in Paradise restaurants.
Net Gain on Disposition of Property and Equipment
The disposition of property and equipment in fiscal 2016 resulted in a net gain of approximately $0.7 million, which included (1) the gain on the sale of one property where we operated a cafeteria up until the time of the sale offset by (2) normal asset retirement activity.
The disposition of property and equipment in fiscal 2015 resulted in a net gain of approximately $4.0 million, which included (1) the gain on the disposition of three owned Luby’s Cafeteria locations; (2) the gain on the sale of two owned properties which we previously leased to a tenant; offset by (3) normal asset retirement activity in our restaurants.
The disposition of property and equipment in fiscal 2014 resulted in a net gain of approximately $2.4 million, which included (1) the gain on the disposition of two owned Luby’s Cafeteria locations offset by (2) normal asset retirement activity in our restaurants.
Interest Income
Interest income was $4 thousand in fiscal 2016 compared to $4 thousand in fiscal 2015, and compared to $6 thousand in fiscal 2014.
Interest Expense
Interest expense in fiscal 2016 increased approximately $0.1 million compared to fiscal 2015 on slightly higher average debt balances. Interest expense in fiscal 2015 increased approximately $1.1 million compared to fiscal 2014 on higher average debt balances.
Other Income, Net
Other income, net, consisted primarily of the following components: net rental property income and expenses relating to property for which we are the landlord; prepaid sales tax discounts earned through our participation in state tax prepayment programs; and oil and gas royalty income; and dining card sales discounts.
Other income, net, was approximately $0.2 million in fiscal 2016 compared to approximately $0.5 million in fiscal 2015 and approximately $1.1 million in fiscal 2014. Other income, net, decreased approximately $0.3 million in fiscal 2016 compared to fiscal 2015 primarily related to an increase in discounts related to sale of pre-paid gift cards. Other income, net, decreased approximately $0.6 million in fiscal 2015 compared to fiscal 2014 primarily related to an increase in discounts related to sale of pre-paid gift cards.
34
Taxes
The income tax provision related to continuing operations for fiscal 2016 was approximately $4.9 million compared to an income tax benefit of approximately $1.1 million for fiscal 2015 and an income tax benefit of approximately $1.7 million for fiscal 2014. The income tax provision in fiscal 2016 reflects recording a deferred tax asset valuation allowance of $6.9 million offset by recording a tax benefit related to the pre-tax loss for the year adjusted for state income taxes, and general business and foreign tax credits. The deferred tax valuation allowance of $6.9 million reflects a determination that we might not fully realize the value of our deferred tax assets. The income tax benefit in each of fiscal 2015 and 2014 reflects the tax effect of the pre-tax loss for the year adjusted for state income taxes, and general business and foreign tax credits.
Discontinued Operations
Fiscal Year Ended | ||||||||||||
($000s) | August 31, 2016 | August 26, 2015 | August 27, 2014 | |||||||||
(53 weeks) | (52 weeks) | (52 weeks) | ||||||||||
Discontinued operating losses | $ | (161 | ) | $ | (891 | ) | $ | (1,428 | ) | |||
Impairments | — | (90 | ) | (981 | ) | |||||||
Net gains (losses) | 25 | 117 | (6 | ) | ||||||||
Pretax loss | $ | (136 | ) | $ | (864 | ) | $ | (2,415 | ) | |||
Income tax benefit from discontinued operations | 46 | 406 | 979 | |||||||||
Loss from discontinued operations, net of income taxes | $ | (90 | ) | $ | (458 | ) | $ | (1,436 | ) | |||
The loss from discontinued operations, net of income taxes was approximately $0.1 million in fiscal 2016 compared to a loss of approximately $0.5 million in fiscal 2015 and a loss of approximately $1.4 million in fiscal 2014. The loss of $0.1 million in fiscal 2016 included (1) less than $0.2 million in “carrying costs” (typically rent, property taxes, utilities, and maintenance) associated with assets that were related to discontinued operations), partially offset by (2) a less than $0.1 million income tax benefit related to discontinued operations. The loss of $0.5 million in fiscal 2015 included (1) $0.9 million in carrying costs associated with assets that were related to discontinued operations; (2) impairment charges of approximately $0.1 million for certain assets related to discontinued operations; offset by (3) an approximate $0.1 million gain on sale of assets that were related to discontinued operations; and (4) a $0.4 million income tax benefit related to discontinued operations. The loss of $1.4 million in fiscal 2014 included (1) $1.4 million in carrying costs associated with assets that were related to discontinued operations; (2) impairment charges of $1.0 million for certain assets related to discontinued operations; offset by (3) a $1.0 million income tax benefit related to discontinued operations.
LIQUIDITY AND CAPITAL RESOURCES
Cash and Cash Equivalents
General. Our primary sources of short-term and long-term liquidity are cash flows from operations and our revolving credit facility.
Cash and cash equivalents decreased approximately $0.2 million as of the end of fiscal 2016 compared to the end of fiscal 2015. Cash provided by operating activities of approximately $13.8 million was offset by cash used in investing activities of approximately $13.4 million and cash used in financing activities of approximately $0.6 million.
Cash flow from operations was favorably impacted by increased restaurant sales, decreased other operating expenses and cost of Food in fiscal 2016 compared to fiscal 2015 but unfavorably impacted by increased cost of payroll and related costs. We decreased our net borrowings from our revolving credit facility in fiscal 2016 compared to fiscal 2015 primarily due to decreases in our capital expenditures and the increase in cash provided by operations. We plan to continue the level of capital expenditures necessary to keep our restaurants attractive and operating efficiently.
Cash and cash equivalents decreased approximately $1.3 million as of the end of fiscal 2015 compared to the end of fiscal 2014. Cash provided by operating activities of approximately $10.3 million wash offset by cash used in investing activities of approximately $7.0 million and cash used in financing activities of approximately $4.6 million.
35
Cash flow from operations was favorably impacted by increased restaurant sales in fiscal 2015 compared to fiscal 2014 but unfavorably impacted by increased cost of food, payroll and related costs, occupancy costs and other operating costs. We decreased our net borrowings from our revolving credit facility in fiscal 2015 compared to fiscal 2014 primarily due to decreases in our capital expenditures and the utilization of net proceeds from property sales. We plan to continue the level of capital expenditures necessary to keep our restaurants attractive and operating efficiently.
Our cash requirements for fiscal 2016 consisted principally of:
• | payments to reduce our debt; |
• | capital expenditures for construction, restaurant renovations and upgrades, information technology and culinary contract services development; and |
• | working capital primarily for our Company-owned restaurants and culinary contract services agreements. |
Based upon our level of past and projected capital requirements, we expect that proceeds from the sale of assets and cash flows from operations, combined with other financing alternatives in place or available, will be sufficient to meet our capital expenditures and working capital requirements during the next twelve months.
As is common in the restaurant industry, we maintain relatively low levels of accounts receivable and inventories and our vendors grant trade credit for purchases such as food and supplies. However, higher levels of accounts receivable are typical for culinary contract services and franchises. We also continually invest in our business through the addition of new units and refurbishment of existing units, which are reflected as long-term assets.
The following table summarizes our cash flows from operating, investing and financing activities:
Fiscal Year Ended | ||||||||||||
August 31, 2016 | August 26, 2015 | August 27, 2014 | ||||||||||
(53 weeks) | (52 weeks) | (52 weeks) | ||||||||||
(In thousands) | ||||||||||||
Total cash provided by (used in): | ||||||||||||
Operating activities | $ | 13,859 | $ | 10,316 | $ | 20,439 | ||||||
Investing activities | (13,442 | ) | (7,043 | ) | (42,031 | ) | ||||||
Financing activities | (579 | ) | (4,560 | ) | 22,852 | |||||||
Increase (decrease) in cash and cash equivalents | $ | (162 | ) | $ | (1,287 | ) | $ | 1,260 | ||||
Operating Activities. Cash flow from operating activities increased from approximately $10.3 million in fiscal 2015 to approximately $13.8 million in fiscal 2016. The $3.5 million increase in cash provided by operating activities was primarily due to a $3.2 million increase in cash provided by operations before changes in operating assets and liabilities and a $0.3 million in cash provided by changes in operating assets and liabilities.
The $3.2 million increase in cash provided by operating activities before changes in operating assets and liabilities was primarily due to an approximate $3.7 million increase in company-owned restaurant segment level profit and an approximate $0.1 million increase in culinary contract services and an approximate $0.1 million in franchise operations profit, respectively. Additionally, an approximate $2.0 million decrease in opening costs, an approximate $0.4 million decrease in the loss on discontinued operations, a decrease of approximately $0.5 million in corporate travel costs recorded in Selling, general and administrative expenses, and an approximate decrease of $0.1 million in interest expense each contributed to the increase in cash provided by operating activities before changes in operating assets and liabilities. These contributors to increases in cash from operating activities before changes in operating assets and liabilities were offset by increases in selling, general and administrative costs of an approximate $2.4 million in advertising costs, an approximate $0.6 million in professional services, and an approximate $0.7 million of non-cash compensation costs.
The $0.3 million in cash provided by changes in operating assets and liabilities was primarily due to approximately $1.2 million increase in the change of accounts payable, accrued expenses and other liabilities, approximately $0.5 million decrease in prepaid expenses and other liabilities, and approximately $0.3 million decrease in trade accounts receivable and other receivables offset by approximately $1.7 million increase in the change of food and supply inventories in fiscal 2016 compared to fiscal 2015.
36
Cash flow from operating activities decreased from $20.4 million in fiscal 2014 to $10.3 million in fiscal 2015. The $10.1 million decrease in cash flow from operating activities was primarily due to approximately $0.3 million decrease in cash provided by operations before changes in operating assets and liabilities and approximately $9.8 million decrease in cash provided by changes in operating assets and liabilities.
Investing Activities. We generally reinvest available cash flows from operations to develop new restaurants, enhance existing restaurants and to support culinary contract services. Cash used in investing activities was approximately $13.4 million in fiscal 2016 compared to cash used in investing activities of approximately $7.0 million in fiscal 2015. In fiscal 2016, proceeds from disposal of assets and property held for sale was $4.8 million. In fiscal 2016, purchases of property and equipment was approximately $18.3 million, including $17.3 million in capital expenditures related to Company-owned restaurants and $1.0 million in corporate related capital expenditures. Company-owned restaurant capital expenditures included purchases of new equipment, restaurant renovations and upgrades and new restaurant construction. Our capital expenditure program includes, among other things, investments in new restaurants, restaurant remodeling, and information technology enhancements.
Cash used in investing activities was approximately $7.0 million in fiscal 2015 compared to cash used in investing activities of approximately $42.0 million in fiscal 2014. In fiscal 2015, proceeds from disposal of assets, insurance and property held for sale was approximately $13.3 million including $1.6 million related to discontinued operations. In fiscal 2015, purchases of property and equipment was approximately $20.4 million, including $19.7 million in capital expenditures related to company-owned restaurants, $0.7 million in corporate related capital expenditures. Company-owned restaurant capital expenditures included purchases of new equipment and new restaurant construction. Our capital expenditure program included, among other things, investments in new restaurants, restaurant remodeling, and information technology enhancements.
Financing Activities. Cash used in financing activities was approximately $0.6 million in fiscal 2016 and in fiscal 2015 cash used in financing activities was approximately $4.6 million. In fiscal 2016, we decreased debt from $37.5 million at the end of fiscal 2015 to $37.0 million at the end of fiscal 2016. In fiscal 2016, we paid approximately $42.0 thousand in debt issuance costs and received approximately $0.1 million in proceeds from the exercise of employee stock options.
In fiscal 2015, we decreased debt from $42.0 million at the end of fiscal 2014 to $37.5 million at the end of fiscal 2015. In fiscal 2015, we paid approximately $0.3 million in debt issuance costs and received approximately $0.2 million in proceeds from the exercise of employee stock options.
STATUS OF LONG-TERM INVESTMENTS AND LIQUIDITY
At August 31, 2016, we did not hold any long-term investments.
STATUS OF TRADE ACCOUNTS AND OTHER RECEIVABLES, NET
We monitor the aging of our receivables, including Fuddruckers franchising related receivables, and record provisions for uncollectability, as appropriate. Credit terms of accounts receivable associated with our CCS business vary from 30 to 45 days based on contract terms.
WORKING CAPITAL
At fiscal year-end 2016, current assets increased approximately $0.4 million including a decrease of approximately $0.2 million in cash. Trade accounts and other receivables and food and supply inventory increased approximately $0.8 million and $0.1 million, respectively. Prepaid expenses decreased approximately $0.3 million. The $0.8 million increase in trade accounts and other receivables was primarily due to increases in receivables related to our culinary contract services. The $0.1 million increase in food and supply inventory was primarily due to moderately higher spending for restaurant supplies. The $0.3 million decrease in prepaid expenses was primarily due to a reduction in prepayments of health insurance premiums and rent.
At fiscal year-end 2016, current liabilities decreased approximately $2.8 million due to an approximate $2.6 million decrease in accounts payable and a decrease in accrued expenses and other liabilities of approximately $0.2 million. The $2.6 million decrease in accounts payable was due to an approximate $1.7 million decrease in accrued purchases and an approximate $0.9 million decrease in checks in transit. The decrease of approximately $0.2 million in accrued expenses and other liabilities is a result of increases in unredeemed gift cards of $0.8 million, accrued claims and other expenses of approximately $0.3 million, accrued claims of approximately $0.3 million, and accrued property taxes of approximately $0.1 million, partially offset by decreases in accruals for expenses in salaries and incentives of approximately $1.2 million, and income taxes, legal and other of approximately $0.2 million.
37
CAPITAL EXPENDITURES
Capital expenditures consist of purchases of real estate for future restaurant sites, culinary contract services investments, new unit construction, purchases of new and replacement restaurant furniture and equipment, and ongoing remodeling programs. Capital expenditures for fiscal 2016 were approximately $18.3 million and related primarily to existing restaurant remodels, recurring maintenance of our existing units, investments in new technology and new restaurant construction. We expect to be able to fund all capital expenditures in fiscal 2017 using cash flows from operations, proceeds from the sale of assets and our available credit. In fiscal year 2017, we expect to invest up to $20.0 million, excluding the purchase of land for development, for recurring maintenance for our restaurant properties, information technology investments, and for our on-going remodeling program.
DEBT
Senior Secured Credit Agreement
On November 8, 2016, we entered into a $65.0 million Senior Secured Credit Facility with Wells Fargo Bank, National Association, as Administrative Agent and Cadence Bank, NA and Texas Capital Bank, NA, as lenders (“2016 Credit Agreement”). The $65.0 million Senior Secured Credit Agreement is comprised of a $30.0 million 5-year Revolver (the “Revolver”) and a $35.0 million 5-year Term Loan (the “Term Loan”). The maturity date of the 2016 Credit Agreement is November 8, 2021. For this section of the form 10-K, capitalized terms that are used but not otherwise defined shall have the meanings give to such terms in the 2016 Credit Agreement.
The Term Loan and, or, Revolver commitments may be increased by up to an additional $10 million in the aggregate.
The 2016 Credit Agreement also provides for the issuance of letters of credit in an aggregate amount equal to the lesser of $5.0 million and the Revolving Credit Commitment, which was $30 million as of November 8, 2016. The 2016 Credit Agreement is guaranteed by all of the Company’s present subsidiaries and will be guaranteed by our future subsidiaries.
At any time throughout the term of the 2016 Credit Agreement, we have the option to elect one of two bases of interest rates. One interest rate option is the highest of (a) the Prime Rate, (b) the Federal Funds Rate plus 0.50% and (c) 30-day LIBOR plus 1%, plus, in each case, the Applicable Margin, which ranges from 1.50% to 2.50% per annum. The other interest rate option is the LIBOR plus the Applicable Margin, which ranges from 2.50% to 3.50% per annum. The Applicable Margin under each option is dependent upon our Consolidated Total Lease Adjusted Leverage Ratio ("CTLAL") at the most recent quarterly determination date.
The Term Loan amortizes 7.0% per year (35.0% in 5 years) which includes the quarterly payment of principal. We must enter into an interest rate swap covering at least 50% of the outstanding Term Loan within 60 days of the closing date.
We are obligated to pay to the Administrative Agent for the account of each lender a quarterly commitment fee based on the average daily unused amount of the commitment of such lender, ranging from 0.30% to 0.35% per annum depending on the CTLAL at the most recent quarterly determination date.
The proceeds of the 2016 Credit Agreement are available for us to (i) pay in full all indebtedness outstanding under the 2013 Credit Agreement as of November 8, 2016, (ii) pay fees, commissions, and expenses in connection with our repayment of the 2013 Credit Agreement, initial Extensions of Credit under the 2016 Credit Agreement, and (iii) for working capital and general corporate purposes of the Company.
The 2016 Credit Agreement, as amended, contains the following covenants among others:
• | CTLAL of not more than (i) 5.00 to 1.00 at all times through and including the third fiscal quarter of the Borrower’s fiscal year 2018, and (ii) 4.75 to 1.00 at all times thereafter, |
• | Consolidated Fixed Charge Coverage Ratio of not less than 1.25 to 1.00 at all times, |
• | Limit on Growth Capital Expenditures so long as the CTLAL is at least 0.25 to 1.00 less than the then-applicable permitted maximum CTLAL, |
• | restrictions on mergers, acquisitions, consolidations, and asset sales, |
• | restrictions on the payment of dividends, redemption of stock, and other distributions, |
• | restrictions on incurring indebtedness, including certain guarantees, and capital lease obligations, |
• | restrictions on incurring liens on certain of our property and the property of our subsidiaries, |
• | restrictions on transactions with affiliates and materially changing our business, |
• | restrictions on making certain investments, loans, advances, and guarantees, |
• | restrictions on selling assets outside the ordinary course of business, |
• | prohibitions on entering into sale and leaseback transactions, and |
38
• | restrictions on certain acquisitions of all or a substantial portion of the assets, property and/or equity interests of any person, including share repurchases and dividends. |
The 2016 Credit Agreement is secured by an all asset lien on all of our real property and also includes customary events of default. If a default occurs and is continuing, the lenders’ commitments under the 2016 Credit Agreement may be immediately terminated, and, or we may be required to repay all amounts outstanding under the 2016 Credit Agreement.
2013 Credit Facility
In August 2013, we entered into a $70.0 million revolving credit facility with Wells Fargo Bank, National Association, as Administrative Agent, and ZB, N.A. dba Amegy Bank (formerly Amegy Bank, N.A.), as Syndication Agent. Pursuant to the October 2, 2015 amendment, the total aggregate amount of the lenders' commitments was lowered to $60 million from $70 million. The following description summarizes the material terms of the revolving credit facility, as subsequently amended on March 21, 2014, November 7, 2014 and October 2, 2015, (the revolving credit facility is referred to as the “2013 Credit Facility”). The 2013 Credit Facility is governed by the credit agreement dated as of August 14, 2013 (the “2013 Credit Agreement”) among us, the lenders from time to time party thereto, Wells Fargo Bank, National Association, as Administrative Agent, and ZB, N.A. dba Amegy Bank (formerly Amegy Bank, N.A.), as Syndication Agent. The maturity date of the 2013 Credit Facility was September 1, 2017. In addition to the $60 million commitment under the 2013 Credit Agreement, it may have been increased to a maximum commitment of $80 million.
The 2013 Credit Facility also provided for the issuance of letters of credit in a maximum aggregate amount of $5.0 million outstanding as of August 14, 2013 and $15.0 million outstanding at any one time with prior written consent of the Administrative Agent and the Issuing Bank. The 2013 Credit Facility was guaranteed by all of our present subsidiaries and was to be guaranteed by our future subsidiaries.
At August 31, 2016, after applying the Lease Adjusted Leverage Ratio limitation, the available borrowing capacity was approximately $21.4 million.
At any time throughout the term of the 2013 Credit Facility, we had the option to elect one of two basis of interest rates. One interest rate option was the greater of (a) the Federal Funds Effective Rate plus 0.50%, or (b) prime, plus, in either case, an applicable spread that ranged from 0.75% to 2.25% per annum. The other interest rate option is the London InterBank Offered Rate plus a spread that ranged from 2.50% to 4.00% per annum. The applicable spread under each option is dependent upon the ratio of our debt to EBITDA at the most recent determination date.
We were obligated to pay to the Administrative Agent for the account of each lender a quarterly commitment fee based on the average daily unused amount of the commitment of such lender, ranging from 0.30% to 0.40% per annum depending on the Total Leverage Ratio at the most recent determination date.
The proceeds of the 2013 Credit Facility were available for our general corporate purposes and general working capital purposes and capital expenditures.
Borrowings under the 2013 Credit Facility were subject to mandatory repayment with the proceeds of sales of certain of our real property, subject to certain exceptions.
The 2013 Credit Agreement, as amended, contained the following covenants among others:
• | Debt Service Coverage Ratio of not less than (i) 1.10 to 1.00 at all times during the first, second and third fiscal quarters of the Borrower’s fiscal year 2015, (ii) 1.25 to 1.00 at all times during the fourth fiscal quarter of the Borrower’s fiscal year 2015, and (iii) 1.50 to 1.00 at all times thereafter, |
• | Lease Adjusted Leverage Ratio of not more than (i) 5.75 to 1.00 at all times during the first, second and third fiscal quarters of the Borrower’s fiscal year 2015, (ii) 5.50 to 1.00 at all times during the fourth fiscal quarter of the Borrower’s fiscal year 2015, (iii) 5.25 to 1.00 at all times during the first fiscal quarter of the Borrower’s fiscal year 2016, (iv) 5.00 to 1.00 at all times during the second fiscal quarter of the Borrower’s fiscal year 2016, and (v) 4.75 to 1.00 at all times thereafter, |
• | capital expenditures limited to $25.0 million per year, |
• | restrictions on incurring liens on certain of our property and the property of our subsidiaries, |
• | restrictions on transactions with affiliates and materially changing our business, |
• | restrictions on making certain investments, loans, advances and guarantees, |
• | restrictions on selling assets outside the ordinary course of business, |
39
• | prohibitions on entering into sale and leaseback transactions, and |
• | restrictions on certain acquisitions of all or a substantial portion of the assets, property and/or equity interests of any person, including share repurchases and dividends. |
At February 12, 2014, as the result of losses incurred from our acquired leaseholds operating as Cheeseburger in Paradise restaurants, we reported our second consecutive quarterly net profit below our required minimum net profit as defined in the 2012 Credit Agreement. As part of the March 21, 2014 amendment we received a waiver of non-compliance related to this minimum consecutive quarterly net profit debt covenant for the second quarter fiscal 2014. The November 2014 amendment revised the net profit, debt service, lease adjusted leverage ratio, borrowing rates, provided for a $25.0 million annual capital expenditure limit, and required liens to be perfected on all real property by January 31, 2015. As part of the October 2, 2015 amendment, the Net Profit – Two Consecutive Quarters covenant was removed.
The 2013 Credit Agreement also included customary events of default. If a default occurred and was continuing, the lenders’ commitments under the 2013 Credit Facility may have be immediately terminated and, or we could have been required to repay all amounts outstanding under the 2013 Credit Facility.
The 2013 Credit Facility was secured by a perfected first priority lien on certain of our real property and all of the material personal property owned by us or any of our subsidiaries, other than certain excluded assets (as defined in the Credit Agreement). At August 31, 2016, the carrying value of the collateral securing the 2013 Credit Facility was approximately $114.1 million.
As of August 31, 2016, we had $37.0 million in outstanding loans and approximately $1.3 million committed under letters of credit, which were issued as security for the payment of insurance obligations and approximately $0.4 million in capital lease commitments.
We were in compliance with the covenants contained in the 2013 Credit Agreement as amended as of August 31, 2016.
COMMITMENTS AND CONTINGENCIES
Off-Balance Sheet Arrangements
We have no off-balance sheet arrangements except for operating leases for our corporate office, facility service warehouse and certain restaurant properties.
Claims
From time to time, we are subject to various other private lawsuits, administrative proceedings and claims that arise in the ordinary course of our business. A number of these lawsuits, proceedings and claims may exist at any given time. These matters typically involve claims from guests, employees and others related to issues common to the restaurant industry. We currently believe that the final disposition of these types of lawsuits, proceedings and claims will not have a material adverse effect on our financial position, results of operations or liquidity. It is possible, however, that our future results of operations for a particular quarter or fiscal year could be impacted by changes in circumstances relating to lawsuits, proceedings or claims.
Construction Activity
From time to time, we enter into non-cancelable contracts for the construction of our new restaurants and restaurant remodels. This construction activity exposes us to the risks inherent in this industry including but not limited to rising material prices, labor shortages, delays in getting required permits and inspections, adverse weather conditions, and injuries sustained by workers.
40
Contractual Obligations
At August 31, 2016, we had contractual obligations and other commercial commitments as described below:
Payments due by Period | |||||||||||||||||||
Contractual Obligations | Total | Less than 1 Year | 1-3 Years | 3-5 Years | After 5 Years | ||||||||||||||
(In thousands) | |||||||||||||||||||
Long-term debt (a) | $ | 37,000 | $ | — | $ | 37,000 | $ | — | $ | — | |||||||||
Capital lease and other obligations(b) | 351 | 307 | 44 | — | — | ||||||||||||||
Operating lease obligations (c) | 76,382 | 12,241 | 20,455 | 12,974 | 30,712 | ||||||||||||||
Uncertain tax positions liability (d) | 45 | 45 | — | — | — | ||||||||||||||
Total | $ | 113,778 | $ | 12,593 | $ | 57,499 | $ | 12,974 | $ | 30,712 | |||||||||
Amount of Commitment by Expiration Period | |||||||||||||||||||
Other Commercial Commitments | Total | Fiscal 2017 | Fiscal 2018-2019 | Fiscal 2019-2020 | Thereafter | ||||||||||||||
(In thousands) | |||||||||||||||||||
Letters of credit | $ | 1,287 | $ | 1,287 | $ | — | $ | — | $ | — | |||||||||
(a) | Long-term debt consists of amounts owed on the 2013 Credit Facility. On November 8, 2016, the Company refinanced its 2013 Credit Facility with the 2016 Credit Agreement. |
(b) | Capital lease obligations contain leases for equipment and notes relating to automobile purchases. |
(c) | Operating lease obligations contain rent escalations and renewal options ranging from one to twenty-five years. |
(d) | The timing and amounts of future cash payments related to these liabilities are uncertain. |
In addition to the commitments described above, we enter into a number of cancelable and noncancelable commitments during each fiscal year. Typically, these commitments expire within one year and are generally focused on food inventory. We do not maintain any long-term or exclusive commitments or arrangements to purchase products from any single supplier. Substantially all of our product purchase commitments are cancelable up to 30 days prior to the vendor’s scheduled shipment date.
Long-term liabilities reflected in our consolidated financial statements as of August 31, 2016 included amounts accrued for benefit payments under our supplemental executive retirement plan of approximately $0.1 million, accrued non-cash compensation of approximately $0.8 million, accrued insurance reserves of approximately $1.0 million, and deferred rent liabilities of approximately $2.5 million.
We are also contractually obligated to our Chief Executive Officer pursuant to an employment agreement. See “Affiliations and Related Parties” below for further information.
41
AFFILIATIONS AND RELATED PARTIES
Affiliate Services
Our Chief Executive Officer, Christopher J. Pappas, and one of our directors and our former Chief Operating Officer, Harris J. Pappas, own two restaurant entities (the “Pappas entities”) that may from time to time provide services to Luby’s, Inc. and its subsidiaries, as detailed in the Amended and Restated Master Sales Agreement dated November 8, 2013 among us and the Pappas entities (the “Master Sales Agreement”).
Under the terms of the Amended and Restated Master Sales Agreement, the Pappas entities may provide specialized (customized) equipment fabrication primarily for new construction and basic equipment maintenance, including stainless steel stoves, shelving, rolling carts, and chef tables. The total costs under the Amended and Restated Master Sales Agreement of custom-fabricated and refurbished equipment were $2,000, zero, and $4,000 in fiscal 2016, 2015, and 2014, respectively. Services provided under this agreement are subject to review and approval by the Finance and Audit Committee of our Board of Directors.
Operating Leases
In the third quarter of the fiscal year 2004, Messrs. Pappas became partners in a limited partnership which purchased a retail strip center in Houston, Texas. Messrs. Pappas collectively own a 50% limited partner interest and a 50% general partner interest in the limited partnership. An independent third party company manages the center. One of the Company’s restaurants has rented approximately 7% of the space in that center since July 1969. No changes were made to the Company’s lease terms as a result of the transfer of ownership of the center to the new partnership.
On November 22, 2006, due to the approaching expiration of the previous lease, the Company executed a new lease agreement with respect to this property, which provides, effective upon the Company’s relocation and occupancy into the new space in July 2008, for a primary term of approximately 12 years with two subsequent five-year options. The new lease also gave the landlord an option to buy out the tenant on or after the calendar year 2015 by paying the then unamortized cost of improvements to the tenant. The Company is currently obligated to pay rent of $22.00 per square foot plus maintenance, taxes, and insurance for the remaining primary term of the lease. Thereafter, the lease provides for increases in rent at set intervals. The Company has made payments of approximately $417,000, $416,000, and $388,000 during fiscal years 2016, 2015, and 2014, respectively. The new lease agreement was approved by the Finance and Audit Committee of our Board of Directors.
In the third quarter of fiscal year 2014, on March 12, 2014, the Company executed a new lease agreement for one of the Company’s Houston Fuddruckers locations with Pappas Restaurants, Inc. The lease provides for a primary term of approximately six years with two subsequent five-year options. Pursuant to the new ground lease agreement, the Company is currently obligated to pay $27.56 per square foot plus maintenance, taxes, and insurance from March 12, 2014 until November 30, 2016. Thereafter, the new ground lease agreement provides for increases in rent at set intervals. The Company made payments of $159,900, $159,900, and $79,950 during fiscal years 2016, 2015, and 2014, respectively.
Affiliated rents paid for these Houston property leases represented 2.6%, 2.7%, and 2.1% of the total rents for continuing operations in fiscal 2016, 2015, and 2014, respectively.
42
The following table compares current and prior two fiscal years charges incurred under the Amended and Restated Master Sales Agreement, affiliated property leases, and other related party agreements to our total capital expenditures, as well as relative selling, general and administrative expenses, and other operating expenses included in continuing operations:
Fiscal Year Ended | |||||||||||
August 31, 2016 | August 26, 2015 | August 27, 2014 | |||||||||
(371 days) | (364 days) | (364 days) | |||||||||
(In thousands, except percentages) | |||||||||||
AFFILIATED COSTS INCURRED: | |||||||||||
Selling, general and administrative expenses—professional and other costs | $ | 1 | $ | 1 | $ | — | |||||
Capital expenditures—custom-fabricated and refurbished equipment | 2 | — | 4 | ||||||||
Other operating expenses, occupancy costs and opening costs, including property leases | 576 | 576 | 468 | ||||||||
Total | $ | 579 | $ | 577 | $ | 472 | |||||
RELATIVE TOTAL COMPANY COSTS: | |||||||||||
Selling, general and administrative expenses | $ | 42,422 | $ | 38,759 | $ | 40,707 | |||||
Capital expenditures | 18,253 | 20,378 | 46,184 | ||||||||
Other operating expenses, occupancy costs and opening costs | 84,122 | 86,960 | 86,262 | ||||||||
Total | $ | 144,797 | $ | 146,097 | $ | 173,153 | |||||
AFFILIATED COSTS INCURRED AS A PERCENTAGE OF RELATIVE TOTAL COMPANY COSTS | 0.40 | % | 0.39 | % | 0.27 | % | |||||
The Company entered into a new employment agreement with Christopher Pappas on January 24, 2014. The employment agreement was amended on February 4, 2016, to extend the termination date thereof to August 31, 2017, unless earlier terminated. Mr. Pappas continues to devote his primary time and business efforts to the Company while maintaining his role at Pappas Restaurants, Inc. The Employment Agreement was unanimously approved by the Executive Compensation Committee (the “Committee”) of the Board as well as by the full Board.
Peter Tropoli, a director of the Company and the Company's Chief Operating Officer, and formerly our Senior Vice President, Administration, General Counsel and Secretary, is an attorney and stepson of Frank Markantonis, who is a director of Luby’s, Inc.
Paulette Gerukos, our Vice President of Human Resources, is the sister-in-law of Harris J. Pappas, who is a director of Luby’s, Inc.
43
CRITICAL ACCOUNTING POLICIES AND ESTIMATES
Our accounting policies are described in Note 1, “Nature of Operations and Significant Accounting Policies,” to our Consolidated Financial Statements included in Item 8 of Part II of this report. The Consolidated Financial Statements are prepared in conformity with accounting principles generally accepted in the United States. Preparation of the financial statements requires us to make judgments, estimates and assumptions that affect the amounts of assets and liabilities in the financial statements and revenues and expenses during the reporting periods. Management believes the following are critical accounting policies due to the significant, subjective and complex judgments and estimates used when preparing our consolidated financial statements. Management regularly reviews these assumptions and estimates with the Finance and Audit Committee of our Board of Directors.
Income Taxes
Our income tax expense, deferred tax assets and liabilities, and liabilities for unrecognized tax benefits reflect management’s best estimate of current and future taxes to be paid. We are subject to income taxes in the United States and a limited number of foreign jurisdictions, involving franchised locations in South America, Mexico, Canada and Italy. Significant judgments and estimates are required in the determination of the consolidated income tax expense. Deferred income taxes arise from temporary differences between the tax basis of assets and liabilities and their reported amounts in the financial statements, which will result in taxable or deductible amounts in the future, as well as from tax Net Operating Losses ("NOL") and tax credit carryovers. We establish a valuation allowance when we no longer consider it more likely than not that a deferred tax asset will be realized. In evaluating our ability to recover our deferred tax assets, we consider available positive and negative evidence, including scheduled reversals of deferred tax liabilities, tax-planning strategies, projected future taxable income, and results of recent operations.
Positive evidence that we consider includes the Company’s history of realizing fully its tax NOL and tax credit carryovers prior to expiration and the considered use of tax-planning strategies. The latter includes the acceleration of unrealized gains from our owned property locations through sale or exchange, if and when necessary on a selective basis, which we consider to be a significant piece of positive evidence. We regularly evaluate our portfolio owned properties, long-lived assets and their relative values, for many different business purposes, and have estimated the resulting unrealized net gains thereon to be of sufficient measure to recover our deferred tax assets, including tax NOL and tax credit carryovers. Assessments regarding our owned property locations involve the use of significant judgment and are consistent with the plans and estimates we are using to manage the underlying businesses. Tax-planning strategies involving the acceleration of unrealized gains, as well as the reversals of our deferred tax liabilities, are of the same character and should reverse in both the same period and jurisdiction as the temporary differences giving rise to the deferred tax. In evaluating negative evidence, we consider three years of cumulative losses. A significant contributor to the Company’s three year cumulative loss involves a number of closed underperforming locations.
The Company has recorded a deferred tax asset of approximately $12.3 million reflecting the benefit of approximately $1.3 million in tax NOL and approximately $11.0 million tax credit carryover, which expire in varying amounts between fiscal year 2022 through 2036. Realization is dependent on generating sufficient taxable income, and if necessary gain on sale of owned property locations, prior to expiration of the tax NOL and tax credit carryovers. Although realization is not assured, management believes it is more likely than not that all of the deferred tax asset will be realized. The amount of the deferred tax asset considered realizable, however, could be reduced in the near term if estimates of unrealized appreciation of owned properties during the carryforward period are reduced or we are unable to generate positive cash flows from operations and proceeds from assets held for sale.
Management makes judgments regarding the interpretation of tax laws that might be challenged upon an audit and cause changes to previous estimates of tax liability. We operate within multiple taxing jurisdictions and are subject to examination in these tax jurisdictions, as well as by the Internal Revenue Service (“IRS”). In management’s opinion, adequate provisions for income taxes have been made for all open income tax periods. The potential outcomes of examinations are regularly assessed in determining the adequacy of the provision for income taxes and income tax liabilities. Management believes that adequate provisions have been made for reasonable and foreseeable outcomes related to uncertain tax matters.
Tangible Property Regulations
In September 2013, the U.S. Treasury issued final regulations addressing the tax consequences associated with the acquisition, production and improvement of tangible property and which are generally effective for taxable years beginning on or after January 1, 2014, which for the Company is its year beginning August 28, 2014. We believe our accounting policies comply with the requirements of the repair regulations and there is no materials impact on our Consolidated Financial Statements.
44
Impairment of Long-Lived Assets
We periodically evaluate long-lived assets held for use and held for sale, whenever events or changes in circumstances indicate that the carrying amount of those assets may not be recoverable. We analyze historical cash flows of operating locations and compare results of poorer performing locations to more profitable locations. We also analyze lease terms, condition of the assets and related need for capital expenditures or repairs, construction activity in the surrounding area as well as the economic and market conditions in the surrounding area.
For assets held for use, we estimate future cash flows using assumptions based on possible outcomes of the areas analyzed. If the undiscounted future cash flows are less than the carrying value of our location’s assets, we record an impairment based on an estimate of discounted cash flows. The estimates of future cash flows, based on reasonable and supportable assumptions and projections, require management’s subjective judgments. Assumptions and estimates used include operating results, changes in working capital, discount rate, growth rate, anticipated net proceeds from disposition of the property and if applicable, lease terms. The span of time for which future cash flows are estimated is often lengthy, increasing the sensitivity to assumptions made. The time span is longer and could be 20 to 25 years for newer properties, but only 5 to 10 years for older properties. Depending on the assumptions and estimates used, the estimated future cash flows projected in the evaluation of long-lived assets can vary within a wide range of outcomes. We consider the likelihood of possible outcomes in determining the best estimate of future cash flows. The measurement for such an impairment loss is then based on the fair value of the asset as determined by discounted cash flows. We operated 174 restaurants as of November 9, 2016 and periodically experience unanticipated changes in our assumptions and estimates. Those changes could have a significant impact on discounted cash flow models with a corresponding significant impact on the measurement of an impairment. Gains are not recognized until the assets are disposed.
We evaluate the useful lives of our other intangible assets, primarily the Fuddruckers trademarks and franchise agreements to determine if they are definite or indefinite-lived. Reaching a determination of useful life requires significant judgments and assumptions regarding the future effects of obsolescence, contract term, demand, competition, other economic factors (such as the stability of the industry, legislative action that results in an uncertain or changing regulatory environment, and expected changes in distribution channels), the level of required maintenance expenditures, and the expected lives of other related groups of assets.
We periodically evaluate our intangible assets, primarily the Fuddruckers trademarks and franchise agreements, to determine if events or changes in circumstances such as economic or market conditions indicate that the carrying amount of the assets may not be recoverable. We analyze historical cash flows of operating locations to determine trends that would indicate a need for impairment. We also analyze royalties and collectability from our franchisees to determine if there are trends that would indicate a need for impairment.
Property Held for Sale
We periodically review long-lived assets against our plans to retain or ultimately dispose of properties. If we decide to dispose of a property, it will be moved to property held for sale and actively marketed. Property held for sale is recorded at amounts not in excess of what management currently expects to receive upon sale, less costs of disposal. We analyze market conditions each reporting period and record additional impairments due to declines in market values of like assets. The fair value of the property is determined by observable inputs such as appraisals and prices of comparable properties in active markets for assets like ours. Gains are not recognized until the properties are sold.
Insurance and Claims
We self-insure a significant portion of risks and associated liabilities under our employee injury, workers’ compensation and general liability programs. We maintain insurance coverage with third party carriers to limit our per-occurrence claim exposure. We have recorded accrued liabilities for self-insurance based upon analysis of historical data and actuarial estimates, and we review these amounts on a quarterly basis to ensure that the liability is appropriate.
The significant assumptions made by the actuary to estimate self-insurance reserves, including incurred but not reported claims, are as follows: (1) historical patterns of loss development will continue in the future as they have in the past (Loss Development Method), (2) historical trend patterns and loss cost levels will continue in the future as they have in the past (Bornhuetter-Ferguson Method), and (3) historical claim counts and exposures are used to calculate historical frequency rates and average claim costs are analyzed to get a projected severity (Frequency and Severity Method). The results of these methods are blended by the actuary to provide the reserves estimates.
45
Actual workers’ compensation, employee injury and general liability claims expense may differ from estimated loss provisions. The ultimate level of claims under the in-house safety program are not known, and declines in incidence of claims as well as claims costs experiences or reductions in reserve requirements under the program may not continue in future periods.
SHARE-BASED COMPENSATION
Share-based compensation is recognized as compensation expense in the income statement utilizing the fair value on the date of the grant. The fair value of performance share based award liabilities are estimated based on a Monte Carlo simulation model. The fair value of restricted stock units is valued at the closing market price of our common stock at the date of grant. The fair value of each option award is estimated on the date of grant using the Black-Scholes option pricing model. Assumptions for volatility, expected option life, risk free interest rate, and dividend yield are used in the model.
NEW ACCOUNTING PRONOUNCEMENTS
In May 2014, the FASB issued ASU 2014-09, Revenue from Contracts with Customers (Topic 606). This update provides a comprehensive new revenue recognition model that requires a company to recognize revenue to depict the transfer of goods or services to a customer at an amount that reflects the consideration it expects to receive in exchange for those goods or services. The guidance also requires additional disclosure about the nature, amount, timing and uncertainty of revenue and cash flows arising from customer contracts. This update is effective for annual and interim periods beginning after December 15, 2017, which will require us to adopt these provisions in the first quarter of fiscal 2019. Early application is not permitted. This update permits the use of either the retrospective or cumulative effect transition method. We are evaluating the effect this guidance will have on our consolidated financial statements and related disclosures. We are evaluating the impact on the Company’s consolidated financial statements and have not yet selected a transition method.
In August 2014, the FASB issued ASU No 2014-15. The amendments in ASU 2014-15 are intended to define management’s responsibility to evaluate whether there is substantial doubt about an organization’s ability to continue as a going concern and to provide related footnote disclosures. Under GAAP, financial statements are prepared under the presumption that the reporting organization will continue to operate as a going concern, except in limited circumstances. The going concern basis of accounting is critical to financial reporting because it establishes the fundamental basis for measuring and classifying assets and liabilities. Currently, GAAP lacks guidance about management’s responsibility to evaluate whether there is substantial doubt about the organization’s ability to continue as a going concern or to provide related footnote disclosures. This ASU provides guidance to an organization’s management, with principles and definitions that are intended to reduce diversity in the timing and content of disclosures that are commonly provided by organizations today in the financial statement footnotes. The pronouncement is effective for fiscal years and interim periods within those fiscal years, after December 31, 2016. The adoption of this pronouncement is not expected to have a material impact on the Company’s financial statements.
In April 2015, the FASB issued ASU 2015-03, Simplifying the Presentation of Debt Issuance Costs. This update requires that debt issuance costs be presented in the balance sheet as a direct deduction from the associated debt liability. This update is effective for annual and interim periods for fiscal years beginning after December 15, 2015, which will require us to adopt these provisions in the first quarter of fiscal 2017. Early adoption is permitted for financial statements that have not been previously issued. This update will be applied on a retrospective basis. The adoption of this update will not have a material impact on our consolidated financial statements.
In July 2015, the FASB issued ASU 2015-11, Simplifying the Measurement of Inventory (Topic 330). This update requires inventory within the scope of the standard to be measured at the lower of cost and net realizable value. Net realizable value is defined as the estimated selling prices in the ordinary course of business, less reasonably predictable costs of completion, disposal, and transportation. This update is effective for annual and interim periods beginning after December 15, 2016, which will require us to adopt these provisions in the first quarter of fiscal 2018. Early adoption is permitted. We do not expect the adoption of this guidance to have a material impact on our consolidated financial statements.
In November 2015, the FASB issued ASU 2015-17, Balance Sheet Classification of Deferred Taxes (Topic 740). This update requires that deferred tax liabilities and assets be classified as noncurrent in a classified balance sheet. This update is effective for annual and interim periods beginning after December 15, 2016, which will require us to adopt these provisions in the first quarter of fiscal 2018. Early adoption is permitted. We do not expect the adoption of this guidance to have a material impact on our consolidated financial statements.
In February 2016, the FASB issued ASU 2016-02, Leases (Topic 842). This update requires a lessee to recognize on the balance sheet a liability to make lease payments and a corresponding right-of-use asset. The update also requires additional disclosures about the amount, timing and uncertainty of cash flows arising from leases. This update is effective for annual and interim
46
periods beginning after December 15, 2018, which will require us to adopt these provisions in the first quarter of fiscal 2020 using a modified retrospective approach. Early adoption is permitted. We are evaluating the impact on the Company’s consolidated financial statements and have not yet selected a transition method.
In March 2016, the FASB issued ASU 2016-09, Improvements to Employee Share-Based Payment Accounting (Topic 718). This update was issued as part of the FASB’s simplification initiative and affects all entities that issue share-based payment awards to their employees. The amendments in this update cover such areas as the recognition of excess tax benefits and deficiencies, the classification of those excess tax benefits on the statement of cash flows, an accounting policy election for forfeitures, the amount an employer can withhold to cover income taxes and still qualify for equity classification and the classification of those taxes paid on the statement of cash flows. This update is effective for annual and interim periods for fiscal years beginning after December 15, 2016, which will require us to adopt these provisions in the first quarter of fiscal 2018. Early adoption is permitted. We are evaluating the impact on the Company’s consolidated financial statements and have not yet selected a transition method.
In August 2016, the FASB issued ASU 2016-15, Statement of Cash Flows (Topic 230). This update provides clarification regarding how certain cash receipts and cash payment are presented and classified in the statement of cash flows. This update addresses eight specific cash flow issues with the objective of reducing the existing diversity in practice. This update is effective for annual and interim periods beginning after December 15, 2017, which will require us to adopt these provisions in the first quarter of fiscal 2019 using a retrospective approach. Early adoption is permitted. We do not expect the adoption of this guidance to have a material impact on our consolidated financial statements.
INFLATION
It is generally our policy to maintain stable menu prices without regard to seasonal variations in food costs. Certain increases in costs of food, wages, supplies, transportation and services may require us to increase our menu prices from time to time. To the extent prevailing market conditions allow, we intend to adjust menu prices to maintain profit margins.
Item 7A. Quantitative and Qualitative Disclosures About Market Risk
We are exposed to market risk from changes in interest rates affecting our variable-rate debt. As of fiscal year-end 2016, the total amount of debt subject to interest rate fluctuations outstanding under our 2013 Credit Agreement was $37.0 million. Assuming an average debt balance of $37.0 million, a 1.0% increase in prevailing interest rates would increase our annual interest expense by $0.4 million.
Effective no more than 60 days after November 8, 2016, we are required to manage interest rate risk, utilizing interest rate swaps, on at least 50% of our 2016 Credit Agreement variable rate debt (Term Loan). Prior to November 8, 2016, we did not utilize any interest rate swaps to manage interest rate risk on our variable rate 2013 Credit Facility debt.
We have exposure to various foreign currency exchange rate fluctuations for revenues generated by our operations outside of the United States, which can adversely impact our net income and cash flows. Approximately 0.13%, 0.12%, and 0.08% of our total revenues in fiscal years 2016, 2015, and 2014, respectively, were derived from sales to customers and royalties from franchisees outside the contiguous United States. All of this business is conducted in the local currency of the country the franchise operates. We do not enter into financial instruments to manage this foreign currency exchange risk.
Many ingredients in the products sold in our restaurants are commodities, subject to unpredictable price fluctuations. We attempt to minimize price volatility by negotiating fixed price contracts for the supply of key ingredients and in some cases by passing increased commodity costs through to the customer by adjusting menu prices or menu offerings. Our ingredients are available from multiple suppliers so we are not dependent on a single vendor for our ingredients.
47
Item 8. Financial Statements and Supplementary Data
Report of Independent Registered Public Accounting Firm
Board of Directors and Shareholders
Luby’s, Inc.
We have audited the accompanying consolidated balance sheets of Luby’s, Inc. (a Delaware corporation) and subsidiaries (the "Company") as of August 31, 2016 and August 26, 2015, and the related consolidated statements of operations, shareholders’ equity, and cash flows for each of the three years in the period ended August 31, 2016. These financial statements are the responsibility of the Company’s management. Our responsibility is to express an opinion on these financial statements based on our audits.
We conducted our audits in accordance with the standards of the Public Company Accounting Oversight Board (United States). Those standards require that we plan and perform the audit to obtain reasonable assurance about whether the financial statements are free of material misstatement. An audit includes examining, on a test basis, evidence supporting the amounts and disclosures in the financial statements. An audit also includes assessing the accounting principles used and significant estimates made by management, as well as evaluating the overall financial statement presentation. We believe that our audits provide a reasonable basis for our opinion.
In our opinion, the consolidated financial statements referred to above present fairly, in all material respects, the financial position of Luby’s, Inc. and subsidiaries as of August 31, 2016 and August 26, 2015, and the results of their operations and their cash flows for each of the three years in the period ended August 31, 2016 in conformity with accounting principles generally accepted in the United States of America.
We also have audited, in accordance with the standards of the Public Company Accounting Oversight Board (United States), the Company's internal control over financial reporting as of August 31, 2016, based on criteria established in Internal Control—Integrated Framework-2013 issued by the Committee of Sponsoring Organizations of the Treadway Commission (COSO), and our report dated November 23, 2016 expressed an unqualified opinion.
/s/ GRANT THORNTON LLP
Houston, Texas
November 23, 2016
48
Report of Independent Registered Public Accounting Firm
Board of Directors and Shareholders
Luby’s, Inc.
We have audited the internal control over financial reporting of Luby’s, Inc. (a Delaware corporation) and its subsidiaries (the "Company") as of August 31, 2016, based on criteria established in Internal Control—Integrated Framework-2013 issued by the Committee of Sponsoring Organizations of the Treadway Commission (COSO). The Company's management is responsible for maintaining effective internal control over financial reporting and for its assessment of the effectiveness of internal control over financial reporting, included in the accompanying Management’s Report on Internal Control Over Financial Reporting. Our responsibility is to express an opinion on the Company's internal control over financial reporting based on our audit.
We conducted our audit in accordance with the standards of the Public Company Accounting Oversight Board (United States). Those standards require that we plan and perform the audit to obtain reasonable assurance about whether effective internal control over financial reporting was maintained in all material respects. Our audit included obtaining an understanding of internal control over financial reporting, assessing the risk that a material weakness exists, testing and evaluating the design and operating effectiveness of internal control based on the assessed risk, and performing such other procedures as we considered necessary in the circumstances. We believe that our audit provides a reasonable basis for our opinion.
A company’s internal control over financial reporting is a process designed to provide reasonable assurance regarding the reliability of financial reporting and the preparation of financial statements for external purposes in accordance with generally accepted accounting principles. A company’s internal control over financial reporting includes those policies and procedures that (1) pertain to the maintenance of records that, in reasonable detail, accurately and fairly reflect the transactions and dispositions of the assets of the company; (2) provide reasonable assurance that transactions are recorded as necessary to permit preparation of financial statements in accordance with generally accepted accounting principles, and that receipts and expenditures of the company are being made only in accordance with authorizations of management and directors of the company; and (3) provide reasonable assurance regarding prevention or timely detection of unauthorized acquisition, use, or disposition of the company’s assets that could have a material effect on the financial statements.
Because of its inherent limitations, internal control over financial reporting may not prevent or detect misstatements. Also, projections of any evaluation of effectiveness to future periods are subject to the risk that controls may become inadequate because of changes in conditions, or that the degree of compliance with the policies or procedures may deteriorate.
In our opinion, the Company maintained, in all material respects, effective internal control over financial reporting as of August 31, 2016, based on criteria established in Internal Control—Integrated Framework-2013 issued by the Committee of Sponsoring Organization of the Treadway Commission (COSO).
We also have audited, in accordance with the standards of the Public Company Accounting Oversight Board (United States), the consolidated financial statements of the Company as of and for the year ended August 31, 2016, and our report dated November 23, 2016 expressed an unqualified opinion on those financial statements.
/s/ GRANT THORNTON LLP
Houston, Texas
November 23, 2016
49
Luby’s, Inc.
Consolidated Balance Sheets
August 31, 2016 | August 26, 2015 | |||||
(In thousands, except share data) | ||||||
ASSETS | ||||||
Current Assets: | ||||||
Cash and cash equivalents | $ | 1,339 | $ | 1,501 | ||
Trade accounts and other receivables, net | 5,919 | 5,175 | ||||
Food and supply inventories | 4,596 | 4,483 | ||||
Prepaid expenses | 3,147 | 3,402 | ||||
Assets related to discontinued operations | 1 | 10 | ||||
Deferred income taxes | 540 | 577 | ||||
Total current assets | 15,542 | 15,148 | ||||
Property held for sale | 5,522 | 4,536 | ||||
Assets related to discontinued operations | 3,192 | 3,671 | ||||
Property and equipment, net | 193,218 | 200,202 | ||||
Intangible assets, net | 21,074 | 22,570 | ||||
Goodwill | 1,605 | 1,643 | ||||
Deferred income taxes | 8,738 | 12,917 | ||||
Other assets | 3,334 | 3,571 | ||||
Total assets | $ | 252,225 | $ | 264,258 | ||
LIABILITIES AND SHAREHOLDERS’ EQUITY | ||||||
Current Liabilities: | ||||||
Accounts payable | $ | 17,539 | $ | 20,173 | ||
Liabilities related to discontinued operations | 412 | 408 | ||||
Accrued expenses and other liabilities | 23,752 | 23,967 | ||||
Total current liabilities | 41,703 | 44,548 | ||||
Credit facility debt | 37,000 | 37,500 | ||||
Liabilities related to discontinued operations | 17 | 182 | ||||
Other liabilities | 7,752 | 7,369 | ||||
Total liabilities | 86,472 | 89,599 | ||||
Commitments and Contingencies | ||||||
SHAREHOLDERS’ EQUITY | ||||||
Common stock, $0.32 par value; 100,000,000 shares authorized; Shares issued were 29,440,041 and 29,134,603, respectively; Shares outstanding were 28,940,041 and 28,634,603, respectively | 9,421 | 9,323 | ||||
Paid-in capital | 30,348 | 29,006 | ||||
Retained earnings | 130,759 | 141,105 | ||||
Less cost of treasury stock, 500,000 shares | (4,775 | ) | (4,775 | ) | ||
Total shareholders’ equity | 165,753 | 174,659 | ||||
Total liabilities and shareholders’ equity | $ | 252,225 | $ | 264,258 | ||
The accompanying notes are an integral part of these Consolidated Financial Statements.
50
Luby’s, Inc.
Consolidated Statements of Operations
Year Ended | |||||||||||
August 31, 2016 | August 26, 2015 | August 27, 2014 | |||||||||
(In thousands, except per share data) | |||||||||||
SALES: | |||||||||||
Restaurant sales | $ | 378,111 | $ | 370,192 | $ | 369,808 | |||||
Culinary contract services | 16,695 | 16,401 | 18,555 | ||||||||
Franchise revenue | 7,250 | 6,961 | 7,027 | ||||||||
Vending revenue | 583 | 531 | 532 | ||||||||
TOTAL SALES | 402,639 | 394,085 | 395,922 | ||||||||
COSTS AND EXPENSES: | |||||||||||
Cost of food | 106,980 | 107,051 | 106,747 | ||||||||
Payroll and related costs | 132,960 | 127,692 | 126,696 | ||||||||
Other operating expenses | 60,961 | 63,133 | 62,048 | ||||||||
Occupancy costs | 22,374 | 21,084 | 22,049 | ||||||||
Opening costs | 787 | 2,743 | 2,165 | ||||||||
Cost of culinary contract services | 14,955 | 14,786 | 16,847 | ||||||||
Cost of franchise operations | 1,877 | 1,668 | 1,733 | ||||||||
Depreciation and amortization | 21,889 | 21,407 | 20,101 | ||||||||
Selling, general and administrative expenses | 42,422 | 38,759 | 40,707 | ||||||||
Provision for asset impairments and restaurant closings, net | 1,442 | 636 | 2,717 | ||||||||
Net Gain on disposition of property and equipment | (684 | ) | (3,994 | ) | (2,357 | ) | |||||
Total costs and expenses | 405,963 | 394,965 | 399,453 | ||||||||
LOSS FROM OPERATIONS | (3,324 | ) | (880 | ) | (3,531 | ) | |||||
Interest income | 4 | 4 | 6 | ||||||||
Interest expense | (2,247 | ) | (2,337 | ) | (1,247 | ) | |||||
Other income, net | 186 | 521 | 1,101 | ||||||||
Loss before income taxes and discontinued operations | (5,381 | ) | (2,692 | ) | (3,671 | ) | |||||
Provision (benefit) for income taxes | 4,875 | (1,076 | ) | (1,660 | ) | ||||||
Loss from continuing operations | (10,256 | ) | (1,616 | ) | (2,011 | ) | |||||
Loss from discontinued operations, net of income taxes | (90 | ) | (458 | ) | (1,436 | ) | |||||
NET LOSS | $ | (10,346 | ) | $ | (2,074 | ) | $ | (3,447 | ) | ||
Loss per share from continuing operations: | |||||||||||
Basic | $ | (0.35 | ) | $ | (0.06 | ) | $ | (0.07 | ) | ||
Assuming dilution | $ | (0.35 | ) | $ | (0.06 | ) | $ | (0.07 | ) | ||
Loss per share from discontinued operations: | |||||||||||
Basic | $ | (0.00 | ) | $ | (0.01 | ) | $ | (0.05 | ) | ||
Assuming dilution | $ | (0.00 | ) | $ | (0.01 | ) | $ | (0.05 | ) | ||
Net loss per share: | |||||||||||
Basic | $ | (0.35 | ) | $ | (0.07 | ) | $ | (0.12 | ) | ||
Assuming dilution | $ | (0.35 | ) | $ | (0.07 | ) | $ | (0.12 | ) | ||
Weighted-average shares outstanding: | |||||||||||
Basic | 29,226 | 28,974 | 28,812 | ||||||||
Assuming dilution | 29,226 | 28,974 | 28,812 | ||||||||
The accompanying notes are an integral part of these Consolidated Financial Statements.
51
Luby’s, Inc.
Consolidated Statements of Shareholders’ Equity
(In thousands)
Common Stock | |||||||||||||||||||||||||
Issued | Treasury | ||||||||||||||||||||||||
Shares | Amount | Shares | Amount | Paid-In Capital | Retained Earnings | Total Shareholders’ Equity | |||||||||||||||||||
Balance at August 28, 2013 | 28,804 | $ | 9,217 | (500 | ) | $ | (4,775 | ) | $ | 26,065 | $ | 146,626 | $ | 177,133 | |||||||||||
Net income for the year | — | — | — | — | — | (3,447 | ) | (3,447 | ) | ||||||||||||||||
Common stock issued under nonemployee director benefit plans | 31 | 10 | — | — | 17 | — | 27 | ||||||||||||||||||
Common stock issued under employee benefit plans | 63 | 20 | — | — | 78 | — | 98 | ||||||||||||||||||
Increase in excess tax benefits from share-based compensation | — | — | — | — | 50 | — | 50 | ||||||||||||||||||
Share-based compensation expense | 52 | 17 | — | — | 1,146 | — | 1,163 | ||||||||||||||||||
Balance at August 27, 2014 | 28,950 | $ | 9,264 | (500 | ) | $ | (4,775 | ) | $ | 27,356 | $ | 143,179 | $ | 175,024 | |||||||||||
Net loss for the year | — | — | — | — | — | (2,074 | ) | (2,074 | ) | ||||||||||||||||
Common stock issued under nonemployee director benefit plans | 40 | 13 | — | — | (13 | ) | — | — | |||||||||||||||||
Common stock issued under employee benefit plans | 82 | 26 | — | — | 164 | — | 190 | ||||||||||||||||||
Increase in excess tax benefits from share-based compensation | — | — | — | — | 5 | — | 5 | ||||||||||||||||||
Share-based compensation expense | 63 | 20 | — | — | 1,494 | — | 1,514 | ||||||||||||||||||
Balance at August 26, 2015 | 29,135 | $ | 9,323 | (500 | ) | $ | (4,775 | ) | $ | 29,006 | $ | 141,105 | $ | 174,659 | |||||||||||
Net loss for the year | — | — | — | — | — | (10,346 | ) | (10,346 | ) | ||||||||||||||||
Common stock issued under nonemployee director benefit plans | 60 | 19 | — | — | (19 | ) | — | — | |||||||||||||||||
Common stock issued under employee benefit plans | 177 | 57 | — | — | 25 | — | 82 | ||||||||||||||||||
Excess tax deficit from share-based compensation | — | — | — | — | (119 | ) | — | (119 | ) | ||||||||||||||||
Share-based compensation expense | 68 | 22 | — | — | 1,455 | — | 1,477 | ||||||||||||||||||
Balance at August 31, 2016 | 29,440 | $ | 9,421 | (500 | ) | $ | (4,775 | ) | $ | 30,348 | $ | 130,759 | $ | 165,753 | |||||||||||
The accompanying notes are an integral part of these Consolidated Financial Statements.
52
Luby’s, Inc.
Consolidated Statements of Cash Flows
Year Ended | |||||||||||
August 31, 2016 | August 26, 2015 | August 27, 2014 | |||||||||
(In thousands) | |||||||||||
CASH FLOWS FROM OPERATING ACTIVITIES: | |||||||||||
Net loss | $ | (10,346 | ) | $ | (2,074 | ) | $ | (3,447 | ) | ||
Adjustments to reconcile net income to net cash provided by operating activities: | |||||||||||
Provision for asset impairments and (gains) on property sales | 734 | (3,385 | ) | 1,347 | |||||||
Depreciation and amortization | 21,906 | 21,431 | 20,221 | ||||||||
Amortization of debt issuance cost | 313 | 204 | 123 | ||||||||
Share-based compensation expense | 1,477 | 1,514 | 1,288 | ||||||||
Excess tax deficit (benefit) from share-based compensation | 119 | (5 | ) | (50 | ) | ||||||
Deferred tax provision (benefit) | 4,707 | (1,996 | ) | (3,348 | ) | ||||||
Cash provided by operating activities before changes in operating asset and liabilities | 18,910 | 15,689 | 16,134 | ||||||||
Changes in operating assets and liabilities: | |||||||||||
Increase in trade accounts and other receivables | (744 | ) | (1,063 | ) | (29 | ) | |||||
Decrease (Increase) in food and supply inventories | (616 | ) | 1,073 | (530 | ) | ||||||
Decrease (Increase) in prepaid expenses and other assets | 215 | (268 | ) | 917 | |||||||
Increase (Decrease) in accounts payable, accrued expenses and other liabilities | (3,906 | ) | (5,115 | ) | 3,947 | ||||||
Net cash provided by operating activities | 13,859 | 10,316 | 20,439 | ||||||||
CASH FLOWS FROM INVESTING ACTIVITIES: | |||||||||||
Proceeds from disposal of assets and property held for sale | 4,794 | 13,278 | 4,130 | ||||||||
Repayment of note receivable | 17 | 57 | 23 | ||||||||
Purchases of property and equipment | (18,253 | ) | (20,378 | ) | (46,184 | ) | |||||
Net cash used in investing activities | (13,442 | ) | (7,043 | ) | (42,031 | ) | |||||
CASH FLOWS FROM FINANCING ACTIVITIES: | |||||||||||
Credit facility borrowings | 106,000 | 108,000 | 105,900 | ||||||||
Credit facility repayments | (106,500 | ) | (112,500 | ) | (83,100 | ) | |||||
Debt issuance costs | (42 | ) | (255 | ) | (123 | ) | |||||
Excess tax (deficit) benefit from share-based compensation | (119 | ) | 5 | 50 | |||||||
Proceeds received on the exercise of employee stock options | 82 | 190 | 125 | ||||||||
Net cash provided by (used in) financing activities | (579 | ) | (4,560 | ) | 22,852 | ||||||
Net increase (decrease) in cash and cash equivalents | (162 | ) | (1,287 | ) | 1,260 | ||||||
Cash and cash equivalents at beginning of period | 1,501 | 2,788 | 1,528 | ||||||||
Cash and cash equivalents at end of period | $ | 1,339 | $ | 1,501 | $ | 2,788 | |||||
The accompanying notes are an integral part of these Consolidated Financial Statements.
53
Luby’s, Inc.
Notes to Consolidated Financial Statements
Fiscal Years 2016, 2015, and 2014
Note 1. Nature of Operations and Significant Accounting Policies
Nature of Operations
Luby’s, Inc. is based in Houston, Texas. As of August 31, 2016, the Company owned and operated 175 restaurants, with 127 in Texas and the remainder in other states. In addition, the Company received royalties from 113 franchises as of August 31, 2016 located primarily throughout the United States. The Company’s owned and franchised restaurant locations are convenient to shopping and business developments, as well as, to residential areas. Accordingly, the restaurants appeal to a variety of customers at breakfast, lunch, and dinner. Culinary Contract Services consists of contract arrangements to manage food services for clients operating in primarily three lines of business: healthcare, higher education, and corporate dining.
Principles of Consolidation
The accompanying consolidated financial statements include the accounts of Luby’s, Inc. and its wholly owned subsidiaries. Luby’s, Inc. was restructured into a holding company on February 1, 1997, at which time all of the operating assets were transferred to Luby’s Restaurants Limited Partnership, a Texas limited partnership consisting of two wholly owned, indirect corporate subsidiaries of the Company. On July 9, 2010, Luby’s Restaurants Limited Partnership was converted into Luby’s Fuddruckers Restaurants, LLC, a Texas limited liability company (“LFR”). Unless the context indicates otherwise, the word “Company” as used herein includes Luby’s, Inc., LFR, and the consolidated subsidiaries of Luby’s, Inc. All significant intercompany accounts and transactions have been eliminated in consolidation.
Reportable Segments
Each restaurant is an operating segment because operating results and cash flow can be determined for each restaurant which is regularly reviewed by the chief operating decision maker. The Company has three reportable segments: Company-owned restaurants, franchise operations and Culinary Contract Services (“CCS”). Company-owned restaurants are aggregated into one reportable segment because the nature of the products and services, the production processes, the customers, the methods used to distribute the products and services, and the nature of the regulatory environment are alike.
Cash and Cash Equivalents
Cash and cash equivalents include highly liquid investments such as money market funds that have a maturity of three months or less. All of the Company’s bank account balances are insured by the Federal Deposit Insurance Corporation. However, balances in money market fund accounts are not insured. Amounts in transit from credit card companies are also considered cash equivalents because they are both short-term and highly liquid in nature and are typically converted to cash within three days of the sales transaction.
Trade Accounts and Other Receivables, net
Receivables consist principally of amounts due from franchises, culinary contract service clients, catering customers and restaurant food sales to corporations. Receivables are recorded at the invoiced amount. The allowance for doubtful accounts is the Company’s best estimate of the amount of probable credit losses in the Company’s existing accounts receivable. The Company determines the allowance based on historical loss experience for contract service clients, catering customers and restaurant sales to corporations. The Company determines the allowance for CCS receivables and franchise royalty and marketing and advertising receivables based on the franchisees’ and CCS clients’ unsecured default status. The Company periodically reviews its allowance for doubtful accounts. Account balances are charged off against the allowance after all means of collection have been exhausted and the potential for recovery is considered remote.
Inventories
Food and supply inventories are stated at the lower of cost (first-in, first-out) or market.
54
Property Held for Sale
The Company periodically reviews long-lived assets against its plans to retain or ultimately dispose of properties. If the Company decides to dispose of a property, it will be moved to property held for sale and actively marketed. Property held for sale is recorded at amounts not in excess of what management currently expects to receive upon sale, less costs of disposal. Depreciation on assets moved to property held for sale is discontinued and gains are not recognized until the properties are sold.
Impairment of Long-Lived Assets
Impairment losses are recorded on long-lived assets used in operations when indicators of impairment are present and the undiscounted cash flows estimated to be generated by those assets are less than the carrying amount. The Company evaluates impairments on a restaurant-by-restaurant basis and uses cash flow results and other market conditions as indicators of impairment.
Debt Issuance Costs
Debt issuance costs include costs incurred in connection with the arrangement of long-term financing agreements. These costs are amortized using the effective interest method over the respective term of the debt to which they specifically relate.
Fair Value of Financial Instruments
The carrying value of cash and cash equivalents, trade accounts and other receivables, accounts payable and accrued expenses approximates fair value based on the short-term nature of these accounts. The carrying value of credit facility debt also approximates fair value based on its recent renewal.
Self-Insurance Accrued Expenses
The Company self-insures a significant portion of expected losses under its workers’ compensation, employee injury and general liability programs. Accrued liabilities have been recorded based on estimates of the ultimate costs to settle incurred claims, both reported and not yet reported. These recorded estimated liabilities are based on judgments and independent actuarial estimates, which include the use of claim development factors based on loss history; economic conditions; the frequency or severity of claims and claim development patterns; and claim reserve management settlement practices.
Revenue Recognition
Revenue from restaurant sales is recognized when food and beverage products are sold. Unearned revenues are recorded as a liability for gift cards that have been sold but not yet redeemed and are recorded at their expected redemption value. When gift cards are redeemed, revenue is recognized, and unearned revenue is reduced.
Revenue from culinary contract services is recognized when services are provided and reimbursable costs are incurred within contractual terms.
Revenue from franchise royalties is recognized each fiscal period based on contractual royalty rates applied to the franchise’s restaurant sales each fiscal period. Royalties are accrued as earned and are calculated each period based on the franchisee’s reported sales. Area development fees and franchise fees are recognized as revenue when the Company has performed all material obligations and initial services. Area development fees are recognized proportionately with the opening of each new restaurant, which generally occurs upon the opening of the new restaurant. Until earned, these fees are accounted for as an accrued liability.
Cost of CCS
The cost of CCS includes all food, payroll and related expenses, other operating expenses and selling, general and administrative expenses related to culinary contract service sales. All depreciation and amortization, property disposal, asset impairment expenses associated with CCS are reported within those respective lines as applicable.
55
Cost of Franchise Operations
The cost of franchise operations includes all food, payroll and related expenses, other operating expenses and selling, general and administrative expenses related to franchise operations sales. All depreciation and amortization, property disposal, asset impairment expenses associated with franchise operations are reported within those respective lines as applicable.
Advertising Expenses
Advertising costs are expensed as incurred. Total advertising expense included in other operating expenses and selling, general and administrative expense was $6.3 million, $4.4 million, and $4.7 million in fiscal 2016, 2015, and 2014, respectively. We record advertising attributable to local store marketing and local community involvement efforts in other operating expenses; we record advertising attributable to our brand identity, our promotional offers, and our other marketing messages intended to drive guest awareness of our brands, in selling, general, and administrative expenses. We believe this separation of our marketing and advertising costs assists with measurement of the profitability of individual restaurant locations by associating only the local store marketing efforts with the operations of each restaurant.
Advertising expense included in other operating expenses attributable to local store marketing was $0.7 million, $1.2 million, and $0.8 million in fiscal 2016, 2015, and 2014, respectively.
Advertising expense included in selling, general and administrative expense was $5.6 million, $3.2 million, and $3.9 million in fiscal 2016, 2015, and 2014, respectively.
Depreciation and Amortization
Property and equipment are recorded at cost. The Company depreciates the cost of equipment over its estimated useful life using the straight-line method. Leasehold improvements are amortized over the lesser of their estimated useful lives or the related lease terms. Depreciation of buildings is provided on a straight-line basis over the estimated useful lives.
Opening Costs
Opening costs are expenditures related to the opening of new restaurants through its opening periods, other than those for capital assets. Such costs are charged to expense when incurred.
Operating Leases
The Company leases restaurant and administrative facilities and administrative equipment under operating leases. Building lease agreements generally include rent holidays, rent escalation clauses and contingent rent provisions for a percentage of sales in excess of specified levels. Contingent rental expenses are recognized prior to the achievement of a specified target, provided that the achievement of the target is considered probable. Most of the Company’s lease agreements include renewal periods at the Company’s option. The Company recognizes rent holiday periods and scheduled rent increases on a straight-line basis over the lease term beginning with the date the Company takes possession of the leased space.
Income Taxes
The estimated future tax effects of temporary differences between the tax bases of assets and liabilities and amounts reported in the accompanying consolidated balance sheets, as well as operating loss and tax credit carrybacks and carryforwards are recorded. Deferred tax assets and liabilities are determined based on differences between financial reporting and tax bases of assets and liabilities (temporary differences) and are measured using the enacted tax rates and laws that will be in effect when the differences are expected to reverse. A valuation allowance is recognized if, based on the weight of available evidence, it is more likely than not a portion or all of the deferred tax asset will not be recognized.
Management makes judgments regarding the interpretation of tax laws that might be challenged upon an audit and cause changes to previous estimates of tax liability. In addition, the Company operates within multiple taxing jurisdictions and is subject to audit in these jurisdictions as well as by the Internal Revenue Service (“IRS”). In management’s opinion, adequate provisions for income taxes have been made for all open tax years. The potential outcomes of examinations are regularly assessed in determining the adequacy of the provision for income taxes and income tax liabilities. Management believes that adequate provisions have been made for reasonably possible outcomes related to uncertain tax matters.
56
Sales Taxes
The Company presents sales taxes on a net basis (excluded from revenue).
Discontinued Operations
Management evaluates unit closures for presentation in discontinued operations following guidance from ASC 205-20-55. To qualify for presentation as a discontinued operation, management determines if the closure or exit of a business location or activity meets the following conditions: (1) the operations and cash flows of the component have been (or will be) eliminated from the ongoing operations of the entity as a result of the disposal transaction and (2) there will not be any significant continuing involvement in the operations of the component after the disposal transaction. To evaluate whether these conditions are met, management considers whether the cash flows lost will not be recovered and generated by the ongoing entity, the level of guest traffic and sales transfer, the significance of the number of locations closed and expectancy of cash flow replacement by sales from new and existing locations, as well as the level of continuing involvement in the disposed operation. Operating and non-operating results of these locations are then classified and reported as discontinued operations of all periods presented. As of fiscal year 2016, management evaluates unit closures for presentation in discontinued operations following guidance from ASU 2014-08. Beginning in fiscal year 2016, in accordance with ASU No. 2014-08, the Company will only report the disposal of a component or a group of components of the Company in discontinued operations if the disposal of the components or group of components represents a strategic shift that has or will have a major effect on the Company’s operations and financial results. Adoption of this standard did not have a material impact on our consolidated financial statements.
Share-Based Compensation
Share-based compensation expense is estimated for equity awards at fair value at the grant date. The Company determines fair value of restricted stock awards based on the average of the high and low price of its common stock on the date awarded by the Board of Directors. The Company determines the fair value of stock option awards using a Black-Scholes option pricing model. The Black-Scholes option pricing model requires various judgmental assumptions including the expected dividend yield, stock price volatility and the expected life of the award. If any of the assumptions used in the model change significantly, share-based compensation expense may differ materially in the future, from that recorded in the current period. The fair value of performance share based award liabilities are estimated based on a Monte Carlo simulation model. For further discussion, see Note 13, “Share-Based Compensation,” below.
Earnings Per Share
Basic income per share is computed by dividing net income by the weighted-average number of shares outstanding, including restricted stock units, during each period presented. For the calculation of diluted net income per share, the basic weighted average number of shares is increased by the dilutive effect of stock options, determined using the treasury stock method.
Accounting Periods
The Company’s fiscal year ends on the last Wednesday in August. Accordingly, each fiscal year normally consists of 13 four-week periods, or accounting periods, accounting for 364 days in the aggregate. However, every fifth or sixth year, we have a fiscal year that consists of 53 weeks, accounting for 371 days in the aggregate; fiscal year 2016 was such a year. Each of the first three quarters of each fiscal year, prior to fiscal year 2016, consisted of three four-week periods, while the fourth quarter normally consists of four four-week periods.
Beginning in fiscal 2016, we changed our fiscal quarter ending dates with the first fiscal quarter end was extended by one accounting period and the fiscal fourth quarter was reduced by one accounting period. The purpose of this change is in part to minimize the Thanksgiving calendar shift by extending the first fiscal quarter until after Thanksgiving. With this change in fiscal quarter ending dates, our first quarter is 16 weeks, and the remaining three quarters will typically be 12 weeks in length. The fourth fiscal quarter will be 13 weeks in certain fiscal years to adjust for our standard 52 week, or 364 day, fiscal year compared to the 365 day calendar year. Fiscal 2016 is such a year where the fourth quarter included 13 weeks, resulting in a 53 week fiscal year. Comparability between quarters may be affected by varying lengths of the quarters, as well as the seasonality associated with the restaurant business.
57
Use of Estimates
In preparing financial statements in conformity with accounting principles generally accepted in the United States of America, management is required to make estimates and assumptions that affect the reported amounts of assets and liabilities and the disclosure of contingent assets and liabilities at the date of the financial statements and revenues and expenses during the reporting period. Actual results could differ from these estimates.
NEW ACCOUNTING PRONOUNCEMENTS
In May 2014, the FASB issued ASU 2014-09, Revenue from Contracts with Customers (Topic 606). This update provides a comprehensive new revenue recognition model that requires a company to recognize revenue to depict the transfer of goods or services to a customer at an amount that reflects the consideration it expects to receive in exchange for those goods or services. The guidance also requires additional disclosure about the nature, amount, timing and uncertainty of revenue and cash flows arising from customer contracts. This update is effective for annual and interim periods beginning after December 15, 2017, which will require us to adopt these provisions in the first quarter of fiscal 2019. Early application is not permitted. This update permits the use of either the retrospective or cumulative effect transition method. We are evaluating the effect this guidance will have on our consolidated financial statements and related disclosures. We are evaluating the impact on the Company’s consolidated financial statements and have not yet selected a transition method.
In August 2014, the FASB issued ASU No 2014-15. The amendments in ASU 2014-15 are intended to define management’s responsibility to evaluate whether there is substantial doubt about an organization’s ability to continue as a going concern and to provide related footnote disclosures. Under GAAP, financial statements are prepared under the presumption that the reporting organization will continue to operate as a going concern, except in limited circumstances. The going concern basis of accounting is critical to financial reporting because it establishes the fundamental basis for measuring and classifying assets and liabilities. Currently, GAAP lacks guidance about management’s responsibility to evaluate whether there is substantial doubt about the organization’s ability to continue as a going concern or to provide related footnote disclosures. This ASU provides guidance to an organization’s management, with principles and definitions that are intended to reduce diversity in the timing and content of disclosures that are commonly provided by organizations today in the financial statement footnotes. The pronouncement is effective for fiscal years and interim periods within those fiscal years, after December 31, 2016. The adoption of this pronouncement is not expected to have a material impact on the Company’s financial statements.
In April 2015, the FASB issued ASU 2015-03, Simplifying the Presentation of Debt Issuance Costs. This update requires that debt issuance costs be presented in the balance sheet as a direct deduction from the associated debt liability. This update is effective for annual and interim periods for fiscal years beginning after December 15, 2015, which will require us to adopt these provisions in the first quarter of fiscal 2017. Early adoption is permitted for financial statements that have not been previously issued. This update will be applied on a retrospective basis. The adoption of this update will not have a material impact on our consolidated financial statements.
In July 2015, the FASB issued ASU 2015-11, Simplifying the Measurement of Inventory (Topic 330). This update requires inventory within the scope of the standard to be measured at the lower of cost and net realizable value. Net realizable value is defined as the estimated selling prices in the ordinary course of business, less reasonably predictable costs of completion, disposal, and transportation. This update is effective for annual and interim periods beginning after December 15, 2016, which will require us to adopt these provisions in the first quarter of fiscal 2018. Early adoption is permitted. We do not expect the adoption of this guidance to have a material impact on our consolidated financial statements.
In November 2015, the FASB issued ASU 2015-17, Balance Sheet Classification of Deferred Taxes (Topic 740). This update requires that deferred tax liabilities and assets be classified as noncurrent in a classified balance sheet. This update is effective for annual and interim periods beginning after December 15, 2016, which will require us to adopt these provisions in the first quarter of fiscal 2018. Early adoption is permitted. We do not expect the adoption of this guidance to have a material impact on our consolidated financial statements.
In February 2016, the FASB issued ASU 2016-02, Leases (Topic 842). This update requires a lessee to recognize on the balance sheet a liability to make lease payments and a corresponding right-of-use asset. The update also requires additional disclosures about the amount, timing and uncertainty of cash flows arising from leases. This update is effective for annual and interim periods beginning after December 15, 2018, which will require us to adopt these provisions in the first quarter of fiscal 2020 using a modified retrospective approach. Early adoption is permitted. We are evaluating the impact on the Company’s consolidated financial statements and have not yet selected a transition method.
In March 2016, the FASB issued ASU 2016-09, Improvements to Employee Share-Based Payment Accounting (Topic 718). This update was issued as part of the FASB’s simplification initiative and affects all entities that issue share-based payment
58
awards to their employees. The amendments in this update cover such areas as the recognition of excess tax benefits and deficiencies, the classification of those excess tax benefits on the statement of cash flows, an accounting policy election for forfeitures, the amount an employer can withhold to cover income taxes and still qualify for equity classification and the classification of those taxes paid on the statement of cash flows. This update is effective for annual and interim periods for fiscal years beginning after December 15, 2016, which will require us to adopt these provisions in the first quarter of fiscal 2018. Early adoption is permitted. We are evaluating the impact on the Company’s consolidated financial statements and have not yet selected a transition method.
In August 2016, the FASB issued ASU 2016-15, Statement of Cash Flows (Topic 230). This update provides clarification regarding how certain cash receipts and cash payment are presented and classified in the statement of cash flows. This update addresses eight specific cash flow issues with the objective of reducing the existing diversity in practice. This update is effective for annual and interim periods beginning after December 15, 2017, which will require us to adopt these provisions in the first quarter of fiscal 2019 using a retrospective approach. Early adoption is permitted. We do not expect the adoption of this guidance to have a material impact on our consolidated financial statements.
Subsequent Events
Events subsequent to the Company’s fiscal year ended August 31, 2016 through the date of issuance of the financial statements are evaluated to determine if the nature and significance of the event warrants inclusion in the Company’s annual report.
On November 8, 2016, we refinanced our outstanding long-term debt of $37.0 million with a new senior secured $65.0 million credit agreement which includes a $35.0 million five-year term loan and up to $30.0 million bank revolver. For a more detailed discussion of our credit facility, please read Note 9 to the consolidated financial statements included in Part II, Item 8 of this Form 10-K.
59
Note 2. Reportable Segments
The Company has three reportable segments: Company-owned restaurants, franchise operations and Culinary Contract Services.
Company-owned restaurants
Company-owned restaurants consists of several brands which are aggregated into one reportable segment due to the following: the nature of the products and services, the production processes, the customers, the methods used to distribute the products and services, the regulatory environment, and store level profit margin is similar. The chief operating decision maker analyzes Company-owned restaurant store level profit which is defined as restaurant sales, vending revenue less cost of food, payroll and related costs, other operating expenses, and occupancy costs. The primary brands are Luby’s Cafeteria, Fuddruckers, and Cheeseburger in Paradise with a couple of non-core restaurant locations under other brand names. Both Luby’s Cafeteria and Fuddruckers are casual dining, counter service restaurants. Each restaurant is an operating segment because operating results and cash flow can be determined for each restaurant.
The total number of Company-owned restaurants at the end of fiscal years 2016, 2015, and 2014 were 175, 177, and 174, respectively.
Culinary Contract Services
CCS operation, branded as Luby’s Culinary Contract Services, consists of a business line servicing healthcare and corporate dining clients. The healthcare accounts are full service and typically include in-room delivery, catering, vending, coffee service and retail dining. CCS had contracts with long-term acute care hospitals, acute care medical centers, ambulatory surgical centers, behavioral hospitals, and business and industry clients. Culinary Contract Services has the unique ability to deliver quality services that include facility design and procurement as well as nutrition and branded food services to our clients. The costs of Culinary Contract Services on the Consolidated Statements of Operations includes all food, payroll and related costs, other operating expenses, and other direct general and administrative expenses related to Culinary Contract Services sales.
The total number of Culinary Contract Services contracts at the end of fiscal 2016, 2015, and 2014 were 24, 23, and 25, respectively.
Franchise Operations
We only offer franchises for the Fuddruckers brand. Franchises are sold in markets where expansion is deemed advantageous to the development of the Fuddruckers concept and system of restaurants. Initial franchise agreements have a term of 20 years. Franchise agreements typically grant franchisees an exclusive territorial license to operate a single restaurant within a specified area, usually a four-mile radius surrounding the franchised restaurant.
Franchisees bear all direct costs involved in the development, construction and operation of their restaurants. In exchange for a franchise fee, the Company provides franchise assistance in the following areas: site selection, prototypical architectural plans, interior and exterior design and layout, training, marketing and sales techniques, assistance by a Fuddruckers “opening team” at the time a franchised restaurant opens, and operations and accounting guidelines set forth in various policies and procedures manuals.
All franchisees are required to operate their restaurants in accordance with Fuddruckers standards and specifications, including controls over menu items, food quality and preparation. The Company requires the successful completion of its training program by a minimum of three managers for each franchised restaurant. In addition, franchised restaurants are evaluated regularly by the Company for compliance with franchise agreements, including standards and specifications through the use of periodic, unannounced, on-site inspections and standards evaluation reports.
The number of franchised restaurants at the end of fiscal 2016, 2015, and 2014 were 113, 106, and 110, respectively.
The table on the following page shows financial information as required by ASC 280 for segment reporting. ASC 280 requires depreciation and amortization be disclosed for each reportable segment, even if not used by the chief operating decision maker. The table also lists total assets for each reportable segment. Corporate assets include cash and cash equivalents, tax refunds receivable, property and equipment, assets related to discontinued operations, property held for sale, deferred tax assets, and prepaid expenses.
60
Fiscal Year Ended | |||||||||||
August 31, 2016 | August 26, 2015 | August 27, 2014 | |||||||||
(In thousands) | |||||||||||
Sales: | |||||||||||
Company-owned restaurants(1) | $ | 378,694 | $ | 370,723 | $ | 370,340 | |||||
Culinary contract services | 16,695 | 16,401 | 18,555 | ||||||||
Franchise operations | 7,250 | 6,961 | 7,027 | ||||||||
Total | $ | 402,639 | $ | 394,085 | $ | 395,922 | |||||
Segment level profit: | |||||||||||
Company-owned restaurants | $ | 55,419 | $ | 51,763 | $ | 52,800 | |||||
Culinary contract services | 1,740 | 1,615 | 1,708 | ||||||||
Franchise operations | 5,373 | 5,293 | 5,294 | ||||||||
Total | $ | 62,532 | $ | 58,671 | $ | 59,802 | |||||
Depreciation and amortization: | |||||||||||
Company-owned restaurants | $ | 18,181 | $ | 18,120 | $ | 17,396 | |||||
Culinary contract services | 103 | 177 | 409 | ||||||||
Franchise operations | 784 | 767 | 767 | ||||||||
Corporate | 2,821 | 2,343 | 1,529 | ||||||||
Total | $ | 21,889 | $ | 21,407 | $ | 20,101 | |||||
Total assets: | |||||||||||
Company-owned restaurants(2) | $ | 211,182 | $ | 218,492 | $ | 220,793 | |||||
Culinary contract services | 3,390 | 1,644 | 2,724 | ||||||||
Franchise operations (3) | 12,266 | 13,034 | 13,906 | ||||||||
Corporate(4) | 25,387 | 31,088 | 38,012 | ||||||||
Total | $ | 252,225 | $ | 264,258 | $ | 275,435 | |||||
Capital expenditures: | |||||||||||
Company-owned restaurants | $ | 17,258 | $ | 19,726 | $ | 43,075 | |||||
Culinary contract services | 28 | 18 | 64 | ||||||||
Corporate | 967 | 634 | 3,045 | ||||||||
Total | $ | 18,253 | $ | 20,378 | $ | 46,184 | |||||
Loss before income taxes and discontinued operations: | |||||||||||
Segment level profit | $ | 62,532 | $ | 58,671 | $ | 59,802 | |||||
Opening costs | (787 | ) | (2,743 | ) | (2,165 | ) | |||||
Depreciation and amortization | (21,889 | ) | (21,407 | ) | (20,101 | ) | |||||
Selling, general and administrative expenses | (42,422 | ) | (38,759 | ) | (40,707 | ) | |||||
Provision for asset impairments and restaurant closings, net | (1,442 | ) | (636 | ) | (2,717 | ) | |||||
Net gain on disposition of property and equipment | 684 | 3,994 | 2,357 | ||||||||
Interest income | 4 | 4 | 6 | ||||||||
Interest expense | (2,247 | ) | (2,337 | ) | (1,247 | ) | |||||
Other income, net | 186 | 521 | 1,101 | ||||||||
Total | $ | (5,381 | ) | $ | (2,692 | ) | $ | (3,671 | ) | ||
(1) Includes vending revenue of $583, $531, and $532 thousand for the year ended August 31, 2016, August 26, 2015, and August 27, 2014, respectively.
(2) Company-owned restaurants segment includes $9.8 million of Fuddruckers trade name, Cheeseburger in Paradise liquor licenses, and Jimmy Buffett intangibles.
(3) Franchise operations segment includes approximately $11.4 million in royalty intangibles.
(4) Goodwill was disclosed in corporate segment in our fiscal 2014 Annual Report on Form 10-K and our first quarter fiscal 2015 Quarterly Report on Form 10-Q. The current draft reflects a revised classification of goodwill into the Company-owned restaurants segment.
61
Note 3. Fair Value Measurement
GAAP establishes a framework for using fair value to measure assets and liabilities, and expands disclosure about fair value measurements. Fair value measurements guidance applies whenever other statements require or permit assets or liabilities to be measured at fair value.
GAAP establishes a three-tier fair value hierarchy, which prioritizes the inputs used to measure fair value. These include:
• | Level 1: Defined as observable inputs such as quoted prices in active markets for identical assets or liabilities as of the reporting date. Active markets are those in which transactions for the asset or liability occur in sufficient frequency and volume to provide pricing information on an ongoing basis. |
• | Level 2: Defined as pricing inputs other than quoted prices in active markets included in Level 1, which are either directly or indirectly observable as of the reporting date. Level 2 includes those financial instruments that are valued using models or other valuation methodologies. These models are primarily industry-standard models that consider various assumptions, including quoted forward prices for commodities, time value, volatility factors, and current market and contractual prices for the underlying instruments, as well as other relevant economic measures. |
• | Level 3: Defined as pricing inputs that are unobservable from objective sources. These inputs may be used with internally developed methodologies that result in management's best estimate of fair value. |
Recurring fair value measurements related to liabilities are presented below:
Fair Value Measurement Using | |||||||||||||||||
Fiscal Year Ended August 31, 2016 | Quoted Prices in Active Markets for Identical Assets (Level 1) | Significant Other Observable Inputs (Level 2) | Significant Unobservable Inputs (Level 3) | Valuation Method | |||||||||||||
Recurring Fair Value - Liabilities | (In thousands) | ||||||||||||||||
Continuing Operations: | |||||||||||||||||
TSR Performance Based Incentive Plan(1) | $ | 793 | $ | — | $ | 793 | $ | — | Market Approach | ||||||||
(1) The fair value of the Company's 2015 and 2016 Performance Based Incentive Plan liabilities were approximately $381 thousand and $412 thousand, respectively. See Note 13 to the Company's consolidated financial statements in Part II, Item 8 in this Form 10-K for further discussion of Performance Based Incentive Plan.
Fair Value Measurement Using | |||||||||||||||||
Fiscal Year Ended August 26, 2015 | Quoted Prices in Active Markets for Identical Assets (Level 1) | Significant Other Observable Inputs (Level 2) | Significant Unobservable Inputs (Level 3) | Valuation Method | |||||||||||||
Recurring Fair Value - Liabilities | (In thousands) | ||||||||||||||||
Continuing Operations: | |||||||||||||||||
TSR Performance Based Incentive Plan | $ | 108 | $ | — | $ | 108 | $ | — | Market Approach | ||||||||
62
Non-recurring fair value measurements related to impaired property and equipment consist of the following:
Fair Value Measurement Using | |||||||||||||||||||
Fiscal Year Ended August 31, 2016 | Quoted Prices in Active Markets for Identical Assets (Level 1) | Significant Other Observable Inputs (Level 2) | Significant Unobservable Inputs (Level 3) | Total Impairments | |||||||||||||||
Nonrecurring Fair Value Measurements | (In thousands) | ||||||||||||||||||
Continuing Operations: | |||||||||||||||||||
Property and equipment related to company-owned restaurants(1) | $ | 959 | $ | — | $ | — | $ | 959 | $ | (738 | ) | ||||||||
Goodwill(2) | — | — | — | — | (38 | ) | |||||||||||||
Property held for sale(3) | 1,290 | — | — | 1,290 | (463 | ) | |||||||||||||
Total Nonrecurring Fair Value Measurements | $ | 2,249 | $ | — | $ | — | $ | 2,249 | $ | (1,239 | ) | ||||||||
Discontinued Operations: | |||||||||||||||||||
Property and equipment related to corporate assets | $ | — | $ | — | $ | — | $ | — | $ | — | |||||||||
(1) In accordance with Subtopic 360-10, long-lived assets held and used with a carrying amount of approximately $1.7 million were written down to their fair value of approximately $1.0 million, resulting in an impairment charge of approximately $0.7 million, which was included in earnings for the period.
(2) In accordance with Subtopic 350-20, goodwill with a carrying amount of approximately $38 thousand was written down to its implied fair value of approximately zero, resulting in an impairment charge of $38 thousand, which was included in earnings for the period.
(3) In accordance with Subtopic 360-10, long-lived assets held for sale with a carrying value of $1.8 million were written down to their fair value, less cost to sell, of approximately $1.3 million, resulting in an impairment charge of approximately $0.5 million, which was included in earnings for the period.
Fair Value Measurement Using | |||||||||||||||||||
Fiscal Year Ended August 26, 2015 | Quoted Prices in Active Markets for Identical Assets (Level 1) | Significant Other Observable Inputs (Level 2) | Significant Unobservable Inputs (Level 3) | Total Impairments | |||||||||||||||
Nonrecurring Fair Value Measurements | (In thousands) | ||||||||||||||||||
Continuing Operations: | |||||||||||||||||||
Property and equipment related to company-owned restaurants(1) | $ | 1,350 | $ | — | $ | — | $ | 1,350 | $ | (598 | ) | ||||||||
Goodwill(2) | — | — | — | — | (38 | ) | |||||||||||||
Total Nonrecurring Fair Value Measurements | $ | 1,350 | $ | — | $ | — | $ | 1,350 | $ | (636 | ) | ||||||||
Discontinued Operations: | |||||||||||||||||||
Property and equipment related to corporate assets | $ | 865 | $ | — | $ | — | $ | 865 | $ | (90 | ) | ||||||||
(1) In accordance with Subtopic 360-10, long-lived assets held and used with a carrying amount of approximately $1.9 million were written down to their fair value of approximately $1.3 million, resulting in an impairment charge of approximately $0.6 million, which was included in earnings for the period.
(2) In accordance with Subtopic 350-20, goodwill with a carrying amount of approximately $38 thousand was written down to its implied fair value of approximately zero, resulting in an impairment charge of $38 thousand.
63
Fair Value Measurement Using | |||||||||||||||||||
Fiscal Year Ended August 27, 2014 | Quoted Prices in Active Markets for Identical Assets (Level 1) | Significant Other Observable Inputs (Level 2) | Significant Unobservable Inputs (Level 3) | Total Impairments | |||||||||||||||
Nonrecurring Fair Value Measurements | (In thousands) | ||||||||||||||||||
Continuing Operations: | |||||||||||||||||||
Property and equipment related to company-owned restaurants(1) | $ | 3,660 | $ | — | $ | — | $ | 3,660 | $ | (2,229 | ) | ||||||||
Goodwill(2) | — | — | — | — | (488 | ) | |||||||||||||
Total Nonrecurring Fair Value Measurements | $ | 3,660 | $ | — | $ | — | $ | 3,660 | $ | (2,717 | ) | ||||||||
Discontinued Operations: | |||||||||||||||||||
Property and equipment related to corporate assets | $ | 1,144 | $ | — | $ | — | $ | 1,144 | $ | (981 | ) | ||||||||
(1) In accordance with Subtopic 360-10, long-lived assets held and used with a carrying amount of approximately $5.9 million were written down to their fair value of approximately $3.7 million, resulting in an impairment charge of approximately $2.2 million, which was included in earnings for the period.
(2) In accordance with Subtopic 350-20, goodwill with a carrying amount of approximately $0.5 million was written down to its implied fair value of approximately zero, resulting in an impairment charge of $0.5 million.
Note 4. Trade Receivables and Other
Trade and other receivables, net, consist of the following:
August 31, 2016 | August 26, 2015 | ||||||
(In thousands) | |||||||
Trade and other receivables | $ | 5,161 | $ | 4,150 | |||
Franchise royalties and marketing and advertising receivables | 839 | 706 | |||||
Trade receivables, unbilled | — | 874 | |||||
Allowance for doubtful accounts | (81 | ) | (555 | ) | |||
Total Trade accounts and other receivables, net | $ | 5,919 | $ | 5,175 | |||
CCS receivable balance at August 31, 2016 was $3.5 million, primarily the result of 15 contracts with balances of $0.02 million to $0.4 million per contract entity. The Company had several customers' contracts whose accounts receivable balances collectively represented approximately 36% of the Company’s total accounts receivables. Contract payment terms for its CCS customers’ receivables are due within 30 to 45 days.
The Company recorded receivables related to Fuddruckers franchise operations royalty and marketing and advertising payments from the franchisees, as required by their franchise agreements. Franchise royalty and marketing and advertising fund receivables balance at August 31, 2016 was $0.8 million. At August 31, 2016, the Company had 113 operating franchise restaurants with no concentration of accounts receivable.
The change in allowances for doubtful accounts for each of the years in the three-year periods ended as of the dates below is as follows:
64
Fiscal Year Ended | |||||||||||
August 31, 2016 | August 26, 2015 | August 27, 2014 | |||||||||
(In thousands) | |||||||||||
Beginning balance | $ | 555 | $ | 512 | $ | 586 | |||||
Provisions (reversal) for doubtful accounts | (18 | ) | 51 | 61 | |||||||
Write-offs(1) | (456 | ) | (8 | ) | (135 | ) | |||||
Ending balance | $ | 81 | $ | 555 | $ | 512 | |||||
(1) The $0.5 million Balance Sheet write-off in fiscal 2016 resulted from uncollectable receivables at three Culinary Contract Services accounts previously reserved for approximately $0.1 million, $0.3 million, and $33.0 thousand in fiscal years 2011, 2012, and 2013, respectively.
Note 5. Income Taxes
The following table details the categories of total income tax assets and liabilities for both continuing and discontinued operations resulting from the cumulative tax effects of temporary differences:
August 31, 2016 | August 26, 2015 | ||||||
(In thousands) | |||||||
Deferred income tax assets: | |||||||
Workers’ compensation, employee injury, and general liability claims | $ | 466 | $ | 342 | |||
Deferred compensation | 552 | 137 | |||||
Net operating losses | 1,258 | 808 | |||||
General business and foreign tax credits | 11,010 | 10,011 | |||||
Depreciation, amortization and impairments | 1,879 | 1,484 | |||||
Straight-line rent, dining cards, accruals, and other | 3,812 | 3,930 | |||||
Subtotal | 18,977 | 16,712 | |||||
Valuation allowance | (6,905 | ) | — | ||||
Total deferred income tax assets | 12,072 | 16,712 | |||||
Deferred income tax liabilities: | |||||||
Property taxes and other | 1,828 | 1,765 | |||||
Total deferred income tax liabilities | 1,828 | 1,765 | |||||
Net deferred income tax asset | $ | 10,244 | $ | 14,947 | |||
The Company had deferred tax assets, excluding liabilities, at August 31, 2016 of approximately $12.1 million, the most significant of which include the Company’s general business tax credits carryovers to future years of approximately $10.5 million. This item may be carried forward up to twenty (20) years for possible utilization in the future. The carryover of general business tax credits, beginning in fiscal 2002, will begin to expire at the end of fiscal 2022 through 2036, if not utilized by then.
Deferred income taxes arise from temporary differences between the tax basis of assets and liabilities and their reported amounts in the financial statements, which will result in taxable or deductible amounts in the future, as well as from tax net operating losses and tax credit carryovers. We establish a valuation allowance when we no longer consider it more likely than not that a deferred tax asset will be realized. In evaluating our ability to recover our deferred tax assets, we consider available positive and negative evidence, including scheduled reversals of taxable temporary differences, identified tax-planning strategy, the results of recent operations, and where appropriate, projected future taxable income. We have negative evidence in the form of cumulative losses in recent years, a significant source of which was due to a number of underperforming restaurant locations, principally all of which have, as of this time, been disposed of under the Company's disposal plan. The presence of a cumulative loss in recent years, generally limits our ability to consider projections of future earnings in assessing realization of our deferred tax assets.
Notwithstanding, we have objective positive evidence in the form of (i) identified tax planning strategy and (ii) an excess of appreciated asset value over the tax basis of properties within the Company's portfolio of real estate in an amount sufficient to realize certain of our deferred tax assets. Tax planning strategy includes the acceleration of unrealized gains from our owned property locations through sale or exchange, if and when necessary on a selective basis, to realize deferred tax assets including
65
federal tax credit carryovers. We regularly evaluate our portfolio of owned properties, long-lived assets and their relative values, for many different business purposes, and have estimated the resulting unrealized net gains thereon to be of sufficient amount to realize certain of our deferred tax assets.
Collectively, the available evidence supports an assertion that our deferred tax assets will be realized, but with the exception of a certain portion of the Company's general business and foreign tax credit carryovers that are not likely at this time to be realized, and on which the Company has established a valuation allowance. The general business credits and foreign tax credit carryovers generally expire if unused within twenty (20) years and ten (10) years, respectively. We have, as a result of the foregoing assessment, established a $6.9 million valuation allowance for deferred tax assets pertaining to general business and foreign tax credit carryforward balances that are not likely to be realized prior to their expiration.
An analysis of the provision for income taxes for continuing operations is as follows:
August 31, 2016 | August 26, 2015 | August 27, 2014 | |||||||||
(In thousands) | |||||||||||
Current federal and state income tax expense | $ | 128 | $ | 523 | $ | 371 | |||||
Current foreign income tax expense | 82 | 63 | 87 | ||||||||
Deferred income tax expense (benefit) | 4,665 | (1,662 | ) | (2,118 | ) | ||||||
Total income tax expense (benefit) | $ | 4,875 | $ | (1,076 | ) | $ | (1,660 | ) | |||
Relative only to continuing operations, the reconciliation of the expense (benefit) for income taxes to the expected income tax expense (benefit), computed using the statutory tax rate, was as follows:
Fiscal Year Ended | ||||||||||||||||||||
August 31, 2016 | August 26, 2015 | August 27, 2014 | ||||||||||||||||||
Amount | % | Amount | % | Amount | % | |||||||||||||||
(In thousands and as a percent of pretax loss from continuing operations) | ||||||||||||||||||||
Income tax benefit from continuing operations at the federal rate | $ | (1,830 | ) | 34.0 | % | $ | (832 | ) | 34.0 | % | $ | (1,120 | ) | 34.0 | % | |||||
Permanent and other differences: | ||||||||||||||||||||
Federal jobs tax credits (wage deductions) | 226 | (4.2 | ) | 302 | (12.3 | ) | 404 | (12.3 | ) | |||||||||||
Stock options and restricted stock | 165 | (3.1 | ) | 74 | (3.0 | ) | 54 | (1.7 | ) | |||||||||||
Other permanent differences | 74 | (1.4 | ) | 60 | (2.5 | ) | 185 | (5.6 | ) | |||||||||||
State income tax, net of federal benefit | 94 | (1.7 | ) | 200 | (8.2 | ) | 52 | (1.6 | ) | |||||||||||
General Business Tax Credits | (665 | ) | 12.4 | (888 | ) | 36.3 | (1,187 | ) | 36.1 | |||||||||||
Other | (94 | ) | 1.7 | 8 | (0.3 | ) | (48 | ) | 1.5 | |||||||||||
Change in valuation allowance | 6,905 | (128.3 | ) | — | — | — | — | |||||||||||||
Income tax expense (benefit) from continuing operations | $ | 4,875 | (90.6 | )% | $ | (1,076 | ) | 44.0 | % | $ | (1,660 | ) | 50.4 | % | ||||||
For the fiscal year ended August 31, 2016, including both continuing and discontinued operations, the Company is estimated to report federal taxable income of approximately $3.1 million. The Company will be able to utilize NOL carryovers from prior years to reduce the current year federal income tax liability to zero.
For the fiscal year ended August 26, 2015, including both continuing and discontinued operations, the Company generated federal taxable income of approximately $0.4 million.
For the fiscal year ended August 27, 2014, including both continuing and discontinued operations, the Company generated federal taxable loss of approximately $6.5 million.
66
The IRS has periodically reviewed the Company’s federal income tax returns. The IRS concluded a review of the federal income tax return for fiscal year 2008 on March 12, 2011. The IRS made no changes to the return. The State of Texas examined the franchise tax filings for report years 2008 through 2011 based on accounting years 2007 through 2010 resulting in additional taxes of $33,000. The State of Louisiana is currently examining income tax returns for fiscal years 2014 and 2015.
There were no payments of federal income taxes in fiscal 2014, 2015 or 2016. The Company has income tax filing requirements in over 30 states. State income tax payments were approximately $0.5 million each year during fiscal 2014, 2015 and 2016.
The following table is a reconciliation of the total amounts of unrecognized tax benefits at the beginning and end of fiscal years 2014, 2015 and 2016 (in thousands):
Balance as of August 28, 2013 | $ | 769 | |
Decrease based on prior year tax positions | (707 | ) | |
Interest Expense | — | ||
Balance as of August 27, 2014 | $ | 62 | |
Decrease based on prior year tax positions | — | ||
Interest Expense | 1 | ||
Balance as of August 26, 2015 | $ | 63 | |
Decrease based on prior year tax positions | (18 | ) | |
Interest Expense | — | ||
Balance as of August 31, 2016 | $ | 45 | |
The unrecognized tax benefits would favorably affect the Company’s effective tax rate in future periods if they are recognized. There is no interest associated with unrecognized benefits as of August 31, 2016. The Company has included interest or penalties related to income tax matters as part of income tax expense (or benefit).
It is reasonably possible that the amount of unrecognized tax benefits with respect to our uncertain tax positions could significantly increase or decrease within 12 months. However, based on the current status of examinations, it is not possible to estimate the future impact, if any, to recorded uncertain tax positions as of August 31, 2016.
Management believes that adequate provisions for income taxes have been reflected in the financial statements and is not aware of any significant exposure items that have not been reflected in the financial statements. Amounts considered probable of settlement within one year have been included in the accrued expenses and other liabilities in the accompanying consolidated balance sheet.
67
Note 6. Property and Equipment, Intangible Assets and Goodwill
The cost, net of impairment, and accumulated depreciation of property and equipment at August 31, 2016 and August 26, 2015, together with the related estimated useful lives used in computing depreciation and amortization, were as follows:
August 31, 2016 | August 26, 2015 | Estimated Useful Lives (years) | |||||||||||
(In thousands) | |||||||||||||
Land | $ | 61,940 | $ | 63,315 | — | ||||||||
Restaurant equipment and furnishings | 75,764 | 86,209 | 3 | to | 15 | ||||||||
Buildings | 157,006 | 158,959 | 20 | to | 33 | ||||||||
Leasehold and leasehold improvements | 25,973 | 29,223 | Lesser of lease term or estimated useful life | ||||||||||
Office furniture and equipment | 3,277 | 3,450 | 3 | to | 10 | ||||||||
Construction in progress | 145 | 810 | — | ||||||||||
324,105 | 341,966 | ||||||||||||
Less accumulated depreciation and amortization | (130,887 | ) | (141,764 | ) | |||||||||
Property and equipment, net | $ | 193,218 | $ | 200,202 | |||||||||
Intangible assets, net | $ | 21,074 | $ | 22,570 | 15 | to | 21 | ||||||
Goodwill | $ | 1,605 | $ | 1,643 | |||||||||
Intangible assets, net, consist of the Fuddruckers trade name and franchise agreements and will be amortized. The Company believes the Fuddruckers brand name has an expected accounting life of 21 years from the date of acquisition based on the expected use of its assets and the restaurant environment in which it is being used. The trade name represents a respected brand with customer loyalty and the Company intends to cultivate and protect the use of the trade name. The franchise agreements, after considering renewal periods, have an estimated accounting life of 21 years from the date of acquisition and will be amortized over this period of time.
Intangible assets, net, also includes the license agreement and trade name related to Cheeseburger in Paradise and the value of the acquired licenses and permits allowing the sales of beverages with alcohol. These assets have an expected accounting life of 15 years from the date of acquisition December 6, 2012.
The aggregate amortization expense related to intangible assets subject to amortization for fiscal years 2016, 2015, and 2014 was approximately $1.4 million, $1.4 million, and $1.5 million, respectively. The aggregate amortization expense related to intangible assets subject to amortization is expected to be approximately $1.4 million in each of the next five successive years.
The following table presents intangible assets as of August 31, 2016 and August 26, 2015:
August 31, 2016 | August 26, 2015 | ||||||||||||||||||||||
(In thousands) | (In thousands) | ||||||||||||||||||||||
Gross Carrying Amount | Accumulated Amortization | Net Carrying Amount | Gross Carrying Amount | Accumulated Amortization | Net Carrying Amount | ||||||||||||||||||
Intangible Assets Subject to Amortization: | |||||||||||||||||||||||
Fuddruckers trade name and franchise agreements | $ | 29,607 | $ | (8,656 | ) | $ | 20,951 | $ | 29,607 | $ | (7,166 | ) | $ | 22,441 | |||||||||
Cheeseburger in Paradise trade name and license agreements | $ | 416 | $ | (293 | ) | $ | 123 | $ | 416 | $ | (287 | ) | $ | 129 | |||||||||
Intangible assets, net | $ | 30,023 | $ | (8,949 | ) | $ | 21,074 | $ | 30,023 | $ | (7,453 | ) | $ | 22,570 | |||||||||
68
In fiscal 2010, the Company recorded an intangible asset for goodwill in the amount of approximately $0.2 million related to the acquisition of substantially all of the assets of Fuddruckers. The Company also recorded, in fiscal 2013, an intangible asset for goodwill in the amount of approximately $2.0 million related to the acquisition of Cheeseburger in Paradise. Goodwill is considered to have an indefinite useful life and is not amortized.
The Company performs a goodwill impairment test annually and more frequently when negative conditions or a triggering event arise. After an assessment of certain qualitative factors, if it is determined to be more likely than not that the fair value of a reporting unit is less than its carrying amount, entities must perform the quantitative analysis of the goodwill impairment test. Otherwise, the quantitative test(s) become optional. For the annual analysis in fiscal years 2014, 2015 and 2016, the Company elected to bypass the qualitative assessment and proceeded directly to performing the first step of the goodwill impairment test. In future periods, the Company may determine that facts and circumstances indicate use of the qualitative assessment may be the most reasonable approach. Management performed its formal annual assessment as of the second quarter of each fiscal year. The individual restaurant level is the level at which goodwill is assessed for impairment under ASC 350. In accordance with our understanding of ASC 350, we have allocated the goodwill value to each reporting unit in proportion to each location’s fair value at the date of acquisition. The result of these assessments were impairment of goodwill of approximately $38 thousand, $38 thousand, and $0.5 million in fiscal years 2016, 2015, and 2014 respectively. The Company will formally perform additional assessments on an interim basis if an event occurs or circumstances exist that indicate that it is more likely than not that a goodwill impairment exists. As of November 9, 2016, of the 23 locations that were acquired, eight locations remain operating as Cheeseburger in Paradise restaurants and of the restaurants closed for conversion to Fuddruckers six locations remain operating as a Fuddruckers restaurant. Three locations were removed due to the option to extend the leases was not exercised, two locations were subleased to franchisees, and the remaining four locations were closed and held for future use. As we are not moving any of the former Cheeseburger in Paradise restaurants out of their respective market, the goodwill associated with the acquired location and market area is expected to be realized through operating these former Cheeseburger in Paradise branded restaurants as Fuddruckers branded restaurants. The Company has experience converting and opening new restaurant locations and the Fuddruckers brand units have positive cash flow history. This historical data was considered when completing our fair value estimates for recovery of the remaining net book value including goodwill. In addition, we included the incremental conversion costs in our cash flow projections when completing our routine impairment of long-lived assets testing. Management has therefore performed valuations using a discounted cash flow analysis for each of its restaurants to determine the fair value of each reporting unit for comparison with the reporting unit’s carrying value.
Goodwill, net of accumulated impairments of approximately $0.6 million and $0.5 million in fiscal years 2016 and 2015, respectively, was approximately $1.6 million as of August 31, 2016 and $1.6 million as of August 26, 2015 and relates to our Company-owned restaurants reportable segment.
Note 7. Current Accrued Expenses and Other Liabilities
The following table sets forth current accrued expenses and other liabilities as of August 31, 2016 and August 26, 2015:
August 31, 2016 | August 26, 2015 | ||||||
(In thousands) | |||||||
Salaries, compensated absences, incentives, and bonuses | $ | 4,184 | $ | 5,435 | |||
Operating expenses | 1,118 | 1,122 | |||||
Unredeemed gift cards and certificates | 6,269 | 5,472 | |||||
Taxes, other than income | 7,882 | 7,765 | |||||
Accrued claims and insurance | 1,577 | 1,267 | |||||
Income taxes, legal and other | 2,722 | 2,906 | |||||
Total | $ | 23,752 | $ | 23,967 | |||
69
Note 8. Other Long-Term Liabilities
The following table sets forth other long-term liabilities as of August 31, 2016 and August 26, 2015:
August 31, 2016 | August 26, 2015 | ||||||
(In thousands) | |||||||
Workers’ compensation and general liability insurance reserve | $ | 986 | $ | 846 | |||
Capital leases | 44 | 291 | |||||
Deferred rent and unfavorable leases | 5,565 | 5,857 | |||||
Deferred compensation | 895 | 222 | |||||
Other | 262 | 153 | |||||
Total | $ | 7,752 | $ | 7,369 | |||
Note 9. Debt
Senior Secured Credit Agreement
On November 8, 2016, the Company entered into a $65.0 million Senior Secured Credit Facility with Wells Fargo Bank, National Association, as Administrative Agent and Cadence Bank, NA and Texas Capital Bank, NA, as lenders (“2016 Credit Agreement”). The $65.0 million Senior Secured Credit Agreement is comprised of a $30.0 million 5-year Revolver (the “Revolver”) and a $35.0 million 5-year Term Loan (the “Term Loan”). The maturity date of the 2016 Credit Agreement is November 8, 2021. For this section of the form 10-K, capitalized terms that are used but not otherwise defined shall have the meanings give to such terms in the 2016 Credit Agreement.
The Term Loan and, or, Revolver commitments may be increased by up to an additional $10.0 million in the aggregate.
The 2016 Credit Agreement also provides for the issuance of letters of credit in an aggregate amount equal to the lesser of $5.0 million and the Revolving Credit Commitment, which was $30.0 million as of November 8, 2016. The 2016 Credit Agreement is guaranteed by all of the Company’s present subsidiaries and will be guaranteed by the Company's future subsidiaries.
At any time throughout the term of the 2016 Credit Agreement, the Company has the option to elect one of two bases of interest rates. One interest rate option is the highest of (a) the Prime Rate, (b) the Federal Funds Rate plus 0.50% and (c) 30-day LIBOR plus 1.00%, plus, in each case, the Applicable Margin, which ranges from 1.50% to 2.50% per annum. The other interest rate option is LIBOR plus The Applicable Margin, which ranges from 2.50% to 3.50% per annum. The Applicable margin under each option is dependent upon the Company's Consolidated Total Lease Adjusted Leverage Ratio ("CTLAL") at the most recent quarterly determination date.
The 2016 Credit Agreement $35.0 million Term Loan amortizes 7.00% per year (35% in 5 years) which includes the quarterly payment of principal. The Company must enter into an interest rate swap covering at least 50% of the outstanding Term Loan within 60 days of the closing date.
The Company is obligated to pay to the Administrative Agent for the account of each lender a quarterly commitment fee based on the average daily unused amount of the commitment of such lender, ranging from 0.30% to 0.35% per annum depending on the CTLAL at the most recent quarterly determination date.
The proceeds of the 2016 Credit Agreement are available for the Company to (i) pay in full all indebtedness outstanding under the 2013 Credit Agreement as of November 8, 2016, (ii) pay fees, commissions, and expenses in connection with the Company's repayment of the 2013 Credit Agreement, initial Extensions of Credit under the 2016 Credit Agreement, and (iii) for working capital and general corporate purposes of the Company.
The 2016 Credit Agreement, as amended, contains the following covenants among others:
• | CTLAL of not more than (i) 5.00 to 1.00 at all times through and including the third fiscal quarter of the Borrower’s fiscal year 2018, and (ii) 4.75 to 1.00 at all times thereafter, |
• | Consolidated Fixed Charge Coverage Ratio of not less than 1.25 to 1.00 at all times, |
• | Limit on Growth Capital Expenditures so long as the CTLAL is at least 0.25 to 1.00 less than the then-applicable permitted maximum CTLAL, |
• | restrictions on mergers, acquisitions, consolidations and asset sales, |
• | restrictions on the payment of dividends, redemption of stock and other distributions, |
70
• | restrictions on incurring indebtedness, including certain guarantees and capital lease obligations, |
• | restrictions on incurring liens on certain of our property and the property of our subsidiaries, |
• | restrictions on transactions with affiliates and materially changing our business, |
• | restrictions on making certain investments, loans, advances and guarantees, |
• | restrictions on selling assets outside the ordinary course of business, |
• | prohibitions on entering into sale and leaseback transactions, and |
• | restrictions on certain acquisitions of all or a substantial portion of the assets, property and/or equity interests of any person, including share repurchases and dividends. |
The 2016 Credit Agreement is secured by an all asset lien on all of the Company’s real property and also includes customary events of default. If a default occurs and is continuing, the lenders’ commitments under the 2016 Credit Agreement may be immediately terminated and/or the Company may be required to repay all amounts outstanding under the 2016 Credit Agreement.
2013 Credit Agreement
In August 2013, the Company entered into a $70.0 million revolving credit facility with Wells Fargo Bank, National Association, as Administrative Agent, and ZB, N.A. dba Amegy Bank (formerly Amegy Bank, N.A.), as Syndication Agent. Pursuant to the October 2, 2015 amendment, the total aggregate amount of the lenders' commitments was lowered to $60 million from $70.0 million. The following description summarizes the material terms of the revolving credit facility, as subsequently amended on March 21, 2014, November 7, 2014 and October 2, 2015, (the revolving credit facility is referred to as the “2013 Credit Facility”). The 2013 Credit Facility was governed by the credit agreement dated as of August 14, 2013 (the “2013 Credit Agreement”) among the Company, the lenders from time to time party thereto, Wells Fargo Bank, National Association, as Administrative Agent, and ZB, N.A. dba Amegy Bank (formerly Amegy Bank, N.A.), as Syndication Agent. The maturity date of the 2013 Credit Facility was September 1, 2017. In addition to the $60 million commitment under the 2013 Credit Agreement, it may have been increased to a maximum commitment of $80 million.
The 2013 Credit Facility also provided for the issuance of letters of credit in a maximum aggregate amount of $5.0 million outstanding as of August 14, 2013 and $15.0 million outstanding at any one time with prior written consent of the Administrative Agent and the Issuing Bank. The 2013 Credit Facility was guaranteed by all of the Company’s present subsidiaries and was to be guaranteed by the Company's future subsidiaries.
At August 31, 2016, after applying the Lease Adjusted Leverage Ratio limitation, the available borrowing capacity was approximately $21.4 million
At any time throughout the term of the 2013 Credit Facility, the Company had the option to elect one of two bases of interest rates. One interest rate option was the greater of (a) the Federal Funds Effective Rate plus 0.50%, or (b) prime, plus, in either case, an applicable spread that ranges from 0.75% to 2.25% per annum. The other interest rate option was the London InterBank Offered Rate plus a spread that ranges from 2.50% to 4.0% per annum. The applicable spread under each option was dependent upon the ratio of the Company's debt to EBITDA at the most recent determination date.
The Company was obligated to pay to the Administrative Agent for the account of each lender a quarterly commitment fee based on the average daily unused amount of the commitment of such lender, ranging from 0.30% to 0.40% per annum depending on the Total Leverage Ratio at the most recent determination date.
The proceeds of the 2013 Credit Facility was available for the Company’s general corporate purposes and general working capital purposes and capital expenditures.
Borrowings under the 2013 Credit Facility were subject to mandatory repayment with the proceeds of sales of certain of the Company’s real property, subject to certain exceptions.
The 2013 Credit Agreement, as amended, contained the following covenants among others:
• | Debt Service Coverage Ratio of not less than (i) 1.10 to 1.00 at all times during the first, second and third fiscal quarters of the Borrower’s fiscal year 2015, (ii) 1.25 to 1.00 at all times during the fourth fiscal quarter of the Borrower’s fiscal year 2015, and (iii) 1.50 to 1.00 at all times thereafter, |
• | Lease Adjusted Leverage Ratio of not more than (i) 5.75 to 1.00 at all times during the first, second and third fiscal quarters of the Borrower’s fiscal year 2015, (ii) 5.50 to 1.00 at all times during the fourth fiscal quarter of the Borrower’s fiscal year 2015, (iii) 5.25 to 1.00 at all times during the first fiscal quarter of the Borrower’s fiscal year |
71
2016, (iv) 5.00 to 1.00 at all times during the second fiscal quarter of the Borrower’s fiscal year 2016, and (v) 4.75 to 1.00 at all times thereafter,
• | capital expenditures limited to $25.0 million per year, |
• | restrictions on incurring indebtedness, including certain guarantees and capital lease obligations, |
• | restrictions on incurring liens on certain of our property and the property of our subsidiaries, |
• | restrictions on transactions with affiliates and materially changing our business, |
• | restrictions on making certain investments, loans, advances and guarantees, |
• | restrictions on selling assets outside the ordinary course of business, |
• | prohibitions on entering into sale and leaseback transactions, and |
• | restrictions on certain acquisitions of all or a substantial portion of the assets, property and/or equity interests of any person, including share repurchases and dividends. |
At February 12, 2014, as the result of losses incurred from our acquired leaseholds operating as Cheeseburger in Paradise restaurants, we reported our second consecutive quarterly net profit below our required minimum net profit as defined in the 2012 Credit Agreement. As part of the March 21, 2014 amendment we received a waiver of non-compliance related to this minimum consecutive quarterly net profit debt covenant for the second quarter fiscal 2014. The November 2014 amendment revised the net profit, debt service, lease adjusted leverage ratio, borrowing rates, provided for a $25 million annual capital expenditure limit, and required liens to be perfected on all real property by January 31, 2015. As part of the October 2, 2015 amendment, the Net Profit – Two Consecutive Quarters covenant was removed.
The 2013 Credit Facility was secured by a perfected first priority lien on certain of the Company’s real property and all of the material personal property owned by the Company or any of its subsidiaries, other than certain excluded assets (as defined in the 2013 Credit Agreement). At August 31, 2016, the carrying value of the collateral securing the 2013 Credit Facility was approximately $114.1 million.
The 2013 Credit Agreement also included customary events of default. If a default occured and continued, the lenders’ commitments under the 2013 Credit Facility may have be immediately terminated and, or the Company could have been required to repay all amounts outstanding under the 2013 Credit Facility.
As of August 31, 2016, the Company had $37.0 million in outstanding loans and approximately $1.3 million committed under letters of credit, which the Company reissued as security for the payment of insurance obligations, and approximately $0.4 million in capital lease commitments.
The Company was in compliance with the covenants contained in the Credit Agreement as of August 31, 2016.
Interest Expense
Total interest expense incurred for fiscal 2016, 2015, and 2014 was approximately $2.2 million, $2.3 million, and $1.2 million, respectively. Interest paid was approximately $1.9 million, $2.1 million, and $1.4 million in fiscal 2016, 2015, and 2014, respectively. No interest expense was allocated to discontinued operations in fiscal 2016, 2015, or 2014. Interest was capitalized on properties in fiscal 2016, 2015, and 2014, in the amounts of zero, $80 thousand, and $269 thousand, respectively.
Note 10. Impairment of Long-Lived Assets, Store Closings, Discontinued Operations and Property Held for Sale
Impairment of Long-Lived Assets and Store Closings
The Company periodically evaluates long-lived assets held for use and held for sale whenever events or changes in circumstances indicate that the carrying amount of those assets may not be recoverable. The Company analyzes historical cash flows of operating locations and compares results of poorer performing locations to more profitable locations. The Company also analyzes lease terms, condition of the assets and related need for capital expenditures or repairs, as well as construction activity and the economic and market conditions in the surrounding area.
For assets held for use, the Company estimates future cash flows using assumptions based on possible outcomes of the areas analyzed. If the undiscounted future cash flows are less than the carrying value of the location’s assets, the Company records an impairment loss based on an estimate of discounted cash flows. The estimates of future cash flows, based on reasonable and supportable assumptions and projections, require management’s subjective judgments. Assumptions and estimates used include operating results, changes in working capital, discount rate, growth rate, anticipated net proceeds from disposition of the property and if applicable, lease terms. The span of time for which future cash flows are estimated is often lengthy, increasing the sensitivity to assumptions made. The time span is longer and could be 20 to 25 years for newer properties, but only 5 to 10
72
years for older properties. Depending on the assumptions and estimates used, the estimated future cash flows projected in the evaluation of long-lived assets can vary within a wide range of outcomes. The Company considers the likelihood of possible outcomes in determining the best estimate of future cash flows. The measurement for such an impairment loss is then based on the fair value of the asset as determined by discounted cash flows.
The Company recognized the following impairment charges (credits) to income from operations:
Fiscal Year Ended | |||||||||||
August 31, 2016 | August 26, 2015 | August 27, 2014 | |||||||||
(In thousands, except per share data) | |||||||||||
Provision for asset impairments and restaurant closings, net | $ | 1,442 | $ | 636 | $ | 2,717 | |||||
Net gain on disposition of property and equipment | (684 | ) | (3,994 | ) | (2,357 | ) | |||||
Total | $ | 758 | $ | (3,358 | ) | $ | 360 | ||||
Effect on EPS: | |||||||||||
Basic | $ | (0.03 | ) | $ | 0.12 | $ | (0.01 | ) | |||
Assuming dilution | $ | (0.03 | ) | $ | 0.12 | $ | (0.01 | ) | |||
The $1.4 million charge in fiscal 2016 is related to assets impaired at four Fuddruckers restaurants, a reserve for four restaurant closings, and Goodwill impairment for one closed Fuddruckers restaurant previously converted from a Cheeseburger in Paradise restaurant.
The $0.6 million charge in fiscal 2015 is related to three operating Fuddruckers restaurants.
The $2.7 million charge in fiscal 2014 is related to one operating Luby's Cafeteria, two operating Fuddruckers restaurants and two operating Cheeseburger in Paradise restaurants, and nine closed Cheeseburger in Paradise restaurants.
Discontinued Operations
On March 21, 2014, the Board of Directors of the Company approved a plan focused on improving cash flow from the acquired Cheeseburger in Paradise leasehold locations. This underperforming Cheeseburger in Paradise leasehold disposal plan called for five or more units to be closed or converted to Fuddruckers restaurants. As of August 31, 2016, two locations were reclassified to continuing operations. Of the two locations, one location reopened as a Company-owned Fuddruckers restaurant and one location was sub-leased to a Fuddruckers franchisee. Additionally, one lease was terminated and one lease expired during the fiscal year ended August 31, 2016. As of August 31, 2016, no locations were classified as discontinued operations in this plan.
As a result of the first quarter fiscal year 2010 adoption of the Company’s Cash Flow Improvement and Capital Redeployment Plan, the Company reclassified 24 Luby’s Cafeterias to discontinued operations. As of August 31, 2016, one location remains held for sale.
We believe the majority of cash flows lost will not be recovered by ongoing operations and the majority of sales lost by closing will not be recovered. In addition, there will not be any ongoing involvement or significant cash flows from the closed stores. Stores we close, but do not classify as discontinued operations, follow the implementation guidance in ASC 205-20-55 because cash flows are expected to be generated by the ongoing entity. There is some migration of customer traffic to existing or new locations, and ultimately the majority of sales lost by closing these stores are expected to be eventually replaced by sales from new locations.
The results of operations, assets and liabilities for all units included in the Plan have been reclassified to discontinued operations in the statement of operations and balance sheets for all periods presented.
Assets related to discontinued operations include deferred taxes, unimproved land, closed restaurant properties and related equipment for locations classified as discontinued operations. The following table sets forth the assets and liabilities for all discontinued operations:
73
August 31, 2016 | August 26, 2015 | ||||||
(In thousands) | |||||||
Prepaid expenses | $ | 1 | $ | 10 | |||
Assets related to discontinued operations—current | $ | 1 | $ | 10 | |||
Property and equipment | $ | 1,872 | $ | 1,872 | |||
Deferred Income Taxes | 1,320 | 1,799 | |||||
Assets related to discontinued operations—non-current | $ | 3,192 | $ | 3,671 | |||
Deferred income taxes | $ | 361 | $ | 343 | |||
Accrued expenses and other liabilities | 51 | 65 | |||||
Liabilities related to discontinued operations—current | $ | 412 | $ | 408 | |||
Other liabilities | $ | 17 | $ | 182 | |||
Liabilities related to discontinued operations—non-current | $ | 17 | $ | 182 | |||
As of August 31, 2016, under both closure plans, the Company had one property classified as a discontinued operations asset and the asset carrying value of the owned property was $1.9 million and is included in assets related to discontinued operations. The asset carrying values of the ground leases were previously impaired to zero.
The following table sets forth the sales and pretax losses reported for all discontinued locations:
Fiscal Year Ended | |||||||||||
August 31, 2016 | August 26, 2015 | August 27, 2014 | |||||||||
(In thousands, except locations) | |||||||||||
Sales | $ | — | $ | — | $ | 3,151 | |||||
Pretax loss | $ | (136 | ) | $ | (864 | ) | $ | (2,415 | ) | ||
Income tax benefit on discontinued operations | $ | 46 | $ | 406 | $ | 979 | |||||
Loss on discontinued operations | $ | (90 | ) | $ | (458 | ) | $ | (1,436 | ) | ||
Discontinued locations closed during the period | 0 | 0 | 4 | ||||||||
The following table summarizes discontinued operations for fiscal 2016, 2015, and 2014:
Fiscal Year Ended | |||||||||||
August 31, 2016 | August 26, 2015 | August 27, 2014 | |||||||||
(In thousands, except per share data) | |||||||||||
Discontinued operating losses | $ | (161 | ) | $ | (890 | ) | $ | (1,428 | ) | ||
Impairments | — | (90 | ) | (981 | ) | ||||||
Gains (losses) | 25 | 116 | (6 | ) | |||||||
Net loss | $ | (136 | ) | $ | (864 | ) | $ | (2,415 | ) | ||
Income tax benefit from discontinued operations | 46 | 406 | 979 | ||||||||
Loss from discontinued operations | $ | (90 | ) | $ | (458 | ) | $ | (1,436 | ) | ||
Effect on EPS from discontinued operations—decrease—basic | $ | 0.00 | $ | (0.01 | ) | $ | (0.05 | ) | |||
Within discontinued operations, the Company offsets gains from applicable property disposals against total impairments. The amounts in the table described as “Other” include employment termination and shut-down costs, as well as operating losses through each restaurant’s closing date and carrying costs until the locations are finally disposed.
The impairment charges included above relate to properties closed and designated for immediate disposal. The assets of these individual operating units have been written down to their net realizable values. In turn, the related properties have either been sold or are being actively marketed for sale. All dispositions are expected to be completed within one to two years. Within
74
discontinued operations, the Company also recorded the related fiscal year-to-date net operating results, employee terminations and basic carrying costs of the closed units.
Property Held for Sale
The Company periodically reviews long-lived assets against its plans to retain or ultimately dispose of properties. If the Company decides to dispose of a property, it will be reclassified to property held for sale and actively marketed. The Company analyzes market conditions each reporting period and records additional impairments due to declines in market values of like assets. The fair value of the property is determined by observable inputs such as appraisals and prices of comparable properties in active markets for assets like the Company’s. Gains are not recognized until the properties are sold.
Property held for sale includes unimproved land, closed restaurant properties and related equipment for locations not classified as discontinued operations. The specific assets are valued at the lower of net depreciable value or net realizable value. The Company actively markets all locations classified as property held for sale.
At August 31, 2016, the Company had five owned properties recorded at approximately $5.5 million in property held for sale.
At August 26, 2015, the Company had four owned properties recorded at approximately $4.5 million in property held for sale.
At August 27, 2014, the Company had one owned property recorded at approximately $1.0 million in property held for sale.
The Company’s results of continuing operations will be affected to the extent proceeds from sales exceed or are less than net book value.
A roll forward of property held for sale for fiscal 2016, 2015, and 2014 is provided below (in thousands):
Balance as of August 28, 2013 | $ | 449 | |
Disposals | (449 | ) | |
Net transfers to property held for sale | 991 | ||
Balance as of August 27, 2014 | $ | 991 | |
Disposals | (3,203 | ) | |
Net transfers to property held for sale | 6,748 | ||
Balance as of August 26, 2015 | $ | 4,536 | |
Disposals | (1,488 | ) | |
Net transfers to property held for sale | 2,474 | ||
Balance as of August 31, 2016 | $ | 5,522 | |
Abandoned Leased Facilities - Reserve for Store Closing
In fiscal 2016, the Company abandoned three Fuddruckers restaurant leased locations in Illinois, Maryland, and New York and one Luby's cafeteria leased location in Arkansas. Although the Company remains obligated under the terms of the leases for the rent and other costs that may be associated with the leases, the Company decided to cease operations and has no foreseeable plans to occupy the spaces in the future. Therefore, the Company recorded a charge to earnings, in provision for asset impairments, net, of approximately $0.2 million. The liability is equal to the total amount of rent and other direct costs for the remaining period of time the properties will be unoccupied plus the present value of the amount by which the rent paid by the Company to the landlord exceeds any rent paid to the Company by a tenant under a sublease over the remaining period of the lease terms.
Note 11. Commitments and Contingencies
Off-Balance Sheet Arrangements
The Company has no off-balance sheet arrangements, except for operating leases for the Company’s corporate office, facility service warehouse, and certain restaurant properties.
75
Claims
From time to time, the Company is subject to various other private lawsuits, administrative proceedings and claims that arise in the ordinary course of its business. A number of these lawsuits, proceedings and claims may exist at any given time. These matters typically involve claims from guests, employees and others related to issues common to the restaurant industry. The Company currently believes that the final disposition of these types of lawsuits, proceedings, and claims will not have a material adverse effect on the Company’s financial position, results of operations, or liquidity. It is possible, however, that the Company’s future results of operations for a particular quarter or fiscal year could be impacted by changes in circumstances relating to lawsuits, proceedings, or claims.
Construction Activity
From time to time, the Company enters into non-cancelable contracts for the construction of its new restaurants or restaurant remodels. This construction activity exposes the Company to the risks inherent in this industry including but not limited to rising material prices, labor shortages, delays in getting required permits and inspections, adverse weather conditions, and injuries sustained by workers. The Company had two non-cancelable contracts as of August 31, 2016.
Cheeseburger in Paradise, Royalty Commitment
The license agreement and trade name relates to a perpetual license to use intangible assets including trademarks, service marks and publicity rights related to Cheeseburger in Paradise owned by Jimmy Buffett and affiliated entities. In return, the Company will pay a royalty fee of 2.5% of gross sales, less discounts, at the Company's operating Cheeseburger in Paradise locations to an entity owned or controlled by Jimmy Buffett. The trade name represents a respected brand with positive customer loyalty, and the Company intends to cultivate and protect the use of the trade name.
Note 12. Operating Leases
The Company conducts part of its operations from facilities that are leased under non-cancelable lease agreements. Lease agreements generally contain a primary term of five to 30 years with options to renew or extend the lease from one to 25 years. As of August 31, 2016, the Company has lease agreements for 96 properties which include the Company’s corporate office, facility service warehouses and restaurant properties. The leasing terms of the 96 properties consist of 14 properties expiring in less than one year, 50 properties expiring between one and five years and the remaining 32 properties having current terms that are greater than five years. Of the 96 leased properties, 75 properties have options remaining to renew or extend the lease.
A majority of the leases include periodic escalation clauses. Accordingly, the Company follows the straight-line rent method of recognizing lease rental expense.
As of August 31, 2016, the Company has entered into noncancelable operating lease agreements for certain office equipment with terms ranging from 36 to 60 months.
Annual future minimum lease payments under noncancelable operating leases with terms in excess of one year as of August 31, 2016 are as follows:
Fiscal Year Ending: | (In thousands) | ||
August 30, 2017 | $ | 12,241 | |
August 29, 2018 | 11,051 | ||
August 28, 2019 | 9,404 | ||
August 26, 2020 | 7,238 | ||
August 25, 2021 | 5,736 | ||
Thereafter | 30,712 | ||
Total minimum lease payments | $ | 76,382 | |
Most of the leases are for periods of 5 to thirty years and some leases provide for contingent rentals based on sales in excess of a base amount.
76
Total rent expense for operating leases for fiscal years 2016, 2015, and 2014 was as follows:
Year Ended | |||||||||||
August 31, 2016 | August 26, 2015 | August 27, 2014 | |||||||||
(In thousands, except percentages) | |||||||||||
Minimum rent-facilities | $ | 12,341 | $ | 12,547 | $ | 13,160 | |||||
Contingent rentals | 164 | 129 | 251 | ||||||||
Minimum rent-equipment | 712 | 805 | 829 | ||||||||
Total rent expense (including amounts in discontinued operations) | $ | 13,217 | $ | 13,481 | $ | 14,240 | |||||
Percent of sales | 3.3 | % | 3.4 | % | 3.6 | % | |||||
See Note 14, “Related Parties,” for lease payments associated with related parties.
Note 13. Share-Based Compensation
We have two active share-based stock plans, the Employee Stock Plan and the Nonemployee Director Stock Plan. Both plans authorize the granting of stock options, restricted stock and other types of awards consistent with the purpose of the plans.
Of the 1.1 million shares approved for issuance under the Nonemployee Director Stock Plan, 1.0 million options, restricted stock units and restricted stock awards were granted, 0.2 million options were cancelled or expired and added back into the plan, since the plans inception. Approximately 0.3 million shares remain available for future issuance as of August 31, 2016. Compensation cost for share-based payment arrangements under the Nonemployee Director Stock Plan, recognized in selling, general and administrative expenses for fiscal years 2016, 2015, and 2014 was approximately $0.7 million, $0.7 million, and $0.6 million, respectively.
Of the 4.1 million shares approved for issuance under the Employee Stock Plan, 5.6 million options and restricted stock units were granted, 3.4 million options and restricted stock units were cancelled or expired and added back into the plan, since the plans inception. Approximately 1.9 million shares remain available for future issuance as of August 31, 2016. Compensation cost for share-based payment arrangements under the Employee Stock Plan, recognized in selling, general and administrative expenses for fiscal years 2016, 2015, and 2014 was approximately $1.0 million, $0.9 million, and $0.7 million, respectively.
In fiscal years 2015 and 2016, the Company approved a Total Shareholder Return, (“TSR”), Performance Based Incentive Plan which provides for a right to receive an unspecified number of shares of common stock under the Employee Stock Plan based on the total shareholder return ranking compared to a selection of peer companies over a 3-year cycle, for each plan year. The award value varies from 0% to 200% of a base amount, as a result of the Company’s TSR performance in comparison to its peers over the measurement period. The fair value of the performance awards liability at the end of fiscal years 2017 and 2018, of $0.5 million has been determined based on a Monte Carlo simulation model. Based on this estimate, management will accrue expense ratably over the 3-year service periods. The Company recorded approximately $0.4 million and approximately $0.4 million for each plan year 2016 and 2015 for this TSR Performance Based Incentive Plan expense and it is recorded as non-cash compensation expense in selling, general and administrative expenses. The number of shares at the end of each three-year period will be determined as the award value divided by the closing stock price on the last day of fiscal 2017 and fiscal 2018. A valuation estimate of the future liability associated with each fiscal year's performance award plan is performed periodically with adjustments made to the outstanding liability at each reporting period, as appropriate.
Stock Options
Stock options granted under either the Employee Stock Plan or the Nonemployee Director Stock Plan have exercise prices equal to the market price of the Company’s common stock at the date of the grant. The market price under the Employee Stock Plan is the closing price at the date of the grant. The market price under the Nonemployee Director Plan is the average of the high and the low price on the date of the grant.
Option awards under the Nonemployee Director Stock Plan generally vest 100% on the first anniversary of the grant date and expire ten years from the grant date. No options were granted under the Nonemployee Director Stock Plan in fiscal years 2016, 2015, or 2014. No options to purchase shares remain outstanding under this plan, as of August 31, 2016.
77
Options granted under the Employee Stock Plan generally vest 50% on the first anniversary of grant date, 25% on the second anniversary of the grant date and 25% on the third anniversary of the grant date, with all options expiring ten years from the grant date. All options granted in fiscal years 2016 and 2015 were granted under the Employee Stock Plan. No options were granted in fiscal year 2014. Options to purchase 1,169,238 shares at options prices from $3.44 to $11.10 per share remain outstanding as of August 31, 2016.
The Company has segregated option awards into two homogenous groups for the purpose of determining fair values for its options because of differences in option terms and historical exercise patterns among the plans. Valuation assumptions are determined separately for the two groups which represent, respectively, the Employee Stock Plans and the Nonemployee Director Stock Option Plan. The assumptions are as follows:
• | The Company estimated volatility using its historical share price performance over the expected life of the option. Management believes the historical estimated volatility is materially indicative of expectations about expected future volatility. |
• | The Company uses an estimate of expected lives for options granted during the period based on historical data. |
• | The risk-free interest rate is based on the U.S. Treasury yield curve in effect at the time of grant for the expected term of the option. |
• | The expected dividend yield is based on the Company’s current dividend yield and the best estimate of projected dividend yield for future periods within the expected life of the option. |
The fair value of each option award is estimated on the date of the grant using the Black-Scholes option pricing model which determine inputs as shown in the following table for options granted under the Employee Stock Plan:
Fiscal Year Ended(1) | |||||
August 31, 2016 | August 26, 2015 | ||||
(In thousands, except percentages) | |||||
Dividend yield | 0 | % | 0 | % | |
Volatility | 39.64 | % | 42.30 | % | |
Risk-free interest rate | 1.82 | % | 1.41 | % | |
Expected life (in years) | 5.58 | 5.61 | |||
(1) No options were granted during fiscal year ended August 27, 2014.
78
A summary of the Company’s stock option activity for fiscal years 2016, 2015, and 2014 is presented in the following table:
Shares Under Fixed Options | Weighted- Average Exercise Price | Weighted- Average Remaining Contractual Term | Aggregate Intrinsic Value | ||||||||||
(Years) | (In thousands) | ||||||||||||
Outstanding at August 28, 2013 | 882,768 | $ | 5.23 | 4.7 | $ | 2,042 | |||||||
Exercised | (29,253 | ) | 4.27 | — | — | ||||||||
Forfeited/Expired | (52,761 | ) | 10.30 | — | — | ||||||||
Outstanding at August 27, 2014 | 800,754 | $ | 4.95 | 4.1 | $ | 583 | |||||||
Granted | 628,060 | 4.49 | — | — | |||||||||
Exercised | (57,007 | ) | 3.45 | — | — | ||||||||
Forfeited/Expired | (83,708 | ) | 5.47 | — | — | ||||||||
Outstanding at August 26, 2015 | 1,288,099 | $ | 4.76 | 6.5 | $ | 350 | |||||||
Granted | 279,944 | 4.89 | — | — | |||||||||
Exercised | (21,249 | ) | 3.51 | — | — | ||||||||
Cancelled | (312,663 | ) | 4.98 | — | — | ||||||||
Forfeited/Expired | (64,893 | ) | 4.61 | — | — | ||||||||
Outstanding at August 31, 2016 | 1,169,238 | $ | 4.76 | 6.6 | $ | 178 | |||||||
Exercisable at August 31, 2016 | 656,868 | $ | 4.76 | 4.9 | $ | 175 | |||||||
The intrinsic value for stock options is defined as the difference between the current market value and the grant price.
At August 31, 2016, there was approximately $0.5 million of total unrecognized compensation cost related to unvested options that are expected to be recognized over a weighted-average period of 1.8 years.
The weighted-average grant-date fair value of options granted during fiscal years 2016 and 2015 was $1.92 and $1.83 per share, respectively. There was no grant of options during fiscal year 2014.
During fiscal years 2016, 2015, and 2014, cash received from options exercised was approximately $82,000, $190,000, and $125,000, respectively.
79
Restricted Stock Units
Grants of restricted stock units consist of the Company’s common stock and generally vest after three years. All restricted stock units are cliff-vested. Restricted stock units are valued at market price of the Company’s common stock at the date of grant. The market price under the Employee Stock Plan is the closing price at the date of the grant. The market price under the Nonemployee Director Plan is the average of the high and the low price on the date of the grant.
A summary of the Company’s restricted stock unit activity during fiscal years is presented in the following table:
Restricted Stock Units | Weighted Average Fair Value | Weighted- Average Remaining Contractual Term | |||||||
(Per share) | (In years) | ||||||||
Unvested at August 28, 2013 | 424,236 | $ | 5.74 | 2.1 | |||||
Granted | 63,238 | 7.09 | — | ||||||
Vested | (80,233 | ) | 5.39 | — | |||||
Forfeited | (9,404 | ) | 5.79 | — | |||||
Unvested at August 27, 2014 | 397,837 | $ | 6.03 | 1.6 | |||||
Granted | 84,495 | 4.54 | — | ||||||
Vested | (72,915 | ) | 4.55 | — | |||||
Forfeited | — | — | — | ||||||
Unvested at August 26, 2015 | 409,417 | $ | 5.98 | 1.6 | |||||
Granted | 172,212 | 4.87 | — | ||||||
Vested | (257,482 | ) | 6.19 | — | |||||
Forfeited | (9,314 | ) | 5.37 | — | |||||
Unvested at August 31, 2016 | 314,833 | $ | 5.23 | 1.9 | |||||
At August 31, 2016, there was approximately $0.8 million of total unrecognized compensation cost related to unvested restricted stock units that is expected to be recognized over a weighted-average period of 1.9 years.
Restricted Stock Awards
Under the Nonemployee Director Stock Plan, directors are granted restricted stock in lieu of cash payments, for all or a portion of their compensation as directors. Directors may receive a 20% premium of additional restricted stock by opting to receive stock over a minimum required amount of stock, in lieu of cash. The number of shares granted is valued at the average of the high and low price of the Company’s stock at the date of the grant. Restricted stock awards vest when granted because they are granted in lieu of a cash payment. However, directors are restricted from selling their shares until after the third anniversary of the date of the grant.
Supplemental Executive Retirement Plan
The Company has a Supplemental Executive Retirement Plan (“SERP”) designed to provide benefits for selected officers at normal retirement age with 25 years of service equal to 50% of their final average compensation offset by Social Security, profit sharing benefits, and deferred compensation. None of the Company’s executive officers participates in the Supplemental Executive Retirement Plan. Some of the officers designated to participate in the plan have retired and are receiving benefits under the plan. Accrued benefits of all actively employed participants become fully vested upon termination of the plan or a change in control (as defined in the plan). The plan is unfunded and the Company is obligated to make benefit payments solely on a current disbursement basis. On December 6, 2005, the Board of Directors voted to amend the SERP and suspend the further accrual of benefits and participation. As a result, a curtailment gain of approximately $88,000 was recognized. The net benefit recognized for the SERP for the years ended August 31, 2016, August 26, 2015, and August 27, 2014, was zero, and the unfunded accrued liability included in “Other Liabilities” on the Company’s consolidated Balance Sheets as of August 31, 2016 and August 26, 2015 was approximately $58,000 and $71,000, respectively.
80
Nonemployee Director Phantom Stock Plan
Under the Company’s Nonemployee Director Phantom Stock Plan (“Phantom Stock Plan”), nonemployee directors deferred portions of their retainer and meeting fees which, along with certain matching incentives, were credited to phantom stock accounts in the form of phantom shares priced at the market value of the Company’s common stock on the date of grant. Additionally, the phantom stock accounts were credited with dividends, if any, paid on the common stock represented by phantom shares. Authorized shares (100,000 shares) under the Phantom Stock Plan were fully depleted in early fiscal year 2003; since that time, no deferrals, incentives or dividends have been credited to phantom stock accounts. As participants cease to be directors, their phantom shares are converted into an equal number of shares of common stock and issued from the Company’s treasury stock. As of August 31, 2016, 29,627 phantom shares remained unissued under the Phantom Stock Plan.
401(k) Plan
The Company has a voluntary 401(k) employee savings plan to provide substantially all employees of the Company an opportunity to accumulate personal funds for their retirement. The Company matches 25% of participants’ contributions made to the plan up to 6% of their salary. The net expense recognized in connection with the employer match feature of the voluntary 401(k) employee savings plan for the years ended August 31, 2016, August 26, 2015, and August 27, 2014, was $350,000, $255,000, and $488,000, respectively.
Note 14. Related Parties
Affiliate Services
The Company’s Chief Executive Officer, Christopher J. Pappas, and Harris J. Pappas, a Director of the Company, own two restaurant entities (the “Pappas entities”) that may, from time to time, provide services to the Company and its subsidiaries, as detailed in the Amended and Restated Master Sales Agreement effective November 8, 2013 among the Company and the Pappas entities.
Under the terms of the Amended and Restated Master Sales Agreement, the Pappas entities continue to provide specialized (customized) equipment fabrication primarily for new construction and basic equipment maintenance, including stainless steel stoves, shelving, rolling carts, and chef tables. The total costs under the Master Sales Agreement of custom-fabricated and refurbished equipment in fiscal 2016, 2015, and 2014 were approximately $2,000, zero, and $4,000, respectively. Services provided under this agreement are subject to review and approval by the Finance and Audit Committee of the Company’s Board of Directors.
Operating Leases
In the third quarter of fiscal 2004, Messrs. Pappas became partners in a limited partnership which purchased a retail strip center in Houston, Texas. Messrs. Pappas collectively own a 50% limited partnership interest and a 50% general partnership interest in the limited partnership. An independent third party company manages the center. One of the Company’s restaurants has rented approximately 7% of the space in that center since July 1969. No changes were made to the Company’s lease terms as a result of the transfer of ownership of the center to the new partnership. The Company made payments of approximately $417,000 $416,000, and $388,000 in fiscal years 2016, 2015, and 2014, respectively, under the lease agreement which currently includes an annual base rate of $22.00 per square foot.
On November 22, 2006, the Company executed a new lease agreement with respect to this shopping center. Effective upon the Company’s relocation and occupancy into the new space in July 2008, the new lease agreement provides for a primary term of approximately 12 years with two subsequent five-year options and gives the landlord an option to buy out the tenant on or after the calendar year 2016 by paying the then unamortized cost of improvements to the tenant. The Company is currently obligated to pay rent of $22.00 per square foot plus maintenance, taxes, and insurance during the remaining primary term of the lease. Thereafter, the lease provides for reasonable increases in rent at set intervals. The new lease agreement was approved by the Finance and Audit Committee.
In the third quarter of fiscal year 2014, on March 12, 2014, the Company executed a new lease agreement for one of the Company’s Houston Fuddruckers locations with Pappas Restaurants, Inc. The lease provides for a primary term of approximately six years with two subsequent five-year options. Pursuant to the new ground lease agreement, the Company is currently obligated to pay $27.56 per square foot plus maintenance, taxes, and insurance from March 12, 2014 until November 30. 2016. Thereafter, the new ground lease agreement provides for reasonable increases in rent at set intervals. The Company made payments of $159,900, $159,900, and $79,950 during fiscal years 2016, 2015, and 2014 respectively.
81
Affiliated rents paid for the Houston property lease represented 2.6%, 2.7%, and 2.1% of total rents for continuing operations for fiscal years 2016, 2015, and 2014, respectively.
Board of Directors
Pursuant to the terms of a separate Purchase Agreement dated March 9, 2001, entered into by and among the Company, Christopher J. Pappas and Harris J. Pappas, the Company agreed to submit three persons designated by Christopher J. Pappas and Harris J. Pappas as nominees for election at the 2002 Annual Meeting of Shareholders. Messrs. Pappas designated themselves and Frank Markantonis as their nominees for directors, all of whom were subsequently elected. Christopher J. Pappas and Harris J. Pappas are brothers and Frank Markantonis is an attorney whose principal client is Pappas Restaurants, Inc., an entity owned by Harris J. Pappas and Christopher J. Pappas.
Christopher J. Pappas is a member of the Advisory Board of Amegy Bank, a Division of ZB, N.A. (formerly, Amegy Bank, N.A.), which is a lender and syndication agent under the Company’s 2013 Revolving Credit Facility.
Key Management Personnel
On February 4, 2016, Christopher Pappas and the Company entered into an amendment to Mr. Pappas’ existing employment agreement to extend the termination date thereof to August 31, 2017. Mr. Pappas continues to devote his primary time and business efforts to the Company while maintaining his role at Pappas Restaurants, Inc.
Peter Tropoli, a director of the Company and the Company’s Chief Operating Officer, and formerly the Company’s Senior Vice President, Administration, General Counsel and Secretary, is an attorney and stepson of Frank Markantonis, who is a director of the Company.
Paulette Gerukos, Vice President of Human Resources of the Company, is the sister-in-law of Harris J. Pappas, who is a director of the Company.
Note 15. Common Stock
At August 31, 2016, the Company had 500,000 shares of common stock reserved for issuance upon the exercise of outstanding stock options.
Treasury Shares
In February 2008, the Company acquired 500,000 treasury shares for $4.8 million.
82
Note 16. Earnings Per Share
A reconciliation of the numerators and denominators of basic earnings per share and earnings per share assuming dilution is shown in the table below:
Fiscal Year Ended | |||||||||||
August 31, 2016 | August 26, 2015 | August 27, 2014 | |||||||||
(In thousands, except per share data) | |||||||||||
Numerator: | |||||||||||
Loss from continuing operations | $ | (10,256 | ) | $ | (1,616 | ) | $ | (2,011 | ) | ||
NET LOSS | $ | (10,346 | ) | $ | (2,074 | ) | $ | (3,447 | ) | ||
Denominator: | |||||||||||
Denominator for basic earnings per share—weighted-average shares | 29,226 | 28,974 | 28,812 | ||||||||
Effect of potentially dilutive securities: | |||||||||||
Employee and non-employee stock options | — | — | — | ||||||||
Denominator for earnings per share assuming dilution | 29,226 | 28,974 | 28,812 | ||||||||
Loss from continuing operations: | |||||||||||
Basic | $ | (0.35 | ) | $ | (0.06 | ) | $ | (0.07 | ) | ||
Assuming dilution (a) | $ | (0.35 | ) | $ | (0.06 | ) | $ | (0.07 | ) | ||
Net loss per share: | |||||||||||
Basic | $ | (0.35 | ) | $ | (0.07 | ) | $ | (0.12 | ) | ||
Assuming dilution (a) | $ | (0.35 | ) | $ | (0.07 | ) | $ | (0.12 | ) | ||
(a) Potentially dilutive shares not included in the computation of net income per share because to do so would have been antidilutive amounted to 55,000 in fiscal year 2016, 77,000 in fiscal year 2015, and 180,000 shares in fiscal year 2014. Additionally, stock options with exercise prices exceeding market close prices that were excluded from the computation of net income per share amounted to 494,000 shares in fiscal year 2016, 415,000 shares in fiscal year 2015, and 143,000 shares in fiscal year 2014.
83
Note 17. Quarterly Financial Information
The following tables summarize quarterly unaudited financial information for fiscal years 2016 and 2015.
Quarter Ended (a) | |||||||||||||||
August 31, 2016 | June 1, 2016 | March 9, 2016 | December 16, 2015 | ||||||||||||
(91 days) | (84 days) | (84 days) | (112 days) | ||||||||||||
(In thousands, except per share data) | |||||||||||||||
Restaurant sales | $ | 91,775 | $ | 86,476 | $ | 86,314 | $ | 113,546 | |||||||
Franchise revenue | 1,839 | 1,586 | 1,700 | 2,125 | |||||||||||
Culinary contract services | 3,970 | 3,892 | 3,918 | 4,915 | |||||||||||
Vending revenue | 145 | 143 | 137 | 158 | |||||||||||
Total sales | $ | 97,729 | $ | 92,097 | $ | 92,069 | $ | 120,744 | |||||||
Loss from continuing operations | (7,789 | ) | (147 | ) | (582 | ) | (1,738 | ) | |||||||
Income (loss) from discontinued operations | (13 | ) | 13 | (17 | ) | (73 | ) | ||||||||
Net loss | $ | (7,802 | ) | $ | (134 | ) | $ | (599 | ) | $ | (1,811 | ) | |||
Net loss per share: | |||||||||||||||
Basic | $ | (0.27 | ) | $ | (0.00 | ) | $ | (0.02 | ) | $ | (0.06 | ) | |||
Assuming dilution | $ | (0.27 | ) | $ | (0.00 | ) | $ | (0.02 | ) | $ | (0.06 | ) | |||
Costs and Expenses (as a percentage of restaurant sales) | |||||||||||||||
Cost of food | 28.0 | % | 28.0 | % | 28.5 | % | 28.6 | % | |||||||
Payroll and related costs | 35.9 | % | 35.6 | % | 34.6 | % | 34.7 | % | |||||||
Other operating expenses | 16.6 | % | 15.7 | % | 15.9 | % | 16.2 | % | |||||||
Occupancy costs | 5.6 | % | 5.9 | % | 6.4 | % | 5.8 | % | |||||||
Quarter Ended (a) | |||||||||||||||
August 26, 2015 | May 6, 2015 | February 11, 2015 | November 19, 2014 | ||||||||||||
(112 days) | (84 days) | (84 days) | (84 days) | ||||||||||||
(In thousands, except per share data) | |||||||||||||||
Restaurant sales | $ | 115,361 | $ | 88,788 | $ | 85,486 | $ | 80,557 | |||||||
Franchise revenue | 2,197 | 1,578 | 1,605 | 1,581 | |||||||||||
Culinary contract services | 4,408 | 3,624 | 3,771 | 4,598 | |||||||||||
Vending revenue | 175 | 112 | 119 | 125 | |||||||||||
Total sales | $ | 122,141 | $ | 94,102 | 90,981 | $ | 86,861 | ||||||||
Income (loss) from continuing operations | 141 | 2,532 | (1,229 | ) | (2,816 | ) | |||||||||
Loss from discontinued operations | (190 | ) | (179 | ) | (130 | ) | (203 | ) | |||||||
Net income (loss) | $ | (49 | ) | $ | 2,353 | $ | (1,359 | ) | $ | (3,019 | ) | ||||
Net income (loss) per share: | |||||||||||||||
Basic | $ | (0.00 | ) | $ | 0.08 | $ | (0.05 | ) | $ | (0.11 | ) | ||||
Assuming dilution | $ | (0.00 | ) | $ | 0.08 | $ | (0.05 | ) | $ | (0.11 | ) | ||||
Costs and Expenses (as a percentage of restaurant sales) | |||||||||||||||
Cost of food | 28.5 | % | 28.4 | % | 29.8 | % | 29.2 | % | |||||||
Payroll and related costs | 34.3 | % | 33.8 | % | 34.5 | % | 35.6 | % | |||||||
Other operating expenses | 17.7 | % | 16.1 | % | 16.6 | % | 17.6 | % | |||||||
Occupancy costs | 5.4 | % | 5.4 | % | 5.9 | % | 6.1 | % | |||||||
(a) The fiscal quarter ended, August 31, 2016, consists of two four-week periods and one five-week period and the fiscal quarters ended August 26, 2015 and December 16, 2015, consists of four four-week periods. All other quarters represent three four-week periods.
Item 9. Changes in and Disagreements with Accountants on Accounting and Financial Disclosure
84
We have had no disagreements with our accountants on any accounting or financial disclosures.
Item 9A. Controls and Procedures
Evaluation of Disclosure Control and Procedures
Our management, under the supervision and with the participation of our Chief Executive Officer and Chief Financial Officer, has evaluated the effectiveness of our disclosure controls and procedures (as such term is defined in Rule 13a-15(e) under the Securities Exchange Act of 1934, as amended (the “Exchange Act”), as of August 31, 2016. Based on that evaluation, our Chief Executive Officer and Chief Financial Officer have concluded that, as of August 31, 2016, our disclosure controls and procedures were effective in providing reasonable assurance that information required to be disclosed by us in the reports that we file or submit under the Exchange Act is (i) recorded, processed, summarized and reported within the time periods specified in the SEC’s rules and forms and (ii) accumulated and communicated to the issuer’s management, including its principal executive and principal financial officers, or persons performing similar functions, as appropriate to allow timely decisions regarding required disclosure.
Management’s Report on Internal Control over Financial Reporting
Management is responsible for establishing and maintaining adequate internal control over financial reporting, as such term is defined in Exchange Act Rules 13a-15(f) and 15d-15(f). Because of its inherent limitations, internal control over financial reporting may not prevent or detect material misstatements. Also, projections of any evaluation of effectiveness to future periods are subject to risk that controls may become inadequate because of changes in conditions, or that the degree of compliance with the policies or procedures may deteriorate. Under the supervision and with the participation of our management, including our Chief Executive Officer and Chief Financial Officer, we have evaluated the effectiveness of our internal control over financial reporting based on the framework in Internal Control – Integrated Framework-2013 issued by the Committee of Sponsoring Organizations of the Treadway Commission. Based on our evaluation, we concluded that our internal control over financial reporting was effective as of August 31, 2016.
Grant Thornton LLP, the independent registered public accounting firm that audited the Consolidated Financial Statements included in this report, has also audited the effectiveness our internal control over financial reporting as of August 31, 2016, as stated in their attestation report which is included under Item 8 of this report.
Attestation Report of the Registered Public Accounting Firm
Included in Item 8 of this report.
Changes in Internal Control over Financial Reporting
Except as noted above, there were no changes in our internal control over financial reporting during the quarter ended August 31, 2016 that have materially affected, or are reasonably likely to materially affect, our internal control over financial reporting.
Item 9B. Other Information
None.
85
PART III
Item 10. Directors, Executive Officers and Corporate Governance
There is incorporated in this Item 10 by reference that portion of our definitive proxy statement for the 2017 annual meeting of shareholders appearing therein under the captions “Election of Directors,” “Corporate Governance,” “Section 16(a) Beneficial Ownership Reporting Compliance,” “Executive Officers,” and “Certain Relationships and Related Transactions.”
We have in place a Policy Guide on Standards of Conduct and Ethics applicable to all employees, as well as the board of directors, and Supplemental Standards of Conduct and Ethics for the Chief Executive Officer, Chief Financial Officer, Controller, and all senior financial officers. This Policy Guide and the Supplemental Standards were filed as exhibits to the Annual Report on Form 10-K for the fiscal year ended August 26, 2003 and can be found on our website at www.lubys.com. We intend to satisfy the disclosure requirement under Item 5.05 of Form 8-K regarding amendments to or waivers from the code of ethics or supplementary code of ethics by posting such information on our website at www.lubys.com.
Item 11. Executive Compensation
There is incorporated in this Item 11 by reference that portion of our definitive proxy statement for the 2017 annual meeting of shareholders appearing therein under the captions “Compensation Discussion and Analysis—Executive Compensation,” “—Executive Compensation Committee Report,” “—Compensation Tables and Information,” “—Director Compensation,” and “Corporate Governance—Executive Compensation Committee—Compensation Committee Interlocks.”
Item 12. Security Ownership of Certain Beneficial Owners and Management and Related Stockholder Matters
There is incorporated in this Item 12 by reference that portion of our definitive proxy statement for the 2017 annual meeting of shareholders appearing therein under the captions “Ownership of Equity Securities in the Company” and “Principal Shareholders.”
Item 13. Certain Relationships and Related Transactions, and Director Independence
There is incorporated in this Item 13 by reference that portion of our definitive proxy statement for the 2017 annual meeting of shareholders appearing therein under the captions, “Corporate Governance Guidelines—Director Independence” and “Certain Relationships and Related Transactions.”
Item 14. Principal Accountant Fees and Services
There is incorporated in this Item 14 by reference that portion of our definitive proxy statement for the 2017 annual meeting of shareholders appearing therein under the caption “Fees Paid To The Independent Registered Public Accounting Firm.”
86
PART IV
Item 15. Exhibits, Financial Statement Schedules
1. | Financial Statements |
The following financial statements are filed as part of this Report: | |
Consolidated balance sheets at August 31, 2016 and August 26, 2015. | |
Consolidated statements of operations for each of the three years in the period ended August 31, 2016. | |
Consolidated statements of shareholders’ equity for each of the three years in the period ended August 31, 2016. | |
Consolidated statements of cash flows for each of the three years in the period ended August 31, 2016. | |
Notes to consolidated financial statements | |
Reports of Independent Registered Public Accounting Firm Grant Thornton LLP | |
2. | Financial Statement Schedules |
All schedules are omitted since the required information is not present or is not present in amounts sufficient to require submission of the schedule or because the information required is included in the financial statements and notes thereto.
3. | Exhibits |
The following exhibits are filed as a part of this Report:
3(a) | Amended and Restated Certificate of Incorporation of Luby’s, Inc. (incorporated by reference to Exhibit 3.1 to the Company’s Quarterly Report on Form 10-Q for the quarter ended February 11, 2009, filed on March 20, 2009 (File No. 001-08308)). |
3(b) | Bylaws of Luby’s, Inc., as amended through July 9, 2008 (incorporated by reference to Exhibit 3.1 to the Company’s Current Report on Form 8-K filed on July 14, 2008 (File No. 001-08308)). |
3(c) | Amendment to Bylaws of Luby’s, Inc. (incorporated by reference to Exhibit 3.1 to the Company’s Current Report on Form 8-K filed on October 22, 2015 (File No. 001-08308)). |
4(a) | Rights Agreement dated January 27, 2011 between Luby’s, Inc. and American Stock Transfer & Trust Company, LLC, as Rights Agent (incorporated by reference to Exhibit 4.1 to the Company’s Current Report on Form 8-K filed on February 2, 2011 (File No. 001-08308)). |
4(b) | First Amendment to Rights Agreement, dated as of December 3, 2013, between Luby’s, Inc. and American Stock Transfer & Trust Company, LLC (incorporated by reference to Exhibit 4.2 to the Company’s Current Report on Form 8-K filed on December 3, 2013 (File No. 001-08308)). |
87
10(a) | Credit Agreement, dated as of August 14, 2013, among the Company, the lenders from time to time party thereto, Wells Fargo Bank, National Association, as administrative agent, and Amegy Bank National Association, as syndication agent (incorporated by reference to Exhibit 10.1 to the Company’s Current Report on Form 8-K filed August 19, 2013 (File No. 001-08308)). |
10(b) | First Amendment to Credit Agreement, dated as March 21, 2014, among the Company, the lenders from time to time party thereto, Wells Fargo Bank, National Association, as administrative agent, and Amegy Bank National Association, as syndication agent (incorporated by reference to Exhibit 10.1 to the Company's Current Report on Form 8-K filed on March 27, 2014 (File No. 001-08308)). |
10(c) | Second Amendment to Credit Agreement, dated as November 7, 2014, among the Company, the lenders from time to time party thereto, Wells Fargo Bank, National Association, as administrative agent, and Amegy Bank National Association, as syndication agent (incorporated by reference to Exhibit 10.1 to the Company's Current Report on Form 8-K filed on November 12, 2014 (File No. 001-08308)). |
10(d) | Third Amendment to Credit Agreement, dated as October 2, 2015, among the Company, the lenders from time to time party thereto, Wells Fargo Bank, National Association, as administrative agent, and Amegy Bank National Association, as syndication agent (incorporated by reference to Exhibit 10.1 to the Company's Current Report on Form 8-K filed on October 6, 2015 (File No. 001-08308)). |
10(e) | Nonemployee Director Deferred Compensation Plan of Luby’s Cafeterias, Inc. adopted October 27, 1994 (incorporated by reference to Exhibit 10(g) to the Company’s Quarterly Report on Form 10-Q for the quarter ended November 30, 1994, filed on January 11, 1995 (File No. 001-08308)).* |
10(f) | Amendment to Nonemployee Director Deferred Compensation Plan of Luby’s Cafeterias, Inc. adopted January 14, 1997 (incorporated by reference to Exhibit 10(m) to the Company’s Quarterly Report on Form 10-Q for the quarter ended February 28, 1997, filed on April 11, 1997 (File No. 001-08308)).* |
10(g) | Amendment to Nonemployee Director Deferred Compensation Plan of Luby’s Cafeterias, Inc. adopted March 19, 1998 (filed as Exhibit 10(o) to the Company’s Quarterly Report on Form 10-Q for the quarter ended February 28, 1998, filed on April 13, 1998 (File No. 001-08308)).* |
10(h) | Amended and Restated Nonemployee Director Stock Plan of Luby’s, Inc. adopted January 20, 2005, as amended January 24, 2007, as amended April 14, 2008 (filed as Exhibit 10(f) to the Company’s Annual Report on Form 10-K for the fiscal year ended August 27, 2008, filed on November 7, 2008 (File No. 001-08308)).* |
10(i) | Second Amended and Restated Nonemployee Director Stock Plan of Luby’s, Inc. adopted January 25, 2013 (incorporated by reference to Exhibit 10.1 to the Company’s Quarterly Report on Form 10-Q for the quarter ended February 13, 2013, filed March 25, 2013 (File No. 001-08308)).* |
10(j) | Luby’s Cafeterias, Inc. Supplemental Executive Retirement Plan dated May 30, 1996 (incorporated by reference to Exhibit 10(j) to the Company’s Annual Report on Form 10-K for the fiscal year ended August 31, 1996, filed on November 26, 1996 (File No. 001-08308)).* |
10(k) | Amendment to Luby’s Cafeterias, Inc. Supplemental Executive Retirement Plan adopted January 14, 1997 (incorporated by reference to Exhibit 10(r) to the Company’s Quarterly Report on Form 10-Q for the quarter ended February 28, 1997, filed on April 11, 1997 (File No. 001-08308)).* |
10(l) | Amendment to Luby’s Cafeterias, Inc. Supplemental Executive Retirement Plan adopted January 9, 1998 (incorporated by reference to Exhibit 10(u) to the Company’s Quarterly Report on Form 10-Q for the quarter ended February 28, 1998, filed April 13, 1998 (File No. 001-08308)).* |
10(m) | Amendment to Luby’s Cafeterias, Inc. Supplemental Executive Retirement Plan adopted May 21, 1999 (incorporated by reference to Exhibit 10(q) to the Company’s Quarterly Report on Form 10-Q for the quarter ended May 31, 1999, filed July 14, 1999 (File No. 001-08308)).* |
88
10(n) | Luby’s Incentive Stock Plan adopted October 16, 1998 (incorporated by reference to Exhibit 10(cc) to the Company’s Annual Report on Form 10-K for the fiscal year ended August 31, 1998, filed November 25, 1998 (File No. 001-08308)).* |
10(o) | Amended and Restated Luby’s Incentive Stock Plan adopted January 19, 2006 (incorporated by reference to Exhibit 10(ee) to the Company’s Quarterly Report on Form 10-Q for the quarter ended February 15, 2006, filed March 28, 2006 (File No. 001-08308)).* |
10(p) | Registration Rights Agreement dated March 9, 2001, by and among Luby’s, Inc., Christopher J. Pappas, and Harris J. Pappas (incorporated by reference to Exhibit 10.4 to the Company’s Current Report on Form 8-K filed March 15, 2001 (File No. 001-08308)). |
10(q) | Asset Purchase Agreement, dated as of June 23, 2010, by and among Luby’s, Inc., Fuddruckers, Inc., Magic Brands, LLC, Atlantic Restaurant Ventures, Inc., R. Wes, Inc., Fuddruckers of Howard County, LLC and Fuddruckers of White Marsh, LLC (incorporated by reference to Exhibit 10.1 to the Company’s Current Report on Form 8-K filed on June 29, 2010 (File No. 001-08308)). |
10(r) | Amendment to Asset Purchase Agreement, dated as of July 26, 2010, by and among Luby’s Fuddruckers Restaurants, LLC, Fuddruckers, Inc., Magic Brands, LLC, Atlantic Restaurant Ventures, Inc., R. Wes, Inc., Fuddruckers of Howard County, LLC and Fuddruckers of White Marsh, LLC (incorporated by reference to Exhibit 10.1 to the Company’s Current Report on Form 8-K filed on July 27, 2010 (File No. 001-08308)). |
10(s) | Luby’s, Inc. Amended and Restated Nonemployee Director Phantom Stock Plan effective September 28, 2001 (incorporated by reference to Exhibit 10(dd) to the Company’s Quarterly Report on Form 10-Q for the quarter ended February 13, 2002, filed on March 29, 2002 (File No. 001-08308)).* |
10(t) | Form of Indemnification Agreement entered into between Luby’s, Inc. and each member of its Board of Directors initially dated July 23, 2002 (incorporated by reference to Exhibit 10(gg) to the Company’s Annual Report on Form 10-K for the fiscal year ended August 28, 2002, filed on November 27, 2002 (File No. 001-08308)). |
10(u) | Amended and Restated Master Sales Agreement effective November 16, 2011, by and among Luby’s, Inc., Pappas Restaurants, L.P., and Pappas Restaurants, Inc. (incorporated by reference to Exhibit 10.1 to the Company’s Quarterly Report on Form 10-Q for the quarter ended May 9, 2012, filed on June 15, 2012 (File No. 001-08308)). |
10(v) | Amended and Restated Master Sales Agreement effective November 8, 2013, by and among Luby’s, Inc., Pappas Restaurants, L.P., and Pappas Restaurants, Inc. (incorporated by reference to Exhibit 10 (u) to the Company’s Annual Report on Form 10-K for the fiscal year ended August 28, 2013, filed on November 12, 2013 (File No. 001-08308)). |
10(w) | Amended and Restated Master Sales Agreement effective May 28, 2015, by and among Luby’s, Inc., Pappas Restaurants, L.P., and Pappas Restaurants, Inc. |
10(x) | Employment Agreement dated January 24, 2014, between Luby’s, Inc. and Christopher J. Pappas (incorporated by reference to Exhibit 10.1 to the Company’s Current Report on Form 8-K filed on January 27, 2014 (File No. 001-08308)).* |
10(y) | First Amendment to Employment Agreement dated December 1, 2014, between Luby’s, Inc. and Christopher J. Pappas (incorporated by reference to Exhibit 10.1 to the Company’s Current Report on Form 8-K filed on December 3, 2014 (File No. 001-08308)).* |
10(z) | Second Amendment to Employment Agreement dated February 4, 2016, between Luby’s, Inc. and Christopher J. Pappas (incorporated by reference to Exhibit 10.1 to the Company’s Current Report on Form 8-K filed on February 9, 2016 (File No. 001-08308)).* |
89
10(aa) | Form of Restricted Stock Award Agreement pursuant to the Luby’s Incentive Stock Plan (incorporated by reference to Exhibit 10.1 to the Company’s Current Report on Form 8-K filed on November 16, 2007 (File No. 001-08308)). |
10(bb) | Form of Incentive Stock Option Award Agreement pursuant to the Luby’s Incentive Stock Plan (incorporated by reference to Exhibit 10.2 to the Company’s Current Report on Form 8-K filed on November 16, 2007 (File No. 001-08308)). |
10(cc) | Luby's Incentive Stock Plan, effective as of December 5, 2015 (incorporated by reference to Annex A to the Company's Definitive Proxy Statement on Schedule 14A filed on December 16, 2016 (File No. 001-083038)). |
10(dd) | Form of Restricted Stock Award Agreement pursuant to the Luby’s Incentive Stock Plan (incorporated by reference to Exhibit 10.2 to the Company’s Current Report on Form 8-K filed on November 16, 2015 (File No. 001-08308)). |
10(ee) | Form of Incentive Stock Option Award Agreement pursuant to the Luby’s Incentive Stock Plan (incorporated by reference to Exhibit 10.1 to the Company’s Current Report on Form 8-K filed on November 16, 2015 (File No. 001-08308)). |
10(ff) | Credit Agreement, dated as of November 8, 2016, among the Company, the other credit parties thereto, the lenders from time to time party thereto, Cadence Bank, N.A. and Texas Capital Bank, N.A., as co-syndication agents and Wells Fargo Bank, National Association, as administrative agent, swingline lender, issuing lender, sole lead arranger and sole bookrunner (incorporated by reference to Exhibit 10.1 to the Company’s Current Report on Form 8-K filed on November 15, 2016 (File No. 001-08308)). |
11 | Statement regarding computation of Per Share Earnings.** |
14(a) | Policy Guide on Standards of Conduct and Ethics applicable to all employees, as well as the board of directors (incorporated by reference to Exhibit 14(a) to the Company’s Annual Report on Form 10-K for the fiscal year ended August 26, 2003, filed on November 25, 2003 (File No. 001-08308)). |
14(b) | Supplemental Standards of Conduct and Ethics for the Chief Executive Officer, Chief Financial Officer, Controller, and all senior financial officers (incorporated by reference to Exhibit 14(b) to the Company’s Annual Report on Form 10-K for the fiscal year ended August 26, 2003, filed on November 25, 2003 (File No. 001-08308)). |
21 | Subsidiaries of the Company. |
23.1 | Consent of Grant Thornton LLP. |
31.1 | Rule 13a-14(a)/15d-14(a) certification of the Principal Executive Officer pursuant to Section 302 of the Sarbanes-Oxley Act of 2002. |
31.2 | Rule 13a-14(a)/15d-14(a) certification of the Principal Financial Officer pursuant to Section 302 of the Sarbanes-Oxley Act of 2002. |
32.1 | Section 1350 certification of the Principal Executive Officer pursuant to Section 906 of the Sarbanes-Oxley Act of 2002. |
32.2 | Section 1350 certification of the Principal Financial Officer pursuant to Section 906 of the Sarbanes-Oxley Act of 2002. |
99(a) | Corporate Governance Guidelines of Luby’s, Inc., as amended October 28, 2004 (incorporated by reference to Exhibit 99(a) to the Company’s Annual Report on Form 10-K for the fiscal year ended August 29, 2007, filed on November 9, 2007 (File No. 001-08308)). |
90
101.INS | XBRL Instance Document |
101.SCH | XBRL Schema Document |
101.CAL | XBRL Calculation Linkbase Document |
101.DEF | XBRL Definition Linkbase Document |
101.LAB | XBRL Label Linkbase Document |
101.PRE | XBRL Presentation Linkbase Document |
__________________________
* | Denotes management contract or compensatory plan or arrangement. |
** | Information required to be presented in Exhibit 11 is provided in Note 16 “Earnings Per Share” of the Notes to Consolidated Financial Statements under Part II, Item 8 of this Form 10-K in accordance with the provisions of FASB Statement of Financial Accounting Standards (SFAS) No. 128, Earnings per Share. |
91
SIGNATURES
Pursuant to the requirements of Section 13 or 15(d) of the Securities Exchange Act of 1934, the registrant has duly caused this report to be signed on its behalf by the undersigned, thereunto duly authorized.
November 23, 2016 | LUBY’S, INC. | |
Date | (Registrant) | |
By: | /s/ CHRISTOPHER J. PAPPAS | |
Christopher J. Pappas | ||
President and Chief Executive Officer | ||
Pursuant to the requirements of the Securities Exchange Act of 1934, this report has been signed below by the following persons on behalf of the registrant and in the capacities and on the dates indicated.
Signature and Title | Date |
/S/ GASPER MIR, III | November 23, 2016 |
Gasper Mir, III, Director and Chairman of the Board | |
/S/ CHRISTOPHER J. PAPPAS | November 23, 2016 |
Christopher J. Pappas, Director, President and Chief Executive Officer (Principal Executive Officer) | |
/S/ PETER TROPOLI | November 23, 2016 |
Peter Tropoli, Director and Chief Operating Officer | |
/S/ K. SCOTT GRAY | November 23, 2016 |
K. Scott Gray, Senior Vice President and Chief Financial Officer, and Principal Accounting Officer (Principal Financial and Accounting Officer) | |
/S/ HARRIS J. PAPPAS | November 23, 2016 |
Harris J. Pappas, Director | |
/S/ GERALD W. BODZY | November 23, 2016 |
Gerald W. Bodzy, Director | |
/S/ JUDITH B. CRAVEN | November 23, 2016 |
Judith B. Craven, Director | |
/S/ ARTHUR R. EMERSON | November 23, 2016 |
Arthur R. Emerson, Director | |
/S/ JILL GRIFFIN | November 23, 2016 |
Jill Griffin, Director | |
/S/ J.S.B. JENKINS | November 23, 2016 |
J.S.B. Jenkins, Director | |
/S/ FRANK MARKANTONIS | November 23, 2016 |
Frank Markantonis, Director | |
/S/ JOE C. MCKINNEY | November 23, 2016 |
Joe C. McKinney, Director | |
92
EXHIBIT INDEX
3(a) | Amended and Restated Certificate of Incorporation of Luby’s, Inc. (incorporated by reference to Exhibit 3.1 to the Company’s Quarterly Report on Form 10-Q for the quarter ended February 11, 2009, filed on March 20, 2009 (File No. 001-08308)). |
3(b) | Bylaws of Luby’s, Inc., as amended through July 9, 2008 (incorporated by reference to Exhibit 3.1 to the Company’s Current Report on Form 8-K filed on July 14, 2008 (File No. 001-08308)). |
3(c) | Amendment to Bylaws of Luby’s, Inc. (incorporated by reference to Exhibit 3.1 to the Company’s Current Report on Form 8-K filed on October 22, 2015 (File No. 001-08308)). |
4(a) | Rights Agreement dated January 27, 2011 between Luby’s, Inc. and American Stock Transfer & Trust Company, LLC, as Rights Agent (incorporated by reference to Exhibit 4.1 to the Company’s Current Report on Form 8-K filed on February 2, 2011 (File No. 001-08308)). |
4(b) | First Amendment to Rights Agreement, dated as of December 3, 2013, between Luby’s, Inc. and American Stock Transfer & Trust Company, LLC (incorporated by reference to Exhibit 4.2 to the Company’s Current Report on Form 8-K filed on December 3, 2013 (File No. 001-08308)). |
10(a) | Credit Agreement, dated as of August 14, 2013, among the Company, the lenders from time to time party thereto, Wells Fargo Bank, National Association, as administrative agent, and Amegy Bank National Association, as syndication agent (incorporated by reference to Exhibit 10.1 to the Company’s Current Report on Form 8-K filed August 19, 2013 (File No. 001-08308)). |
10(b) | First Amendment to Credit Agreement, dated as March 21, 2014, among the Company, the lenders from time to time party thereto, Wells Fargo Bank, National Association, as administrative agent, and Amegy Bank National Association, as syndication agent (incorporated by reference to Exhibit 10.1 to the Company's Current Report on Form 8-K filed on March 27, 2014 (File No. 001-08308)). |
10(c) | Second Amendment to Credit Agreement, dated as November 7, 2014, among the Company, the lenders from time to time party thereto, Wells Fargo Bank, National Association, as administrative agent, and Amegy Bank National Association, as syndication agent (incorporated by reference to Exhibit 10.1 to the Company's Current Report on Form 8-K filed on November 12, 2014 (File No. 001-08308)). |
10(d) | Third Amendment to Credit Agreement, dated as October 2, 2015, among the Company, the lenders from time to time party thereto, Wells Fargo Bank, National Association, as administrative agent, and Amegy Bank National Association, as syndication agent (incorporated by reference to Exhibit 10.1 to the Company's Current Report on Form 8-K filed on October 6, 2015 (File No. 001-08308)). |
10(e) | Nonemployee Director Deferred Compensation Plan of Luby’s Cafeterias, Inc. adopted October 27, 1994 (incorporated by reference to Exhibit 10(g) to the Company’s Quarterly Report on Form 10-Q for the quarter ended November 30, 1994, filed on January 11, 1995 (File No. 001-08308)).* |
10(f) | Amendment to Nonemployee Director Deferred Compensation Plan of Luby’s Cafeterias, Inc. adopted January 14, 1997 (incorporated by reference to Exhibit 10(m) to the Company’s Quarterly Report on Form 10-Q for the quarter ended February 28, 1997, filed on April 11, 1997 (File No. 001-08308)).* |
10(g) | Amendment to Nonemployee Director Deferred Compensation Plan of Luby’s Cafeterias, Inc. adopted March 19, 1998 (filed as Exhibit 10(o) to the Company’s Quarterly Report on Form 10-Q for the quarter ended February 28, 1998, filed on April 13, 1998 (File No. 001-08308)).* |
10(h) | Amended and Restated Nonemployee Director Stock Plan of Luby’s, Inc. adopted January 20, 2005, as amended January 24, 2007, as amended April 14, 2008 (filed as Exhibit 10(f) to the Company’s Annual Report on Form 10-K for the fiscal year ended August 27, 2008, filed on November 7, 2008 (File No. 001-08308)).* |
93
10(i) | Second Amended and Restated Nonemployee Director Stock Plan of Luby’s, Inc. adopted January 25, 2013 (incorporated by reference to Exhibit 10.1 to the Company’s Quarterly Report on Form 10-Q for the quarter ended February 13, 2013, filed March 25, 2013 (File No. 001-08308)).* |
10(j) | Luby’s Cafeterias, Inc. Supplemental Executive Retirement Plan dated May 30, 1996 (incorporated by reference to Exhibit 10(j) to the Company’s Annual Report on Form 10-K for the fiscal year ended August 31, 1996, filed on November 26, 1996 (File No. 001-08308)).* |
10(k) | Amendment to Luby’s Cafeterias, Inc. Supplemental Executive Retirement Plan adopted January 14, 1997 (incorporated by reference to Exhibit 10(r) to the Company’s Quarterly Report on Form 10-Q for the quarter ended February 28, 1997, filed on April 11, 1997 (File No. 001-08308)).* |
10(l) | Amendment to Luby’s Cafeterias, Inc. Supplemental Executive Retirement Plan adopted January 9, 1998 (incorporated by reference to Exhibit 10(u) to the Company’s Quarterly Report on Form 10-Q for the quarter ended February 28, 1998, filed April 13, 1998 (File No. 001-08308)).* |
10(m) | Amendment to Luby’s Cafeterias, Inc. Supplemental Executive Retirement Plan adopted May 21, 1999 (incorporated by reference to Exhibit 10(q) to the Company’s Quarterly Report on Form 10-Q for the quarter ended May 31, 1999, filed July 14, 1999 (File No. 001-08308)).* |
10(n) | Luby’s Incentive Stock Plan adopted October 16, 1998 (incorporated by reference to Exhibit 10(cc) to the Company’s Annual Report on Form 10-K for the fiscal year ended August 31, 1998, filed November 25, 1998 (File No. 001-08308)).* |
10(o) | Amended and Restated Luby’s Incentive Stock Plan adopted January 19, 2006 (incorporated by reference to Exhibit 10(ee) to the Company’s Quarterly Report on Form 10-Q for the quarter ended February 15, 2006, filed March 28, 2006 (File No. 001-08308)).* |
10(p) | Registration Rights Agreement dated March 9, 2001, by and among Luby’s, Inc., Christopher J. Pappas, and Harris J. Pappas (incorporated by reference to Exhibit 10.4 to the Company’s Current Report on Form 8-K filed March 15, 2001 (File No. 001-08308)). |
10(q) | Asset Purchase Agreement, dated as of June 23, 2010, by and among Luby’s, Inc., Fuddruckers, Inc., Magic Brands, LLC, Atlantic Restaurant Ventures, Inc., R. Wes, Inc., Fuddruckers of Howard County, LLC and Fuddruckers of White Marsh, LLC (incorporated by reference to Exhibit 10.1 to the Company’s Current Report on Form 8-K filed on June 29, 2010 (File No. 001-08308)). |
10(r) | Amendment to Asset Purchase Agreement, dated as of July 26, 2010, by and among Luby’s Fuddruckers Restaurants, LLC, Fuddruckers, Inc., Magic Brands, LLC, Atlantic Restaurant Ventures, Inc., R. Wes, Inc., Fuddruckers of Howard County, LLC and Fuddruckers of White Marsh, LLC (incorporated by reference to Exhibit 10.1 to the Company’s Current Report on Form 8-K filed on July 27, 2010 (File No. 001-08308)). |
10(s) | Luby’s, Inc. Amended and Restated Nonemployee Director Phantom Stock Plan effective September 28, 2001 (incorporated by reference to Exhibit 10(dd) to the Company’s Quarterly Report on Form 10-Q for the quarter ended February 13, 2002, filed on March 29, 2002 (File No. 001-08308)).* |
10(t) | Form of Indemnification Agreement entered into between Luby’s, Inc. and each member of its Board of Directors initially dated July 23, 2002 (incorporated by reference to Exhibit 10(gg) to the Company’s Annual Report on Form 10-K for the fiscal year ended August 28, 2002, filed on November 27, 2002 (File No. 001-08308)). |
10(u) | Amended and Restated Master Sales Agreement effective November 16, 2011, by and among Luby’s, Inc., Pappas Restaurants, L.P., and Pappas Restaurants, Inc. (incorporated by reference to Exhibit 10.1 to the Company’s Quarterly Report on Form 10-Q for the quarter ended May 9, 2012, filed on June 15, 2012 (File No. 001-08308)). |
94
10(v) | Amended and Restated Master Sales Agreement effective November 8, 2013, by and among Luby’s, Inc., Pappas Restaurants, L.P., and Pappas Restaurants, Inc. (incorporated by reference to Exhibit 10 (u) to the Company’s Annual Report on Form 10-K for the fiscal year ended August 28, 2013, filed on November 12, 2013 (File No. 001-08308)). |
10(w) | Amended and Restated Master Sales Agreement effective May 28, 2015, by and among Luby’s, Inc., Pappas Restaurants, L.P., and Pappas Restaurants, Inc. |
10(x) | Employment Agreement dated January 24, 2014, between Luby’s, Inc. and Christopher J. Pappas (incorporated by reference to Exhibit 10.1 to the Company’s Current Report on Form 8-K filed on January 27, 2014 (File No. 001-08308)).* |
10(y) | First Amendment to Employment Agreement dated December 1, 2014, between Luby’s, Inc. and Christopher J. Pappas (incorporated by reference to Exhibit 10.1 to the Company’s Current Report on Form 8-K filed on December 3, 2014 (File No. 001-08308)).* |
10(z) | Second Amendment to Employment Agreement dated February 4, 2016, between Luby’s, Inc. and Christopher J. Pappas (incorporated by reference to Exhibit 10.1 to the Company’s Current Report on Form 8-K filed on February 9, 2016 (File No. 001-08308)).* |
10(aa) | Form of Restricted Stock Award Agreement pursuant to the Luby’s Incentive Stock Plan (incorporated by reference to Exhibit 10.1 to the Company’s Current Report on Form 8-K filed on November 16, 2007 (File No. 001-08308)). |
10(bb) | Form of Incentive Stock Option Award Agreement pursuant to the Luby’s Incentive Stock Plan (incorporated by reference to Exhibit 10.2 to the Company’s Current Report on Form 8-K filed on November 16, 2007 (File No. 001-08308)). |
10(cc) | Luby's Incentive Stock Plan, effective as of December 5, 2015 (incorporated by reference to Annex A to the Company's Definitive Proxy Statement on Schedule 14A filed on December 16, 2016 (File No. 001-083038)). |
10(dd) | Form of Restricted Stock Award Agreement pursuant to the Luby’s Incentive Stock Plan (incorporated by reference to Exhibit 10.2 to the Company’s Current Report on Form 8-K filed on November 16, 2015 (File No. 001-08308)). |
10(ee) | Form of Incentive Stock Option Award Agreement pursuant to the Luby’s Incentive Stock Plan (incorporated by reference to Exhibit 10.1 to the Company’s Current Report on Form 8-K filed on November 16, 2015 (File No. 001-08308)). |
10(ff) | Credit Agreement, dated as of November 8, 2016, among the Company, the other credit parties thereto, the lenders from time to time party thereto, Cadence Bank, N.A. and Texas Capital Bank, N.A., as co-syndication agents and Wells Fargo Bank, National Association, as administrative agent, swingline lender, issuing lender, sole lead arranger and sole bookrunner (incorporated by reference to Exhibit 10.1 to the Company’s Current Report on Form 8-K filed on November 15, 2016 (File No. 001-08308)). |
11 | Statement regarding computation of Per Share Earnings.** |
14(a) | Policy Guide on Standards of Conduct and Ethics applicable to all employees, as well as the board of directors (incorporated by reference to Exhibit 14(a) to the Company’s Annual Report on Form 10-K for the fiscal year ended August 26, 2003, filed on November 25, 2003 (File No. 001-08308)). |
14(b) | Supplemental Standards of Conduct and Ethics for the Chief Executive Officer, Chief Financial Officer, Controller, and all senior financial officers (incorporated by reference to Exhibit 14(b) to the Company’s Annual Report on Form 10-K for the fiscal year ended August 26, 2003, filed on November 25, 2003 (File No. 001-08308)). |
21 | Subsidiaries of the Company. |
95
23.1 | Consent of Grant Thornton LLP. |
31.1 | Rule 13a-14(a)/15d-14(a) certification of the Principal Executive Officer pursuant to Section 302 of the Sarbanes-Oxley Act of 2002. |
31.2 | Rule 13a-14(a)/15d-14(a) certification of the Principal Financial Officer pursuant to Section 302 of the Sarbanes-Oxley Act of 2002. |
32.1 | Section 1350 certification of the Principal Executive Officer pursuant to Section 906 of the Sarbanes-Oxley Act of 2002. |
32.2 | Section 1350 certification of the Principal Financial Officer pursuant to Section 906 of the Sarbanes-Oxley Act of 2002. |
99(a) | Corporate Governance Guidelines of Luby’s, Inc., as amended October 28, 2004 (incorporated by reference to Exhibit 99(a) to the Company’s Annual Report on Form 10-K for the fiscal year ended August 29, 2007, filed on November 9, 2007 (File No. 001-08308)). |
101.INS | XBRL Instance Document |
101.SCH | XBRL Schema Document |
101.CAL | XBRL Calculation Linkbase Document |
101.DEF | XBRL Definition Linkbase Document |
101.LAB | XBRL Label Linkbase Document |
101.PRE | XBRL Presentation Linkbase Document |
__________________________
* | Denotes management contract or compensatory plan or arrangement. |
** | Information required to be presented in Exhibit 11 is provided in Note 16 “Earnings Per Share” of the Notes to Consolidated Financial Statements under Part II, Item 8 of this Form 10-K in accordance with the provisions of FASB Statement of Financial Accounting Standards (SFAS) No. 128, Earnings per Share. |
96