Attached files
| file | filename |
|---|---|
| EX-99.1 - EX-99.1 - Ready Capital Corp | sld_ex991.htm |
| 8-K - 8-K - Ready Capital Corp | sld_8kearnings-shell.htm |
Exhibit 99.2
|
|
Supplemental Financial Data 3Q16 SutherLand Asset Management |
|
|
Disclaimer This presentation contains statements that constitute "forward-looking statements," as such term is defined in Section 27A of the Securities Act of 1933, as amended, and Section 21E of the Securities Exchange Act of 1934, as amended, and such statements are intended to be covered by the safe harbor provided by the same. These statements are based on management's current expectations and beliefs and are subject to a number of trends and uncertainties that could cause actual results to differ materially from those described in the forward-looking statements; Sutherland Asset Management Corporation (the "Company") can give no assurance that its expectations will be attained. Factors that could cause actual results to differ materially from the Company's expectations include those set forth in the Risk Factors section of the Company's Registration Statement on Form S-4, the most recent Annual Report on Form 10-K filed with the SEC on March 10, 2016, Form 10-K/A filed with the SEC on April 29, 2016 and other reports filed by the Company with the SEC, copies of which are available on the SEC's website, www.sec.gov. The Company undertakes no obligation to update these statements for revisions or changes after the date of this release, except as required by law. This presentation includes certain non-GAAP financial measures, including Core Earnings. These non-GAAP financial measures should be considered only as supplemental to, and not as superior to, financial measures in accordance with GAAP. Please refer to Appendix A for the most recent GAAP information. This presentation also contains market statistics and industry data which are subject to uncertainty and are not necessarily reflective of market conditions. These have been derived from third party sources and have not been independently verified by the Company or its affiliates. All material presented is compiled from sources believed to be reliable and current, but accuracy cannot be guaranteed. All data is as of September 30, 2016, unless otherwise noted. 1 SutherLand Asset Management |
|
|
Business overview ORIGINATIONS ACQUISITIONS
WATERFALL Asset management Manager and SEC Registered Advisor to Sutherland Asset Management Corporation
Sutherland Asset Management
Servicing KeyBank TRIMONT MIDLAND LOAN SERVICES PNC REAL ESTATE
READY CAP COMMERCIAL, LLC READY CAPITAL STRUCTURED FINANCE
READY CAP LENDING, LLC
WATERFALL Asset Management
Sutherland Asset Management
Small Balance Commercial investor property originations
Freddie Mac approved Seller and Servicer; small balance multi-family originations
Short term commercial and multifamily real estate originations
SBA Commercial Loan Originations and Servicing Operations (owner-occupied)
Loan acquisitions of performing and distressed loans through negotiated trades with regional banks and other financial institutions (e.g. non-bank lenders, special servicers.) Manager and SEC Registered Advisor to Sutherland Asset Management Corporation 2
|
|
|
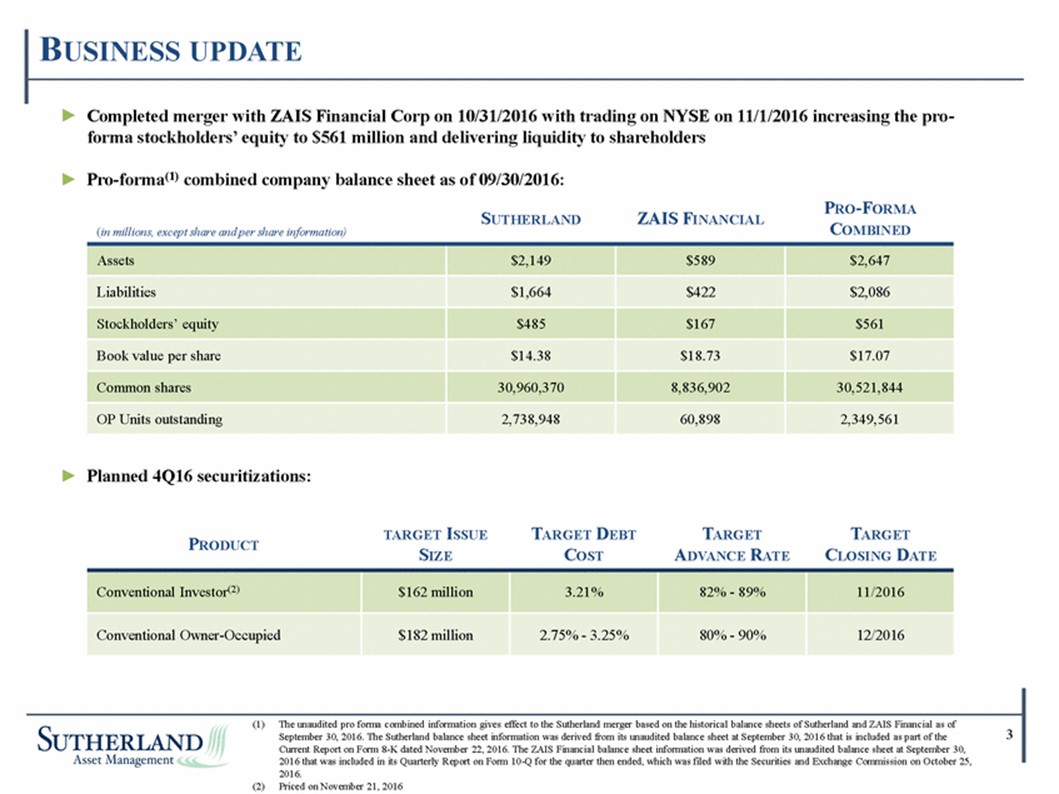
► Completed merger with ZAIS Financial Corp on 10/31/2016 with trading on NYSE on 11/1/2016 increasing the pro-forma stockholders’ equity to $561 million and delivering liquidity to shareholders ► Pro-forma(1) combined company balance sheet as of 09/30/2016: COMBINED ► Planned 4Q16 securitizations: CLOSING DATE 3 September 30, 2016. The Sutherland balance sheet information was derived from its unaudited balance sheet at September 30, 2016 that is included as part of the 2016 that was included in its Quarterly Report on Form 10-Q for the quarter then ended, which was filed with the Securities and Exchange Commission on October 25, 2016. (2) Priced on November 21, 2016 (1) The unaudited pro forma combined information gives effect to the Sutherland merger based on the historical balance sheets of Sutherland and ZAIS Financial as of Current Report on Form 8-K dated November 22, 2016. The ZAIS Financial balance sheet information was derived from its unaudited balance sheet at September 30, PRODUCT TARGET ISSUE SIZE TARGET DEBT COST TARGET ADVANCE RATE TARGET Conventional Investor(2) $162 million 3.21% 82% - 89% 11/2016 Conventional Owner-Occupied $182 million 2.75% - 3.25% 80% - 90% 12/2016 (in millions, except share and per share information) SUTHERLAND ZAIS FINANCIAL PRO-FORMA Assets $2,149 $589 $2,647 Liabilities $1,664 $422 $2,086 Stockholders’ equity $485 $167 $561 Book value per share $14.38 $18.73 $17.07 Common shares 30,960,370 8,836,902 30,521,844 OP Units outstanding 2,738,948 60,898 2,349,561 BUSINESS UPDATE |
|
|
Third Quarter 2016 Highlights ► Core earnings of $10.1 million(1), or $0.30 per common share ► Net income of $9.6 million(1), or $0.28 per common share ► Declared dividend of $0.30 per share ► Net book value of $14.38 per common share, pro-forma net book value of $17.07 per common share ► Originated $153.6 million of loans ► Gross assets exceeding $2.1 billion Returns 3Q 2016 9 Months Ended 09/30/2016 Return on Equity(2) 7.9% 7.5% Core Return on Equity(3) 8.3% 8.1% Dividend Yield 8.3% 9.9% Inclusive of non-controlling interest Return on Equity is a annualized percentage equal to quarterly net income over the average monthly total stockholders’ equity for the quarter Core Return on Equity is an annualized percentage equal to adjusted quarterly net income over the average monthly total stockholders’ equity for the quarter. Refer to slide 20 for a reconciliation of GAAP Net Income to Core Earnings 4 |
|
|
Return on Equity Business Line Levered Yield(1) Equity Allocation Acquisitions 15.7% 31.0% SBC Conventional Originations 13.0% 49.2% SBA Originations, Acquisitions & Servicing 28.6% 19.8% Cash and Other Non-earning Assets, Net Non-earning Equity Realized & Unrealized Gain, net Operating Expenses Investment advisory fees Provision for income taxes Non-recurring expenses Return on Equity Net ROE 16.9% (2.5%) 6.7% (9.6%) (1.5%) (1.1%) (1.0%) 7.9% Core Earnings 16.9% (2.5%) 6.1% (9.6%) (1.5%) (1.1%) -- 8.3% 5 Levered yields are based on net interest income and net servicing income for the quarter ended 09/30/2016 on an annualized basis, which reflects contractual interest rates, accretion of discount and servicing income net of interest expense and amortization of deferred financing costs on an annualized basis |
|
|
Acquired portfolio ► At this stage of the credit cycle, ample inventory of “scratch-and-dent” performing SBC ► Decline in Gross Levered Yield consistent with Acquired Portfolio migration from NPLs to performing loans ► Acquired $26 million of SBC loans with a levered yield of 15% ► Potential additional leverage provides for increased capacity for acquisitions Number of loans 971 Unpaid principal balance $494,605 Carrying value $428,433 Weighted average LTV 50% Weighted average interest rate 5.9% Weighted average maturity 109 months Weighted average UPB $509,377 Percentage of loans fixed/floating 46% / 54% Percentage of loans perf./non-perf. 93% / 7% Portfolio Metrics Gross Levered Yield 6 22.5% 22.3% 25.2% 22.2% 17.0% 15.7% 0.0% 5.0% 10.0% 15.0% 20.0% 25.0% 30.0% Q2 '15 Q3 '15 Q4 '15 Q1 '16 Q2 '16 Q3 '16 Sutherland Asset Management |
|
|
SBC Conventional Originations ► Originations of $140 million, a 31% increase quarter over quarter ► Origination pipeline of $154 million ► Post-election rise in 10-year Treasury yields likely to benefit SBC conventional originations ► Completed repo facility with KeyBank to fund Freddie Mac originations Number of loans 258 Unpaid principal balance $703,916 Carrying value $721,059 Weighted average LTV 67% Weighted average interest rate 6.0% Weighted average maturity 68 months Weighted average UPB $2,278,358 Percentage of loans fixed/floating 96% / 4% Percentage of loans perf./non-perf. 100% / 0% Portfolio Metrics Gross Levered Yield 7 12.5% 12.3% 14.0% 15.0% 11.6% 13.0% 0.0% 2.0% 4.0% 6.0% 8.0% 10.0% 12.0% 14.0% 16.0% Q2 '15 Q3 '15 Q4 '15 Q1 '16 Q2 '16 Q3 '16 Sutherland Asset Management |
|
|
SBA Originations, Acquisitions & Servicing Number of loans 2,735 Unpaid principal balance $653,727 Carrying value $574,761 Weighted average LTV 73% Weighted average interest rate 5.2% Weighted average maturity 168 months Weighted average UPB $239,023 Percentage of loans fixed/floating 1% / 99% Percentage of loans perf./non-perf. 97% / 3% Gross Levered Yield Portfolio Metrics ► SBA 7(a) origination program “kicks off” with 2Q/3Q hiring of 10 Business Development Officers. ► Target of 15 BDOs by end of 1Q17 ► $14.4 million of SBA secondary market loans sales with an average sale premium of 11.9% ► Originated $13.5 million, up 96% quarter over quarter ► Current pipeline of $62 million, up 74% quarter over quarter 8 31.3% 39.3% 21.1% 31.2% 29.1% 28.6% 0.0% 5.0% 10.0% 15.0% 20.0% 25.0% 30.0% 35.0% 40.0% 45.0% Q2 '15 Q3 '15 Q4 '15 Q1 '16 Q2 '16 Q3 '16 Sutherland Asset Management |
|
|
Quarterly Investment Allocation (Dollars in thousands) Acquisitions Originations SBC Freddie MAC Transitional SBA Total Gross investments $25,832 $51,597 $48,759 $39,681 $13,521 $153,558 Number of loans 102 23 23 8 15 69 Average balance(1) $279 $3,623 $2,120 $9,915 $901 $4,500 Gross Yield(2) 7.2% 6.2% 4.3%(3) 6.6% 5.9%(4) 5.7% Weighted average duration(1) 135 months 66 months 178 months 28 months 255 months 109 months FX / ARM 8% / 92% 37% / 63% 41% / 59% 6% / 94% 0% / 100% 27% / 73% Avg. Advance Rate 70% 70% 100% 52% 74% 68% Debt Cost Libor + 300 Libor + 225 Libor + 175 Libor + 200-250 Libor + 350 Libor + 231 Based on fully funded loan amount Gross yield equals contractual interest rates and accretion of discount based on Sutherland’s estimates of loan performance where applicable Please refer to slide 28 for summary of Freddie Mac return profile Please refer to slide 27 for summary of SBA 7(a) return profile 9 |
|
|
Net Interest Margin(1) Contribution by Operating Segment 10 Net interest margin is based on interest income and net servicing income, which reflects contractual interest rates, accretion of discount and servicing income net of interest expense, which reflects contractual interest rates, and deferred financing amortization 0.0% 10.0% 20.0% 30.0% 40.0% 50.0% 60.0% Q1 2015 Q2 2015 Q3 2015 Q4 2015 Q1 2016 Q2 2016 Q3 2016 Acquired Originated SBA |
|
|
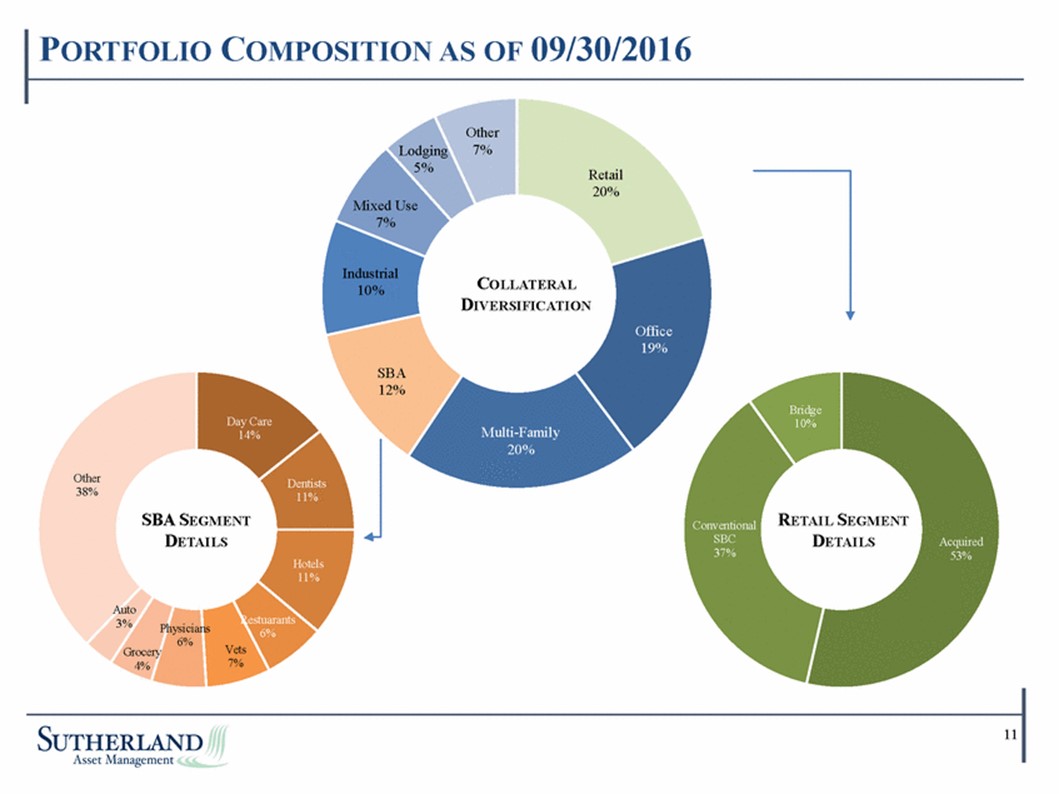
Other 7% Lodging 5% Retail 20% Mixed Use 7% Industrial 10% COLLATERAL DIVERSIFICATION Office 19% SBA 12% Bridge 10% Day Care 14% Multi-Family 20% Other 38% Dentists 11% SBA SEGMENT DETAILS RETAIL SEGMENT DETAILS Conventional SBC 37% Acquired 53% Hotels Auto 3% Restu rants Physicians 6% Vets 7% Grocery 4% 11 PORTFOLIO COMPOSITION AS OF 09/30/2016 |
|
|
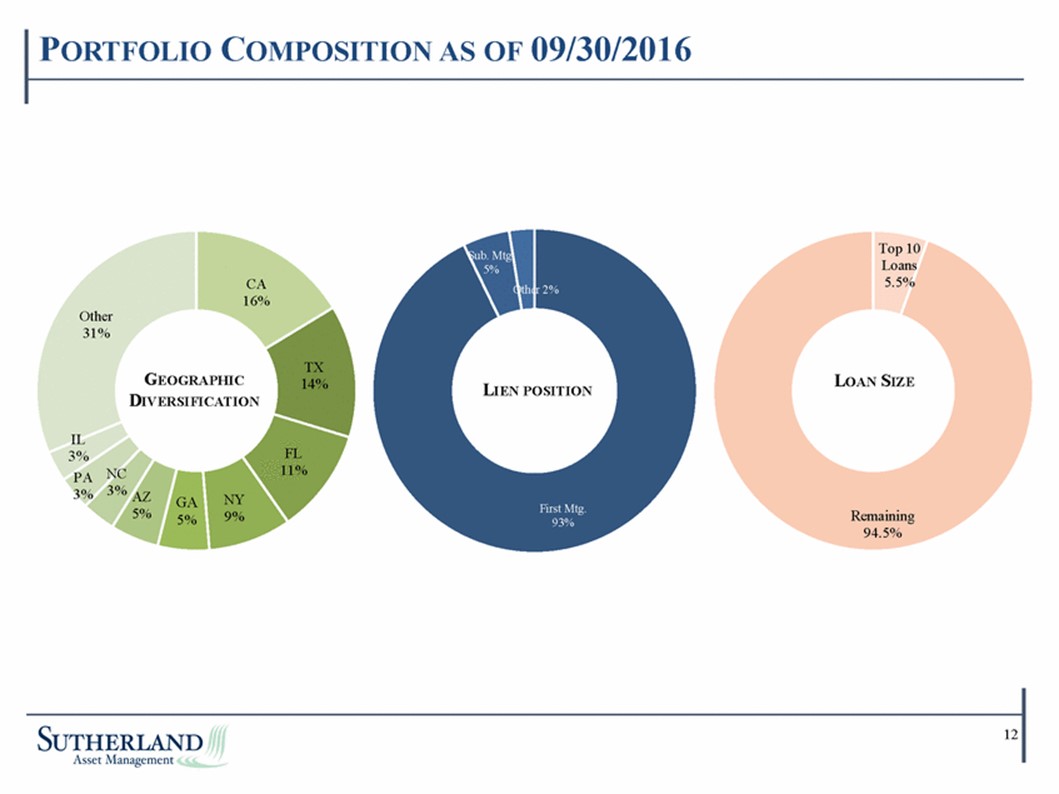
Top 10 Loans 5.5% Sub. Mt . 5% Oth r 2% CA 16% Other 31% TX 14% GEOGRAPHIC DIVERSIFICATION LOAN SIZE LIEN POSITION IL 3% PA 3% FL 11% NC 3% AZ 5% NY 9% GA 5% First Mtg. 93% Remaining 94.5% 12 PORTFOLIO COMPOSITION AS OF 09/30/2016 |
|
|
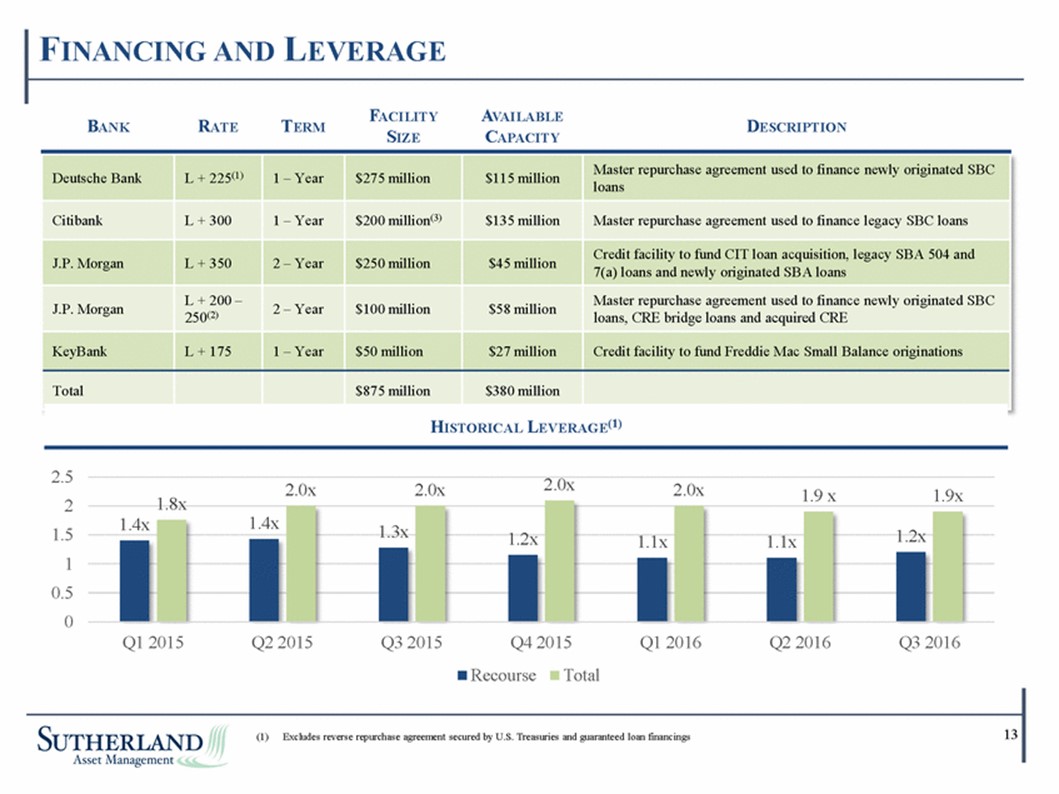
loans 7(a) loans and newly originated SBA loans loans, CRE bridge loans and acquired CRE 2.5 2 1.5 1 0.5 0 2.0x 2.0x 2.0x 2.0x 1.9 x 1.9x 1.8x 1.3x Q1 2015 Q2 2015 Q3 2015 Q4 2015 Q1 2016 Q2 2016 Q3 2016 Recourse Total (1) Excludes reverse repurchase agreement secured by U.S. Treasuries and guaranteed loan financings13 1.4x 1.4x 1.2x 1.1x 1.1x 1.2x BANK RATE TERM FACILITY SIZE AVAILABLE CAPACITY DESCRIPTION Deutsche Bank L + 225(1) 1 – Year $275 million $115 million Master repurchase agreement used to finance newly originated SBC Citibank L + 300 1 – Year $200 million(3) $135 million Master repurchase agreement used to finance legacy SBC loans J.P. Morgan L + 350 2 – Year $250 million $45 million Credit facility to fund CIT loan acquisition, legacy SBA 504 and J.P. Morgan L + 200 – 250(2) 2 – Year $100 million $58 million Master repurchase agreement used to finance newly originated SBC KeyBank L + 175 1 – Year $50 million $27 million Credit facility to fund Freddie Mac Small Balance originations Total $875 million $380 million HISTORICAL LEVERAGE(1) FINANCING AND LEVERAGE |
|
|
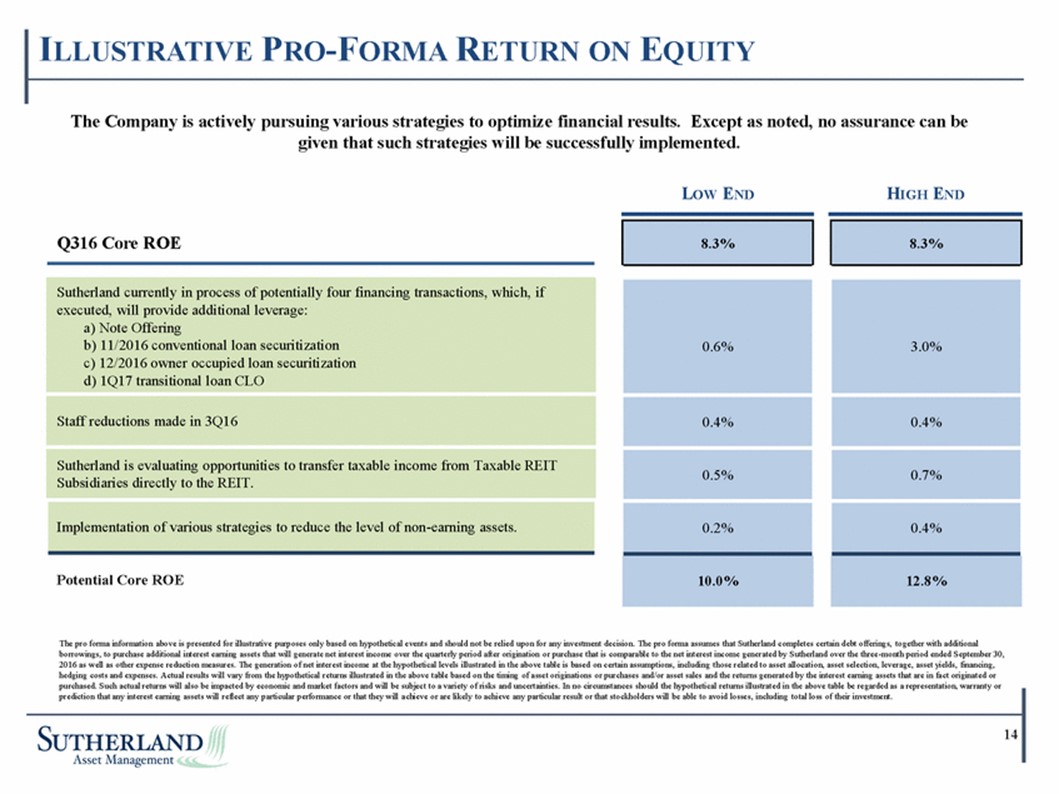
The Company is actively pursuing various strategies to optimize financial results. Except as noted, no assurance can be given that such strategies will be successfully implemented. LOW END HIGH END Q316 Core ROE Subsidiaries directly to the REIT. The pro forma information above is presented for illustrative purposes only based on hypothetical events and should not be relied upon for any investment decis cert borrowings, to purchase additional interest earning assets that will generate net interest income over the quarterly period after origination or purchase that is comparable to the net interest income generated by Sutherland over the three-month period ended September 30, 2016 as well as other expense reduction measures. The generation of net interest income at the hypothetical levels illustrated in the above table is based on certain assumptions, including those related to asset allocation, asset selection, leverage, asset yields, financing, hedging costs and expenses. Actual results will vary from the hypothetical returns illustrated in the above table based on the timing of asset originations or purchases and/or asset sales and the returns generated by the interest earning assets that are in fact originated or purchased. Such actual returns will also be impacted by economic and market factors and will be subject to a variety of risks and uncertainties. In no circumstances should the hypothetical returns illustrated in the above table be regarded as a representation, warrant y or prediction that any interest earning assets will reflect any particular performance or that they will achieve or are likely to achieve any particular result or that stockholders will be able to avoid losses, including total loss of their investment. 14 Sutherland currently in process of potentially four financing transactions, which, if executed, will provide additional leverage: a) Note Offering b) 11/2016 conventional loan securitization c) 12/2016 owner occupied loan securitization d) 1Q17 transitional loan CLO Staff reductions made in 3Q16 Sutherland is evaluating opportunities to transfer taxable income from Taxable REIT Implementation of various strategies to reduce the level of non-earning assets. Potential Core ROE 8.3% 3.0% 0.4% 0.7% 0.4% 12.8% ain debt offerings, together with additional 8.3% 0.6% 0.4% 0.5% 0.2% 10.0% ion. The pro forma assumes that Sutherland completes ILLUSTRATIVE PRO-FORMA RETURN ON EQUITY |
|
|
AVG. CARRYING VALUE AVG. DEBT BALANCE LEVERED INVESTMENT TYPE GROSS YIELD(1) DEBT COST(2) (3) YIELD Book Equity Value per Common Share Pro-forma Earnings per Common Share 15 accretion of discount and servicing income expense is calculated based on interest expense and deferred financing amortization for the quarter ended 09/30/2016 on an annualized basis. (3) Levered yields are based on net interest income and net servicing income for the quarter ended 09/30/2016 on an annualized basis, which reflects contractual interest rates, accretion of discount and servicing income net of interest expense and amortization of deferred financing costs on an annualized basis (1) Gross yields are based on interest income and net servicing income for the quarter ended 09/30/2016 on an annualized basis, which reflects contractual interest rates, (2) Sutherland finances the assets included in the Investment Type through securitizations, repurchase agreements, warehouse facilities and bank credit facilities. Interest GAAP earnings $8,794 GAAP earnings per Common Share $0.28 ROE per Common Share 7.9% Dividend yield (on beginning book value per share) 8.3% $521,055 30,521,844 $17.07 Common Stockholders’ equity $445,233 Total Common Shares outstanding 30,960,370 Book value per Common Share $14.38 Acquired portfolio $462,596 8.2% $334,972 5.3% 15.7% SBC conventional origination portfolio $696,403 6.6% $493,919 4.0% 13.0% SBA Originations, Acquisitions & Servicing $613,766 6.5% $532,005 3.2% 28.6% Total $1,772,765 7.0% $1,360,896 4.0% 16.9% SUTHERLAND SNAPSHOT |
|
|
Appendix Sutherland Asset Management |
|
|
Historical Financial Performance 17 Refer to slide 20 for a reconciliation of GAAP earnings to Core earnings $0.40 $0.27 $0.27 $0.26 $0.28 $0.40 $0.43 $0.31 $0.27 $0.30 $0.35 $0.50 $0.38 $0.38 $0.30 $- $0.10 $0.20 $0.30 $0.40 $0.50 $0.60 Q3 2015 Q4 2015 Q1 2016 Q2 2016 Q3 2016 $ Per share Earnings Core earnings (1) Dividend declared Sutherland Asset Management |
|
|
Balance Sheet by Quarter 18 (In millions, except per share values) 9/30/2015 12/31/2015 3/31/2016 6/30/2016 9/30/2016 Assets Cash and cash equivalents $ 80.3 $ 41.6 $ 59.9 $ 55.0 $ 38.5 Restricted cash 27.7 14.8 16.7 14.7 15.9 Short term investments 250.0 250.0 250.0 250.0 250.0 Loans, held at fair value 360.8 155.1 174.3 212.9 233.6 Loans held for sale, at fair value - - - - 23.3 Loans, held-for-investment 847.3 927.2 899.5 939.0 923.5 Mortgage backed securities, at fair value 205.0 213.5 117.1 27.0 34.8 Real estate acquired in settlement of loans 11.4 8.2 6.7 8.0 6.3 Derivative instruments, at fair value (asset) 1.5 0.7 0.7 0.6 0.4 Servicing rights 30.3 27.3 26.0 24.4 23.4 Assets of consolidated VIEs 478.9 649.0 622.7 577.5 554.3 Other assets 55.0 42.4 43.7 38.2 44.7 Total Assets $ 2,348.2 $ 2,329.8 $ 2,217.3 $ 2,147.3 $ 2,148.7 Liabilities Borrowings under credit facilities 112.0 175.3 161.4 191.0 228.0 Promissory note payable - - - 9.2 9.0 Securitized debt obligations of consolidated VIEs 361.2 461.5 435.0 401.8 374.8 Borrowings under repurchase agreements 769.0 644.1 614.6 568.8 581.8 Guaranteed loan financing 528.1 499.2 470.6 439.5 415.4 Repair and denial reserve 13.0 8.1 6.6 6.5 6.8 Accrued salaries, wages and commissions 5.5 7.1 3.0 4.0 5.5 Derivative instruments, at fair value (liabilities) 5.9 1.5 3.7 4.4 3.4 Accounts payable and other accrued liabilities 59.4 52.8 33.1 34.2 39.4 Total Liabilities $ 1,854.1 $ 1,849.6 $ 1,728.0 $ 1,659.4 $ 1,664.1 Stockholders’ Equity Additional paid-in capital 442.6 447.2 447.2 449.5 449.5 Retained earnings (deficit) 12.4 (5.9) 2.5 (1.3) (4.3) Sutherland Asset Management Corporation Equity 455.0 441.3 449.7 448.2 445.2 Non-controlling interests 39.1 38.9 39.6 39.7 39.4 Total Stockholders' Equity 494.1 480.2 489.3 487.9 484.6 Total Liabilities andStockholders' Equity $ 2,348.2 $ 2,329.8 $ 2,217.3 $ 2,147.3 $ 2,148.7 Book Value per Share $ 14.90 $ 14.32 $ 14.59 $ 14.47 $ 14.38 Sutherland Asset Management |
|
|
Statement of Income by Quarter 19 (In millions, except per share values) Q3 2015 Q4 2015 Q1 2016 Q2 2016 Q3 2016 Interest income Loans, held-for-investment $ 31.6 $ 32.0 $ 32.3 $ 30.8 $ 27.0 Loans, held at fair value 5.0 3.8 3.4 2.7 3.9 Loans, held for sale, at fair value - - - - 0.2 Mortgage backed securities, at fair value 3.0 3.1 2.2 1.0 0.8 Total interest income 39.6 38.9 37.9 34.5 31.9 Interest expense Borrowings under credit facilities (1.4) (1.3) (2.0) (2.1) (2.5) Securitized debt obligations (2.9) (3.7) (4.5) (4.4) (4.2) Borrowings under repurchase agreements (4.4) (4.0) (3.9) (3.7) (4.1) Guaranteed loan financing (4.9) (4.1) (3.9) (3.4) (3.3) Total interest expense (13.6) (13.1) (14.3) (13.6) (14.1) Net interest income before provision for loan losses 26.0 25.8 23.6 20.9 17.8 Provision for loan losses (4.1) (4.1) (2.2) (2.0) (0.5) Net interest income after provision for loan losses 21.9 21.7 21.4 18.9 17.3 Other income (expense) Other income 4.0 4.4 2.3 1.3 1.7 Servicing income, net of amortization and impairment 1.0 (0.3) 1.4 1.3 1.7 Employee compensation and benefits (5.5) (6.4) (6.0) (4.2) (5.7) Professional fees (1.5) (1.1) (1.8) (3.7) (3.1) Management and incentive fees (2.6) (1.6) (1.8) (1.8) (1.8) Loan servicing expense (0.7) (1.0) (0.9) (1.2) (1.8) Operating expenses (3.6) (3.1) (3.8) (4.8) (3.4) Total other income (expense) (8.9) (9.1) (10.6) (13.1) (12.4) Realized gain (loss) 3.0 (2.2) 0.2 1.1 2.5 Unrealized gain (loss) (0.3) 2.8 (0.3) 2.6 3.5 Net income before income tax (expense) benefit and discontinued operations 15.7 13.2 10.7 9.5 10.9 Gain (loss) from discontinued operations 0.3 (1.6) (0.4) - - Income tax (expense) benefit (2.6) (2.7) (1.2) (0.9) (1.3) Net income after tax (expense) benefit and discontinued operations 13.4 8.9 9.1 8.6 9.6 Less: Net income attributable to non-controlling interests 1.1 0.7 0.7 0.7 0.8 Net income attributable to Common Shareholders $ 12.3 $ 8.2 $ 8.4 $ 7.9 $ 8.8 Earnings per share $ 0.40 $ 0.27 $ 0.27 $ 0.26 $ 0.28 Weighted average common shares outstanding 30,360,347 30,804,029 30,804,029 30,960,370 30,960,370 Sutherland Asset Management |
|
|
Core Earnings Reconciliation 20 (In millions, except per share values) Q3 2015 Q4 2015 Q1 2016 Q2 2016 Q3 2016 Net income $ 13.4 $ 8.9 $ 9.1 $ 8.6 $ 9.6 Reconciling items: Unrealized (gain) loss on mortgage-backed securities 1.3 3.8 (2.0) (1.6) (0.7) Realized (gain) loss on mortgage-backed securities - - 3.1 0.5 - Merger transaction costs - - - 1.7 0.9 Gain on sale of SBA license (1.3) - - - - Employee severance - - - - 0.3 (Gain) loss on discontinued operations, net of tax (0.3) 1.6 0.3 - - Total reconciling items (0.3) 5.4 1.4 0.6 0.5 Core earning before income taxes 13.1 14.3 10.5 9.2 10.1 Income tax adjustment 0.5 - - - - Core earnings 13.6 14.3 10.5 9.2 10.1 Sutherland Asset Management |
|
|
Corporate Overview Sutherland Asset Management |
|
|
SLD Overview ► Sutherland Asset Management Corporation (“SLD” or the “Company”), formed on November 4, 2013, is a Maryland-based externally-managed commercial mortgage REIT that is advised by Waterfall Asset Management (“WAM”) ► SLD acquires, originates, services and finances (i) small balance commercial (“SBC”) loans, and (ii) loans issued under programs administered by the Small Business Administration (“SBA”) and Freddie Mac SBC loans are generally secured by properties with a value of $5M or less ► SLD operates mainly in three segments: SLD: manages the Company’s investments in distressed SBC loans ReadyCap Commercial: originates SBC loans ReadyCap Lending: originates and services SBA loans Acquired SBA platform and portfolio from CIT in 2014 Holds 1 of 14 SBA non-bank licenses issued in the U.S. ► WAM: Founded in 2005, WAM is an SEC-registered specialist credit manager focused on high-yield Asset Backed Securities and real estate and consumer debt investment with over $5.9 billion in assets under management 22 Sutherland Asset Management |
|
|
SLD Overview Acquired Loans Top 5 acquirer of SBC loans since crisis WAM has reviewed approximately 334,000 performing, sub-performing and non-performing SBC and SBA loans, priced approximately 162,000 of these loans and acquired more than 9,200 SBC and SBA loans with aggregate UPB of approximately $3.6 billion for an aggregate purchase price of approximately $2.7 billion. Additionally, WAM has also acquired more than $487.7 million in UPB of SBC ABS notes over this time period Represents 31.0% of SAM’s equity allocation ReadyCap Lending is a market leader in SBA 7(a) loan origination and servicing ReadyCap Lending holds one of only 14 non-bank SBLC licenses which provides a unique advantage in origination and acquisition of 7(a) loans. Of the 14 license holders, only four are actively originating The Company commenced ReadyCap Lending SBA 7(a) originations in 3Q15 Represents 19.9% of SAM’s equity allocation Originated Loans ReadyCap Commercial is a TRS and market-leading nationwide originator, focused solely on providing SBC loans (First mortgage loans, "Mini-perm" loans, Bridge loans, and Mezzanine loans) Originated more than $1.2 billion in loans across 33 states since inception in 09/2012 Represents 49.2% of SAM’s equity allocation 23 Sutherland Asset Management |
|
|
SLD History 2007 2008 2009 2010 2011 2012 2013 2005 2014 2015 2016 July 2007 Launch of loan strategies August 2008 Acquired performing SBC Loan pool from Lehman Brothers June 2009 Purchased SBC ABS equity tranches from Washington Mutual February 2011 First non performing SBC loan securitization ($41 million) March 2011 First performing SBC loan securitization ($98 million) November 2011 Formation of Sutherland Fund with contributed assets from Victoria Funds ($138 million assets) WAM founded; Launch of ABS Strategies March 2005 April 2012 Coldwell Banker Commercial Alliance formed September 2012 ReadyCap Commercial origination formed December 2013 Raised $226 million in Rule 144A Offering June 2014 Acquisition of CIT SBA platform / portfolio ($573 million UPB) – merged into ReadyCap Lending October 2014 First securitization of SBC mortgage loans originated by ReadyCap ($182 million) 2Q 2015 Seasoned SBA 7(a) Securitization October 2016 Closed Merger with ZAIS Financial Corp. Q4 2016 Anticipated completion conventional loan and owner occupied loan securitizations 24 Sutherland Asset Management
|
|
|
SLD Business Overview Loan Acquisition Business Conventional Loans Bridge Loans Freddie Mac SBL Program SBA 7(a) Origination Business(es) Booking Entity: SLD ReadyCap Commercial ReadyCap Lending Principal Business Activity / Secured by: Acquires pools of performing, sub-performing, and non-performing SBC loans from banks, other lenders, the FDIC, special services and others First mortgages on investor-owned commercial, multi-family or mixed-use properties. Multifamily properties with five units or more First mortgages on owner-occupied commercial properties that are 75% guaranteed by the SBA Typical Size: $500K - $10M $750K - $10M $1M to $15M $1M to $5M Up to $5M Rate: Fixed / floating Fixed / floating Fixed / floating Fixed / floating Typically floating Original Term: 5-30 years (18-36 months hold) 5-10 years 24-36 months 5-20 years 25 years Amortization: Fully amortizing 15-20 years Interest only Up to 30 years Fully amortizing Personal Guarantee: Typically Personal and / or carve-out guarantee Personal and / or carve-out guarantee No Yes Funding Strategy Credit Facilities and Securitizations Credit Facilities and Securitizations Guaranteed portion (75%) sold to unaffiliated parties, non-guaranteed portion retained Sutherland Asset Management 25 |
|
|
Attractive Markets: SBC Offers Compelling Risk-adjusted Returns SBC property market has lagged the larger CRE/housing markets over the last ~2 years due to limited institutional investment Provides strong relative value versus other real estate classes Historical Price Performance Typical Asset Characteristics SBC loans generate higher yields with less credit exposure compared to residential and large balance commercial loans and are backed by personal guarantee SBC loans are secured by first liens on commercial real estate properties valued under $5 million 26 Source: Boxwood Means Inc., Moody’s / RCA and S&P / Case-Shiller. 60.00 80.00 100.00 120.00 140.00 2006 2007 2008 2009 2010 2011 2012 2013 2014 2015 Residential (S&P/Case-Shiller Index) Commercial (CPPI) SBC (Boxwood Means Index) $225,000 atleast $20 million $2.0 million 80% 65% 60% 4.0% 4.0% 7.0% N/A 1.4x 1.6x 5.0% 6.0% 8.0% yes No yes Average Initial principal balance Loan to value yield debt service coverage ratio cap rate personal guarantee residential housing large balance commercial loans small balance commercial loans % peak-to-trough % recovery residential commercial 35.1)% 35.3% (40.5)% 62.5% sbc (22.3)% 16.3%
Sutherland Asset Management |
|
|
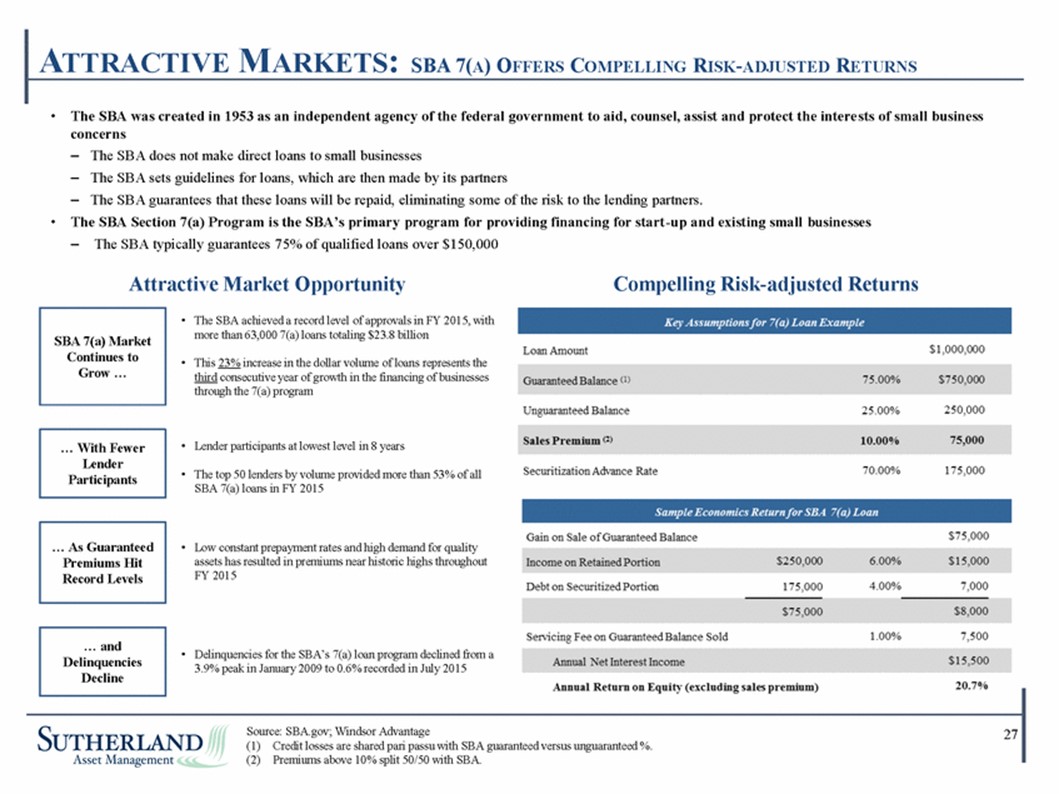
• The SBA was created in 1953 as an independent agency of the federal government to aid, counsel, assist and protect the intere sts of small business concerns – – – The SBA does not make direct loans to small businesses The SBA sets guidelines for loans, which are then made by its partners The SBA guarantees that these loans will be repaid, eliminating some of the risk to the lending partners. • The SBA Section 7(a) Program is the SBA’s primary program for providing financing for start-up and existing small businesses – The SBA typically guarantees 75% of qualified loans over $150,000 Attractive Market Opportunity Compelling Risk-adjusted Returns • The SBA achieved a record level of approvals in FY 2015, with more than 63,000 7(a) loans totaling $23.8 billion • This 23% increase in the dollar volume of loans represents the third consecutive year of growth in the financing of businesses through the 7(a) program • Lender participants at lowest level in 8 years • The top 50 lenders by volume provided more than 53% of all SBA 7(a) loans in FY 2015 • Low constant prepayment rates and high demand for quality assets has resulted in premiums near historic highs throughout FY 2015 • Delinquencies for the SBA’s 7(a) loan program declined from a 3.9% peak in January 2009 to 0.6% recorded in July 2015 (1) Credit losses are shared pari passu with SBA guaranteed versus unguaranteed %. Source: SBA.gov; Windsor Advantage27 (2) Premiums above 10% split 50/50 with SBA. … and Delinquencies Decline … As Guaranteed Premiums Hit Record Levels … With Fewer Lender Participants SBA 7(a) Market Continues to Grow … ATTRACTIVE MARKETS: SBA 7(A) OFFERS COMPELLING RISK-ADJUSTED RETURNS |
|
|
Attractive Markets: Freddie Mac Offers Compelling Risk-adjusted Returns 28 SBL Seller/Servicer Requirements SBL Options & Qualifications Freddie Mac’s SBL program created a platform for approved SBL Sellers/Servicers to originate and sell loans on smaller rental properties. ReadyCap is an approved Seller/Servicer under the program which is advantageous as it allows for a significantly more streamlined sourcing and underwriting process. The process is as follows: (i) an SBL Pricing Grid is distributed to approved Seller/Services weekly, (ii) Seller/Servicers source SBLs that comply with clear cut guidelines (as discussed below), (iii) after submission of loan request to Freddie Mac Seller/Servicers may rate lock, (iv) due diligence is completed which includes a property inspection by Freddie Mac regional staff, (v) loans are closed using joint single counsel and pre-approved documentation, and (vi) Seller/Servicers submit final delivery package, Freddie Mac reviews, approves and purchases the loans. Assessment – Each Seller/Servicer will undergo a comprehensive assessment, evaluating their financial condition and their small loan origination and servicing platform. Origination – Each Seller/Servicer is committed to delivering a minimum of $50 to $75 million in SBLs per quarter. Repurchase – Each Seller/Servicer is required to repurchase any SBL that becomes delinquent (60 days or more) and for certain non-monetary defaults for up to 12 months or securitization. Loss Sharing – Each Seller/Servicer is subject to a 10% top pool-level loss obligation up to securitization. B-Piece Purchase – Each Seller/Servicer is obligated to purchase the B-Piece upon securitization of their loans. Collateral Requirement – Each Seller/Servicer will post collateral to support the SBL repurchase, loss share and B-Piece purchase obligations described above. |
|
|
States with Funded Loans Headquarters Sales Offices The ReadyCap origination platform generates an attractive risk spread premium by lending to borrowers that fall just outside of credit guidelines of many banks. The Company uses an extensive network of existing relationships to source origination opportunities Actively Recruiting ReadyCap’s staff of 123 employees includes professionals who have extensive experience in the conventional SBC and SBA loan origination business and full-time retail loan officers spread across the United States that interact directly with borrowers during the loan origination process ReadyCap has originated more than $1.2billion in conventional and SBA loans in 33 states since ReadyCap’s inception in September 2012 and through September 30, 2016 Current pipeline of $216 million in originations ReadyCap Commercial ReadyCap Lending NY0 08HT3 / 80 72 14 _1.wor ReadyCap Commercial is a TRS and market-leading nationwide originator, focused solely on providing SBC loans In mid-2014, ReadyCap acquired CIT’s Small Business Lending Platform, along with a SBA license, $570 million portfolio, $1.2 billion of SBA 7(a) servicing rights, and technology licenses for both the origination and servicing systems Unique suite of product offerings, comprising Conventional Loans, Bridge Loans and Mezzanine Loans Holds one of only 14 non-bank licenses to originate loans guaranteed under the SBA Section 7(a) Program and performs origination, loan management and other functions with respect to SBA loans Approved Freddie Mac seller / servicer in the recently launched Small Balance Loan (“SBL”) program and it has commenced the origination of loans under such program ReadyCap Lending can leverage the Company’s deep SBA expertise to provide financing solutions and liquidity to small business owners nationwide 29 ROBUST ORIGINATION AND ACQUISITION PLATFORM |
|
|
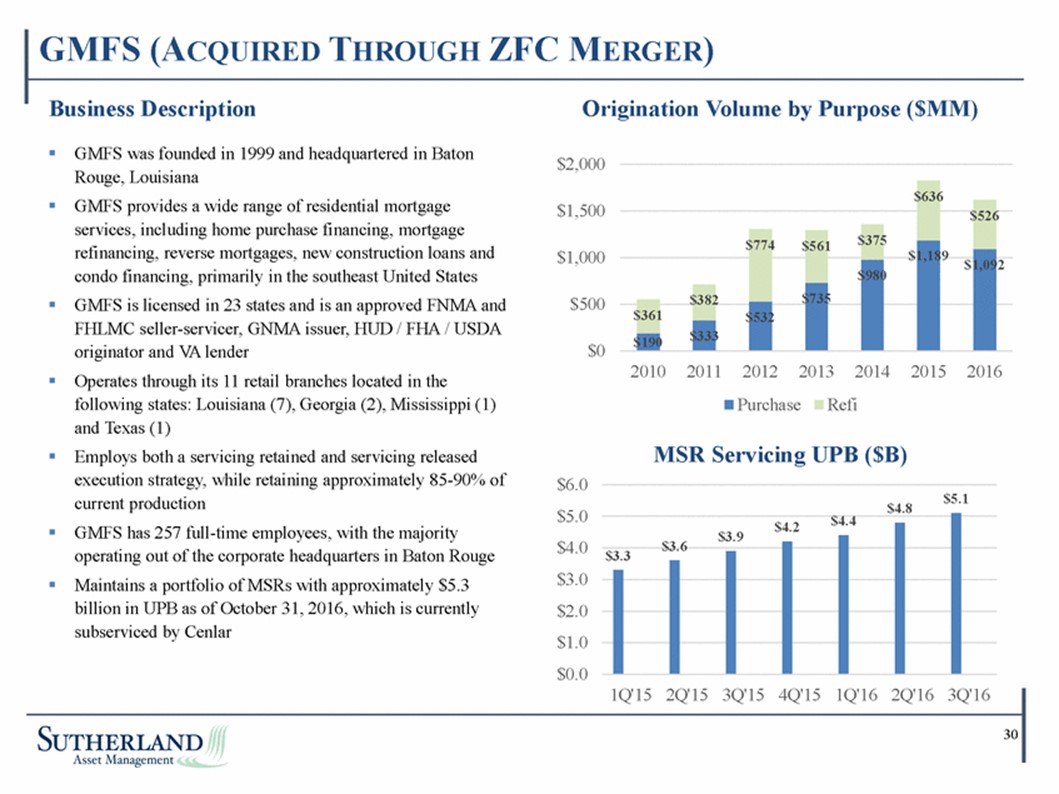
Business Description Origination Volume by Purpose ($MM) GMFS was founded in 1999 and headquartered in Baton Rouge, Louisiana GMFS provides a wide range of residential mortgage services, including home purchase financing, mortgage refinancing, reverse mortgages, new construction loans and condo financing, primarily in the southeast United States GMFS is licensed in 23 states and is an approved FNMA and FHLMC seller-servicer, GNMA issuer, HUD / FHA / USDA originator and VA lender Operates through its 11 retail branches located in the following states: Louisiana (7), Georgia (2), Mississippi (1) and Texas (1) Employs both a servicing retained and servicing released execution strategy, while retaining approximately 85-90% of current production GMFS has 257 full-time employees, with the majority operating out of the corporate headquarters in Baton Rouge Maintains a portfolio of MSRs with approximately $5.3 billion in UPB as of October 31, 2016, which is currently subserviced by Cenlar $2,000 $636 $1,500 $526 $375 $774 $561 $1,000 9 $980 $735 $382 $500 $361 $532 $333 $190 $0 2010 2011 2012 2013 2014 2015 2016 Purchase Refi MSR Servicing UPB ($B) $6.0 $5.0 $4.0 $3.0 $2.0 $1.0 $0.0 $5.1 $4.8 $4.4 $4.2 $3.9 $3.6 $3.3 1Q'15 2Q'15 3Q'15 4Q'15 1Q'16 2Q'16 3Q'16 30 $ 1,18 1,09 2 $ GMFS (ACQUIRED THROUGH ZFC MERGER) |