Attached files
| file | filename |
|---|---|
| EX-99.1 - EX-99.1 - Nimble Storage Inc | d300380dex991.htm |
| 8-K - 8-K - Nimble Storage Inc | d300380d8k.htm |
Exhibit 99.2
Nimble Storage Inc. Q3FY17 Shareholder Letter
Executive Summary
Organizations rely on applications to accelerate core business processes and to drive digital transformation, and these applications in turn expect fast, uninterrupted access to data from the underlying infrastructure. Infrastructure constraints that create an app-data gap negatively impact business outcomes.
Our long-term vision is to eliminate this app-data gap with our Predictive Flash platform that leverages the Nimble OS and InfoSight Predictive Analytics as its two core building blocks. We believe that our Hybrid and All Flash arrays, powered by the Nimble OS, are unmatched in delivering performance cost-effectively by leveraging flash memory, scaling to PB-scale deployments, and providing rich, application-centric data management services. The second building block is InfoSight, which leverages cloud-based predictive analytics and machine learning to deliver unmatched operational simplicity, infrastructure availability and cross-stack and cross-customer visibility.
Our market opportunity derives from the disruption underway in data center infrastructure as customers look to radically simplify IT infrastructure and minimize costs. First, we believe that we can continue to gain share from legacy storage vendors whose complex storage solutions are no longer competitive. Second, we have an opportunity to leverage the shift towards converged infrastructure. Third, as customers increasingly leverage the public cloud, we have an opportunity to enhance our Predictive Flash platform to provide a multi-tenant SaaS offering. Consequently, we believe that we have the opportunity to emerge as a leading next generation infrastructure provider.
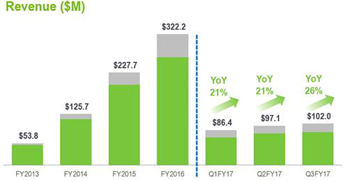
We executed well against this opportunity during Q3FY17 as our revenue growth accelerated from 21% in 1HFY17 to 26% in Q3FY17, driven by strong performance against our strategic priorities.
| • | Strong All Flash array (AFA) momentum with AFAs accounting for 24% of total product bookings and 30% of total array bookings in Q3FY17, up from 17% and 23%, respectively, in Q2FY17. During Q3FY17, 217 customers purchased our AFA products as compared to 133 customers in Q2FY17. 115 of the 217 customers are “new to Nimble” customers. In just our second full quarter after launching our AFA, our annualized bookings run rate for our AFA is approximately $100M. |
| • | Large deals accelerating growth as bookings from deals over $250K grew 75% over Q3FY16, and y-o-y growth in bookings from deals over $100K was very strong at 35%. As a result, average deal size was at an all-time high during Q3FY17. |
| • | Rapid growth from Cloud Service Providers (CSPs), as bookings from CSPs grew 65% over Q3FY16, accounting for 24% of total bookings. |
| • | Rapid growth from Large Enterprise customers (Global 5000 customers) as bookings grew 53% over Q3FY16. |
| • | Large and thriving customer community of over 9,450 customers. We added approximately 600 new customers during Q3FY17 and our installed base now stands at over 9,450 customers. |
| • | Named a leader in Gartner’s Magic Quadrant for General Purpose Storage Arrays for the second consecutive year, and positioned furthest of all companies on the visionary axis. |
| • | Continuing to innovate at a rapid pace. During Q3FY17, we announced several new software capabilities as part of an upcoming software release including secure multi-tenancy, application granular QoS, and native, persistent storage with integrated data management for Docker Containers. |
| • | Strategic partnership with Lenovo that was announced during Q3FY17 is aimed at leveraging Lenovo’s global reach to deliver our All Flash arrays and InfoSight predictive analytics to Lenovo customers, with the initial focus being on a joint converged infrastructure solution. |
| • | Executing to our financial plans. Our revenue during Q3FY17 was $102 million relative to our guidance of $100 to $103 million. Our Q3FY17 GAAP operating loss was $39 million and our GAAP EPS was a loss of $0.45 per share. Our non-GAAP operating loss was $15.4 million, and our non-GAAP EPS was a loss of $0.18 per share, relative to our guidance for a non-GAAP operating loss of $14 million to $16 million, and non-GAAP EPS loss of $0.17 to $0.19 per share. |
Strong AFA Momentum, with approximately $100M annualized bookings run-rate in the 2nd full quarter after launch
During Q3FY17, we saw strong momentum for our All Flash arrays as our product value proposition resonated strongly with both customers and channel partners. Specifically, we saw strong win rates across numerous bakeoffs driven by three main drivers:
| • InfoSight, provides operational simplicity, visibility and supportability, which we believe is unmatched by our competitors thanks to advanced cloud-based predictive analytics.
• Unified Flash Fabric, which facilitates deploying AFAs for production workloads while leveraging cost-optimized Hybrid Flash arrays (HFAs) for capacity-intensive and secondary workloads (backup, disaster recovery and archives) leveraging a common software architecture.
• Next-generation AFA architecture, which delivers superior scalability by combining scale-up and scale-out, and a compelling price-performance driven by advanced data reduction and the ability to leverage cost-optimized, dense 3D-NAND SSDs.
These product advantages translated into strong AFA momentum during Q3FY17, as we added 217 AFA customers, 115 of whom were “new to Nimble” customers. AFAs accounted for 24% of total product bookings and 30% of total array bookings in Q3FY17, up from 17% and 23%, respectively, in Q2FY17. After shipping for just two full quarters, we now have a total of approximately 400 AFA customers.
Our AFA deployments span a wide spectrum of industries, workloads and deployment sizes. Our customers include several large global enterprises deploying us in mission critical environments, as well as mid-sized enterprises that leveraged our newly introduced AF1000 – an entry-level AFA that can be scaled non-disruptively to deliver 8PB of effective capacity and 1.2M+ IOPS. Demonstrating the power of our Unified Flash Fabric, over 50% of our AFA customers also leverage our HFAs.
Large deals, Large Enterprises and CSPs driving growth
Over the last two years, as we have systematically expanded our product portfolio and diversified our channel partner base, we are diversifying our customer base and achieving steadily larger deployments within our customer base. |
Capella University Speeds Access to Online Education
Capella is an accredited online university dedicated to providing an exceptional, professionally-aligned education through an online campus and course rooms. The university has more than 37,000 students with 53 degree programs and over 150 specializations. Because content must be available to students, faculty and admins at all times throughout the year, the uptime and performance of its infrastructure is critical.
Capella’s IT team upgraded from its legacy storage solution to the Nimble Predictive Flash platform in order to reduce costs and streamline operations. Capella also wanted to improve the performance of its enterprise applications, including Oracle and Splunk.
Capella found the transition to Nimble seamless and has achieved the following results:
• Consolidated two data centers into one, dramatically reducing costs
• Replaced 25 racks of legacy storage equipment with 1.5 racks from Nimble, reducing space, cooling and power requirements
• Delivered 3-4 times faster performance of Oracle and Splunk databases
• Simplified operation and maintenance of 2,500 virtual machines
• Improved visibility across the IT stack using InfoSight data to pinpoint/resolve issues
Overall, Nimble has helped Capella improve the performance, capacity and support of its infrastructure. The ultimate benefit for students, educators and staff is uninterrupted access in the pursuit of educational advancement. |
During Q3FY17, contribution to bookings from deals over $100K and deals over $250K were both at record levels. Bookings from deals over $100K grew 35% compared to Q3FY16, and bookings from deals over $250K grew 75% over Q3FY16. As a result, our average deal size was at record levels during Q3FY17. A key driver of this expansion in deal sizes is the fact that we are now frequently being deployed in Tier 1 workloads, displacing high-end legacy arrays and winning against high-end AFAs.
Bookings from Large Enterprises during Q3FY17 grew at 53% over Q3FY16 as we expand our base of Large Enterprise customers, and deploy larger deals within that base. Our Large Enterprise customer base at the end of Q3FY17 grew 28% over Q3FY16, and we continue to see a steady pattern of repeat deployments from that installed base.
Bookings from CSPs during Q3FY17 grew 65% compared to Q3FY16. As customers look to leverage the cloud, their adoption of SaaS providers and IaaS providers is translating into strong growth.
|
A thriving, global community of ~9,450 customers
We now have an installed base of ~9,450 customers – up 38% from a year ago, as we continue to systematically acquire new customers every quarter. Our customer base spans mid-sized enterprise, over 10% of the Global 5000 Enterprises and hundreds of CSPs. This large installed base combined with the high level of customer satisfaction drives strong repeat bookings. On a trailing 12-month basis, repeat bookings (excluding renewals) from our installed base grew to 49% compared to 44% in the prior 12-month period.
Our channel partners continue to be a key contributor to new customer acquisition, as channel initiated bookings accounted for 47% of total bookings during the quarter (while 97% of total bookings flow through the channel, channel initiated bookings measure deals that were identified and originated by channel partners). Our partner base is also becoming increasingly diverse as we engage more closely with large value-added resellers with strong enterprise relationships and with global system integrators.
Rapid Pace of Innovation
We have established a track record of innovating rapidly to expand our appeal to a broader customer base, with a product portfolio that is more differentiated than ever. During Q3FY17, we continued to expand our product portfolio significantly with several major enhancements: |
Cloudnine Realtime Enhances IaaS offerings with Nimble Predictive Flash Platform
Cloudnine Realtime delivers IaaS that unlocks the benefits of the cloud for nearly half a million registered users. Its corporate IT infrastructure supports 2,000+ customers delivering 24/7/365 access to business critical enterprise applications such as QuickBooks, Sage, Exchange and Office365.
Driven by a steady flow of new customers, Cloudnine upgraded from a direct-attached storage solution to the Nimble Predictive Flash platform to meet performance and capacity demands on its network. By adding Nimble and automating more of its infrastructure, Cloudnine is seeing many benefits:
• Increased infrastructure performance delivers a better end-user experience
• Ability to provide multiple service levels and product offerings
• Increased revenue opportunities with disaster recovery product offering
• InfoSight across-the-stack visibility allows the IT team to optimize the environment, resolve issues and estimate future growth metrics
• Ease of management allows IT Staff to focus on revenue-generating projects |
| • | We significantly expanded the breadth and differentiation of our Predictive Flash arrays by shipping a new entry level AFA, the AF1000, and a new generation of Adaptive Flash arrays. |
| • | Multi-tenancy and QoS. We announced QoS and Multi-tenancy as key features that further enhance our appeal to CSPs and enterprises with large, private clouds. The ability to partition systems to multiple tenants, coupled with the ability to use QoS to deliver consistent and predictable application performance further differentiate our Predictive Flash platform. |
| • | Docker volume plug-in. As customers look to complement VMs with containers as the underlying infrastructure for application deployment, our Docker volume plugin provides persistent storage and rich data management services for Docker Containers. |
| • | SiteAnalyzer. Cloud-based SiteAnalyzer expands on InfoSight cloud-based Predictive Analytics by providing visibility into non-Nimble end-user environments, enabling our channel partners and sales teams to better assess, size and recommend solutions without guesswork. |
Momentum in Converged Infrastructure with Cisco, and now Lenovo
As customers look to alternatives to legacy storage vendors, they are looking for next generation vendors with superior technology, but with proven solutions and validated reference architectures that lower risk. Our SmartStack integrated infrastructure, built in partnership with Cisco and ISVs such as VMware, Microsoft, Citrix, Oracle and others, presents a compelling alternative to FlexPod and vBlock, and continues to experience rapid adoption.
| During Q3FY17, we announced a strategic relationship with Lenovo, which further expands our converged infrastructure solution portfolio. Lenovo’s ThinkAgile converged infrastructure solution combines our Predictive Flash arrays with Lenovo’s server technology. We plan to integrate Lenovo’s XClarity management software with Nimble InfoSight to further simplify management and leverage cloud-based predictive analytics. We are excited about the expansion of our portfolio of converged infrastructure partnerships, and the global distribution reach that Lenovo brings to bear as Lenovo’s sales force and channels take the ThinkAgile solutions to market.
Industry recognition and second consecutive year as a Leader in the Gartner Magic Quadrant
A momentous milestone for us is the recognition we received for the second year as a leader in the 2016 Gartner Magic Quadrant for General-Purpose Disk Arrays. We are positioned in the Leader’s quadrant and furthest on the visionary axis quadrant.
We continue to garner strong industry recognition for our innovation and impact on the storage industry. We were presented the 2016 CRN Tech Innovator award for the AF1000 All Flash array for being the most innovative storage product in the channel. We were ranked No. 63 in Deloitte’s 2016 Technology Fast 500. Computerworld Malaysia awarded Nimble the 2016 Readers Choice Award, driven by the combination of price, performance, functionality, reliability and ease of use. |
US Fish and Wildlife Service Revamps Operations with SmartStack
The US Fish and Wildlife Service (FWS) has 8,300 employees and nearly 700 offices – all of which generate a lot of data. The IT group provides infrastructure, technology tools and support necessary for law enforcement, biologists and scientists.
FWS upgraded its aging storage network with Nimble in order to implement a disaster recovery strategy, remove data duplication issues and increase visibility across its infrastructure.
After implementing Nimble solutions that include the Nimble Predictive Flash platform and SmartStack, the organization is experiencing multiple benefits:
• Standardized backup and replication of data in 15 data centers
• InfoSight provides visibility into dispersed infrastructure and faster issue resolution
• Reduced IT infrastructure and training costs
• Simplified management of Adaptive Flash arrays for maximum efficiency and performance
• Plug-and-play capacity expansion |
Financial Performance
As a reminder, non-GAAP results presented in this letter exclude only the impact of stock-based compensation versus GAAP results. An explanation of non-GAAP measures and a reconciliation of non-GAAP to GAAP results are provided below.
Q3FY17 Financial Results Overview
During Q3FY17, we delivered overall financial results in line with our expectations. We achieved revenue of $102.0 million, above the mid-point of our guidance of $100.0 million to $103.0 million.
Our GAAP operating loss was $39.0 million for Q3FY17. Our non-GAAP operating loss was $15.4 million, in the range of our guidance for a non-GAAP operating loss of $14.0 million to $16.0 million.
Our GAAP EPS for Q3FY17 was a loss of $0.45 per share. Our non-GAAP EPS for Q3FY17 was a loss of $0.18 per share, at the midpoint of our guidance range for non-GAAP EPS loss of $0.17 to $0.19 per share.
Revenue
Total revenue for Q3FY17 was $102.0 million, an increase of 26% from Q3FY16 and 5% sequentially from Q2FY17. Revenue growth of 26% during the quarter increased from the 21% growth we achieved in Q1 and Q2 respectively. Excluding the impact of foreign currency fluctuations, revenue increased by 28% compared to a year ago quarter.
| Product revenue for Q3FY17 was $81.3 million, representing 80% of total revenue. Product revenue increased 24% from Q3FY16 and grew sequentially by 5% from Q2FY17.
Q3FY17 support and service revenue, which includes our maintenance and InfoSight cloud-based predictive analytics service, was $20.7 million, representing 20% of total revenue, an increase of 37% from Q3FY16 and an increase of 6% from Q2FY17. |
|
Our international revenue grew 34% from Q3FY16 and 40% excluding the impact of foreign currency fluctuations. Revenue from international contributed 23% of total revenue during Q3FY17, relatively flat from 22% in Q3FY16.
At the end of Q3FY17, our total deferred revenue was $133.7 million, an increase of $28.3 million or 27% from Q3FY16. Our deferred revenue consists primarily of payments received for support and service agreements including InfoSight, which have an average term of approximately three years.
Gross Margin
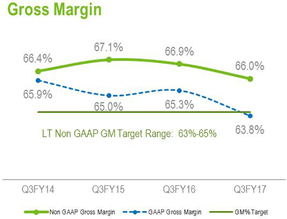
GAAP gross margin was 63.8% in Q3FY17 compared to 64.6% in Q2FY17 and 65.3% in Q3FY16.
Non-GAAP gross margin was 66.0% in Q3FY17, a decrease of 100 bps from Q2FY17 and a decrease of 90 bps from Q3FY16.
| Product Gross Margin
• GAAP product gross margin in Q3FY17 was 65.3%, 140 bps lower than Q2FY17. Non-GAAP product gross margin in Q3FY17 was 66.2%, 150 bps lower than Q2FY17. Sequentially, the decrease in product gross margins, on a GAAP and non-GAAP basis, were driven by product mix and pricing.
• GAAP product gross margin in Q3FY17 was 210 bps lower than Q3FY16 and non-GAAP product gross margin was 160 bps lower than Q3FY16 mainly due to product mix and pricing.
• In general, we expect our product gross margins to fluctuate in the range of 1 to 2 percentage points each quarter due to factors such as geographic mix of sales (e.g. APJ has lower product margins), new vs. existing customers, low end vs. high end solutions, exchange rate effects and so on. |
|
Support and Service Gross Margin
| • | GAAP support and service gross margin in Q3FY17 was 57.5%, higher by 140 bps compared to Q2FY17, and 150 bps higher than Q3FY16. |
| • | Non-GAAP support and service gross margin in Q3FY17 was 65.2%, higher by 100 bps compared to Q2FY17, and 240 bps higher than Q3FY16. |
| • | The year-over-year improvement in both GAAP and non-GAAP support and service gross margin was due to improved support operations leverage from a year ago. In particular, our InfoSight predictive analytics platform continues to enable support automation. As a result, in addition to very high levels of customer satisfaction, average support and service revenue per technical support engineer headcount increased by 20% from a year ago. |
Our overall non-GAAP gross margin of 66% remains above our long-term target model range of 63% to 65%, and we expect to continue to operate slightly above the high end of this range in the near term.
Operating Expenses
GAAP operating expenses in Q3FY17 were $104.1 million, an increase of $2.0 million or 2% from Q2FY17.
Q3FY17 total non-GAAP operating expenses were $82.8 million, an increase of $2.3 million or 3% from Q2FY17. Non-GAAP operating expenses increased by 28% compared to Q3FY16 mainly due to sales and marketing spend increasing by 36% compared to Q3FY16.
| • | GAAP sales and marketing spend totaled $64.9 million in Q3FY17 and increased by $3.3 million from Q2FY17. Non-GAAP sales and marketing spend totaled $55.3 million in Q3FY17 and increased by $3.4 million from Q2FY17 and by $14.6 million from Q3FY16. Sales and marketing expenses increased during the quarter primarily due to increased spending on marketing programs and compensation related expenses. Our sales and marketing investments remain in line with our plan that we outlined at the beginning of the fiscal year. |
| • | GAAP R&D expenses were $28.7 million and decreased by $0.9 million during Q3FY17 from Q2FY17 and non-GAAP R&D expenses were $21.4 million, a decrease of $0.4 million during Q3FY17 from Q2FY17. R&D expenses decreased during the quarter primarily due to compensation related expenses. |
| • | GAAP G&A expenses were $10.4 million and decreased by $0.4 million during Q3FY17 from Q2FY17 and non-GAAP G&A expenses were $6.0 million, a decrease of $0.7 million during Q3FY17 from Q2FY17. G&A expenses decreased during the quarter due to lower compensation, legal, and tax related expenses. |
| • | During the last 12 months, we added over 200 employees to the Company and ended Q3FY17 with over 1,250 employees on board. |
| Operating Income and EPS
GAAP operating loss was $39.0 million for Q3FY17, compared to a loss of $28.3 million in Q3FY16. Non-GAAP operating loss in Q3FY17 was $15.4 million, in line with our guidance for a non-GAAP operating loss of $14.0 million to $16.0 million.
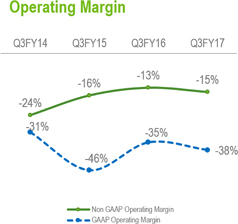
GAAP operating margin in Q3FY17 was negative 38% compared to negative 40% in Q2FY17 and negative 35% in Q3FY16.
Non-GAAP operating margin in Q3FY17 was negative 15% compared to negative 16% in Q2FY17 and negative 13% in Q3FY16.
GAAP EPS for Q3Y17 was a loss of $0.45 per share, compared to a loss of $0.47 per share in Q2FY17 and a loss of $0.36 per share in Q3FY16.
Non-GAAP EPS in Q3FY17 was a loss of $0.18 per share on approximately 86.3 million weighted average basic and diluted shares outstanding compared to a loss of $0.19 per share in Q2FY17, and a loss of $0.14 per share in Q3FY16. This was in line with our guidance range for a loss of $0.17 to $0.19 per share. |
|
Balance Sheet
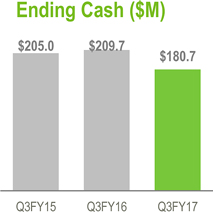
We ended Q3FY17 with cash and cash equivalents of $180.7 million, a decrease of $13.5 million during the quarter. Cash Flow from Operations during Q3FY17 was negative $11.3 million compared to negative $4.1 million in Q2FY17 and negative $3.1 million in Q3FY16. Free Cash Flow during Q3FY17 was negative $18.0 million compared to negative $9.1 million in Q2FY17 and negative $12.2 million in Q3FY16.
| In Q3FY17, we achieved a cash conversion cycle of 14 days, slightly above 11 days in Q2FY17 and 12 days in Q3FY16, but better than our target of 20 days.
We ended Q3FY17 with accounts receivables of $59.3 million, an increase of $10.1 million from Q2FY17. Days sales outstanding were 46 days (calculated on billings), an increase of 4 days from Q2FY17 and flat to Q3FY16 due to linearity of billings during the quarter.
We ended Q3FY17 with inventory of $20.4 million, an increase of $2.3 million from Q2FY17 mainly due to service inventory increasing by $1.8 million to support our new platforms and growing base of customers. Days sales in inventory were 51 days, an increase of 3 days from Q2FY17.
We expect to end FY17 with a cash balance fairly similar to our balance at the end of Q3FY17. |
|
Q4FY17 Financial Outlook
Our guidance for Q4FY17 is as follows:
| • | Total revenue of $112.0 million to $115.0 million. This range represents a growth rate of 24% to 28% compared to Q4FY16. |
| • | Non-GAAP operating loss of $11.0 million to $13.0 million. At the mid-point, this represents an operating margin of negative 15.7% for the entire FY17, in line with the range of negative 11% to negative 17% we expected at the beginning of FY17. |
| • | Non-GAAP net loss of $0.13 to $0.15 per share, based on weighted average basic shares outstanding of approximately 88.0 million. |
We thank our partners and customers once again for embracing us, our investors for their confidence in us, and our employees for their dedication and continued execution.

|

| |||
| Suresh Vasudevan, CEO |
Anup Singh, CFO |
Conference Call Information
As previously announced, Nimble Storage will host a live question and answer conference call and webcast today at 5:00 p.m. ET (2:00 p.m. PT) to discuss its financial results for the third quarter of fiscal year 2017.
Interested parties may access the call by dialing 877-719-9801 in the U.S. or 719-325-4762 from international locations. In addition, a live audio webcast of the conference call will be available on the Nimble Storage Investor Relations website at http://investors.nimblestorage.com. The live webcast will be archived and available on this site for 45 days. A replay of the conference call will be available for 45 days. Access the replay here.
Non-GAAP Financial Measures
To provide investors with additional information regarding our financial results, Nimble Storage has disclosed in this release and the accompanying tables non-GAAP financial measures that are not calculated in accordance with generally accepted accounting principles in the United States, or GAAP. The company provides non-GAAP gross margin, non-GAAP operating loss, non-GAAP net loss, and non-GAAP net loss per share. In computing these non-GAAP financial measures, the company excludes the effects of stock-based compensation, which is a recurring non-cash expense for the company. The company has provided reconciliation below of non-GAAP financial measures to the most directly comparable GAAP financial measures. A reconciliation of the Q4FY17 forward outlook for non-GAAP operating loss and non-GAAP net loss per basic and diluted share is not available without unreasonable efforts as the quantification of stock-based compensation expense requires additional inputs such as number of shares granted and market price, that are not ascertainable.
The company discloses these non-GAAP financial measures because they are key measures used by the company’s management and board of directors to understand and evaluate operating performance and trends, to prepare and approve the annual budget and to develop short-term and long-term operational and compensation plans. In particular, the exclusion of certain expenses in calculating non-GAAP financial measures can provide a useful measure for period-to-period comparisons of the company’s business. Accordingly, the company believes that these non-GAAP financial measures provide useful information to investors and others in understanding and evaluating the company’s operating results in the same manner as the company’s management and board of directors.
Non-GAAP financial measures have limitations as analytical tools and, as such, should not be considered in isolation or as substitutes for analysis of the company’s results as reported under GAAP. Some of these limitations are:
| • | Non-GAAP financial measures do not consider the potentially dilutive impact of equity-based compensation, which is an ongoing expense for the company; and |
| • | Other companies, including companies in our industry, may calculate non-GAAP financial measures differently, which reduces their usefulness as comparative measures. |
Nimble Storage, Inc.
Reconciliation of GAAP to Non-GAAP Financial Measures
(In thousands, except percentages and per share amounts)
(Unaudited)
| Three Months Ended | ||||||||||||||||||||
| October 31, 2016 | July 31, 2016 | October 31, 2015 | October 31, 2014 | October 31, 2013 | ||||||||||||||||
| Revenue |
$ | 102,041 | $ | 97,111 | $ | 80,727 | $ | 59,096 | $ | 33,411 | ||||||||||
| GAAP gross margin |
$ | 65,056 | $ | 62,743 | $ | 52,690 | $ | 38,432 | $ | 22,022 | ||||||||||
| Stock-based compensation |
2,302 | 2,296 | 1,291 | 1,235 | 179 | |||||||||||||||
|
|
|
|
|
|
|
|
|
|
|
|||||||||||
| Non-GAAP gross margin |
$ | 67,358 | $ | 65,039 | $ | 53,981 | $ | 39,667 | $ | 22,201 | ||||||||||
|
|
|
|
|
|
|
|
|
|
|
|||||||||||
| GAAP gross margin % |
63.8 | % | 64.6 | % | 65.3 | % | 65.0 | % | 65.9 | % | ||||||||||
| Stock-based compensation % |
2.2 | % | 2.4 | % | 1.6 | % | 2.1 | % | 0.5 | % | ||||||||||
|
|
|
|
|
|
|
|
|
|
|
|||||||||||
| Non-GAAP gross margin % |
66.0 | % | 67.0 | % | 66.9 | % | 67.1 | % | 66.4 | % | ||||||||||
|
|
|
|
|
|
|
|
|
|
|
|||||||||||
| Product revenue |
$ | 81,300 | $ | 77,615 | $ | 65,574 | ||||||||||||||
| GAAP product gross margin |
$ | 53,125 | $ | 51,800 | $ | 44,202 | ||||||||||||||
| Stock-based compensation |
704 | 728 | 265 | |||||||||||||||||
|
|
|
|
|
|
|
|||||||||||||||
| Non-GAAP product gross margin |
$ | 53,829 | $ | 52,528 | $ | 44,467 | ||||||||||||||
|
|
|
|
|
|
|
|||||||||||||||
| GAAP product gross margin % |
65.3 | % | 66.7 | % | 67.4 | % | ||||||||||||||
| Stock-based compensation % |
0.9 | % | 1.0 | % | 0.4 | % | ||||||||||||||
|
|
|
|
|
|
|
|||||||||||||||
| Non-GAAP product gross margin % |
66.2 | % | 67.7 | % | 67.8 | % | ||||||||||||||
|
|
|
|
|
|
|
|||||||||||||||
| Support and service revenue |
$ | 20,741 | $ | 19,496 | $ | 15,153 | ||||||||||||||
| GAAP support and service gross margin |
$ | 11,931 | $ | 10,943 | $ | 8,488 | ||||||||||||||
| Stock-based compensation |
1,598 | 1,568 | 1,026 | |||||||||||||||||
|
|
|
|
|
|
|
|||||||||||||||
| Non-GAAP support and service gross margin |
$ | 13,529 | $ | 12,511 | $ | 9,514 | ||||||||||||||
|
|
|
|
|
|
|
|||||||||||||||
| GAAP support and service gross margin % |
57.5 | % | 56.1 | % | 56.0 | % | ||||||||||||||
| Stock-based compensation % |
7.7 | % | 8.1 | % | 6.8 | % | ||||||||||||||
|
|
|
|
|
|
|
|||||||||||||||
| Non-GAAP support and service gross margin % |
65.2 | % | 64.2 | % | 62.8 | % | ||||||||||||||
|
|
|
|
|
|
|
|||||||||||||||
| GAAP operating expenses |
$ | 104,055 | $ | 102,063 | $ | 81,038 | ||||||||||||||
| Stock-based compensation |
21,297 | 21,567 | 16,239 | |||||||||||||||||
|
|
|
|
|
|
|
|||||||||||||||
| Non-GAAP operating expenses |
$ | 82,758 | $ | 80,496 | $ | 64,799 | ||||||||||||||
|
|
|
|
|
|
|
|||||||||||||||
| GAAP sales and marketing |
$ | 64,944 | $ | 61,678 | $ | 49,853 | ||||||||||||||
| Stock-based compensation |
9,624 | 9,727 | 9,132 | |||||||||||||||||
|
|
|
|
|
|
|
|||||||||||||||
| Non-GAAP sales and marketing |
$ | 55,320 | $ | 51,951 | $ | 40,721 | ||||||||||||||
|
|
|
|
|
|
|
|||||||||||||||
| GAAP research and development |
$ | 28,738 | $ | 29,593 | ||||||||||||||||
| Stock-based compensation |
7,301 | 7,773 | ||||||||||||||||||
|
|
|
|
|
|||||||||||||||||
| Non-GAAP research and development |
$ | 21,437 | $ | 21,820 | ||||||||||||||||
|
|
|
|
|
|||||||||||||||||
| GAAP general and administrative |
$ | 10,373 | $ | 10,792 | ||||||||||||||||
| Stock-based compensation |
4,372 | 4,067 | ||||||||||||||||||
|
|
|
|
|
|||||||||||||||||
| Non-GAAP general and administrative |
$ | 6,001 | $ | 6,725 | ||||||||||||||||
|
|
|
|
|
|||||||||||||||||
| GAAP operating margin |
$ | (38,999 | ) | $ | (39,320 | ) | $ | (28,348 | ) | $ | (27,128 | ) | $ | (10,371 | ) | |||||
| Stock-based compensation |
23,599 | 23,863 | 17,530 | 17,406 | 2,265 | |||||||||||||||
|
|
|
|
|
|
|
|
|
|
|
|||||||||||
| Non-GAAP operating margin |
$ | (15,400 | ) | $ | (15,457 | ) | $ | (10,818 | ) | $ | (9,722 | ) | $ | (8,106 | ) | |||||
|
|
|
|
|
|
|
|
|
|
|
|||||||||||
| GAAP operating margin % |
-38 | % | -40 | % | -35 | % | -46 | % | -31 | % | ||||||||||
| Stock-based compensation % |
23 | % | 24 | % | 22 | % | 30 | % | 7 | % | ||||||||||
|
|
|
|
|
|
|
|
|
|
|
|||||||||||
| Non-GAAP operating margin % |
-15 | % | -16 | % | -13 | % | -16 | % | -24 | % | ||||||||||
|
|
|
|
|
|
|
|
|
|
|
|||||||||||
| GAAP net loss |
$ | (39,272 | ) | $ | (39,950 | ) | $ | (28,574 | ) | |||||||||||
| Stock-based compensation |
23,599 | 23,863 | 17,530 | |||||||||||||||||
|
|
|
|
|
|
|
|||||||||||||||
| Non-GAAP net loss |
$ | (15,673 | ) | $ | (16,087 | ) | $ | (11,044 | ) | |||||||||||
|
|
|
|
|
|
|
|||||||||||||||
| GAAP net loss per share, basic and diluted |
$ | (0.45 | ) | $ | (0.47 | ) | $ | (0.36 | ) | |||||||||||
| Stock-based compensation |
0.27 | 0.28 | 0.22 | |||||||||||||||||
|
|
|
|
|
|
|
|||||||||||||||
| Non-GAAP net loss per share |
$ | (0.18 | ) | $ | (0.19 | ) | $ | (0.14 | ) | |||||||||||
|
|
|
|
|
|
|
|||||||||||||||
| Shares used to compute GAAP and Non-GAAP net loss per share |
86,342 | 84,482 | 79,736 | |||||||||||||||||
| GAAP net cash provided by (used in) operating activities |
$ | (11,310 | ) | $ | (4,069 | ) | $ | (3,104 | ) | |||||||||||
| Purchase of property and equipment |
(6,689 | ) | (5,002 | ) | (9,073 | ) | ||||||||||||||
|
|
|
|
|
|
|
|||||||||||||||
| Non-GAAP free cash flow |
$ | (17,999 | ) | $ | (9,071 | ) | $ | (12,177 | ) | |||||||||||
|
|
|
|
|
|
|
|||||||||||||||
Forward-Looking Statements
This press release contains “forward-looking” statements that are based on our management’s beliefs and assumptions and on information currently available to management. We intend for such forward-looking statements to be covered by the safe harbor provisions for forward-looking statements contained in the U.S. Private Securities Litigation Reform Act of 1995. Forward-looking statements include all statements other than statements of historical fact contained in this press release, including our current beliefs and expectations concerning our future financial results, market share and sales levels, business plans, strategy and objectives, competitive position, product performance and industry trends and environment.
Forward-looking statements are subject to known and unknown risks, uncertainties, assumptions and other factors including, but not limited to, those related to our future financial performance, which is inherently uncertain, unforeseen delays in product development or introduction, unknown errors or defects in our products, uncertainty around market acceptance of our solutions, including recently introduced products, our ability to increase sales of our solutions, our ability to increase average deal sizes and the contribution of large deals to our overall sales, our ability to attract and retain customers and to sell additional solutions to our existing customers and continue to add new customers, our ability to develop new solutions and bring them to market in a timely manner, our ability to work effectively with ecosystem partners to drive increased sales, pricing pressure (as a result of competition or otherwise), introduction of new technologies and products by other companies, changes in technologies, which could render our solutions less competitive, changes in the storage industry, our ability to maintain, protect and enhance our brand and intellectual property, the effectiveness of our channel partners and sales team, our ability to convert leads into sales, our ability to recruit new or keep our existing key talent, global economic conditions and market uncertainty in light of current political developments in the U.S. and elsewhere, fluctuations in foreign currency rates and our ability to continue to expand our business and manage our growth. Moreover, we operate in very competitive and rapidly changing environments, and new risks may emerge from time to time. It is not possible for our management to predict all risks, nor can we assess the impact of all factors on our business or the extent to which any factor, or combination of factors, may cause actual results to differ materially from those contained in any forward-looking statements we may make. Further information on these and other factors that could affect our financial results are included in our Annual Report on Form 10-K and Quarterly Reports on Form 10-Q filed with the Securities and Exchange Commission and may cause our actual results, performance or achievements to differ materially and adversely from those anticipated or implied by our forward-looking statements.
You should not rely upon forward-looking statements as predictions of future events. Although our management believes that the expectations reflected in our forward-looking statements are reasonable, we cannot guarantee that the future results, levels of activity, performance or events and circumstances described in the forward-looking statements will be achieved or occur. Moreover, neither the company, nor any other person, assumes responsibility for the accuracy and completeness of the forward-looking statements. We undertake no obligation to publicly update any forward-looking statements for any reason after the date of this presentation to conform these statements to actual results or to changes in our expectations, except as required by law.
Any unreleased services, features or functions whether referenced in this document, Nimble Storage’s website or other press releases or public statements that are not currently available are subject to change at Nimble Storage’s discretion and may not be delivered as planned or at all. Customers who purchase Nimble Storage’s products and services should make their purchase decisions based upon services, features and functions that are currently available.
“Customer” or “Customers” referenced above are Nimble Storage’s end-customers. It is Nimble Storage’s practice to identify an end-customer from our channel partners prior to shipment and before any support and services are provided. Products are typically shipped directly to the end-customers of our channel partners. Assuming all other revenue recognition criteria have been met, Nimble Storage generally recognizes product revenue on sales upon shipment, as title and risk of loss are transferred at that time. Nimble Storage recognizes revenue from support and service contracts over the contractual service period.
Nimble Storage, the Nimble Storage logo, CASL, InfoSight, SmartStack, Timeless Storage, Data Velocity Delivered, Unified Flash Fabric and NimbleConnect are trademarks or registered trademarks of Nimble Storage, Inc. Other trade names or words used in this document are the properties of their respective owners.
Press Contact:
Kristalle Cooks
408-514-3313
Kristalle@nimblestorage.com
Investor Relations Contact:
Elaine Gaudioso
408-514-3475
IR@nimblestorage.com