Attached files
| file | filename |
|---|---|
| 8-K - 8-K - Medtronic plc | fy17q2earningsrelease.htm |
| EX-99.1 - EXHIBIT 99.1 - Medtronic plc | exhibit991-fy17q2earningsr.htm |

MEDTRONIC PLC
Q2 FY17
EARNINGS PRESENTATION
NOVEMBER 22, 2016
• CONSOLIDATED RESULTS & GROUP
REVENUE HIGHLIGHTS
• EPS GUIDANCE, REVENUE OUTLOOK, &
OTHER ASSUMPTIONS

Q2 FY17 Earnings Results | November 22, 2016 | 2
FORWARD LOOKING STATEMENTS
This presentation contains forward-looking statements which provide current expectations or forecasts, including those
relating to market and sales growth, growth strategies, financial results, use of capital, product development and introduction,
partnerships, regulatory matters, restructuring initiatives, mergers/acquisitions/divestitures and related effects, accounting
estimates, working capital adequacy, competitive strengths and sales efforts. They are based on current assumptions and
expectations that involve uncertainties or risks. These uncertainties and risks include, but are not limited to, those described in
the filings we make with the U.S. Securities and Exchange Commission (SEC). Actual results may differ materially from
anticipated results. Forward-looking statements are made as of today's date, and we undertake no duty to update them or any
of the information contained in this presentation.
Financial Data
Certain information in this presentation includes calculations or figures that have been prepared internally and have not been
reviewed or audited by our independent registered public accounting firm. Use of different methods for preparing, calculating
or presenting information may lead to differences and such differences may be material. This presentation contains financial
measures and guidance, including free cash flow figures (defined as operating cash flows less property, plant and equipment
additions), revenue, margin and growth rates on a constant currency basis, and adjusted EPS, all of which are considered “non-
GAAP” financial measures under applicable SEC rules and regulations. We believe these non-GAAP measures provide a useful
way to evaluate our underlying performance. Medtronic calculates forward-looking non-GAAP financial measures based on
internal forecasts that omit certain amounts that would be included in GAAP financial measures. For instance, forward-looking
revenue growth and EPS projections exclude the impact of foreign currency exchange fluctuations. Forward-looking non-GAAP
EPS guidance also excludes other potential charges or gains that would be recorded as non-GAAP adjustments to earnings
during the fiscal year, such as amortization of intangible assets and acquisition-related, certain tax and litigation, and
restructuring charges or gains. Medtronic does not attempt to provide reconciliations of forward-looking non-GAAP EPS
guidance to projected GAAP EPS guidance because the combined impact and timing of recognition of these potential charges
or gains is inherently uncertain and difficult to predict, and is unavailable without unreasonable efforts. In addition, we believe
such reconciliations would imply a degree of precision and certainty that could be confusing to investors. Such items could have
a substantial impact on GAAP measures of financial performance. Detail concerning how all non-GAAP measures are
calculated, including all GAAP to non-GAAP reconciliations, are provided on our website and can be accessed using this link.

CONSOLIDATED
RESULTS & GROUP
REVENUE HIGHLIGHTS

Q2 FY17 Earnings Results | November 22, 2016 | 4
Number of issues contributed to lower than expected revenue; largest
impact from CVG and Diabetes
• 3% revenue growth3 was below our Q2 expectations. Items are identifiable, and in
many cases, temporary.
• CVG: CRHF core implantables market decline; TAVR- lack of XL valve; DES-US / Japan
declines
• Diabetes: Pump approval dynamics affected US growth
• Several new product introductions in back half of the fiscal year to drive revenue
growth back to normal range.
• Growth Vector Performance:
• New Therapies: below our 200 to 350 bps goal, contributing ~195 bps
• Emerging Markets: below our 150 to 200 bps goal, contributing ~120 bps
• Services & Solutions: below our 40 to 60 bps goal, contributing ~20 bps
• Acquisitions & divestitures contributed a net 120 bps to Q2 revenue growth
Strong improvement in operating margins and double-digit EPS3 growth
• EPS: 15% EPS1,3 growth; EPS lev. ~1,120 bps1
• Operating Margin: ~150 bps improvement Y/Y1; Operating lev. ~570 bps1
• One time tax-benefit offset higher than expected earnings impact from FX
• Covidien synergies: remain on track to deliver $225-250M in FY17
Outlook: Continue to expect MSD revenue and double-digit EPS3 growth
for the full fiscal year and on a sustained basis
• H2 revenue3 growth of 4.5 – 5.0%
• H2 EPS3 growth of 9 – 11%
Capital allocation: Strategically deploying capital against priorities
• Q2: 101% Payout Ratio3; $593M in dividends and $985M in net share repurchases
• FY17 Free Cash Flow4 outlook of $5B - $6B
MDT
Q2 FY17 HIGHLIGHTS
1 Figures represent comparison to Q2 FY16 on a constant currency basis.
2 Diluted EPS
3 Non-GAAP
4 Operating cash flows less property, plant and equipment additions
REVENUE BELOW EXPECTATIONS;
STRONG OPERATING AND EARNINGS GROWTH
Revenue:
Other Financial Highlights:
U.S.
57%
Non-
U.S.
Dev
30%
EM
13%
1
EPS2 Y/Y
CC1
Y/Y%
GAAP $0.80 122% NC
Non-GAAP $1.12 9% 15%
Cash Flow
from Ops $1.5B
Free Cash
Flow4 $1.2B
CVG
35%
MITG
34%
RTG
25%
DIAB
6%
Revenue
$M
As Rep
Y/Y %
CC1
Y/Y %
CVG 2,584 4 3
MITG 2,473 5 4
RTG 1,826 4 3
Diabetes 462 3 3
Total $7,345 4% 3%
U.S. 4,152 1 1
Non-U.S. Dev 2,209 8 5
EM 984 8 10
Total $7,345 4% 3%

Q2 FY17 Earnings Results | November 22, 2016 | 5
MDT
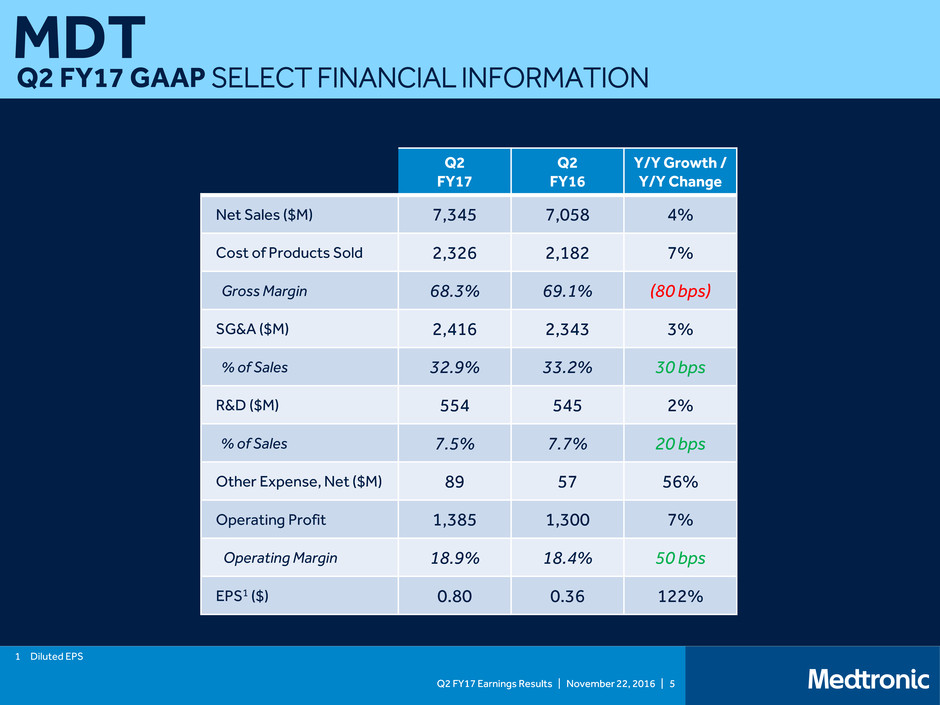
Q2 FY17 GAAP SELECT FINANCIAL INFORMATION
Q2
FY17
Q2
FY16
Y/Y Growth /
Y/Y Change
Net Sales ($M) 7,345 7,058 4%
Cost of Products Sold 2,326 2,182 7%
Gross Margin 68.3% 69.1% (80 bps)
SG&A ($M) 2,416 2,343 3%
% of Sales 32.9% 33.2% 30 bps
R&D ($M) 554 545 2%
% of Sales 7.5% 7.7% 20 bps
Other Expense, Net ($M) 89 57 56%
Operating Profit 1,385 1,300 7%
Operating Margin 18.9% 18.4% 50 bps
EPS1 ($) 0.80 0.36 122%
1 Diluted EPS

Q2 FY17 Earnings Results | November 22, 2016 | 6
MDT
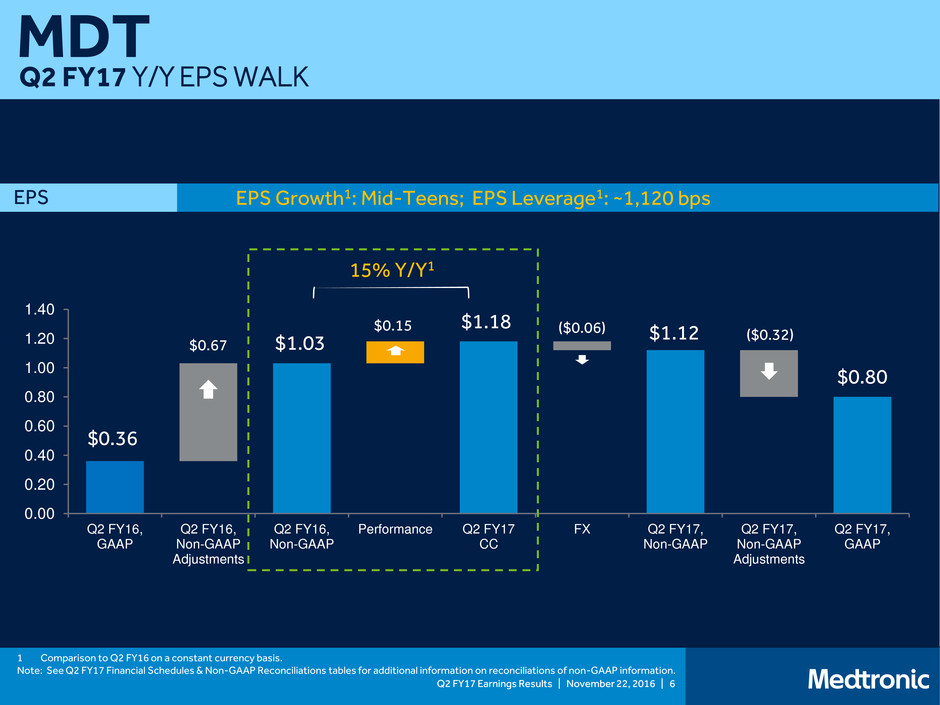
Q2 FY17 Y/Y EPS WALK
0.00
0.20
0.40
0.60
0.80
1.00
1.20
1.40
Q2 FY16,
GAAP
Q2 FY16,
Non-GAAP
Adjustments
Q2 FY16,
Non-GAAP
Performance Q2 FY17
CC
FX Q2 FY17,
Non-GAAP
Q2 FY17,
Non-GAAP
Adjustments
Q2 FY17,
GAAP
EPS Growth1: Mid-Teens; EPS Leverage1: ~1,120 bps EPS
$0.36
$0.67 $1.03
1 Comparison to Q2 FY16 on a constant currency basis.
Note: See Q2 FY17 Financial Schedules & Non-GAAP Reconciliations tables for additional information on reconciliations of non-GAAP information.
$1.18 ($0.06) $1.12 ($0.32)
$0.80
15% Y/Y1
$0.15

Q2 FY17 Earnings Results | November 22, 2016 | 7
MDT
Q2 FY17 Y/Y OPERATING MARGIN CHANGES
0.0%
5.0%
10.0%
15.0%
20.0%
25.0%
30.0%
35.0%
Q2 FY16,
GAAP
Q2 FY16,
Non-GAAP
Adjustments
Q2 FY16,
Non-GAAP
Performance Q2 FY17
CC
FX Q2 FY17,
Non-GAAP
Q2 FY17,
Non-GAAP
Adjustments
Q2 FY17,
GAAP
~150 bps Operational Improvement1 Operating Margin
18.4%
9.0% 27.4%
1.5% 28.9% (1.7%) 27.2% (8.3%)
18.9%
1 Comparison to Q2 FY16 on a constant currency basis.
Note: See Q2 FY17 Financial Schedules & Non-GAAP Reconciliations tables for additional information on reconciliations of non-GAAP information.

Q2 FY17 Earnings Results | November 22, 2016 | 8
MDT
Q2 FY17 NON-GAAP SELECT FINANCIAL INFORMATION
Q2
FY17
Q2
FY16
FX
Impact
$M / Change
Q2 FY17
Constant
Currency1
Q2 FY17
CC Growth /
Change
Net Sales ($M) 7,345 7,058 50 -- 3%
Cost of Products Sold 2,288 2,182 (58) -- 2%
Gross Margin1 68.8% 69.1% (60) bps 69.4% 30 bps
SG&A ($M) 2,416 2,343 (10) -- (3%)
% of Sales 32.9% 33.2% 10 bps 33.0% 20 bps
R&D ($M) 554 545 0 -- (2%)
% of Sales 7.5% 7.7% 10 bps 7.6% 10 bps
Other Expense, Net ($M) 89 57 (90) -- 102%
Operating Profit1 1,998 1,931 (108) -- 9%
Operating Margin 1 27.2% 27.4% (170) bps 28.9% 150 bps
Diluted EPS1 ($) 1.12 1.03 (0.06) -- 15%
1 Non-GAAP measure – see Q2 FY17 Financial Schedules & Non-GAAP Reconciliations
tables for additional information on reconciliations of non-GAAP information
2 Figures represent comparison to Q2 FY16 on a constant currency basis.
Operating
Leverage2
+570bps
EPS
Leverage2
+1,120bps

Q2 FY17 Earnings Results | November 22, 2016 | 9
CVG
Q2 FY17 HIGHLIGHTS
CRHF
54%
CSH
29%
APV
17%
U.S.
52%
Non-
U.S.
Dev
32%
EM
16%
Cardiac Rhythm & Heart Failure (CRHF)
KEY PERFORMANCE DRIVERS1
Heart Failure: +HSD
• Driven by recent HeartWare
acquisition; integration on track
• US market decline in MSD
• CRT-D: LSD decline
• US: Share gains on Amplia quad
launch
• Japan: Strong launch of Compia
MRI continues to drive share gains
• CRT-P: share loss from lack of quad
Arrhythmia Mgmt: +LSD
• WW Tachy: LSD decline due to market
replacements, TYRX™ product hold
• WW Brady: LSD decline
• US: Modest share decline
• Reveal LINQ™ pull-through
• Diagnostics: Mid-teens – Reveal LINQ™
• AF Solutions: High-twenties – Arctic
Front Advance continues to gain share
Coronary & Structural Heart (CSH)
Aortic & Peripheral Vascular (APV)
Services & Solutions: +Mid 20’s
Heart Valve Therapies: +HSD
• WW TAVR market growing ~30%
• TAVR : High teens WW; LSD US
• Europe: continue to gain share
• US: lack of a large size Evolut™ R XL
limiting share; expect gains given recent
FDA approval
• Japan: continued strength in CoreValve®
launch; recent Shonin approval; expect
reimbursement & launch in H2 FY17
Coronary: -MSD
• DES: HSD decline
• OUS: LSD growth-Resolute
Onyx™
• US: DD decline - competitive
product launches
Aortic: +LSD
• US: Flat growth; Heli-FX ® EndoAnchor®:
driving strong growth and AAA pull-
through, offset by competitive
headwinds in AAA
• OUS: MSD growth
Peripheral & endoVenous:
+MSD
• DCB: US & WW market share leader
• IN.PACT ® Admiral DCB mid-20s
• Received ISR indication (only DCB
with ISR in US)
• HawkOne 6F™ atherectomy launch
MSD Growth in CRHF and APV
Offset Partially by CSH
Extracorp. Therapies: -LSD
• Cannulae and Revasc growth offset
by Surgical Ablation decline
Evera MRI™
SureScan®
ICD
CoreValve®
Evolut® R
Resolute
Onyx ®
IN.PACT
Admiral ®
WW implantables market down LSD; MDT growing in line with global market
Heli-FX ®
EndoAnchor
Revenue
$M
As Rep
Y/Y %
CC1
Y/Y %
CRHF 1,400 6 5
CSH 753 Flat Flat
APV 431 5 4
Total $2,584 4% 3%
U.S. 1,353 1 1
Non-U.S. Dev 823 7 5
EM 408 9 10
Total $2,584 4% 3%
H2 Growth Outlook: MSD
(Q3 greater than Q4)
Arctic Front
Advance®
1 Figures represent comparison to Q2 FY16 on a constant currency basis.

Q2 FY17 Earnings Results | November 22, 2016 | 10
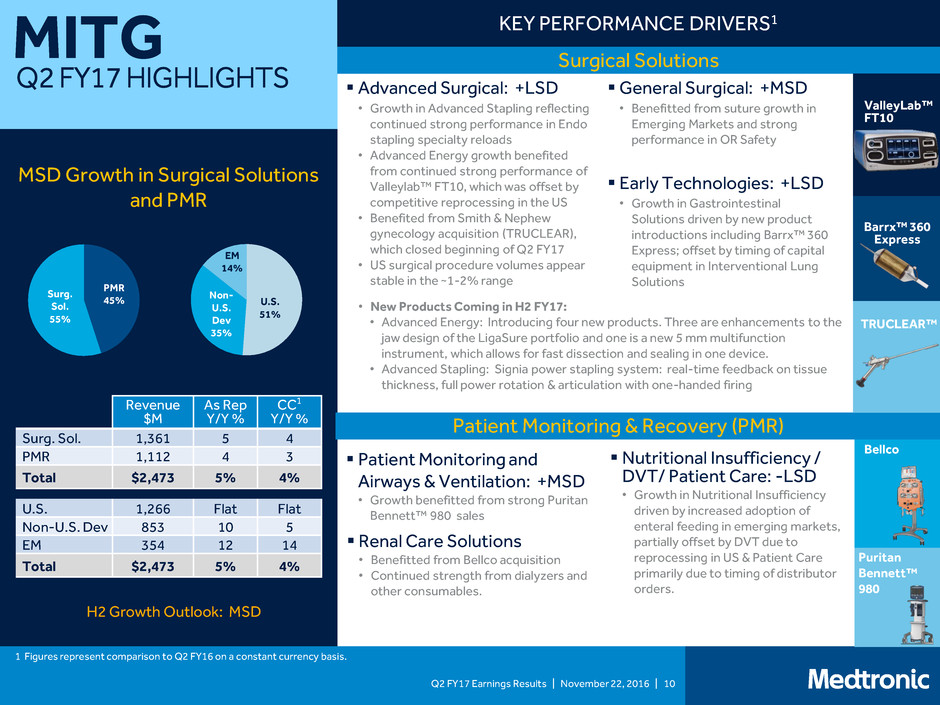
MITG
Q2 FY17 HIGHLIGHTS
Surgical Solutions
KEY PERFORMANCE DRIVERS1
MSD Growth in Surgical Solutions
and PMR
Patient Monitoring & Recovery (PMR)
Early Technologies: +LSD
• Growth in Gastrointestinal
Solutions driven by new product
introductions including Barrx™ 360
Express; offset by timing of capital
equipment in Interventional Lung
Solutions
General Surgical: +MSD
• Benefitted from suture growth in
Emerging Markets and strong
performance in OR Safety
Nutritional Insufficiency /
DVT/ Patient Care: -LSD
• Growth in Nutritional Insufficiency
driven by increased adoption of
enteral feeding in emerging markets,
partially offset by DVT due to
reprocessing in US & Patient Care
primarily due to timing of distributor
orders.
Endo GIA™
Bellco
Renal Care Solutions
• Benefitted from Bellco acquisition
• Continued strength from dialyzers and
other consumables.
Revenue
$M
As Rep
Y/Y %
CC1
Y/Y %
Surg. Sol. 1,361 5 4
PMR 1,112 4 3
Total $2,473 5% 4%
U.S. 1,266 Flat Flat
Non-U.S. Dev 853 10 5
EM 354 12 14
Total $2,473 5% 4%
H2 Growth Outlook: MSD
ValleyLab™
FT10
PMR
45%
Surg.
Sol.
55%
U.S.
51%
Non-
U.S.
Dev
35%
EM
14%
Puritan
Bennett™
980
1 Figures represent comparison to Q2 FY16 on a constant currency basis.
Barrx™ 360
Express
TRUCLEAR™
Advanced Surgical: +LSD
• Growth in Advanced Stapling reflecting
continued strong performance in Endo
stapling specialty reloads
• Advanced Energy growth benefited
from continued strong performance of
Valleylab™ FT10, which was offset by
competitive reprocessing in the US
• Benefited from Smith & Nephew
gynecology acquisition (TRUCLEAR),
which closed beginning of Q2 FY17
• US surgical procedure volumes appear
stable in the ~1-2% range
• New Products Coming in H2 FY17:
• Advanced Energy: Introducing four new products. Three are enhancements to the
jaw design of the LigaSure portfolio and one is a new 5 mm multifunction
instrument, which allows for fast dissection and sealing in one device.
• Advanced Stapling: Signia power stapling system: real-time feedback on tissue
thickness, full power rotation & articulation with one-handed firing
Patient Monitoring and
Airways & Ventilation: +MSD
• Growth benefitted from strong Puritan
Bennett™ 980 sales

Q2 FY17 Earnings Results | November 22, 2016 | 11
RTG
Q2 FY17 HIGHLIGHTS
Spine
36%
Brain
28%
Specialty
20%
Pain
16%
US
69%
Non-US
Dev
21%
EM
10%
KEY PERFORMANCE DRIVERS1
Continued Improvement in Spine;
Solid Brain Therapies & Specialty
Therapies Growth Offsets
Declines in Pain Therapies
Neurosurgery: +HSD
• US O-arm® O2 penetration; core
navigation instruments; services
Core Spine: +LSD
• TL Fixation growth driven by US; strong
performance in new Solera Voyager
• Interbody launches (Elevate, Divergence
L, Capstone PTC, Pivox) driving growth
• Cervical challenged by pricing pressure,
flat unit volumes, EMEA weakness
BMP: +LSD
• US: HSD Infuse® growth
• OUS: InductOs™ ship hold in Europe
resulted in ~$5M lost revenue in Q2;
expect to resolve in H1 FY18
Brain Modulation: +LSD
• Strong US replacement demand
partially offset by continued weakness
in new implants
• European competitive headwinds
ENT: +LSD
• Continued strong NuVent growth partially
offset by weakness in disposables and
EMEA tender delays
Advanced Energy: +LDD
• AEX ® Generator combo platform
driving continued adoption
• WW growth of Aquamantys and
PlasmaBlade disposables
• Strong US Core 4 (Ortho, Oncology,
CRM Leads, ENT) execution
InterStim II®
O-arm® O2
Infuse®
Bone Graft
Spine
Brain Therapies
Specialty Therapies
Pain Therapies
Neurovascular: +MSD
Pelvic Health: +HSD
• Balanced US / OUS growth driven by healthy
new implant and replacement demand
• Voluntary recall of NV products in Q2
negatively impacted growth in Flow
Diversion and Neuro Access
• Medina embolization product hold
affecting Coil and Intrassacular growth
• Recent launch of Axium Prime Detachable
Coil (Extra Soft) gaining traction
Kanghui: +HSD
Revenue
$M
As Rep
Y/Y %
CC1
Y/Y %
Spine 663 2 1
Brain 506 7 6
Specialty 369 6 6
Pain 288 (2) (2)
Total $1,826 4% 3%
U.S. 1,261 4 4
Non-U.S. Dev 383 4 1
EM 182 1 2
Total $1,826 4% 3%
H2 Growth Outlook: Low End of MSD Range
(Ramp Q3 to Q4)
• New product launches driving growth
SCS/Pumps: -MSD
• Growth in US replacement demand offset
by new implant declines
• Ongoing SCS competitive pressure
leading to share loss
Interventional: +HSD
• Balanced US/OUS growth
• OsteoCool ™ ablation system
generating BKP pull-through
OsteoCoolTM
1 Figures represent comparison to Q2 FY16 on a constant currency basis.
Continued improvement in Spine; gained global share

Q2 FY17 Earnings Results | November 22, 2016 | 12
DIABETES
Q2 FY17 HIGHLIGHTS
US
59% Non-US
Dev
32%
EM
9%
KEY PERFORMANCE DRIVERS1
Intensive Insulin Management (IIM)
Temporary Disruption to Pump
Buying Patterns, Robust
Product Pipeline
MiniMed®
630G
MiniMed®
Connect
12
Total Group
Revenue
$462M
Revenue
$M
As Rep
Y/Y %
CC1
Y/Y %
IIM ND LSD MSD
NDT ND >40 >35
DSS ND LSD LSD
Total $462 3% 3%
U.S. 272 (3) (3)
Non-U.S. Dev 150 11 12
EM 40 14 14
Total $462 3% 3%
H2 Growth Outlook: MSD to HSD
(Ramp Q3 to Q4)
MiniMed®
640G
Non-Intensive Diabetes Therapies (NDT)
iPro®2 CGM
w/ Pattern
Snapshot
Diabetes Service & Solutions (DSS)
Product Approval Dynamics
Affected Growth
• US insulin pump sales slowed in
anticipation of MiniMed® 670G System
launch
• Deferring portion of MiniMed® 630G
System revenue due to Priority Access
Program; early adopters participating in
program
CGM Reimbursement:
• Secured in Germany, Greece, and Czech
Republic
MiniMed® 670G System:
• Earlier-than-expected FDA approval
• World’s first hybrid closed loop system
with advanced SmartGuard® HCL
algorithm and Guardian ® Sensor 3
• On track for initial shipments in Spring
2017; see full benefit in FY18
Another Strong Quarter:
• iPro® Pattern Snapshot driving growth
• iPro® 2 with Sof-Sensor® approved in
China
i-Port Advance Technology:
• iPort DTC campaign launched with
strong US sales in Q2
International Growth:
• Continued success of 640G launch and
customer care programs to improve
adherence /retention
MiniMed® Connect:
• Solid initial uptake of recently launched
Android version
Sugar.IQ™ with Watson:
• First live experience of cognitive
app; first application of IBM Watson
technology collaboration
Guardian® Connect:
• Launched in October in select countries
in EMEA with Enhanced Enlite® sensor.
• US launch with the Guardian® Sensor 3
expected later this fiscal year
MiniMed® 640G System:
• Continued strong sales in Europe
• Will continue to launch throughout Latin
America and APAC countries over the
course of FY17
Henry Schein:
• Continued progress on distribution
agreement; developing new ease-of-
use tools that will help drive
professional CGM awareness
1 Figures represent comparison to Q2 FY16 on a constant currency basis.
Diabeter
• Opened 5th clinic in the Netherlands

FY17 EPS GUIDANCE,
REVENUE OUTLOOK, &
OTHER ASSUMPTIONS

Q2 FY17 Earnings Results | November 22, 2016 | 14
MDT
FY17 EPS GUIDANCE, REVENUE OUTLOOK & OTHER ASSUMPTIONS
H2 FY17 FY17
Revenue Growth Outlook – CCCW1 MSD MSD
CVG Growth – CCCW MSD,
Q3 greater than Q4
--
MITG Growth – CCCW MSD --
RTG Growth – CCCW Low-end of MSD,
Ramp Q3 to Q4
--
Diabetes Growth – CCCW MSD to HSD,
Ramp Q3 to Q4
--
COV Synergies -- ~$225-250M
EPS Growth Guidance– CCCW2 8-10% Double Digit
Free Cash Flow3 -- $5B - $6B
Other than noted, revenue and EPS growth guidance do not include any charges or gains that would be recorded as non-GAAP adjustments to earnings during the fiscal year
1 While FX rates are fluid, based on current rates, the FX impact to H2 revenue would be +$63M to +$103M
2 Estimated FX impact to FY17 EPS of ($0.20) to ($0.22)
3 Operating cash flows less property, plant and equipment additions
Note: Medtronic does not intend to adopt FASB ASU 2016-09 regarding the
change in tax treatment of stock-based compensation until our fiscal year 2018.
Updated Guidance

Q2 FY17 Earnings Results | November 22, 2016 | 15
MDT
Q2 FY17 REVENUE REPORTING CHANGES – NEW CRHF STRUCTURE
CRHF – Prior View
Low Power
AF & Other
High Power
Tachy
HF (partial)
Brady
HF (partial)
Diagnostics
AF Solutions
Hosp. Solutions
MCMS
Revenue
Grouping
Product
Lines
CRHF – New View
Heart
Failure
Arrhythmia
Mgmt.
S&S
Tachy
Brady
Diagnostics
(partial)
AF Solutions
HF
Diagnostics
(partial)
Hosp. Solutions
MCMS
Business
Unit
ICDs
CRT-Ds
Pacemakers
CRT-Ps
Reveal, LINQ,
SEEQ
AF Ablation
CLMS, ORMS,
Post-Acute Care
Svcs.
Revenue
Grouping
Business
Unit
Product
Lines
CRTs
LVADs
ICDs
Pacemakers
Reveal, LINQ
AF Ablation
SEEQ
CLMS, ORMS
Post Acute
Care Svcs.
Recast to better align with management/GM structure and the recent acquisition of HeartWare

Q2 FY17 Earnings Results | November 22, 2016 | 16
APPENDIX
ACRONYMS / ABBREVIATIONS
1
Growth
DD Double Digits
HSD High-Single Digit
LDD Low-Double Digits
LSD Low-Single Digit
MSD Mid-Single Digit
ASP Average Selling Price H1 / H2
First Half / Second
Half
APAC Asia Pacfic M&A
Mergers &
Acquisit ions
Bps Basis Points Mgmt. Management
CC Constant Currency Ops Operations
CCCW
Constant Currency
Constant Weeks
OM Operating Margins
Dev Developed OUS
Outside the United
States
EM Emerging Markets R&D
Research &
Development
EMEA
Europe, Middle East &
Africa
Rep Reported
EPS Earnings per Share SG&A
Selling, General &
Administrative
FCF Free Cash Flow WW Worldwide
FX Foreign Exchange Y/Y Year-over-Year
FY Fiscal Year
Other
AAA Abdominal Aortic Aneurysms HF Heart Failure
AF Atrial Fibrillation Hosp. Hospitals
APV Aortic & Peripheral Vascular ICD Implantable Cardioverter Defibrillator
BKP Balloon Kyphoplasty IIM Intensive Insulin Management
BMP Bone Morphogenetic Protein ISR In-Stent Restenosis
Brady Bradycardia LVAD left Ventricular Assist Device
CGM Continuous Glucose Monitoring MCMS
Medtronic Care Management
Services
CLMS Cath Lab Managed Services MDT Medtronic
CRHF Cardiac Rhythm & Heart Failure MITG Minimally Invasive Therapies Group
CRM Cardiac Rhythm Management MIS Minimally Invasive Surgery
CRT-D
Cardiac Resynchronization Therapy –
Defibrillator
MRI Magnetic Resonance Imaging
CRT-P
Cardiac Resynchronization Therapy –
Pacemakers
NDT Non- Intensive Diabetes Therapies
CSH Coronary & Structural Heart NV Neurovascular
CVG Cardiac & Vascular Group OR Operating Room
DBS Deep Brain Stimulation ORMS Operating Room Managed Services
DVT Deep Vein Thrombosis PMR Patient Monitoring & Recovery
DCB Drug Coated Balloon PTC Pure Titanium Coating
DES Drug Eluting Stent RTG Restorative Therapies Group
DSS Diabetes Services & Solutions SCS Spinal Cord Stimulation
ENDO Endovascular Sol Solutions
ENT Ear, Nose, & Throat ST Surgical Technologies
Extracorp Extracorporeal Tachy Tachycardia
FDA Food and Drug Administration TAVR
Transcatheter Aortic Valve
Replacement
HCL Hybrid Closed Loop TL Transforaminal Lumbar
Business Specific
