Attached files
| file | filename |
|---|---|
| 8-K - 8-K - Phillips Edison & Company, Inc. | ntriearningscall8kq32016.htm |

The Grocery REITPhillips Edison-ARC
Grocery Center REIT II
1
Phillips Edison Grocery Center REIT I, Inc.
Third Quarter 2016 Results
www.grocerycenterREIT1.com
DST: 888.518.8073
Griffin Capital Securities: 866.788.8614

The Grocery REITPhillips Edison-ARC
Grocery Center REIT II
2
Agenda
• Portfolio & Results
• Other Updates
R. Mark Addy - President and COO

The Grocery REITPhillips Edison-ARC
Grocery Center REIT II
3
Forward-Looking Statement Disclosure
This presentation and the corresponding call may contain forward-looking statements within the meaning
of Section 27A of the Securities Act of 1933 and Section 21E of the Securities Exchange Act of 1934.
These statements include, but are not limited to, statements related to the Company’s expectations
regarding the performance of its business, its financial results, its liquidity and capital resources, the
quality of the Company’s portfolio of grocery anchored shopping centers and other non-historical
statements. You can identify these forward-looking statements by the use of words such as “outlook,”
“believes,” “expects,” “potential,” “continues,” “may,” “will,” “should,” “seeks,” “approximately,” “projects,”
“predicts,” “intends,” “plans,” “estimates,” “anticipates” or the negative version of these words or other
comparable words. Such forward-looking statements are subject to various risks and uncertainties, such
as the risks that retail conditions may adversely affect our base rent and, subsequently, our income, and
that our properties consist primarily of retail properties and our performance, therefore, is linked to the
market for retail space generally, as well as other risks described under the section entitled "Risk
Factors" in the Company's Annual Report on Form 10-K for the year ended December 31, 2015, and the
Company's Quarterly Report on Form 10-Q for the quarter ended September 30, 2016, as such factors
may be updated from time to time in the Company’s periodic filings with the SEC, which are accessible
on the SEC’s website at www.sec.gov. Accordingly, there are or will be important factors that could cause
actual outcomes or results to differ materially from those indicated in these statements. These factors
should not be construed as exhaustive and should be read in conjunction with the other cautionary
statements that are included in this presentation, the corresponding call and in the Company’s filings with
the SEC. The Company undertakes no obligation to publicly update or revise any forward-looking
statement, whether as a result of new information, future events, or otherwise.

The Grocery REITPhillips Edison-ARC
Grocery Center REIT II
4
Q3 2016 Portfolio Highlights
• 150 properties
• 28 states
• 24 leading grocery anchors
• 16 million square feet
• 95.9% occupied
• 79.4% of rents from grocer,
national and regional tenants
Information as of 9/30/2016.

The Grocery REITPhillips Edison-ARC
Grocery Center REIT II
5
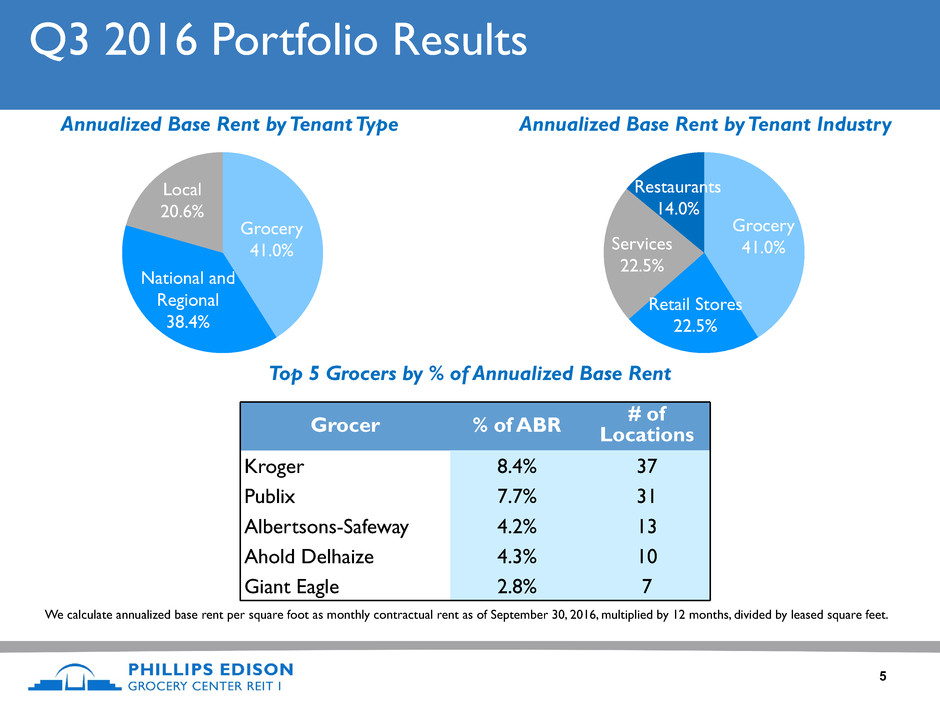
Q3 2016 Portfolio Results
Grocer % of ABR # ofLocations
Kroger 8.4% 37
Publix 7.7% 31
Albertsons-Safeway 4.2% 13
Ahold Delhaize 4.3% 10
Giant Eagle 2.8% 7
Top 5 Grocers by % of Annualized Base Rent
Annualized Base Rent by Tenant Type Annualized Base Rent by Tenant Industry
We calculate annualized base rent per square foot as monthly contractual rent as of September 30, 2016, multiplied by 12 months, divided by leased square feet.
Grocery
41.0%
National and
Regional
38.4%
Local
20.6%
Grocery
41.0%
Retail Stores
22.5%
Services
22.5%
Restaurants
14.0%

The Grocery REITPhillips Edison-ARC
Grocery Center REIT II
6
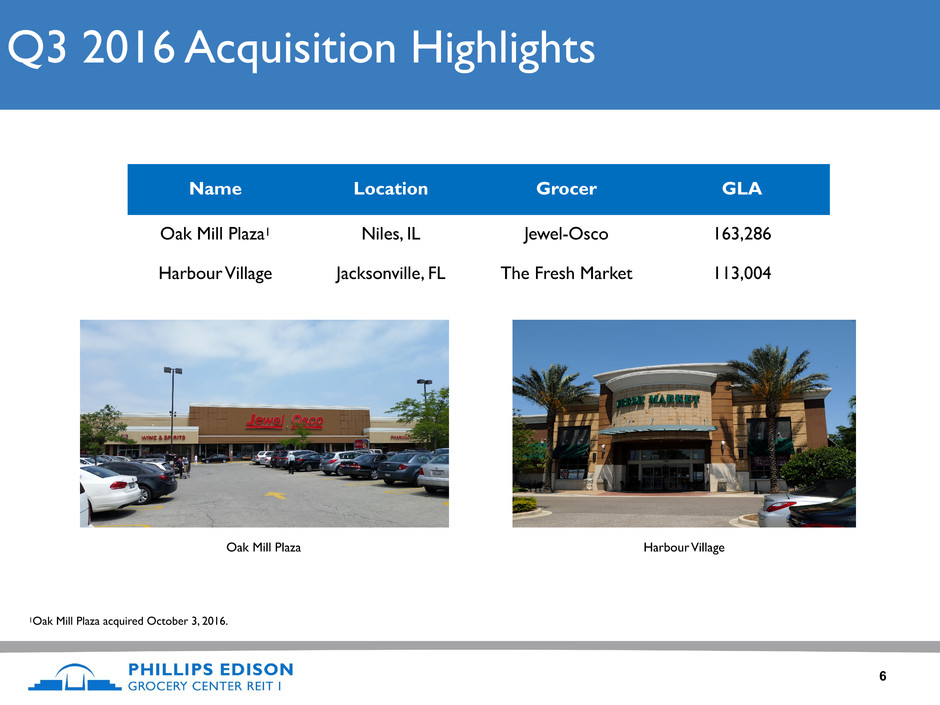
Name Location Grocer GLA
Oak Mill Plaza1 Niles, IL Jewel-Osco 163,286
Harbour Village Jacksonville, FL The Fresh Market 113,004
Q3 2016 Acquisition Highlights
Oak Mill Plaza Harbour Village
1Oak Mill Plaza acquired October 3, 2016.

The Grocery REITPhillips Edison-ARC
Grocery Center REIT II
7
Year to Date 2016 Same-Center(1) Net Operating Income
Three Months Ended September 30, Nine Months Ended September 30,
(in 000s) 2016 2015 $ Change % Change 2016 2015 $ Change % Change
Revenues:
Rental income(2) $ 41,902 $ 40,695 $ 1,207 $ 125,776 $ 121,837 $ 3,939
Tenant recovery income 14,720 14,485 235 43,470 39,843 3,627
Other property income 194 267 (73) 569 882 (313)
56,816 55,447 1,369 2.5% 169,815 162,562 7,253 4.5%
Operating expenses:
Property operating expenses 8,990 8,859 131 27,017 26,114 903
Real estate taxes 7,925 9,069 (1,144) 24,651 24,385 266
16,915 17,928 (1,013) (5.7)% 51,668 50,499 1,169 2.3%
Total Same-Center NOI $ 39,901 $ 37,519 $ 2,382 6.3% $ 118,147 $ 112,063 $ 6,084 5.4%
(1) Represents 133 properties that we owned and operated prior to January 1, 2015, excluding five properties classified as redevelopment.
(2) Excludes straight-line rental income and the net amortization of above- and below-market leases.

The Grocery REITPhillips Edison-ARC
Grocery Center REIT II
8
Debt Profile as of September 30, 2016
• Debt to Enterprise Value: 32.7%*
• Weighted-Average Interest Rate: 3.0%
• Weighted-Average Years to Maturity: 4.2
• Fixed-rate debt: 62.1%
• Variable-rate debt: 37.9%
*Calculated as net debt (total debt, excluding below-market debt adjustments and deferred financing costs, less cash and cash equivalents) as a
percentage of enterprise value (equity value, calculated as total common shares and OP units outstanding multiplied by the estimated value per share
of $10.20, plus net debt).

The Grocery REITPhillips Edison-ARC
Grocery Center REIT II
9
Company Updates
• Reaffirmed est. net asset value per share of $10.20 as of March
31, 2016*
• Share Repurchase Program Status
• Partnered with Griffin Capital Corporation
* Please note that the estimated value per share is not intended to represent an enterprise or liquidation value of our company. It is important to
remember that the estimated value per share may not reflect the amount you would obtain if you were to sell your shares or if we liquidated our
assets. Further, the estimated NAV per share is as of a moment in time, and the value of our shares and assets may change over time as a result of
several factors including, but not limited to, future acquisitions or dispositions, other developments related to individual assets, and changes in the
real estate and capital markets, and we do not undertake to update the estimated NAV per share to account for any such events. You should not rely
on the estimated NAV per share as being an accurate measure of the then-current value of your shares in making a decision to buy or sell your
shares, including whether to participate in our dividend reinvestment plan or our share repurchase program. For a description of the methodology
and assumptions used to determine the estimated NAV per share, see the current Report on Form 8-K filed with the U.S. Securities and Exchange
Commission on April 15, 2016.

The Grocery REITPhillips Edison-ARC
Grocery Center REIT II
10
Appendix

The Grocery REITPhillips Edison-ARC
Grocery Center REIT II
11
Reconciliation of Non-GAAP Financials
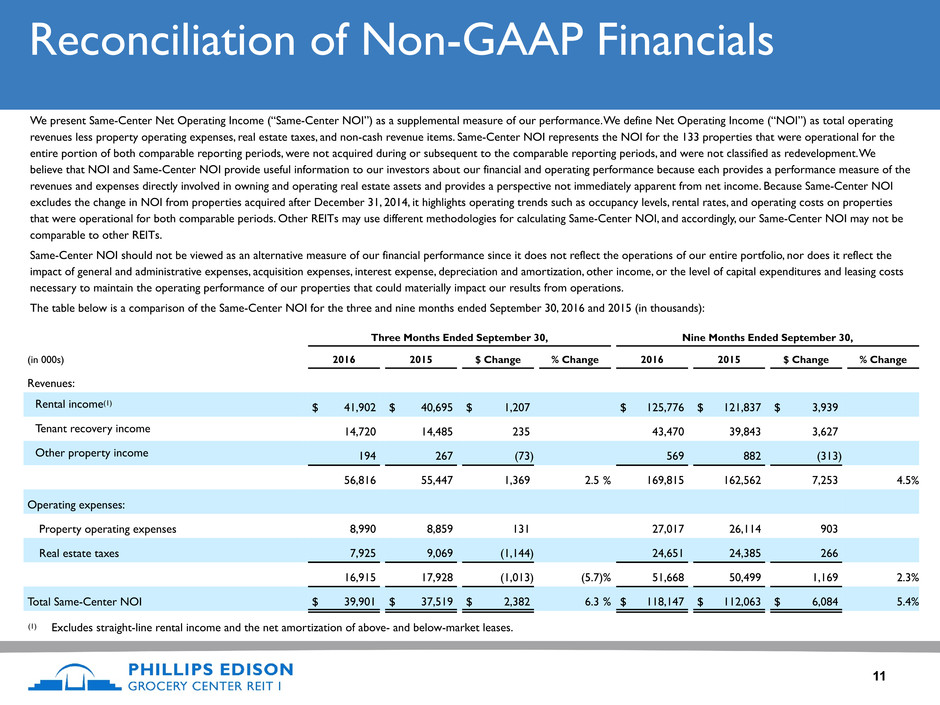
We present Same-Center Net Operating Income (“Same-Center NOI”) as a supplemental measure of our performance. We define Net Operating Income (“NOI”) as total operating
revenues less property operating expenses, real estate taxes, and non-cash revenue items. Same-Center NOI represents the NOI for the 133 properties that were operational for the
entire portion of both comparable reporting periods, were not acquired during or subsequent to the comparable reporting periods, and were not classified as redevelopment. We
believe that NOI and Same-Center NOI provide useful information to our investors about our financial and operating performance because each provides a performance measure of the
revenues and expenses directly involved in owning and operating real estate assets and provides a perspective not immediately apparent from net income. Because Same-Center NOI
excludes the change in NOI from properties acquired after December 31, 2014, it highlights operating trends such as occupancy levels, rental rates, and operating costs on properties
that were operational for both comparable periods. Other REITs may use different methodologies for calculating Same-Center NOI, and accordingly, our Same-Center NOI may not be
comparable to other REITs.
Same-Center NOI should not be viewed as an alternative measure of our financial performance since it does not reflect the operations of our entire portfolio, nor does it reflect the
impact of general and administrative expenses, acquisition expenses, interest expense, depreciation and amortization, other income, or the level of capital expenditures and leasing costs
necessary to maintain the operating performance of our properties that could materially impact our results from operations.
The table below is a comparison of the Same-Center NOI for the three and nine months ended September 30, 2016 and 2015 (in thousands):
Three Months Ended September 30, Nine Months Ended September 30,
(in 000s) 2016 2015 $ Change % Change 2016 2015 $ Change % Change
Revenues:
Rental income(1) $ 41,902 $ 40,695 $ 1,207 $ 125,776 $ 121,837 $ 3,939
Tenant recovery income 14,720 14,485 235 43,470 39,843 3,627
Other property income 194 267 (73) 569 882 (313)
56,816 55,447 1,369 2.5 % 169,815 162,562 7,253 4.5%
Operating expenses:
Property operating expenses 8,990 8,859 131 27,017 26,114 903
Real estate taxes 7,925 9,069 (1,144) 24,651 24,385 266
16,915 17,928 (1,013) (5.7)% 51,668 50,499 1,169 2.3%
Total Same-Center NOI $ 39,901 $ 37,519 $ 2,382 6.3 % $ 118,147 $ 112,063 $ 6,084 5.4%
(1) Excludes straight-line rental income and the net amortization of above- and below-market leases.

The Grocery REITPhillips Edison-ARC
Grocery Center REIT II
12
Reconciliation of Non-GAAP Financials
Below is a reconciliation of net income (loss) to Same-Center NOI for the three and nine months ended September 30, 2016 and 2015 (in thousands):
Funds from Operations and Modified Funds from Operations
Funds from operations (“FFO”) is a non-GAAP performance financial measure that is widely recognized as a measure of REIT operating
performance. We use FFO as defined by the National Association of Real Estate Investment Trusts (“NAREIT”) to be net income (loss),
computed in accordance with accounting principles generally accepted in the United States of America (“GAAP”) excluding extraordinary
items, as defined by GAAP, and gains (or losses) from sales of depreciable real estate property (including deemed sales and settlements of
pre-existing relationships), plus depreciation and amortization on real estate assets and impairment charges, and after related adjustments
for unconsolidated partnerships, joint ventures and noncontrolling interests. We believe that FFO is helpful to our investors and our
management as a measure of operating performance because, when compared year to year, it reflects the impact on operations from
trends in occupancy rates, rental rates, operating costs, development activities, general and administrative expenses, and interest costs,
which are not immediately apparent from net income.
Three Months Ended September 30, Nine Months Ended September 30,
2016 2015 2016 2015
Net income $ 2,490 $ 5,246 $ 5,326 $ 15,746
Adjusted to exclude:
Interest expense, net 8,504 7,818 23,837 22,155
Other income (expense), net (33) (242) 125 (117)
General and administrative expenses 7,722 2,871 23,736 7,742
Acquisition expenses 870 836 2,392 4,058
Depreciation and amortization 26,583 25,746 78,266 75,747
Net amortization of above- and below-market leases (354) (206) (936) (560)
Straight-line rental income (1,068) (1,111) (2,793) (3,716)
NOI 44,714 40,958 129,953 121,055
Less: NOI from centers excluded from Same-Center (4,813) (3,439) (11,806) (8,992)
Total Same-Center NOI $ 39,901 $ 37,519 $ 118,147 $ 112,063

The Grocery REITPhillips Edison-ARC
Grocery Center REIT II
13
Reconciliation of Non-GAAP Financials
Since the definition of FFO was promulgated by NAREIT, GAAP has expanded to include several new accounting pronouncements, such
that management and many investors and analysts have considered the presentation of FFO alone to be insufficient. Accordingly, in
addition to FFO, we use modified funds from operations (“MFFO”), which excludes from FFO the following items:
• acquisition fees and expenses;
• straight-line rent amounts, both income and expense;
• amortization of above- or below-market intangible lease assets and liabilities;
• amortization of discounts and premiums on debt investments;
• gains or losses from the early extinguishment of debt;
• gains or losses on the extinguishment of derivatives, except where the trading of such instruments is a fundamental
attribute of our operations;
• gains or losses related to fair-value adjustments for derivatives not qualifying for hedge accounting; and
• adjustments related to the above items for joint ventures and noncontrolling interests and unconsolidated entities in the
application of equity accounting.
We believe that MFFO is helpful in assisting management and investors with the assessment of the sustainability of operating
performance in future periods and, in particular, after our acquisition stage is complete, because MFFO excludes acquisition expenses that
affect operations only in the period in which the property is acquired. Thus, MFFO provides helpful information relevant to evaluating our
operating performance in periods in which there is no acquisition activity.

The Grocery REITPhillips Edison-ARC
Grocery Center REIT II
14
Reconciliation of Non-GAAP Financials
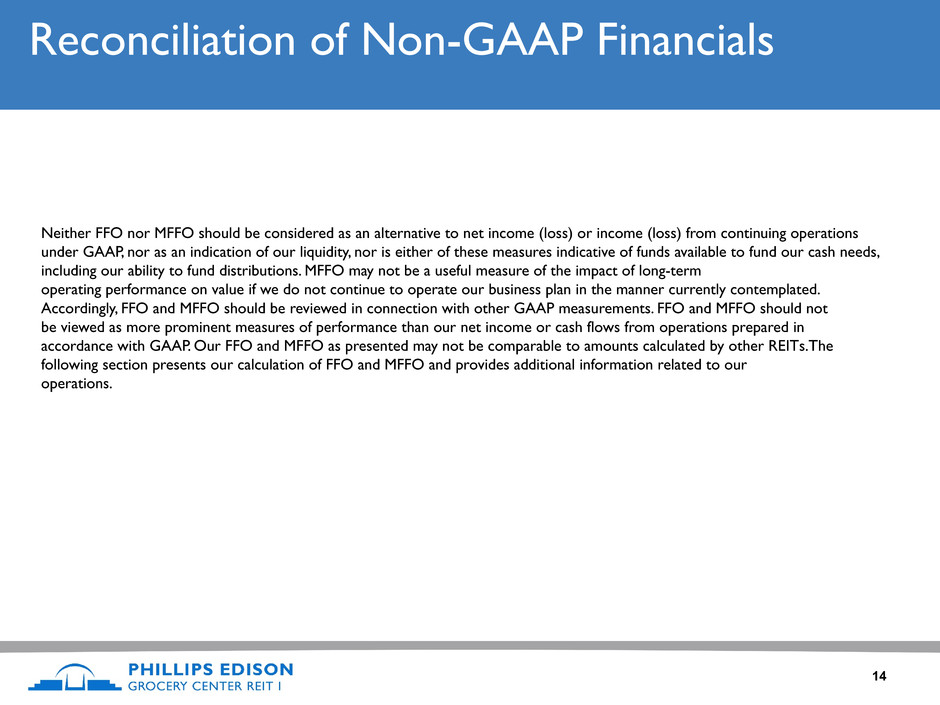
Neither FFO nor MFFO should be considered as an alternative to net income (loss) or income (loss) from continuing operations
under GAAP, nor as an indication of our liquidity, nor is either of these measures indicative of funds available to fund our cash needs,
including our ability to fund distributions. MFFO may not be a useful measure of the impact of long-term
operating performance on value if we do not continue to operate our business plan in the manner currently contemplated.
Accordingly, FFO and MFFO should be reviewed in connection with other GAAP measurements. FFO and MFFO should not
be viewed as more prominent measures of performance than our net income or cash flows from operations prepared in
accordance with GAAP. Our FFO and MFFO as presented may not be comparable to amounts calculated by other REITs.The
following section presents our calculation of FFO and MFFO and provides additional information related to our
operations.

The Grocery REITPhillips Edison-ARC
Grocery Center REIT II
15
Reconciliation of Non-GAAP Financials
Three Months Ended September 30, Nine Months Ended September 30,
(in 000s) 2016 2015 2016 2015
Calculation of FFO
Net income attributable to stockholders $ 2,464 $ 5,183 $ 5,243 $ 15,524
Adjustments:
Depreciation and amortization of real estate assets 26,583 25,746 78,266 75,747
Noncontrolling interest (397) (381) (1,171) (1,091)
FFO attributable to common stockholders $ 28,650 $ 30,548 $ 82,338 $ 90,180
Calculation of MFFO
FFO attributable to common stockholders $ 28,650 $ 30,548 $ 82,338 $ 90,180
Adjustments:
Acquisition expenses 870 836 2,392 4,058
Net amortization of above- and below-market leases (354) (206) (936) (560)
Write-off of unamortized deferred financing fees (184) 15 (79) 155
Straight-line rental income (1,068) (1,111) (2,793) (3,716)
Amortization of market debt adjustment (285) (690) (1,631) (2,012)
Change in fair value of derivatives (98) 39 (66) 16
Noncontrolling interest 4 (30) 47 31
MFFO attributable to common stockholders $ 27,535 $ 29,401 $ 79,272 $ 88,152
Earnings per common share:
Basic:
Weighted-average common shares outstanding 184,639 185,271 183,471 184,209
Net income per share $ 0.01 $ 0.03 $ 0.03 $ 0.08
FFO per share 0.16 0.16 0.45 0.49
MFFO per share 0.15 0.16 0.43 0.48
Diluted:
Weighted-average common shares outstanding 187,428 188,057 186,260 186,902
Net income per share $ 0.01 $ 0.03 $ 0.03 $ 0.08
FFO per share 0.15 0.16 0.44 0.48
MFFO per share 0.15 0.16 0.43 0.47

The Grocery REITPhillips Edison-ARC
Grocery Center REIT II
16
Thank You
www.grocerycenterREIT1.com
DST: 888.518.8073
Griffin Capital Securities: 866.788.8614
