Attached files
| file | filename |
|---|---|
| 8-K - 8-K - GOLUB CAPITAL INVESTMENT Corp | v453561_8-k.htm |

CONFIDENTIAL - FOR DISCUSSION PURPOSES ONLY 0 CONFIDENTIAL - FOR DISCUSSION PURPOSES ONLY GOLUB CAPITAL INVESTMENT CORPORATION INVESTOR PRESENTATION Quarter Ended September 30, 2016 GOLUBCAPITAL.COM GCIC

CONFIDENTIAL - FOR DISCUSSION PURPOSES ONLY 1 Disclaimer Some of the statements in this presentation constitute forward - looking statements, which relate to future events or our future p erformance or financial condition. The forward - looking statements contained in this presentation involve risks and uncertainties, including statements as to: our futur e operating results; our business prospects and the prospects of our portfolio companies; the effect of investments that we expect to make and the competition for those investments; our contractual arrangements and relationships with third parties; actual and potential conflicts of interest with GC Advisor s L LC ("GC Advisors"), our investment adviser, and other affiliates of Golub Capital LLC (collectively, "Golub Capital"); the dependence of our future success on the general economy and its effect on the industries in which we invest; the ability of our portfolio companies to achieve their obj ectives; the use of borrowed money to finance a portion of our investments; the adequacy of our financing sources and working capital; the timing of cash flows, if any, from the operations of our portfolio companies; general economic trends and other external factors; the ability of GC Advisors to locate suitable investments for us and to monitor and administer our investments; the ability of GC Advisors or its affiliates to attract and re tain highly talented professionals; our ability to qualify and maintain our qualification as a regulated investment company and as a business deve lop ment company; general price and volume fluctuations in the stock markets; the impact on our business of the Dodd - Frank Wall Street Reform and Consumer Protection Act and the rules and regulations issued thereunder; and the effect of changes to tax legislation and our tax position. Such forward - looking statements may include statements preceded by, followed by or that otherwise include the words “may,” “migh t,” “will,” “intend,” “should,” “could,” “can,” “would,” “expect,” “believe,” “estimate,” “anticipate,” “predict,” “potential,” “plan” or si milar words. We have based the forward - looking statements included in this presentation on information available to us on the date of this presentation. Actual results could differ materially from those anticipated in our forward - looking statements and future results could differ materially from historical performance. We undertake no obligation to revise or update any forward - looking statements made herein, whether as a result of new information, future events or otherwise. Y ou are advised to consult any additional disclosures that we may make directly to you or through reports that we have filed or i n t he future may file with the Securities and Exchange Commission (“SEC ”). This presentation contains statistics and other data that have been obtained from or compiled from information made available by third - party service providers. We have not independently verified such statistics or data. This presentation includes certain information regarding our financial condition and results of operations as of and for the yea r ended September 30, 2016. This information has been prepared by, and is the responsibility of, management. It remains subject to adjustment pen din g completion of the audit of the financial statements as of and for the year ended September 30, 2016 by our independent registered public accoun tin g firm. This presentation is not a comprehensive statement of our financial results and our actual results may differ materially as a resu lt of any final adjustments. You are encouraged to review our audited financial statements as of and for the year ended September 30, 2016, which will be fil ed as part of a post - effective amendment to our Registration Statement on Form 10, when available.

CONFIDENTIAL - FOR DISCUSSION PURPOSES ONLY 2 Fourth Fiscal Quarter 2016 Highlights Net increase in net assets resulting from operations (i.e. net income) for the quarter ended September 30, 2016 was $13.1 mil lio n, or $0.36 per share, resulting in an annualized return on equity of 9.3%. This compares to net income of $10.0 million, or $0.35 per share and an annualized return on equity of 9.2% for the quarter ended Jun e 30, 2016. Net investment income for the quarter ended September 30, 2016 was $10.6 million, or $0.29 per share, as compared to $7.5 million , or $ 0.26 per share for the quarter ended June 30, 2016. Excluding a less than $0.1 million reversal in the accrual for the capital gain incentive fee under GAAP, n et investment income for the quarter ended September 30, 2016 was $10.6 million, or $ 0.29 1 per share, as compared to $7.9 million, or $ 0.27 1 per share, when excluding a $ 0.4 million accrual for the capital gain incentive fee under GAAP for the quarter ended June 30, 2016. Net realized and unrealized gains on investments of $2.4 million , or $ 0.07 per share, for the quarter ended September 30, 2016 was the result of $2.3 million of net unrealized appreciation and $0.1 million of net realized gains. This compares to net realized and unrealized gains on investments of $2.5 million, or $ 0.09 per share, for the quarter ended June 30, 2016. SUMMARY OF QUARTERLY RESULTS 1. As a supplement to U.S. generally accepted accounting principles (“ GAAP ”) financial measures, the Company has provided this non - GAAP performance result. The Company believes that this non - GAAP financial measure is useful as it excludes the accrual of the capital gain incentive fee which is not contractually payable under the terms of the Company’s investment advisory agreement with GC Advisors ( the “Inv est ment Advisory Agreement”). The capital gain incentive fee payable as calculated under the Investment Advisory Agreement for t he period ended September 30, 2016 is $0 . However, in accordance with GAAP, the Company is required to include aggregate unrealized appreciation on investments in the calculation and accrue a capital gain incentive f ee on a quarterly basis as if such unrealized capital appreciation were realized, even though such unrealized capital appreciation is not permitted to be considered in calculating the fee actually payable under the Investmen t A dvisory Agreement. Although this non - GAAP financial measure is intended to enhance investors’ understanding of the Company’s business and performance, this non - GAAP financial measure should not be considered an alternative to GAAP. Refer to slide 3 for a reconciliation to the nearest GAAP measure, net investment income per share.
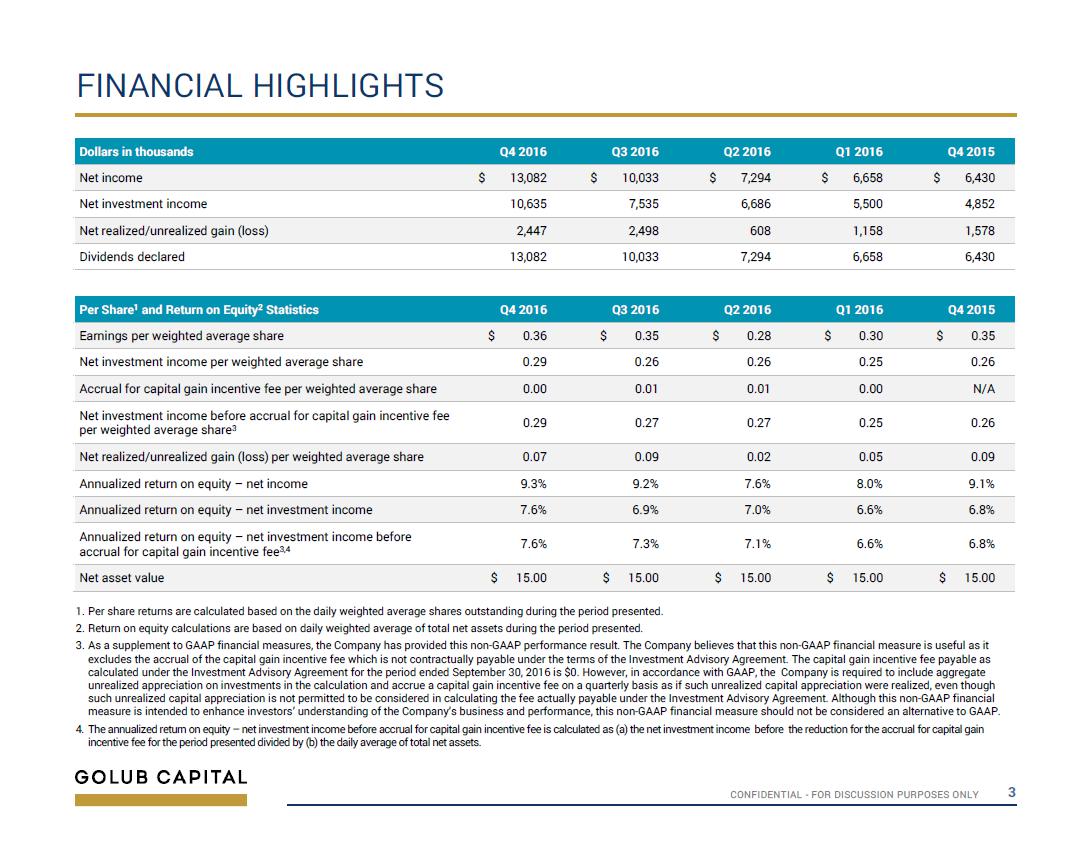
CONFIDENTIAL - FOR DISCUSSION PURPOSES ONLY 3 FINANCIAL HIGHLIGHTS Dollars in thousands Q4 2016 Q3 2016 Q2 2016 Q1 2016 Q4 2 015 Net income $ 13,082 $ 10,033 $ 7,294 $ 6,658 $ 6,430 Net investment income 10,635 7,535 6,686 5,500 4,852 Net realized /unrealized gain (loss) 2,447 2,498 608 1,158 1,578 Dividends declared 13,082 10,033 7,294 6,658 6,430 Pe r Share 1 and Return on Equity 2 Statistics Q4 2 016 Q3 2 016 Q2 2 016 Q1 2 016 Q4 2 015 Earnings per weighted average share $ 0.36 $ 0.35 $ 0.28 $ 0.30 $ 0.35 Net investment income per weighted average share 0.29 0.26 0.26 0.25 0.26 Accrual for capital gain incentive fee per weighted average share 0.00 0.01 0.01 0.00 N/A Net investment income before accrual for capital gain incentive fee per weighted average share 3 0.29 0.27 0.27 0.25 0.26 Net realized /unrealized gain (loss) per weighted average share 0.07 0.09 0.02 0.05 0.09 Annualized return on equity – net income 9.3% 9.2% 7.6% 8.0% 9.1% Annualized return on equity – net investment income 7.6% 6.9% 7.0% 6.6% 6.8% Annualized return on equity – net investment income before accrual for capital gain incentive fee 3,4 7.6% 7.3% 7.1% 6.6% 6.8% Net asset value $ 15.00 $ 15.00 $ 15.00 $ 15.00 $ 15.00 1. Per share returns are calculated based on the daily weighted average shares outstanding during the period presented. 2. Return on equity calculations are based on daily weighted average of total net a ssets during the period presented. 3. As a supplement to GAAP financial measures, the Company has provided this non - GAAP performance result. The Company believes that this non - GAAP financial measure is useful as it excludes the accrual of the capital gain incentive fee which is not contractual ly payable under the terms of the Investment Advisory Agreement. The capital gain incentive fee payable as calculated under the Investment Advisory Agre eme nt for the period ended September 30 , 2016 is $0. However, in accordance with GAAP, the Company is required to include aggregate unrealized appreciation on investments in the calculation and accrue a capital gain incentive fee on a quarterly basis as if such unrealized capital app reciation were realized, even though such unrealized capital appreciation is not permitted to be considered in calculating th e f ee actually payable under the Investment Advisory Agreement. Although this non - GAAP financial measure is intended to enhance investors’ understanding of the C ompany’s business and performance, this non - GAAP financial measure should not be considered an alternative to GAAP. 4. The annualized return on equity – net investment income before accrual for capital gain incentive fee is calculated as (a) the net investment income before the reduction for the accrual for capital gain incentive fee for the per iod presented divided by (b) the daily average of total net assets .

CONFIDENTIAL - FOR DISCUSSION PURPOSES ONLY 4 Originations and Net Funds Growth New middle - market investment commitments totaled $203.4 million for the quarter ended September 30, 2016. Approximately 12% of the new investment commitments were senior secured loans, 87% were one stop loans and 1% were in equity securities. Net growth in investments at fair value (after factoring in debt repayments and other portfolio activity) for the quarter ended September 30, 2016 was $156.9 million, a 17% increase from June 30, 2016. During the quarter ended September 30, 2016, GCIC sold $7.9 million of investments and unfunded commitments at fair va lue to GCIC SLF. PORTFOLIO HIGHLIGHTS – NEW ORIGINATIONS Select Portfolio Funds Roll Data (in millions) Q4 2 016 Q3 2 016 Q2 2 016 Q1 2 016 Q4 2 015 New Investment Commitments $ 203.4 $ 272.5 $ 201.3 $ 151.0 $ 167.3 Exits 1 and Sales of Investments 62.6 47.3 75.4 113.6 23.5 Net Funds Growth 2 156.9 210.5 121.9 28.6 138.3 Fair Value of Investments 1,069.7 912.8 702.4 580.5 551.9 Asset Mix of New Originations Q4 2 016 Q3 2 016 Q2 2 016 Q1 2 016 Q4 2 015 Senior Secured 12% 13% 18% 23% 19% One Stop 87% 84% 80% 49% 80% GCIC Senior Loan Fund 0% 1% 2% 27% 0% Equity 1% 2% 0% 1% 1% 1. Includes full and partial payoffs and sales, including sales to GCIC SLF. 2. Net funds growth includes the impact of new investments and exits of investments as noted in the table above, as well as othe r v ariables such as net fundings on revolvers, net change in unamortized fees, net change in unrealized gains (losses), etc. 3. Represents an amount of less than 1.0%. 3

CONFIDENTIAL - FOR DISCUSSION PURPOSES ONLY 5 99.8% PORTFOLIO HIGHLIGHTS ― PORTFOLIO DIVERSITY AS OF SEPTEMBER 30, 2016 1. Excludes investment in GCIC SLF. 2. The percentage of fixed rate loans and floating rate loans is calculated using total debt investments at fair value and exclu des equity investments . Fixed – 0.2% Floating Industry Diversity of Investments Diversity by Investment Size Top 10 Investments 28% Top 25 Investments 51% Remaining 133 Investments 45% Interest Rate on Loans 3 Historical Investment Portfolio ($mm) INVESTMENT PORTFOLIO $1,021.8MM 1 // 158 INVESTMENTS 1 – AVERAGE SIZE $6.5MM 1 $- $200 $400 $600 $800 $1,000 $1,200 9/30/15 12/31/15 3/31/16 6/30/16 9/30/16 Inv. in GCIC SLF Equity One Stop Sr. Secured 21% 19% 11% 11% 7% 5% 5% 3% 3% 4% 11% Diversified/Conglomerate Service – 21% Healthcare, Education and Childcare – 19% Electronics – 11% Retail Stores – 11% Personal, Food and Miscellaneous Services – 7% Automobile – 5% Printing and Publishing – 5% Beverage, Food and Tobacco – 3% Diversified/Conglomerate Manufacturing – 3% GCIC SLF – 4% Other – 11% GCIC SLF 4 % 99.8% 71% 74% $912.8 $1,069.7 1% 1% 1% 5 % $551.9 $580.5 $702.4 80% 28% 18% 13% 82% 12% 84% 11% 4 % 1% 1% 7% 6 %

CONFIDENTIAL - FOR DISCUSSION PURPOSES ONLY 6 7.3% 7.5% 8.0% 7.7% 8.1% 6.9% 7.1% 7.4% 7.4% 7.6% 3.2% 3.5% 3.7% 3.4% 3.5% 4.1% 4.0% 4.3% 4.3% 4.6% 0.3% 0.6% 0.6% 0.7% 0.9% 0.0% 1.0% 2.0% 3.0% 4.0% 5.0% 6.0% 7.0% 8.0% 9.0% Q4 2015 Q1 2016 Q2 2016 Q3 2016 Q4 2016 Investment income yield Income yield Weighted average cost of debt Weighted average net investment spread 3-Month London Interbank Offered Rate ("LIBOR") 5 7 6 4 PORTFOLIO HIGHLIGHTS – SPREAD ANALYSIS 1. Weighted average interest rate on new investments is based on the contractual interest rate at the time of funding. For variable rate loa ns, the contractual rate is calculated using current LIBOR, the spread over LIBOR and the impact of any LIBOR floor. For fixe d r ate loans, the contract rate is the stated fixed rate. 2. Excludes the subordinated note investment in GCIC SLF. 3. Excludes exits on investments on non - accrual status. 4. Investment income yield is calculated as (a) the actual amount earned on earning investments , including the subordinated note investment in GCIC SLF, including interest and fee income and amortization of capitalized fees and discounts, divided by (b ) the daily average of total earning investments at fair value. 5. Income yield is calculated as (a) the actual amount earned on earning investments, including the subordinated note investment in GCIC SLF , including interest and fee income but excluding amortization of capitalized fees and discounts, divided by (b ) the daily average of total earning investments at fair value. 6. The weighted average cost of debt is calculated as (a) the actual amount incurred on debt obligations divided by (b) the daily average of total debt obligations. 7. The weighted average net investment spread is calculated as (a) the investment income yield less (b) the weighted average cost of debt . Portfolio Rotation – Debt Investments Q4 2 016 Q3 2 016 Q2 2 016 Q1 2 016 Q4 2 015 Weighted average interest rate of new investments 1,2 7.7% 7.7% 7.0% 6.4% 7.0% Weighted average interest rate on investments that were sold or paid - off 3 6.8% 6.1% 6.6% 6.0% 6.7% Weighted average spread over LIBOR of new floating rate investments 2 6.7% 6.7% 6.0% 5.4% 6.0% Weighted average interest rate of new fixed rate investments 10.8% 10.6% N/A N/A N/A Weighted average fees on new investments 1.9% 1.7% 1.9% 1.3% 1.4%

CONFIDENTIAL - FOR DISCUSSION PURPOSES ONLY 7 Fundamental credit quality is strong with over 90.0% of the investments in the portfolio having an Internal Performance Rating of 4 or higher as of September 30, 2016. As of September 30, 2016, there is one non - accrual investment with a fair value of $16. PORTFOLIO HIGHLIGHTS – CREDIT QUALITY Strong Portfolio Risk Ratings Internal Performance Ratings Definition September 30, 2016 June 30, 2016 March 31, 2016 Internal Performance Rating Investments at Fair Value (in thousands) % of Total Portfolio Investments at Fair Value (in thousands) % of Total Portfolio Investments at Fair Value (in thousands) % of Total Portfolio 5 $ 5,889 0.6% $ 16,267 1.8% $ 18,335 2.6% 4 $ 995,408 93.0% $ 840,814 92.1% $ 639,918 91.1% 3 $ 64,785 6.1% $ 55,586 6.1% $ 43,744 6.3% 2 $ 3,628 0.3% $ 172 0.0% $ 204 0.0% 1 $ - 0.0% $ - 0.0% $ 164 0.0% Total $ 1,069,710 1 00.0% $ 912,839 1 00.0% $ 702,365 1 00.0% Rating Definition 5 Borrower is performing above expectations and the trends and risk factors are generally favorable 4 Borrower is generally performing as expected and the risk factors are neutral to favorable 3 Borrower may be out of compliance with debt covenants; however, loan payments are generally not past due 2 Borrower is performing materially below expectations and the loan’s risk has increased materially since origination 1 Borrower is p erforming substantially below expectations and the loan’s risk has substantially increased since origination * Represents an amount less than 0.1%. * * *

CONFIDENTIAL - FOR DISCUSSION PURPOSES ONLY 8 QUARTERLY STATEMENTS OF FINANCIAL CONDITION As of ( Dollar amounts in thousands , except per share data) September 30, 2016 (unaudited) June 30, 2016 (unaudited) March 31, 2016 (unaudited) December 31, 2015 (unaudited) September 30, 2015 (audited) Assets Investments, at fair value $ 1,069,710 $ 912,839 $ 702,365 $ 580,510 $ 551,878 Cash and cash equivalents 4,675 4,847 2,787 3,267 2,747 Restricted cash and cash equivalents 71,056 9,815 7,140 7,112 10,145 Other assets 1 3,557 3,420 6,986 7,630 2,469 Total Assets 1 $ 1,148,998 $ 930,921 $ 719,278 $ 598,519 $ 567,239 Liabilities and Net Assets Debt $ 520,600 $ 404,350 $ 303,900 $ 222,800 $ 249,700 Unamortized debt issuance costs 1 (5,073) (2,406) (2,459) (2,757) (3,213) Payable for open trades – 1,858 – 3,743 – Interest payable 1,414 613 529 460 398 Management and incentive fee payable 4,960 3,935 2,874 2,249 1,872 Dividend payable 9,869 10,033 4,939 2,177 4,872 Other liabilities 921 700 569 818 963 Total Liabilities 1 532,691 419,083 310,352 229,490 254,592 Total Net Assets 616,307 511,838 408,926 369,029 312,647 Total Liabilities and Net Assets $ 1,148,998 $ 930,921 $ 719,278 $ 598,519 $ 567,239 Net Asset Value per Share $ 15.00 $ 15.00 $ 15.00 $ 15.00 $ 15.00 Leverage Ratio 0.85x 0.79x 0.74x 0.60x 0.80x Asset coverage 218.1% 226.4% 234.3% 265.3% 225.0% Common shares outstanding 41,087,178 34,122,547 27,261,737 24,601,958 20,843,155 1. On October 1, 2015, we adopted Accounting Standards Update (“ASU”) 2015 - 03 which requires that debt issuance costs related to a rec ognized debt liability to be presented in the balance sheet as a direct deduction from the carrying amount of the debt liabil ity rather than as an asset. Adoption of ASU 2015 - 03 requires the changes to be applied retrospectively .
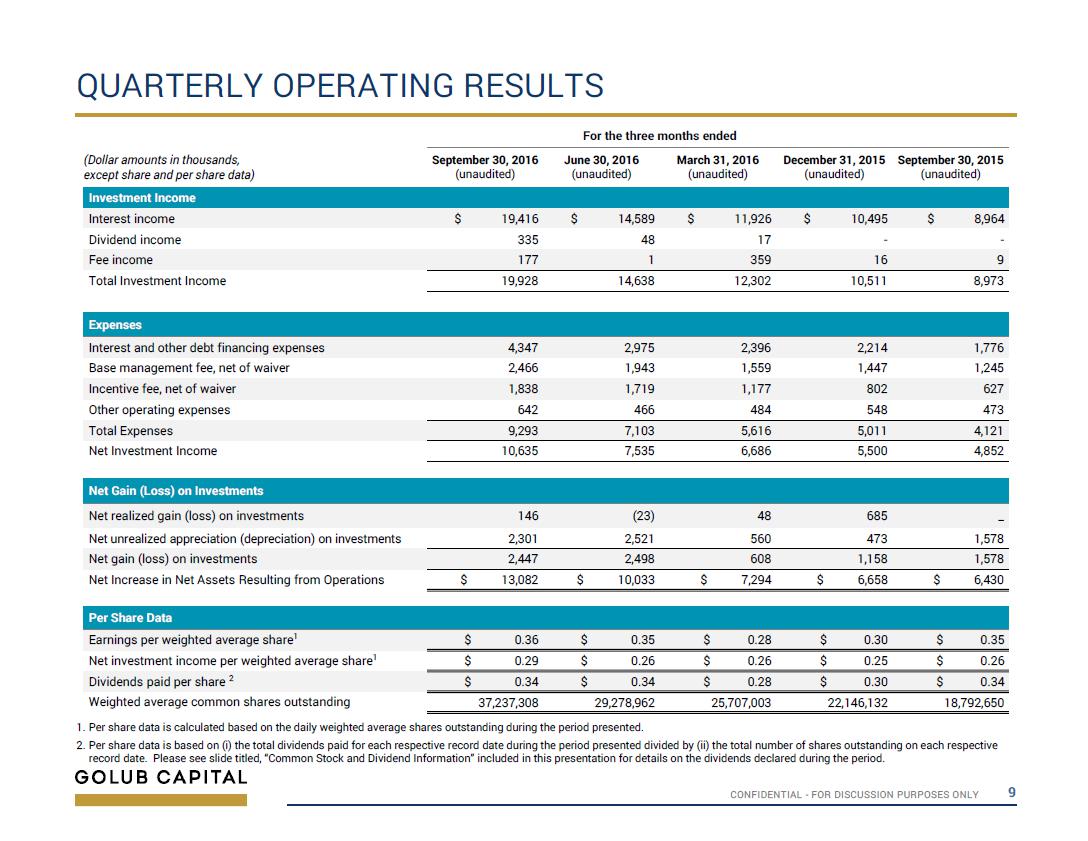
CONFIDENTIAL - FOR DISCUSSION PURPOSES ONLY 9 QUARTERLY OPERATING RESULTS For the three months ended ( Dollar amounts in thousands , except share and per share data) September 30, 2016 (unaudited) June 30, 2016 (unaudited) March 31, 2016 (unaudited) December 31, 2015 (unaudited) September 30, 2015 (unaudited) Investment Income Interest income $ 19,416 $ 14,589 $ 11,926 $ 10,495 $ 8,964 Dividend income 335 48 17 - - Fee income 177 1 359 16 9 Total Investment Income 19,928 14,638 12,302 10,511 8,973 Expenses Interest and other debt financing expenses 4,347 2,975 2,396 2,214 1,776 Base management fee, net of waiver 2,466 1,943 1,559 1,447 1,245 Incentive fee, net of waiver 1,838 1,719 1,177 802 627 Other operating expenses 642 466 484 548 473 Total Expenses 9,293 7,103 5,616 5,011 4,121 Net Investment Income 10,635 7,535 6,686 5,500 4,852 Net Gain (Loss) on Investments Net realized gain (loss) on investments 146 (23) 48 685 _ Net unrealized appreciation (depreciation) on investments 2,301 2,521 560 473 1,578 Net gain (loss) on investments 2,447 2,498 608 1,158 1,578 Net Increase in Net Assets Resulting from Operations $ 13,082 $ 10,033 $ 7,294 $ 6,658 $ 6,430 Per Share Data Earnings per weighted average share 1 $ 0.36 $ 0.35 $ 0.28 $ 0.30 $ 0.35 Net investment income per weighted average share 1 $ 0.29 $ 0.26 $ 0.26 $ 0.25 $ 0.26 Dividends paid per share 2 $ 0.34 $ 0.34 $ 0.28 $ 0.30 $ 0.34 Weighted average common shares outstanding 37,237,308 29,278,962 25,707,003 22,146,132 18,792,650 1. Per share data is calculated based on the daily weighted average shares outstanding during the period presented. 2. Per share data is based on (i) the total dividends paid for each respective record date during the period presented divided b y ( ii) the total number of shares outstanding on each respective record date. Please see slide titled, “Common Stock and Divide nd Information” included in this presentation for details on the dividends declared during the period.

CONFIDENTIAL - FOR DISCUSSION PURPOSES ONLY 10 PORTFOLIO HIGHLIGHTS – GCIC SENIOR LOAN FUND LLC The annualized return for the quarter ended September 30, 2016 was 8.9%, down from 11.3% for the quarter ended June 30, 2016 due to mark - to - market losses on certain middle - market loans . I nvestments at fair value for the quarter ended September 30, 2016 declined by $1.5 million, a 1.0% decrease from June 30, 201 6, as GCIC SLF purchased $7.9 million in investments and unfunded commitments from GCIC at fair value, which was offset by $10.7 million in payoffs and other portfolio activity. Subject to leverage and borrowing base restrictions, as of September 30, 2016, GCIC SLF had approximately $54.5 million of re mai ning commitments and $1.7 million of availability on its revolving credit facility. 1. GCIC’s annualized total return is calculated by dividing total income earned on our investments in GCIC SLF subordinated notes and GCIC SLF LLC equity interests by the combined daily average of our investments in (1) the principal of the GCIC SLF subordinated notes and (2) the net asset value of the GCIC SLF LLC equity interests. Annualized total return excludes the impact of management fees and incentive fees that may be charged by GC Advisors based on GCIC’s investments in GCIC SLF and the income from such investments . (Dollar amounts in thousands) As of Balance Sheet September 30, 2016 (unaudited) June 30, 2016 (unaudited) March 31, 2016 (unaudited) December 31, 2015 (unaudited) Total investments, at fair value $ 146,123 $ 147,611 $ 127,224 $ 83,473 Cash and other assets 3,344 3,172 2,469 2,029 Total assets 149,467 150,783 129,693 85,502 Senior credit facility 95,500 96,900 75,600 34,700 Unamortized debt issuance costs (1,122) (1,190) (1,259) (1,321) Other liabilities 282 271 4,507 5,548 Total liabilities 94,660 95,981 78,848 38,927 Subordinated debt and members’ equity 54,807 54,802 50,845 46,575 Total liabilities and members’ equity $ 149,467 $ 150,783 $ 129,693 $ 85,502 Senior leverage 1.74x 1.77x 1.49x 0.75x (Dollar amounts in thousands) For the three months ended GCIC Return on Investment in GCIC SLF September 30, 2016 (unaudited) June 30, 2016 (unaudited) March 31, 2016 (unaudited) December 31, 2015 (unaudited) Total Income $ 1,080 $ 1,281 $ 1,002 $ 442 Annualized return on total income 1 8.9% 11.3% 9.2% 6.4%
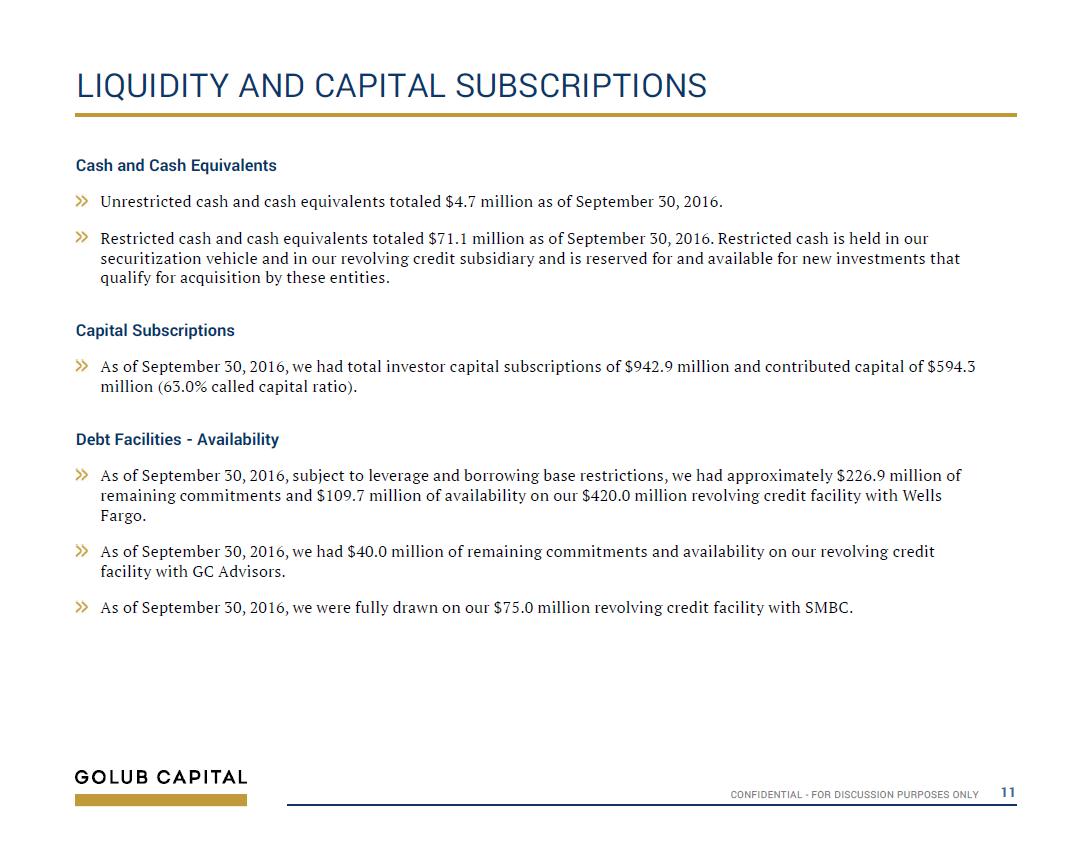
CONFIDENTIAL - FOR DISCUSSION PURPOSES ONLY 11 Cash and Cash Equivalents Unrestricted cash and cash equivalents totaled $4.7 million as of September 30, 2016. Restricted cash and cash equivalents totaled $71.1 million as of September 30, 2016. Restricted cash is held in our securitiz ati on vehicle and in our revolving credit subsidiary and is reserved for and available for new investments that qualify for acquisition by these entities. Capital Subscriptions As of September 30, 2016, we had total investor capital subscriptions of $942.9 million and contributed capital of $594.3 million (63.0% called capital ratio). Debt Facilities - Availability As of September 30, 2016, subject to leverage and borrowing base restrictions, we had approximately $226.9 million of remaining com mitments and $109.7 million of availability on our $420.0 million revolving credit facility with Wells Fargo. As of September 30, 2016, we had $40.0 million of remaining commitments and availability on our revolving credit facility with G C A dvisors. As of September 30, 2016, we were fully drawn on our $75.0 million revolving credit facility with SMBC. LIQUIDITY AND CAPITAL SUBSCRIPTIONS

CONFIDENTIAL - FOR DISCUSSION PURPOSES ONLY 12 Tranche Rating (M/S) Par Amount ($mm) Interest Rate Stated Maturity Reinvestment Period Class A Notes Aaa/AAA $220.0 3 Month LIBOR + 2.15% August 8, 2028 August 8, 2020 Class B Notes Aa1/AA $32.5 3 Month LIBOR + 3.00% August 8, 2028 August 8, 2020 Total Notes Issued 1 $252.5 Issuer Amount Outstanding ($mm) Maximum Commitment ($mm) Interest Rate Stated Maturity Reinvestment Period Wells Fargo Revolving Credit Facility $193.1 $420.0 3 Month LIBOR + 2.25% May 13, 2020 May 12, 2017 SMBC Revolving Credit Facility $75.0 $75.0 1 Month LIBOR + 1.60% May 17, 2018 N/A GC Advisors Revolving Credit Facility $0.0 $40.0 Applicable Federal Rate February 3, 2018 N/A 2016 Debt Securitization 1. The Class C Notes, Class D Notes and LLC Equity Interests issued in the 2016 Debt Securitization, totaling $42.3 million , $28.6 million and $86.7 million, respectively , were retained by the Company. Debt Facilities DEBT FACILITIES
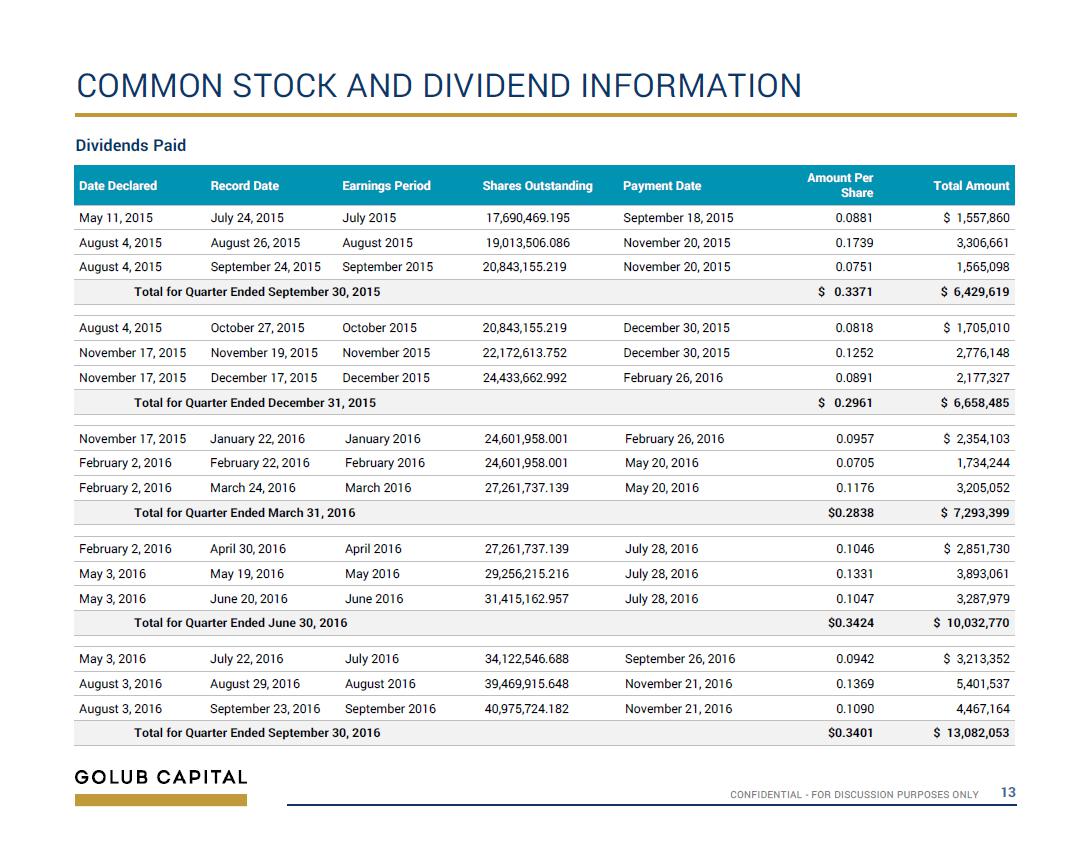
CONFIDENTIAL - FOR DISCUSSION PURPOSES ONLY 13 Dividends Paid COMMON STOCK AND DIVIDEND INFORMATION Date Declared Record Date Earnings Period Shares Outstanding Payment Date Amount Per Share Total Amount May 11, 2015 July 24, 2015 July 2015 17,690,469.195 September 18, 2015 0.0881 $ 1,557,860 August 4, 2015 August 26, 2015 August 2015 19,013,506.086 November 20, 2015 0.1739 3,306,661 August 4, 2015 September 24, 2015 September 2015 20,843,155.219 November 20, 2015 0.0751 1,565,098 Total for Quarter Ended September 30, 2015 $ 0.3371 $ 6,429,619 August 4, 2015 October 27, 2015 October 2015 20,843,155.219 December 30, 2015 0.0818 $ 1,705,010 November 17, 2015 November 19, 2015 November 2015 22,172,613.752 December 30, 2015 0.1252 2,776,148 November 17, 2015 December 17, 2015 December 2015 24,433,662.992 February 26, 2016 0.0891 2,177,327 Total for Quarter Ended December 31, 2015 $ 0.2961 $ 6,658,485 November 17, 2015 January 22, 2016 January 2016 24,601,958.001 February 26, 2016 0.0957 $ 2,354,103 February 2, 2016 February 22, 2016 February 2016 24,601,958.001 May 20, 2016 0.0705 1,734,244 February 2, 2016 March 24, 2016 March 2016 27,261,737.139 May 20, 2016 0.1176 3,205,052 Total for Quarter Ended March 31, 2016 $0.2838 $ 7,293,399 February 2, 2016 April 30, 2016 April 2016 27,261,737.139 July 28, 2016 0.1046 $ 2,851,730 May 3, 2016 May 19, 2016 May 2016 29,256,215.216 July 28, 2016 0.1331 3,893,061 May 3, 2016 June 20, 2016 June 2016 31,415,162.957 July 28, 2016 0.1047 3,287,979 Total for Quarter Ended June 30, 2016 $0.3424 $ 10,032,770 May 3, 2016 July 22, 2016 July 2016 34,122,546.688 September 26, 2016 0.0942 $ 3,213,352 August 3, 2016 August 29, 2016 August 2016 39,469,915.648 November 21, 2016 0.1369 5,401,537 August 3, 2016 September 23, 2016 September 2016 40,975,724.182 November 21, 2016 0.1090 4,467,164 Total for Quarter Ended September 30, 2016 $0.3401 $ 13,082,053

CONFIDENTIAL - FOR DISCUSSION PURPOSES ONLY 14 COMMON STOCK AND DIVIDEND INFORMATION Dividends Declared Date Declared Record Date Earnings Period Shares Outstanding Payment Date Amount Per Share Total Amount August 3, 2016 October 24, 2016 October 2016 41,087,178.250 December 30, 2016 TBD TBD November 14, 2016 November 18, 2016 November 2016 41,087,178.250 December 30, 2016 TBD TBD November 14, 2016 December 26, 2016 December 2016 TBD February 27, 2017 TBD TBD November 14, 2016 January 23, 2017 January 2017 TBD February 27, 2017 TBD TBD