Attached files
| file | filename |
|---|---|
| 8-K - THIRD QUARTER 2016 OVERVIEW - GUGGENHEIM CREDIT INCOME FUND 2019 | ccif-iform8xk2016q3.htm |

Exhibit 99.1
CAREY CREDIT INCOME FUND — I
THIRD QUARTER 2016 OVERVIEW
Details about Carey Credit Income Fund's ("CCIF") and Carey Credit Income Fund — I's ("CCIF - I" or the "Company") third quarter 2016 portfolio and operating results are contained in this overview. This overview should be read in conjunction with the CCIF - I Quarterly Report on Form 10-Q, as filed with the U.S. Securities and Exchange Commission (the "SEC") on November 14, 2016.
CCIF - I Third Quarter 2016 Highlights
• | During the third quarter ended September 30, 2016, CCIF - I paid fully covered distributions of $0.45 per share. |
• | For the period from December 31, 2015 to September 30, 2016, CCIF - I's total investment return on net asset value was 9.32%1. |
• | For the three months ended September 30, 2016, CCIF invested $107.6 million, 81.1% of which was in directly originated debt investments. |
• | CCIF's portfolio investments at fair value totaled $220.5 million as of September 30, 2016, of which 96.2% was in senior secured investments. The portfolio consisted of 67 debt investments and one attached equity investment across 52 portfolio companies. |
• | CCIF's gross portfolio yield as of September 30, 2016 was 7.9%2. |
• | For the period from December 31, 2015 to September 30, 2016, CCIF - I raised $13.5 million in gross proceeds from the sale of common shares. |
• | CCIF -I's net asset value per share was $25.25 as of September 30, 2016, compared to $24.42 as of December 31, 2015. |
• | CCIF - I's net asset value per share has since increased to $25.52 as of November 14, 2016. |
• | During the nine months ended September 30, 2016, CCIF - I decreased its public offering price once from $26.66 to $25.00 per share and increased its public offering price six times from $25.00 to $26.30 per share. Subsequent to September 30, 2016, CCIF - I increased its public offering price once from $26.30 to $26.45 per share. |
________________________
(1) | Total investment return-net asset value is a measure of the change in total value for shareholders who held the Company’s Common Shares at the beginning and end of the period, including distributions declared during the period. Total investment return-net asset value is based on (i) net asset value per share on the first day of the period, (ii) the net asset value per share on the last day of the period, plus any shares issued in connection with the reinvestment of monthly distributions, and (iii) distributions payable relating to the ownership of shares, if any, on the last day of the period. The total investment return-net asset value calculation assumes that (i) monthly cash distributions are reinvested in accordance with the Company’s distribution reinvestment plan and (ii) the shares issued pursuant to the distribution reinvestment plan are issued at the then current public offering price, net of sales load, on each monthly distribution payment date. Since there is no public market for the Company’s shares, terminal market value per share is assumed to be equal to net asset value per share on the last day of the period presented. Total investment return-net asset value is not annualized. Investment performance is presented without regard to sales load that may be incurred by shareholders in the purchase of the Company’s Common Shares. The Company’s performance changes over time and currently may be different than that shown above. Past performance is no guarantee of future results. |
(2) | Weighted average effective yield ("gross portfolio yield") is calculated as the effective yield of each investment and weighted by its amortized cost as compared to the aggregate amortized cost of all investments. Effective yield is the return earned on an investment net of any discount, premium, or issuance costs. Non-income producing assets are excluded. The gross portfolio yield is higher than what investors in the Company will realize because it does not include the operating expenses of the Company. |
1
Business Environment
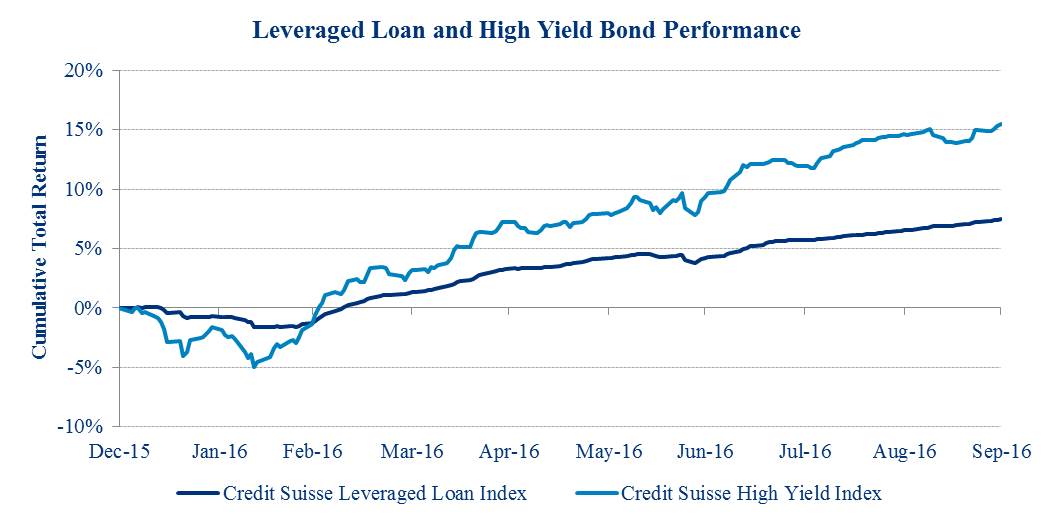
The credit rally that commenced in March continued through the third quarter as U.S. macroeconomic conditions remained generally strong and commodity prices stabilized. The Credit Suisse High-Yield Bond and Leveraged Loan indexes posted gains of 5.7 percent and 3.0 percent in the third quarter, bringing year-to-date returns to 15.5 percent and 7.5 percent, respectively. This strengthening technical backdrop along with increased competition has continued to drive secondary market prices up, making it increasingly difficult to identify syndicated loans with superior risk adjusted returns.
From a macroeconomic perspective we continue to support the view that U.S. economic growth remains resilient to global weakness. As the effects of a strong dollar and weaker oil prices subside, we believe nonfinancial corporates are positioned to deliver strong performance in 2017. Furthermore, ongoing accommodation from central banks across the globe has alleviated much of the initial macroeconomic tail risk posed by Brexit. While there is typically seasonal volatility that arises in the fourth quarter, we believe that it is likely to be short term in nature and may present potential buying opportunities.
In light of these market dynamics, CCIF’s investment focus in the third quarter shifted to directly originated transactions sourced by its Advisors. By directly originating transactions, the portfolio has been able to remain in predominantly senior secured assets while increase portfolio yield quarter-over-quarter.
We believe that this credit environment provides experienced credit managers, such as CCIF's Advisors - Guggenheim Partners, LLC ("Guggenheim") and W. P. Carey ("WPC"), the opportunity to invest in new assets with attractive yields while remaining in senior positions of companies' capital structures. Given that CCIF commenced its capital raising efforts in the midst of this evolving credit cycle, we believe CCIF has a significant competitive advantage compared to investors who have large legacy portfolios.
2
Investment Activity, Investment Performance, and Portfolio Update
Pursuant to the opportunity we saw in the market, during the three month period ended September 30, 2016, 81.1% of investment activity was concentrated in 18 debt investments sourced through our direct origination channel, with the remainder of investment activity in primary issuance investments (14.6%) and syndicated investments (4.3%). The prior quarter saw investment activity concentrated in debt investments sourced through primary issuance channels (72.4%).
Portfolio highlights and investment activity for the three and nine months ended September 30, 2016 are set forth below ($ in thousands):
Three Months Ended September 30, 2016 | Nine Months Ended September 30, 2016 | ||||||
Total Fair Value of Investments | $ | 220,493 | $ | 220,493 | |||
Gross Portfolio Yield | 7.9 | % | 7.9 | % | |||
Investment activity segmented by access channel: | |||||||
Direct origination | $ | 87,214 | $ | 87,214 | |||
Primary issuance | 15,770 | 77,239 | |||||
Secondary market transactions | 4,603 | 31,161 | |||||
Total investment activity | 107,587 | 195,614 | |||||
Investments sold or repaid | (36,050 | ) | (59,642 | ) | |||
Net investment activity | $ | 71,537 | $ | 135,972 | |||
Portfolio companies at beginning of period | 52 | 32 | |||||
Number of added portfolio companies | 14 | 43 | |||||
Number of exited portfolio companies | (14 | ) | (23 | ) | |||
Portfolio companies at period end | 52 | 52 | |||||
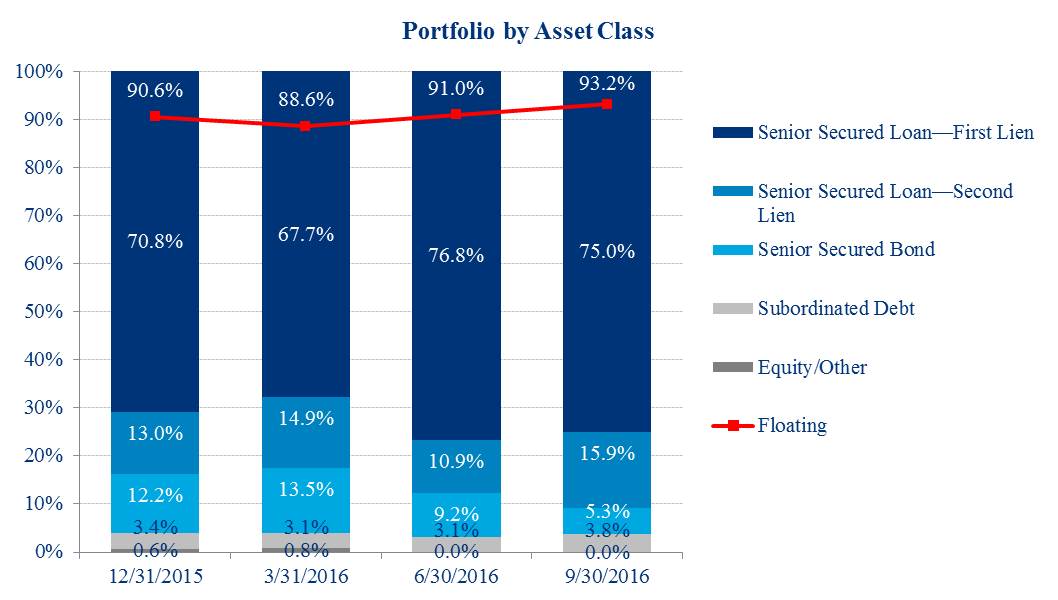
As of September 30, 2016, the portfolio consisted of $220.5 million of total investments at fair value and, consistent with prior quarters, our debt portfolio remains predominately invested in senior secured debt investments which represented 96.2% of the portfolio at fair value. We believe senior secured debt investments provide for downside protection which is particularly important given today's credit environment. Set forth below is the composition of the portfolio by asset class for each quarter end based on fair value:
3
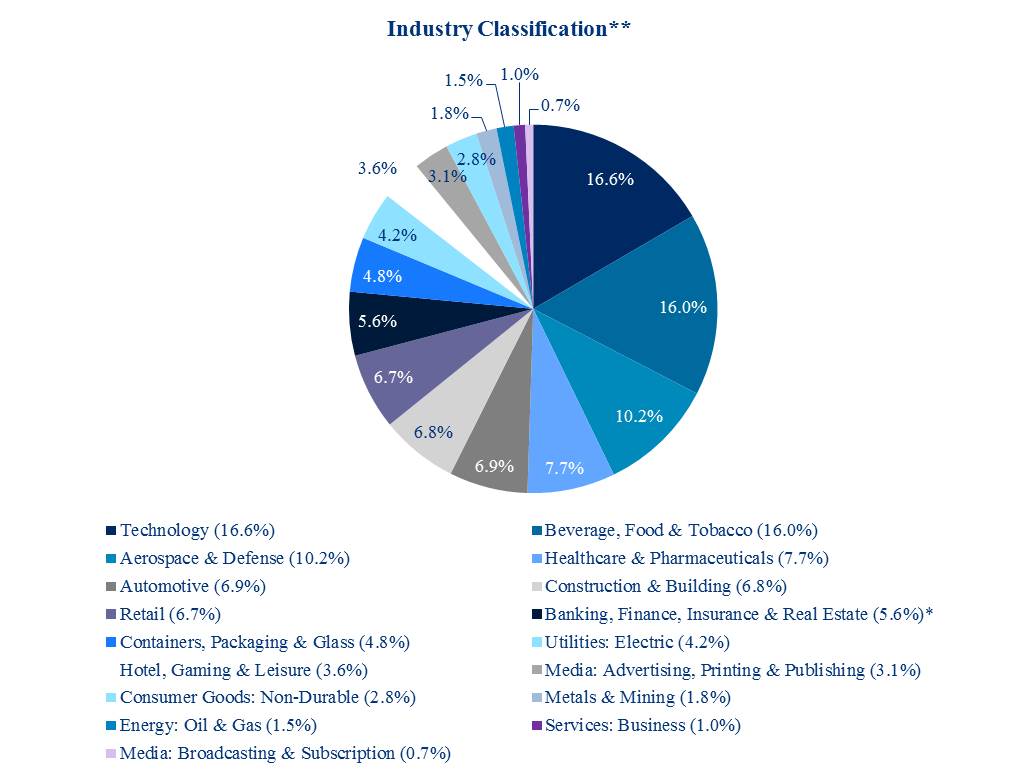
As of September 30, 2016, there were 52 portfolio companies in which CCIF held 67 debt investments and one attached equity investment. The weighted average portfolio company age, based on fair value, was 32 years as of September 30, 2016. Furthermore, and aligned with our strategy of mitigating industry specific risk, the companies comprising the CCIF portfolio were diversified across 17 industries. Set forth below are the industry concentrations in CCIF's portfolio as of September 30, 2016 by fair value:
________________________
(*) Some portfolio companies in this category represent insurance brokers and are not classified as insurance companies.
(**) Industry classifications based upon Moody's standard industry classifications.
4
During the third quarter of 2016, we made $107.6 million in new commitments, including commitments to 14 new portfolio companies. Over the quarter, we found it less attractive to source debt investments in the primary issuance channel and syndicated market channel as we saw those markets become more competitive, driving yields down and allowing new deals to be loosely structured. With fewer attractive opportunities in the syndicated market, we shifted our investment focus to directly originated investments, where we found what we believe are attractive yields that allowed us to largely remain in senior positions of companies' capital structures. This is evidenced by our investment activity during the quarter, in which, 96.4% of commitments were to senior secured assets.
Investment activity by quarter and by asset class as of each of the last four quarters was as follows:
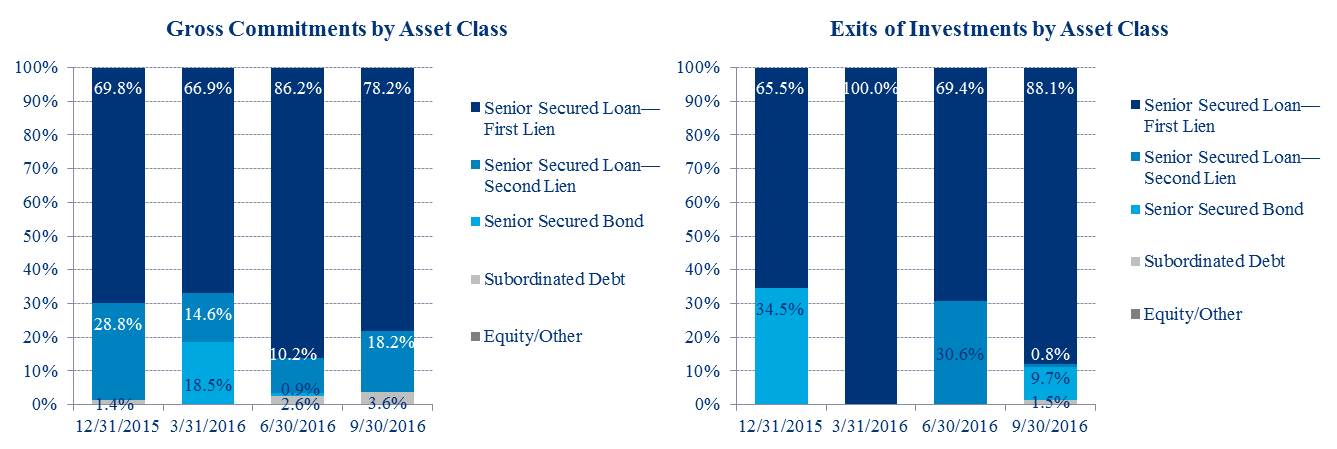
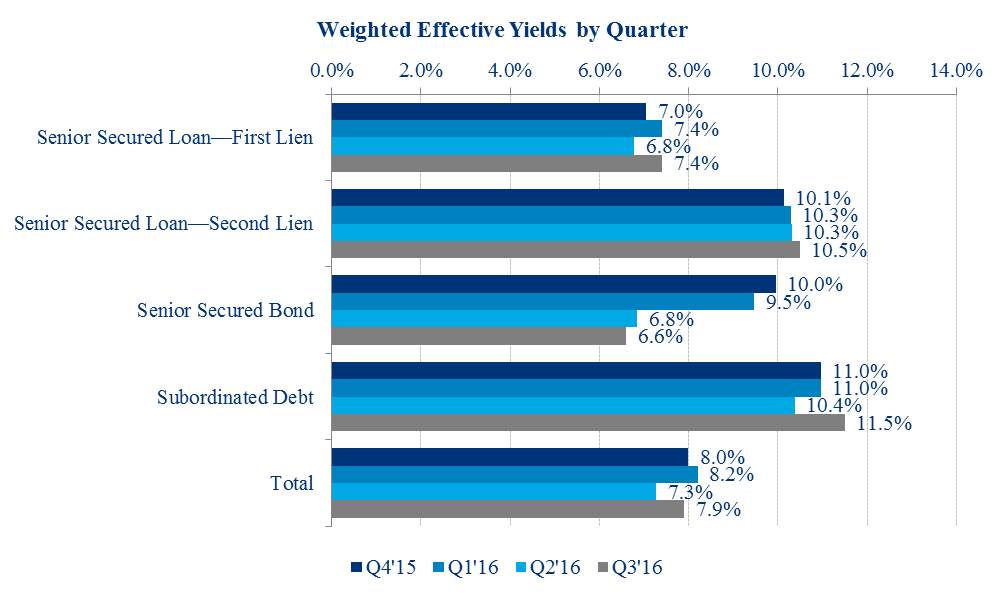
With the lack of buying opportunity in the secondary market, we continued to sell select lower yielding assets at atrractive prices and deploy that capital into directly originated transactions. CCIF's gross portfolio yield was 7.9% as of September 30, 2016 compared to 7.3% as of June 30, 2016.
Set forth below are the weighted average effective yields, by investment type, as of each of the prior four quarters:
5
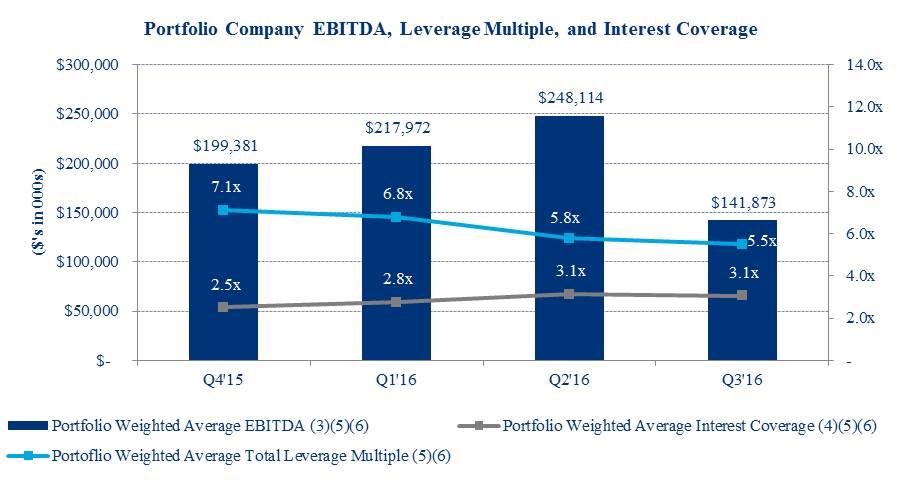
Set forth below are the weighted average EBITDA, weighted average total leverage multiple, and weighted average interest rate coverage of CCIF's portfolio companies. The quarter-over-quarter decline in portfolio weighted average EBITDA was primarily due to the move to directly originated transactions. The 12 new portfolio companies associated with direct originations had a weighted average EBITDA of $57.7 million and the 14 portfolio companies that were sold during the quarter had a weighted average EBITDA of $371.4 million.
________________________
(3) | Weighted average EBITDA amounts are weighted based on the amortized cost of the portfolio company investments. EBITDA amounts are estimated from the most recent portfolio company financial statements, have not been independently verified by CCIF or its Advisors, and may reflect a normalized or adjusted amount. Accordingly, neither CCIF nor its Advisors makes any representation or warranty in respect of this information. |
(4) | Weighted average interest coverage represents the portfolio company’s EBITDA as a multiple of interest expense. Portfolio company credit statistics are derived from the most recently available portfolio company financial statements, have not been independently verified by CCIF or its Advisors, and may reflect a normalized or adjusted amount. Accordingly, neither CCIF nor its Advisors makes any representation or warranty in respect of this information. |
(5) | Portfolio weighted average EBITDA, weighted average total leverage multiple, and weighted average interest coverage ratio data includes information solely in respect of portfolio companies in which CCIF has a debt investment. |
(6) | EBITDA is a non-GAAP financial measure. For a particular portfolio company, EBITDA is generally defined as net income before net interest expense, income tax expense, depreciation and amortization. EBITDA amounts are estimated from the most recent portfolio company's financial statements, have not been independently verified by CCIF or its Advisors, and may reflect a normalized or adjusted amount. Accordingly, neither CCIF nor its Advisors makes any representation or warranty in respect of this information. |
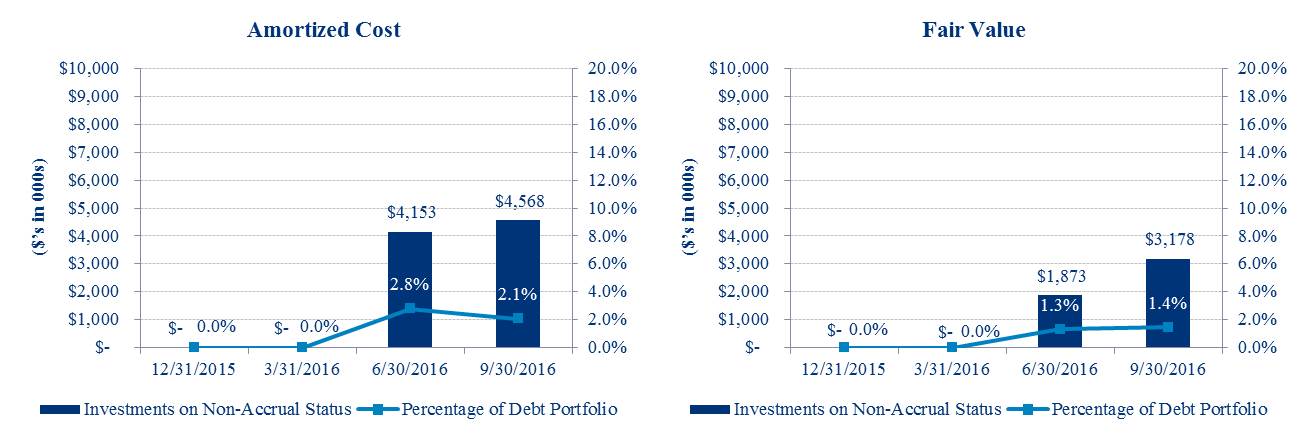
As of September 30, 2016 we had three debt investments on non-accrual status associated with three portfolio companies, two of which are in the Energy: Oil and Gas industry and one of which is in the Metals & Mining industry. In May of 2016, two of the portfolio companies voluntarily filed petitions to reorganize under Chapter 11 of the U.S. Bankruptcy Code. Investments on non-accrual status represented 1.4% and 2.1% of total investments on a fair value and amortized cost basis, respectively. We are actively monitoring these situations and continuously evaluating our positions. Given today's environment, we believe it is prudent to continue limiting the exposure to these sectors, and we expect that as we raise and deploy capital the current exposure will continue to decline as a percentage of the total portfolio.
6
The following charts show debt investments on non-accrual status based on their amortized cost and fair value as of September 30, 2016.
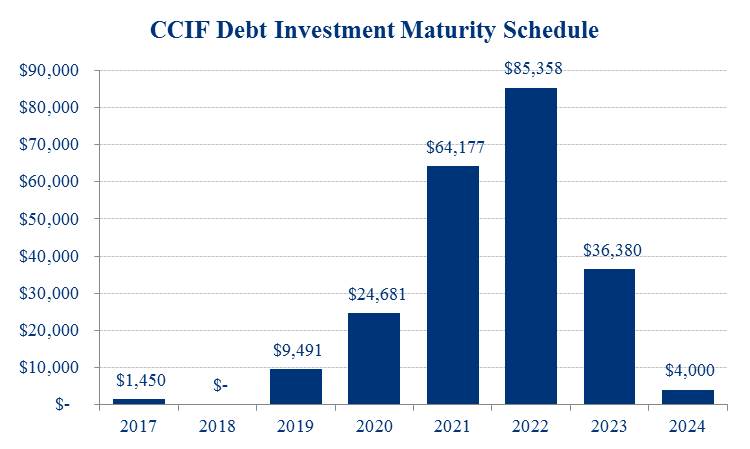
The following chart shows the maturity schedule of CCIF's debt investments, excluding unfunded commitments, based on their principal amount as of September 30, 2016.
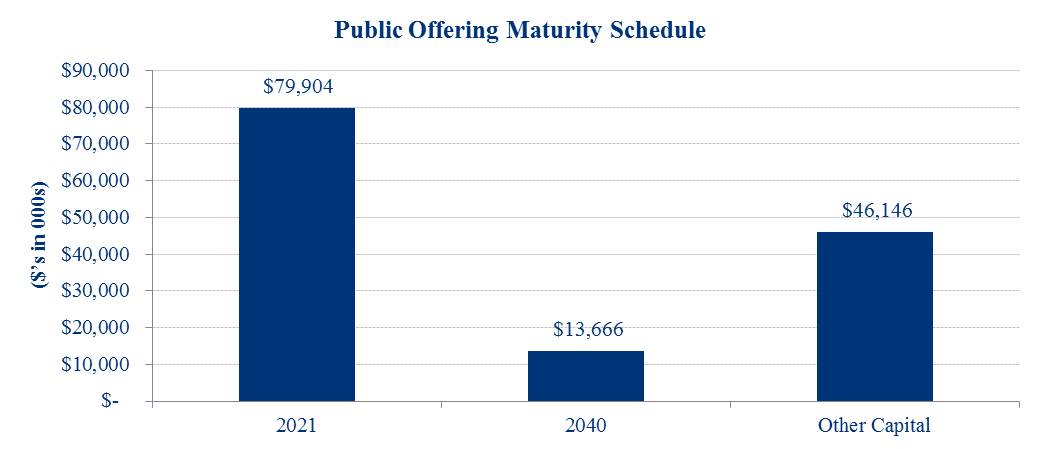
CCIF's publicly offered feeder funds, CCIF 2016 T and CCIF - I, which have committed to seek liquidity events on or before December 31, 2021 and December 31, 2040, respectively, collectively represented 67.0% of CCIF's total ownership as of September 30, 2016. The following chart shows the liquidity schedule of CCIF's publicly offered feeder funds as of September 30, 2016 based on the net assets of CCIF.
7
About Carey Credit Income Fund
CCIF is a non-traded business development company (BDC) that invests primarily in large, privately negotiated loans to private middle market U.S. companies. CCIF is the master fund which pools investor capital raised through its feeder fund offerings, such as the current offering CCIF - I. CCIF is managed by affiliates of WPC and Guggenheim and is designed to provide investors with current income, capital preservation, and, to a lesser extent, capital appreciation. CCIF and CCIF - I share the same investment objectives and strategies, and all portfolio investments are made by CCIF, the master fund.
About W. P. Carey Inc.
Founded in 1973, WPC is a publicly-traded real estate investment trust (NYSE: WPC) that provides long-term sale-leaseback and build-to-suit financing for companies worldwide. WPC has expertise in credit and real estate underwriting, with more than 35 years of experience in evaluating credit and real estate investment opportunities. A capital provider to growing U.S. companies since its inception, WPC had an enterprise value of approximately $11.0 billion at September 30, 2016. In addition to its owned portfolio of diversified global real estate, WPC manages a series of non-traded publicly registered investment programs with assets under management of approximately $12.2 billion. WPC is subject to the information and reporting requirements of the Exchange Act. As a result, it files periodic reports and financial statements with the SEC, copies of which are available on the SEC's website at www.sec.gov.
For four decades, WPC has provided companies around the globe with capital to expand their businesses, make acquisitions, invest in research and development, or fund other corporate initiatives. Its corporate finance-focused credit and underwriting process is a constant that has been leveraged across a wide variety of companies and industries. WPC's investment process has largely focused on identifying companies with stable and improving credit profiles using a top-down and bottom-up approach, without relying on outside rating agencies. Credit-quality characteristics, capital structure, operating history, margin and ratio analysis, industry market share, and management team are all key considerations in evaluating and determining investment suitability of potential credits.
About Guggenheim Partners, LLC
Guggenheim Investments represents the investment management businesses of Guggenheim Partners and includes Guggenheim, an SEC-registered investment adviser. Guggenheim Partners is a privately-held, global financial services firm with over 2,500 employees and more than $250 billion in assets under management as of September 30, 2016. It produces customized solutions for its clients, which include institutions, governments and agencies, corporations, insurance companies, investment advisors, family offices, and individual investors.
Guggenheim Investments manages $204 billion in assets across fixed income, equity, and alternatives as of September 30, 2016. Its 275+ investment professionals perform research to understand market trends and identify undervalued opportunities in areas that are often complex and underfollowed. This approach to investment management has enabled Guggenheim to deliver long-term results to its clients.
Within Guggenheim Investments is the Guggenheim Corporate Credit Team, which is responsible for all corporate credit strategies and asset management of $69.4 billion. A unified credit platform is utilized for all strategies and is organized by industry as opposed to asset class, which increases its ability to uncover relative value opportunities and to identify and source opportunities. The scale of the platform, combined with the expertise across a wide range of industries and in-house legal resources, allows Guggenheim to be a solution provider to the market and maintain an active pipeline of investment opportunities.
Cautionary Statement Concerning Forward-Looking Statements
This document contains forward-looking statements within the meaning of the Federal securities laws. These statements are not guarantees of future performance and are subject to risks, uncertainties and other factors, some of which are beyond our control, are difficult to predict and could cause actual results to differ materially from those expressed or forecasted in the forward-looking statements. CCIF and CCIF - I undertake no obligation to update any forward-looking statements contained herein to conform the statements to actual results or changes in their expectations. A number of factors may cause CCIF’s and CCIF - I's actual results, performance or achievement to differ materially from those anticipated. For further information on factors that could impact CCIF and CCIF - I performance, please review CCIF’s and CCIF - I's respective filings at the SEC website at www.sec.gov.
8