Attached files
| file | filename |
|---|---|
| EX-99.1 - EXHIBIT 99.1 - BEACON ROOFING SUPPLY INC | v453496_ex99-1.htm |
| 8-K - FORM 8-K - BEACON ROOFING SUPPLY INC | v453496_8-k.htm |
Exhibit 99.2

Fourth Quarter & Fiscal Year 2016 Earnings Call November 21, 2016 www.BeaconRoofingSupply.com Fourth Quarter & Fiscal Year 2016 Earnings Call November 21 , 2016

Fourth Quarter & Fiscal Year 2016 Earnings Call November 21, 2016 www.BeaconRoofingSupply.com Highlights □ Record fourth quarter net sales of $1.17 billion, 49.1% above the prior year □ First year in Company history with $4 billion in annual net sales □ Fourth quarter organic net sales growth of 2.4% in existing markets □ Fourth quarter gross margin improvement of 140 basis points to 25.7% of net sales □ Fourth quarter EPS of $0.78 ($0.88 Adjusted) vs. $0.61 ($0.75 Adjusted) in the prior year □ Fourth quarter net income grew to $47.4 million vs. $30.8 million in the prior year □ Fourth quarter Adjusted EBITDA of $127.5 million, 10.9% of sales □ Beat RSG synergy realization target of $30 million by over 30% □ Completed 8 acquisitions in fiscal year 2016 1
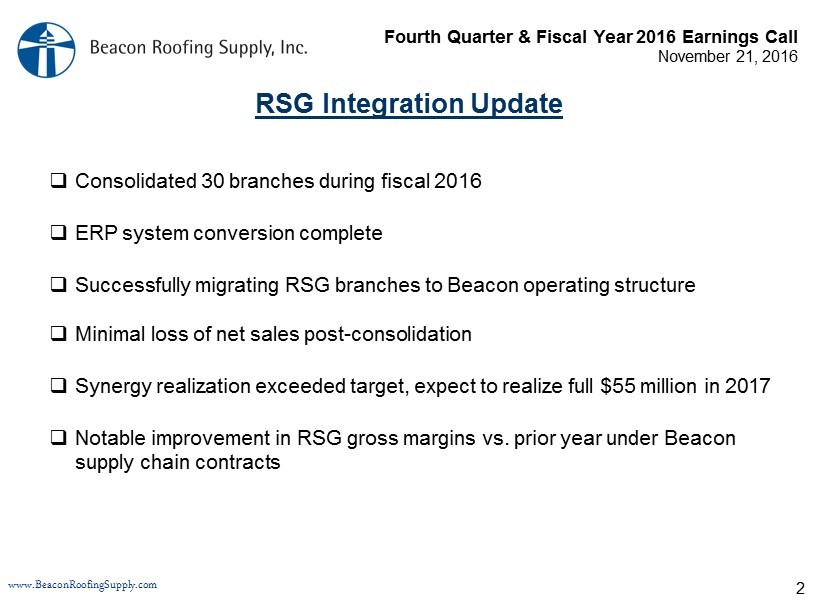
Fourth Quarter & Fiscal Year 2016 Earnings Call November 21, 2016 www.BeaconRoofingSupply.com 19.8% of Sales RSG Integration Update □ Consolidated 30 branches during fiscal 2016 □ ERP system conversion complete □ Successfully migrating RSG branches to Beacon operating structure □ Minimal loss of net sales post - consolidation □ Synergy realization exceeded target, expect to realize full $55 million in 2017 □ Notable improvement in RSG gross margins vs. prior year under Beacon supply chain contracts 2

Fourth Quarter & Fiscal Year 2016 Earnings Call November 21, 2016 www.BeaconRoofingSupply.com 0% 20% 40% 60% 80% 100% FY 2016 FY 2015 15.6% 16.1% 31.7% 34.4% 52.7% 49.5% Residential Roofing Non-Residential Roofing Complementary $- $100 $200 $300 $400 $500 $600 $700 $800 FY 2016 FY 2015 $747.2 $729.6 $189.6 $177.8 Sales Gross Profit / Margin Quarterly Results Existing Market Product Mix Northeast (8.6%) Mid-Atlantic 1.8% Southeast 6.8% Southwest 25.4% Midwest 5.2% West (9.1%) Canada (5.2%) Total 2.4% Existing Market Sales Growth (Decline) $ in millions 24.4% Existing Market Sales, Gross Profit & Gross Margin 25.4% Existing Market results above exclude growth from acquired branches until they have been under ownership for at least four full fiscal quarters at the start of the fiscal reporting period. 3

Fourth Quarter & Fiscal Year 2016 Earnings Call November 21, 2016 www.BeaconRoofingSupply.com $- $20 $40 $60 $80 $100 $120 $140 FY 2016 FY 2015 $120.4 $115.3 $ in millions 16.1% of Sales 15.8% of Sales Existing Market Operating Expenses Quarterly Results Existing Market results above exclude growth from acquired branches until they have been under ownership for at least four full fiscal quarters at the start of the fiscal reporting period. Payroll, employee benefits, stock comp 7.2$ Greenfields 0.1 Amortization & depreciation 0.1 Bad debt expense (0.8) Selling expense & other (1.5) Total 5.1$ Operating Expense Increase (Decrease) 4
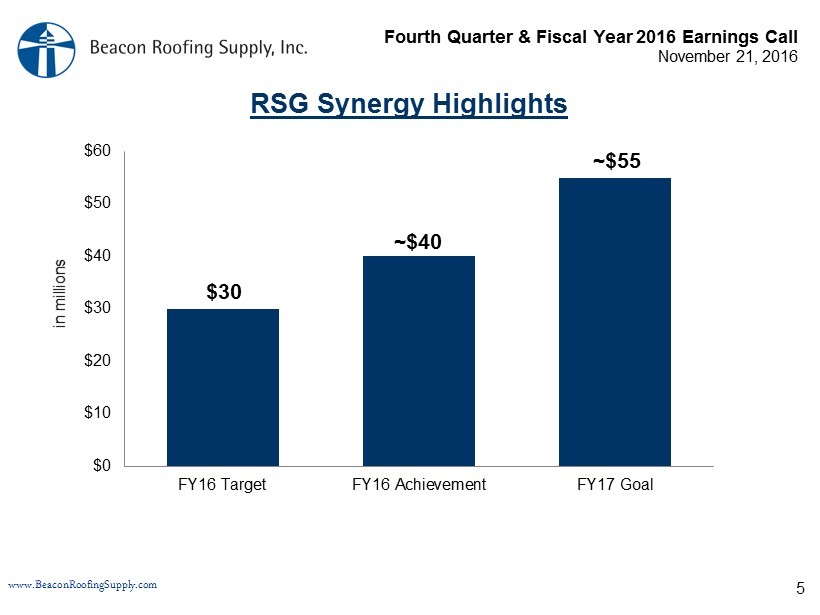
Fourth Quarter & Fiscal Year 2016 Earnings Call November 21, 2016 www.BeaconRoofingSupply.com 19.8% of Sales RSG Synergy Highlights $30 $0 $10 $20 $30 $40 $50 $60 FY16 Target FY16 Achievement FY17 Goal in millions 5 ~$40 ~$55

Fourth Quarter & Fiscal Year 2016 Earnings Call November 21, 2016 www.BeaconRoofingSupply.com (In millions) Q4 2016 YTD 2016 P&L Line Item Integration Costs $1.5 $22.7 Misc. SG&A $1.5 $18.4 Op Ex Stock Comp. Expense $0.0 $4.3 Op Ex Transaction Costs $2.1 $14.0 Misc. SG&A $0.0 $5.6 Op Ex Interest Expense $2.1 $7.6 Other (income) / expense (Gain) / Loss on Assets $0.0 $0.8 Op Ex Incremental Amortization $5.7 $22.8 Op Ex Total $9.3 $59.5 Acquisition costs reflected on a pre - tax basis RSG and Other Fiscal 2016 Acquisition Costs 6

Fourth Quarter & Fiscal Year 2016 Earnings Call November 21, 2016 www.BeaconRoofingSupply.com 1 Full Year EPS assumes diluted shares of 60.4 million Amortization Impact on Net Income and EPS 7 All Incremental Included Excluded Legacy Beacon ($14) ($14) Legacy RSG ($26) ($26) Q1 & Q3 Beacon Acquisitions ($5) ($5) Incremental RSG ($23) ----- FY16 Net Income Impact ($41) ($27) EPS Impact 1 ($0.68) ($0.45) 2016 ($ in millions)

Fourth Quarter & Fiscal Year 2016 Earnings Call November 21, 2016 www.BeaconRoofingSupply.com $- $20 $40 $60 $80 $100 $120 $140 FY 2015 FY 2016 $120.6 $109.3 in millions Cash Flow From Operations YTD Results CF from Ops $30.7 $47.0 Non - Cash & WC Adj. $89.9 $62.3 Net Income FY 2016 FY 2015 8
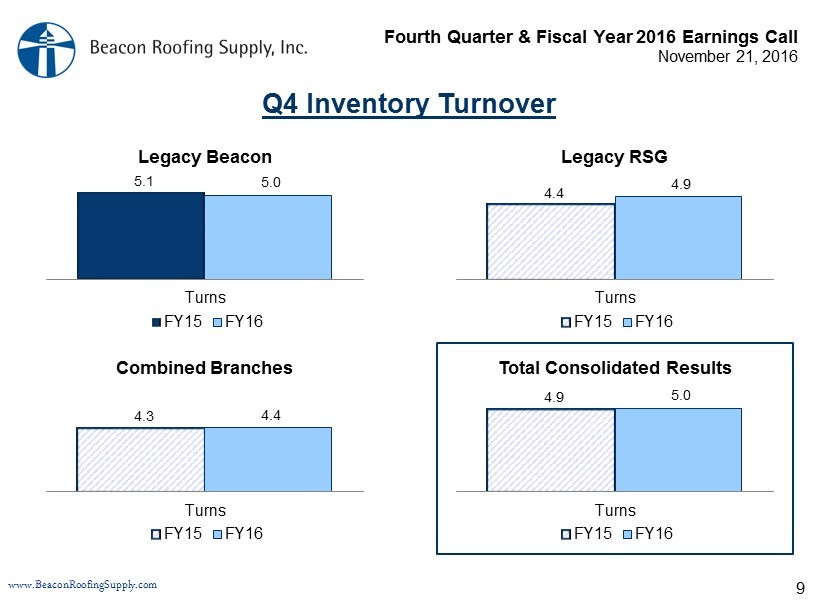
Fourth Quarter & Fiscal Year 2016 Earnings Call November 21, 2016 www.BeaconRoofingSupply.com Q4 Inventory Turnover Legacy Beacon 4.4 4.9 Turns FY15 FY16 4.3 4.4 Turns FY15 FY16 Legacy RSG Combined Branches 9 Total Consolidated Results 4.9 5.0 Turns FY15 FY16 5.1 5.0 Turns FY15 FY16
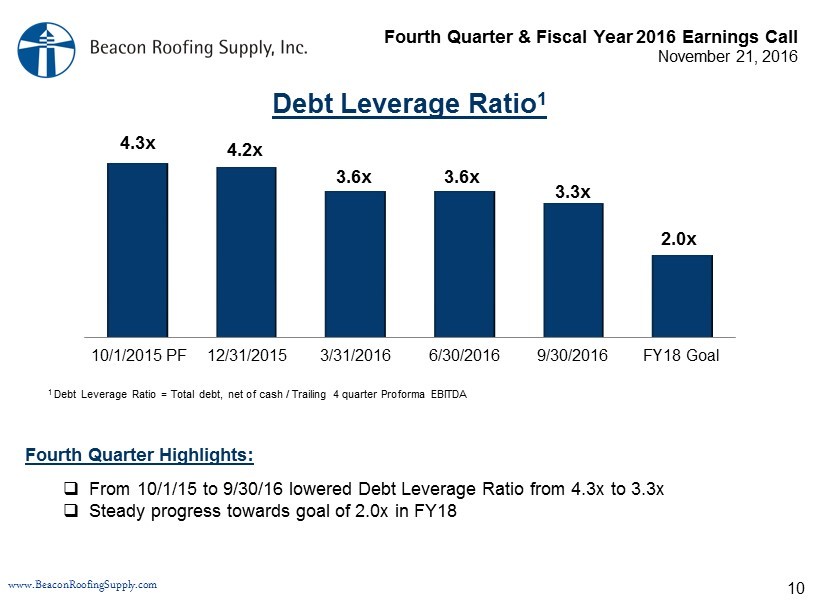
Fourth Quarter & Fiscal Year 2016 Earnings Call November 21, 2016 www.BeaconRoofingSupply.com 19.8% of Sales Debt Leverage Ratio 1 4.3x 4.2x 3.6x 3.6x 3.3x 2.0x 10/1/2015 PF 12/31/2015 3/31/2016 6/30/2016 9/30/2016 FY18 Goal 1 Debt Leverage Ratio = Total debt, net of cash / Trailing 4 quarter Proforma EBITDA □ From 10/1/15 to 9/30/16 lowered Debt Leverage Ratio from 4.3x to 3.3x □ Steady progress towards goal of 2.0x in FY18 10 Fourth Quarter Highlights:
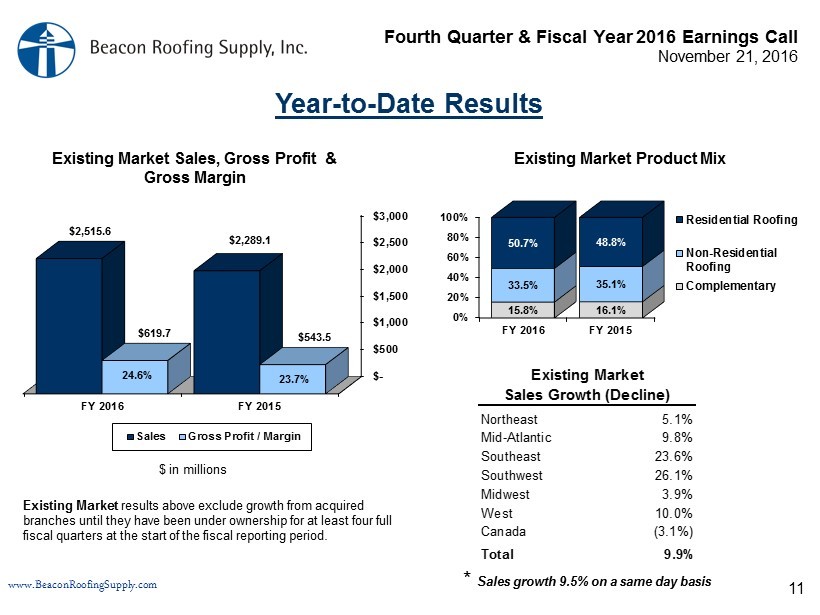
Fourth Quarter & Fiscal Year 2016 Earnings Call November 21, 2016 www.BeaconRoofingSupply.com 0% 20% 40% 60% 80% 100% FY 2016 FY 2015 15.8% 16.1% 33.5% 35.1% 50.7% 48.8% Residential Roofing Non-Residential Roofing Complementary $- $500 $1,000 $1,500 $2,000 $2,500 $3,000 FY 2016 FY 2015 $2,515.6 $2,289.1 $619.7 $543.5 Sales Gross Profit / Margin Year - to - Date Results Existing Market Product Mix Northeast 5.1% Mid-Atlantic 9.8% Southeast 23.6% Southwest 26.1% Midwest 3.9% West 10.0% Canada (3.1%) Total 9.9% Existing Market Sales Growth (Decline) $ in millions 23.7% Existing Market Sales, Gross Profit & Gross Margin 24.6% Existing Market results above exclude growth from acquired branches until they have been under ownership for at least four full fiscal quarters at the start of the fiscal reporting period. 11 * Sales growth 9.5% on a same day basis
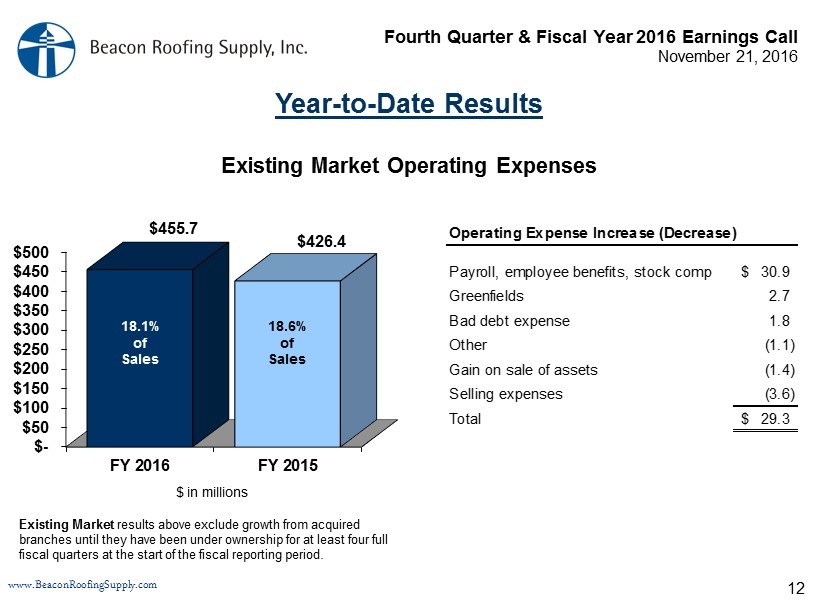
Fourth Quarter & Fiscal Year 2016 Earnings Call November 21, 2016 www.BeaconRoofingSupply.com $- $50 $100 $150 $200 $250 $300 $350 $400 $450 $500 FY 2016 FY 2015 $455.7 $426.4 $ in millions 18.1% of Sales 18.6% of Sales Existing Market Operating Expenses Year - to - Date Results Existing Market results above exclude growth from acquired branches until they have been under ownership for at least four full fiscal quarters at the start of the fiscal reporting period. Payroll, employee benefits, stock comp 30.9$ Greenfields 2.7 Bad debt expense 1.8 Other (1.1) Gain on sale of assets (1.4) Selling expenses (3.6) Total 29.3$ Operating Expense Increase (Decrease) 12

Fourth Quarter & Fiscal Year 2016 Earnings Call November 21, 2016 www.BeaconRoofingSupply.com 19.8% of Sales Reconciliation: Adjusted Net Income/Adjusted EPS 13 Adjusted Net Income is defined as net income excluding non - recurring costs related to the acquisitions incurred in fiscal years 2015 and 2016 as well as the incremental amortization of acquired intangibles. We believe that Adjusted Net Income is an operating performance metric that is useful to investors because it permits investors to better understand year - over - year changes in underlying operating performance. Adjusted net income per share or “Adjusted EPS” is calculated by dividing the Adjusted Net Income for the period by the weighted - average diluted shares outstanding for the period. Non - GAAP Adjustments are comprised entirely of non - recurring costs related to the RSG acquisition and the other acquisitions made in fisc al year 2016 - See "RSG and Other Acquisition Costs" slide for further detail. While we believe Adjusted Net Income and Adjusted EPS are useful measures for investors, these are not measurements presented in accordance with United States generally accepted accounting principles (“GAAP”). You should not consider Adjusted Net Income or Adjusted EPS in isolation or as a substitute for net income and net los s per share or diluted earnings per share calculated in accordance with GAAP. Reconciliation of Net Income to Adjusted Net Income: (In millions) Actual Non-GAAP Adjustments Actual (Adjusted) Actual Non-GAAP Adjustments Actual (Adjusted) Net sales 1,174.3$ -$ 1,174.3$ 4,127.1$ -$ 4,127.1$ Cost of products sold 872.3 - 872.3 3,114.0 - 3,114.0 Gross profit 302.0 - 302.0 1,013.1 - 1,013.1 Operating expense 206.2 (7.2) 199.0 808.1 (51.9) 756.2 Income from operations 95.8 7.2 103.0 205.0 51.9 256.9 Interest expense, financing costs and other 16.9 (2.1) 14.8 58.5 (7.6) 50.9 Income before provision for income taxes 78.9 9.3 88.2 146.5 59.5 206.0 Provision for income taxes 31.5 3.1 34.6 56.6 22.9 79.5 Net Income 47.4$ 6.2$ 53.6$ 89.9$ 36.6$ 126.5$ Reconciliation of EPS to Adjusted EPS: EPS 0.78$ 1.49$ Non-GAAP Adjustments per share impact 0.10 0.61 Adjusted EPS 0.88$ 2.10$ Three Months Ended September 30, 2016 Year Ended September 30, 2016

Fourth Quarter & Fiscal Year 2016 Earnings Call November 21, 2016 www.BeaconRoofingSupply.com 19.8% of Sales Reconciliation: Adjusted EBITDA 14 Adjusted EBITDA is defined as net income plus interest expense (net of interest income), income taxes, depreciation and amortization, adj ustments to contingent consideration, stock - based compensation and RSG acquisition costs incurred in fiscal years 2015 and 2016 and other fiscal year 2016 non - recurring acquisitions costs. We believe that Adjusted EBITDA is an operating performance measure that provides investors and analysts with a measure of operating results unaffected by differences in capital structures, capital investment cycles, and age s of related assets among otherwise comparable companies. Acquisition costs reflect all non - recurring charges related to acquisitions completed (excluding the impact of tax) that are not embedded in other balances of the table. Certain portions of the total acquisition costs incurred are included in interest expense, income taxes, depreciation and amortization, and stock - based compensation . While we believe Adjusted EBITDA is a useful measure for investors, it is not a measurement presented in accordance GAAP. You sh ould not consider Adjusted EBITDA in isolation or as a substitute for net income, cash flows from operations, or any other items calculated in accordance with GAAP. In addition, Adjusted EBITDA has inherent mat erial limitations as a performance measure. It does not include interest expense, because we have borrowed money, interest expense is a necessary element of our costs. In addition, Adjusted EBITDA does not i ncl ude depreciation and amortization expense. Because we have capital and intangible assets, depreciation and amortization expense is a necessary element of our costs. Adjusted EBITDA also does not i ncl ude stock - based compensation, which is a necessary element of our costs since we make stock awards to key members of management as an important incentive to maximize overall company performance and as a ben efi t. Moreover, Adjusted EBITDA does not include taxes, and payment of taxes is a necessary element of our operations. Accordingly, since Adjusted EBITDA excludes these items, it has material limitation s a s a performance measure. We separately monitor capital expenditures, which impact depreciation expense, as well as amortization expense, interest expense, and income tax expense. Because not all companies us e i dentical calculations, our presentation of Adjusted EBITDA may not be comparable to other similarly titled measures of other companies . Reconciliation of Net Income to Adjusted EBITDA: (In millions) 2016 2015 2016 2015 Net Income 47.4$ 30.8$ 89.9$ 62$ Acquisition costs 1.4 7.0 24.8 7.0 Interest expense, net 16.3 2.8 58.1 10.6 Income taxes 31.5 25.6 56.6 44.0 Depreciation and amortization 27.2 8.9 100.2 34.9 Stock-based compensation 3.7 2.6 17.7 9.9 Adjusted EBITDA 127.5$ 77.7$ 347.3$ 168.7$ Adjusted EBITDA as a % of net sales 10.9% 9.9% 8.4% 6.7% Three Months Ended September 30, Year Ended September 30,

Fourth Quarter & Fiscal Year 2016 Earnings Call November 21, 2016 www.BeaconRoofingSupply.com 19.8% of Sales Reconciliation: Debt Leverage Ratio 15 Reconciliation of Debt Leverage Ratio: (In millions) Gross total debt as of September 30, 2016 1,162.9$ Cash and cash equivalents as of September 30, 2016 (31.4) Net debt as of September 30, 2016 1,131.5$ Adjusted EBITDA for the twelve months ended September 30, 2016 347.3$ Debt leverage ratio as of September 30, 2016 3.3