Attached files
| file | filename |
|---|---|
| EX-23.2.3 - EX-23.2.3 - Athene Holding Ltd | d170639dex2323.htm |
| EX-23.2.2 - EX-23.2.2 - Athene Holding Ltd | d170639dex2322.htm |
| EX-23.2.1 - EX-23.2.1 - Athene Holding Ltd | d170639dex2321.htm |
| EX-16.1 - EX-16.1 - Athene Holding Ltd | d170639dex161.htm |
| EX-8.1 - EX-8.1 - Athene Holding Ltd | d170639dex81.htm |
| EX-5.1 - EX-5.1 - Athene Holding Ltd | d170639dex51.htm |
| EX-3.3 - EX-3.3 - Athene Holding Ltd | d170639dex33.htm |
Table of Contents
As filed with the Securities and Exchange Commission on November 21, 2016
Registration No. 333-211243
UNITED STATES
SECURITIES AND EXCHANGE COMMISSION
Washington, D.C. 20549
Amendment No. 5
to
FORM S-1
REGISTRATION STATEMENT
UNDER
THE SECURITIES ACT OF 1933
ATHENE HOLDING LTD.
(Exact name of registrant as specified in its charter)
| Bermuda | 6311 | 98-0630022 | ||
| (State or other jurisdiction of incorporation or organization) |
(Primary Standard Industrial Classification Code Number) |
(I.R.S. Employer Identification Number) |
96 Pitts Bay Road
Pembroke, HM08, Bermuda
(441) 279-8400
(Address, including zip code, and telephone number, including area code, of registrant’s principal executive offices)
CT Corporation System
111 Eighth Avenue
New York, New York 10011
(212) 894-8940
(Name, address and telephone number, including area code, of agent for service)
Copies to:
| Perry J. Shwachman Samir A. Gandhi Sidley Austin LLP One South Dearborn Chicago, Illinois 60603 Telephone: (312) 853-7000 Telecopy: (312) 853-7036 |
Harvey M. Eisenberg Weil, Gotshal & Manges LLP 767 Fifth Avenue New York, New York 10153 Telephone: (212) 310-8000 Telecopy: (212) 310-8007 |
Daniel J. Bursky Mark Hayek Fried, Frank, Harris, Shriver & Jacobson LLP One New York Plaza New York, New York 10004 Telephone: (212) 859-8000 Telecopy: (212) 859-4000 |
Charles G.R. Collis Conyers Dill & Pearman Clarendon House, 2 Church Street, PO Box HM 666 Hamilton, HM CX Bermuda Telephone: (441) 295-1422 Telecopy: (441) 292-4720 |
Approximate date of commencement of proposed sale to the public: As soon as practicable after the effective date of this Registration Statement.
If any of the securities being registered on this Form are to be offered on a delayed or continuous basis pursuant to Rule 415 under the Securities Act of 1933 check the following box. ¨
Table of Contents
If this Form is filed to register additional securities for an offering pursuant to Rule 462(b) under the Securities Act, please check the following box and list the Securities Act registration statement number of the earlier effective registration statement for the same offering. ¨
If this Form is a post-effective amendment filed pursuant to Rule 462(c) under the Securities Act, check the following box and list the Securities Act registration statement number of the earlier effective registration statement for the same offering. ¨
If this Form is a post-effective amendment filed pursuant to Rule 462(d) under the Securities Act, check the following box and list the Securities Act registration statement number of the earlier effective registration statement for the same offering. ¨
Indicate by check mark whether the registrant is a large accelerated filer, an accelerated filer, a non-accelerated filer, or a smaller reporting company. See the definition of “large accelerated filer,” “accelerated filer” and “smaller reporting company” in Rule 12b-2 of the Exchange Act.
| Large accelerated filer | ¨ | Accelerated filer | ¨ | |||
| Non-accelerated filer | x (Do not check if a smaller reporting company) | Smaller reporting company | ¨ |
The Registrant hereby amends this Registration Statement on such date or dates as may be necessary to delay its effective date until the Registrant shall file a further amendment which specifically states that this Registration Statement shall thereafter become effective in accordance with Section 8(a) of the Securities Act of 1933, as amended, or until the Registration Statement shall become effective on such date as the Securities and Exchange Commission, acting pursuant to said Section 8(a), may determine.
Table of Contents
The information in this preliminary prospectus is not complete and may be changed. We and the selling shareholders may not sell these securities until the registration statement filed with the Securities and Exchange Commission is effective. This preliminary prospectus is not an offer to sell these securities and is not soliciting an offer to buy these securities in any state or other jurisdiction where the offer or sale is not permitted.
Subject to Completion. Dated November 21, 2016.
SHARES

Athene Holding Ltd.
Class A Common Shares
This is the initial public offering of Class A common shares of Athene Holding Ltd.
The selling shareholders identified in this prospectus are selling Class A common shares. We will not receive any proceeds from the sale of the Class A common shares.
Prior to this offering, there has been no public market for the Class A common shares. We expect the initial public offering price to be between $ and $ per Class A common share. We intend to apply to list our Class A common shares on the New York Stock Exchange under the symbol “ATH.”
Investing in our Class A common shares involves risks. See “Risk Factors” beginning on page 27 of this prospectus.
Neither the Securities and Exchange Commission nor any state securities commission has approved or disapproved of these securities or determined if this prospectus is truthful or complete. Any representation to the contrary is a criminal offense.
| Per Share |
Total | |||||||
| Public offering price |
$ | $ | ||||||
| Underwriting discount(1) |
$ | $ | ||||||
| Proceeds, before expenses, to the selling shareholders |
$ | $ | ||||||
| (1) | See “Underwriting” for a detailed description of compensation payable to the underwriters. |
We currently have two classes of voting shares outstanding, Class A common shares and Class B common shares. Each such Class A common share and Class B common share is economically equivalent to each other – the dollar value of one Class A common share is equal to the dollar value of one Class B common share. However, Class A common shares and Class B common shares differ in terms of voting power. The Class A common shares currently account for 55% of our aggregate voting power and the Class B common shares currently account for the remaining 45% of our aggregate voting power. See “Description of Share Capital—Common Shares.”
The selling shareholders have granted the underwriters an option to purchase, within 30 days of the date of this prospectus, up to additional Class A common shares from the selling shareholders, at the public offering price, less the underwriting discount.
The Class A common shares will be ready for delivery on or about , 2016.
| Goldman, Sachs & Co. | Barclays |
Citigroup |
Wells Fargo Securities |
| BofA Merrill Lynch | BMO Capital Markets | Credit Suisse | Deutsche Bank Securities | |||
| J.P. Morgan | Morgan Stanley | RBC Capital Markets |
| BNP PARIBAS | BTIG |
Evercore ISI |
SunTrust Robinson Humphrey |
UBS Investment Bank | ||||
| Apollo Global Securities | Dowling & Partners Securities LLC | |||||||
| Keefe, Bruyette & Woods A Stifel Company |
Lazard | Rothschild |
| Sandler O’Neill + Partners, L.P. | The Williams Capital Group, L.P. |
The date of this prospectus is , 2016.
Table of Contents
| Page | ||||
| ii | ||||
| ENFORCEMENT OF CIVIL LIABILITIES UNDER U.S. FEDERAL SECURITIES LAW |
ii | |||
| 1 | ||||
| 27 | ||||
| SPECIAL NOTE REGARDING FORWARD-LOOKING STATEMENTS AND MARKET DATA |
77 | |||
| 79 | ||||
| 80 | ||||
| 81 | ||||
| SELECTED HISTORICAL CONSOLIDATED FINANCIAL AND OPERATING DATA |
82 | |||
| MANAGEMENT’S DISCUSSION AND ANALYSIS OF FINANCIAL CONDITION AND RESULTS OF OPERATIONS |
85 | |||
| 156 | ||||
| 215 | ||||
| 228 | ||||
| 250 | ||||
| 256 | ||||
| 271 | ||||
| 281 | ||||
| 284 | ||||
| 291 | ||||
| 294 | ||||
| 307 | ||||
| 314 | ||||
| 315 | ||||
| 315 | ||||
| 317 | ||||
| F-1 | ||||
| GLOSSARY OF SELECTED INSURANCE, REINSURANCE AND FINANCIAL TERMS |
G-1 | |||
You should rely only on the information contained in this prospectus or in any free writing prospectus that we authorize to be delivered to you. Neither we, the selling shareholders nor any of the underwriters have authorized anyone to provide you with additional or different information. If anyone provides you with additional, different or inconsistent information, you should not rely on it. This prospectus is an offer to sell only the Class A common shares offered hereby, and only under circumstances and in jurisdictions where it is lawful to do so. You should assume the information contained in this prospectus and any free writing prospectus we authorize to be delivered to you is accurate only as of their respective dates or the date or dates specified in those documents. Our business, financial condition, results of operations or prospects may have changed since those dates.
For investors outside the United States: neither we, the selling shareholders nor any of the underwriters have done anything that would permit this offering or possession or distribution of this prospectus in any jurisdiction where action for that purpose is required, other than in the United States. Persons outside the United States who come into possession of this prospectus must inform themselves about, and observe any restrictions relating to, the offering of the Class A common shares and the distribution of this prospectus outside the United States.
i
Table of Contents
We obtained the industry, market and competitive position data throughout this prospectus from (1) our own internal estimates and research, (2) industry and general publications and research, (3) studies and surveys conducted by third parties and (4) other publicly available information. Independent research reports and industry publications generally indicate that the information contained therein was obtained from sources believed to be reliable, but do not guarantee the accuracy and completeness of such information. While we believe that the information included in this prospectus from such publications, research, studies and surveys is reliable, neither we, the selling shareholders nor any of the underwriters have independently verified data from these third-party sources. In addition, while we believe our internal estimates and research are reliable and the definitions of our market and industry are appropriate, neither such estimates and research nor such definitions have been verified by any independent source. Forward-looking information obtained from these sources is subject to the same qualifications and the additional uncertainties as the other forward-looking statements in this prospectus.
ENFORCEMENT OF CIVIL LIABILITIES UNDER U.S. FEDERAL SECURITIES LAWS
We are incorporated under the laws of Bermuda. In addition, some of our directors and officers may reside outside the United States, and all or a substantial portion of our assets and the assets of these persons are, or may be, located in jurisdictions outside the United States. Therefore, it may be difficult for investors to recover against us or our non-United States based directors and officers, or obtain judgments of U.S. courts, including judgments predicated upon the civil liability provisions of U.S. federal securities laws. Although we may be served with process in the United States with respect to actions against us arising out of or in connection with violations of U.S. federal securities laws relating to offers and sales of Class A common shares made by this prospectus by serving CT Corporation, our U.S. agent irrevocably appointed for that purpose, it may be difficult for investors to effect service of process within the United States on our directors and officers who reside outside the United States.
We have been advised by our Bermuda counsel that there is no treaty in force between the United States and Bermuda providing for the reciprocal recognition and enforcement of judgments in civil and commercial matters. A judgment for the payment of money rendered by a court in the United States based on civil liability would not be automatically enforceable in Bermuda. A final and conclusive judgment obtained in a court of competent jurisdiction in the United States under which a sum of money is payable as compensatory damages may be the subject of an action in a Bermuda court under the common law doctrine of obligation, by action on the debt evidenced by the U.S. court judgment without examination of the merits of the underlying claim. In order to maintain an action in debt evidenced by a U.S. court judgment, the judgment creditor must establish that:
| • | the court that gave the judgment over the defendant was competent to hear the claim in accordance with private international law principles as applied in the courts in Bermuda; and |
| • | the judgment is not contrary to public policy in Bermuda and was not obtained contrary to the rules of natural justice in Bermuda. |
In addition, and irrespective of jurisdictional issues, the Bermuda courts will not enforce a U.S. federal securities law that is either penal or contrary to Bermuda public policy. It is the advice of our Bermuda counsel that an action brought pursuant to a public or penal law, the purpose of which is the enforcement of a sanction, power or right at the instance of the state in its sovereign capacity, will not be entertained by a Bermuda court. Certain remedies available under the laws of U.S. jurisdictions, including certain remedies under U.S. federal securities laws, would not be available under Bermuda law or enforceable in a Bermuda court, as they would be contrary to Bermuda public policy. U.S. judgments for multiple damages may not be recoverable in Bermuda court enforcement proceedings under the provisions of the Protection of Trading Interests Act 1981. A claim to enforce the compensatory damages before the multiplier was applied would be maintainable in the Bermuda court. Further, no claim may be brought in Bermuda against us or our directors and officers in the first instance for violation of federal securities laws because these laws have no extraterritorial jurisdiction under Bermuda law and do not have force of law in Bermuda. A Bermuda court may, however, impose civil liability on us or our directors and officers if the facts alleged in a complaint constitute or give rise to a cause of action under Bermuda law. See “Comparison of Shareholder Rights—Differences in Corporate Law—Shareholders’ Suits.”
ii
Table of Contents
This summary highlights information contained elsewhere in this prospectus. This summary is not complete and does not contain all of the information that you should consider before investing in our Class A common shares. You should carefully read this prospectus in its entirety before making an investment decision. In particular, you should read “Risk Factors” beginning on page 27, “Management’s Discussion and Analysis of Financial Condition and Results of Operations” beginning on page 85 and the consolidated financial statements and notes thereto and other financial information included elsewhere in this prospectus. As used in this prospectus, unless the context otherwise indicates, any reference to “Athene,” “our company,” “the company,” “us,” “we” and “our” refers to Athene Holding Ltd. together with its consolidated subsidiaries and any reference to “AHL” refers to Athene Holding Ltd. only.
Unless otherwise indicated, the information included in this prospectus assumes (1) the sale of our Class A common shares in this offering at an offering price of $ per Class A common share, which is the mid-point of the pricing range set forth on the cover page of this prospectus and (2) that the underwriters have not exercised their option to purchase up to additional Class A common shares.
In this prospectus, we refer to a number of terms to describe our insurance and reinsurance businesses and financial and operating metrics such as “base of earnings,” “investment margin,” “VOBA,” “invested assets” and “alternative investments,” among others. For a detailed explanation of these terms and other terms used in this prospectus and not otherwise defined, please refer to “Glossary of Selected Insurance, Reinsurance and Financial Terms” in this prospectus.
In this prospectus, we make certain forward-looking statements, including expectations relating to our future performance. These expectations reflect our management’s view of our prospects and are subject to the risks described under “Risk Factors” and “Special Note Regarding Forward-Looking Statements and Market Data” in this prospectus. Our expectations of our future performance may change after the date of this prospectus and there is no guarantee that such expectations will prove to be accurate.
Our Company
We are a leading retirement services company that issues, reinsures and acquires retirement savings products designed for the increasing number of individuals and institutions seeking to fund retirement needs. We generate attractive financial results for our policyholders and shareholders by combining our two core competencies of (1) sourcing long-term, generally illiquid liabilities and (2) investing in a high quality investment portfolio, which takes advantage of the illiquid nature of our liabilities. Our steady and significant base of earnings generates capital that we opportunistically invest across our business to source attractively-priced liabilities and capitalize on opportunities. Our differentiated investment strategy benefits from our strategic relationship with Apollo Global Management, LLC (“Apollo”) and its indirect subsidiary, Athene Asset Management, L.P. (“AAM”). AAM provides a full suite of services for our investment portfolio, including direct investment management, asset allocation, mergers and acquisition asset diligence, and certain operational support services, including investment compliance, tax, legal and risk management support. Our relationship with Apollo and AAM also provides us with access to Apollo’s investment professionals across the world as well as Apollo’s global asset management infrastructure that, as of September 30, 2016, supported more than $188 billion of assets under management (“AUM”) across a broad array of asset classes. We are led by a highly skilled management team with extensive industry experience. We are based in Bermuda with our U.S. subsidiaries’ headquarters located in Iowa.
We began operating in 2009 when the burdens of the financial crisis and resulting capital demands caused many companies to exit the retirement market, creating the need for a well-capitalized company with an experienced management team to fill the void. Taking advantage of this market dislocation, we have been able to
Table of Contents
acquire substantial blocks of long-duration liabilities and reinvest the related investments to produce profitable returns. We have been able to generate strong financial returns in a multi-year low rate environment. We believe we have fewer legacy liability issues than our peers given that all of our retail and flow reinsurance liabilities were underwritten after the financial crisis, and the majority of the liabilities we acquired through our acquisitions and block reinsurance were acquired at a discount to book value.
We have established a significant base of earnings and as of September 30, 2016 have an expected annual investment margin of 2-3% over the 8.4 year weighted-average life of our deferred annuities, which make up a substantial portion of our reserve liabilities. Even as we have grown to $73.1 billion in investments, including related parties, $71.6 billion in invested assets and $87.0 billion of total assets as of September 30, 2016, we have continued to approach both sides of the balance sheet with an opportunistic mindset because we believe quickly identifying and capitalizing on market dislocations allows us to generate attractive, risk-adjusted returns for our shareholders. Further, our multiple distribution channels support growing origination across market environments and better enable us to achieve continued balance sheet growth while maintaining attractive profitability. We believe that in a typical market environment, we will be able to profitably grow through our organic channels, including retail, flow reinsurance (a transaction in which the ceding company cedes a portion of newly issued policies to the reinsurer) and institutional products. In more challenging market environments, we believe that we will see additional opportunities to grow through our inorganic channels, including acquisitions and block reinsurance (a transaction in which the ceding company cedes all or a portion of a block of previously issued annuity contracts through a reinsurance agreement), due to market stress during those periods. We are diligent in setting our return targets based on market conditions and risks inherent to our products offered and acquisitions or block reinsurance transactions. In general, we may accept lower returns on products which may provide more certain return characteristics, such as funding agreement backed notes (“FABN”), and we may require higher returns for products or transactions where there is more inherent risk in meeting our return targets, such as with acquisitions. Generally, we target mid-teen returns for sources of organic growth and higher returns for sources of inorganic growth. If we are unable to source liabilities with our desired return profile in one of our channels, we generally will not sacrifice profitability solely for the sake of increasing market share and instead we will typically focus on our other channels to identify growth opportunities that meet our preferred risk and return profile.
As a result of our focus on issuing, reinsuring and acquiring attractively-priced liabilities, our differentiated investment strategy and our significant scale, for the nine months ended September 30, 2016 and the year ended December 31, 2015, in our Retirement Services segment described below, we generated an annualized investment margin on deferred annuities of 2.68% and 2.45%, respectively, an annualized operating return on equity (“ROE”) excluding accumulated other comprehensive income (loss) (“AOCI”) of 17.5% and 22.7%, respectively, and an operating ROE excluding AOCI for the trailing twelve month period ended September 30, 2016 of 20.1%. We currently maintain what we believe to be high capital ratios for our rating and hold more than $1 billion of capital in excess of the level we believe is needed to support our current operating strategy, and view this excess as strategic capital available to reinvest into organic and inorganic growth opportunities. Because we hold this strategic capital to implement our opportunistic strategy and to enable us to explore deployment opportunities as they arise, and because we are investing for future growth, our consolidated annualized ROE for the nine months ended September 30, 2016 and the year ended December 31, 2015 was 9.4% and 11.3%, respectively, and our consolidated annualized operating ROE excluding AOCI for the same period was 10.8% and 15.6%, respectively, in each case, without the benefit of any financial leverage or capital return through dividends or share buyback programs. On a consolidated basis, for the nine months ended September 30, 2016 and the year ended December 31, 2015, we generated net income available to AHL shareholders of $437 million and $562 million, respectively, and operating income, net of tax, of $476 million and $740 million, respectively. Investment margin, operating income, net of tax, and operating ROE excluding AOCI are not calculated in accordance with U.S. generally accepted accounting principles (“GAAP”). See “Management’s Discussion and Analysis of Financial Condition and Results of Operations—Key Operating and Non-GAAP Measures” for additional discussions regarding non-GAAP measures.
2
Table of Contents
As of September 30, 2016, we had $7.1 billion of total AHL shareholders’ equity and $6.2 billion of total AHL shareholders’ equity excluding AOCI. Our top-level U.S. insurance subsidiary, Athene Annuity & Life Assurance Company (formerly known as Liberty Life, “AADE”), had a risk based capital ratio (“U.S. RBC ratio”) of 552% and our Bermuda reinsurer, Athene Life Re Ltd. (“ALRe”), had a Bermuda Solvency Capital Requirement (“BSCR”) ratio of 323%, each as of December 31, 2015. As of September 30, 2016, our estimated U.S. RBC ratio remained strong at 469%. The change from our December 31, 2015 U.S. RBC ratio is primarily driven by our investment of capital to organically grow our retail channel, which increased significantly during 2016. Our main insurance subsidiaries are rated A- for financial strength by each of Standard & Poor’s Financial Services LLP (“S&P”) and Fitch Ratings, Inc. (“Fitch”), each with a stable outlook, and by A.M. Best Company, Inc. (“A.M. Best”), with a positive outlook. AHL has a counterparty credit rating of BBB from S&P and an issuer default rating of BBB from Fitch, each with a stable outlook, and an issuer credit rating of bbb- from A.M. Best, with a positive outlook. See “Business—Financial Strength Ratings.” We currently have no financial leverage, and have an undrawn $1.0 billion credit facility in place to provide an additional liquidity cushion in challenging economic or business environments or to provide additional capital support.
We operate our core business strategies out of one reportable segment, Retirement Services. In addition to Retirement Services, we report certain other operations in Corporate and Other. Retirement Services is comprised of our U.S. and Bermuda operations which issue and reinsure retirement savings products and institutional products. Retirement Services has retail operations, which provide annuity retirement solutions to our policyholders. Retirement Services also has reinsurance operations, which reinsure multi-year guaranteed annuities (“MYGAs”), fixed indexed annuities (“FIAs”), traditional one year guarantee fixed deferred annuities, immediate annuities and institutional products from our reinsurance partners. In addition, our FABN program is included in our Retirement Services segment. Corporate and Other includes certain other operations related to our corporate activities and our German operations, which is primarily comprised of participating long-duration savings products. In addition to our German operations, included in Corporate and Other are corporate allocated expenses, merger and acquisition costs, debt costs, certain integration and restructuring costs, certain stock-based compensation and intersegment eliminations. In Corporate and Other we also hold more than $1 billion of capital in excess of the level of capital we hold in Retirement Services to support our operating strategy.
We believe we hold a sufficient amount of capital in our Retirement Services segment to support our core operating strategies. This level of capital may fluctuate depending on the mix of both our assets and our liabilities, and also reflects the level of capital needed to support or improve our current ratings as well as our risk appetite based on our internal risk models. The level of capital the company currently allocates to our Corporate non-reportable segment is our U.S. subsidiaries’ statutory capital in excess of a U.S. RBC ratio of 400% as well as the Bermuda capital for ALRe in excess of 400% risk-based capital (“RBC”) when also applying National Association of Insurance Commissioners (“NAIC”) RBC factors. We view this excess as strategic capital, which we expect to deploy for additional organic and inorganic growth opportunities as well as expect to contribute to ratings improvements over time. We manage our capital to levels which we believe would remain consistent with our current ratings in a recessionary environment. For additional information regarding our segments, refer to “Note 15 – Segment Information” to our unaudited condensed consolidated financial statements and notes thereto and “Note 21 – Segment Information” to our audited consolidated financial statements and notes thereto.
We have developed organic and inorganic channels to address the retirement services market and grow our assets and liabilities. By focusing on the retirement services market, we believe that we will benefit from several demographic and economic trends, including the increasing number of retirees in the United States, the lack of tax advantaged alternatives for people trying to save for retirement and expectations of a rising interest rate environment. To date, most of our products sold and acquired have been fixed annuities, which offer people saving for retirement a product that is tax advantaged, has a minimum guaranteed rate of return or minimum cash value and provides protection against investment loss. Our policies often include surrender charges (86% of our annuity
3
Table of Contents
products, as of September 30, 2016) or market value adjustments (“MVAs”) (73% of our annuity products, as of September 30, 2016), both of which increase persistency (the probability that a policy will remain in force from one period to the next) and protect our ability to meet our obligations to policyholders.
Our organic channels have provided deposits of $6.9 billion and $2.6 billion for the nine months ended September 30, 2016 and 2015, respectively, and $3.9 billion, $2.9 billion and $1.5 billion for the years ended December 31, 2015, 2014 and 2013, respectively. Withdrawals on our deferred annuities were $3.0 billion and $3.3 billion for the nine months ended September 30, 2016 and 2015, respectively, and $4.4 billion, $4.4 billion and $2.1 billion for the years ended December 31, 2015, 2014 and 2013, respectively. While there can be no assurance that we will meet our growth targets, we believe that our new deposits should continue to significantly surpass our withdrawals as we continue to grow our retail and flow reinsurance channels. Absent any significant unexpected market conditions or regulatory impacts and assuming we can meet our pricing targets, we believe that with our ratings and the strong growth in our organic channel in 2016, new deposits from our organic channels and withdrawal experience with respect to our deferred annuities should be similar in the near-to-mid-term to our 2016 production and withdrawal experience, respectively. Within these channels, we have focused on developing a diverse suite of products that allow us to meet our risk and return profiles, even in today’s low rate environment. As a result, not only have we been able to deliver strong organic growth in 2016, but we have also been able to do so without sacrificing profitability. Going forward, we believe the 2015 upgrade of our financial strength ratings to A- by each of S&P, Fitch and A.M. Best, as well as our 2016 outlook upgrade to positive by A.M. Best and our recent FIA and MYGA new product launches will continue to enable us to increase penetration in our existing organic channels and access new markets within our retail channel, such as through financial institutions. This increased penetration will allow us to source additional volumes of profitably underwritten liabilities. Our organic channels currently include:
| • | Retail, from which we provide retirement solutions to our policyholders primarily through approximately 60 independent marketing organizations (“IMOs”). Within our retail channel we had fixed annuity sales of $3.8 billion and $1.9 billion for the nine months ended September 30, 2016 and 2015, respectively, and $2.5 billion, $2.5 billion and $1.3 billion for the years ended December 31, 2015, 2014 and 2013, respectively. For the trailing twelve month period ended September 30, 2016, we had fixed annuity sales of $4.4 billion. |
| • | Flow reinsurance, which provides an opportunistic channel for us to source long-term liabilities with attractive crediting rates. Within our flow reinsurance channel, we generated $3.1 billion and $660 million in deposits for the nine months ended September 30, 2016 and 2015, respectively, and $1.1 billion, $349 million and $167 million in deposits for the years ended December 31, 2015, 2014 and 2013, respectively. For the trailing twelve month period ended September 30, 2016, we generated new flow reinsurance deposits of $3.6 billion. |
| • | Institutional products, focused on the sale of funding agreements. Within our institutional products channel, in October 2015, we sold a $250 million funding agreement in our inaugural transaction under our FABN program. To date, we have not completed a pension risk transfer transaction, although we are in the process of developing our capabilities to undertake such transactions. |
Our inorganic channels, including acquisitions and block reinsurance, have contributed significantly to our growth. We believe our internal acquisitions team, with support from Apollo, has an industry-leading ability to source, underwrite, and expeditiously close transactions, which makes us a competitive counterparty for acquisition or block reinsurance transactions. We are highly selective in the transactions that we pursue; ultimately closing only those that are well aligned with our core competencies and pricing discipline. Since our inception, we have evaluated a significant number of merger and acquisition opportunities and have closed on five acquisitions. In connection with our five acquisitions through September 30, 2016, we sourced reserve liabilities backed by approximately $65.9 billion in total assets (net of $9.3 billion in assets ceded through reinsurance). The aggregate purchase price of our acquisitions was less than the aggregate statutory book value of the businesses acquired.
4
Table of Contents
We have sourced a high quality portfolio of invested assets. Because we have remained disciplined in underwriting attractively priced liabilities, we have the ability to invest in a broad range of high quality assets and generate attractive earnings. As of September 30, 2016, approximately 93.1% of our available for sale (“AFS”) fixed maturity securities, including related parties, were rated NAIC 1 or NAIC 2, the two highest credit rating designations under the NAIC’s criteria (with investments of our German operations rated by applying nationally recognized statistical ratings organization (“NRSRO”) equivalent ratings to map NAIC ratings). In addition to our core fixed income portfolio, we opportunistically allocate 5-10% of our portfolio to alternative investments where we primarily focus on fixed income-like, cash flow-based investments. For instance, our alternative investment positions include significant equity stakes in two asset platforms that originate high quality credit assets (such as residential mortgage loans (“RMLs”), leveraged loans and mortgage servicing rights) that are well aligned with our investment strategy. Our relationship with AAM and Apollo allows us to take advantage of our generally illiquid liability profile and identify asset opportunities with an emphasis on earning incremental yield by taking liquidity risk and complexity risk, rather than assuming solely credit risk. While alternative investments are a relatively small portion of our overall portfolio, our alternative investments strategy has been an important driver of returns. In general, we target returns for alternative investment of 10% or higher on an internal rate of return (“IRR”) basis over the expected lives of such investments.
Through our efficient corporate structure and operations, we believe we have built a cost-effective platform to support our growth opportunities. We believe our fixed operating cost structure supports our ability to maintain an attractive financial profile across market environments. Additionally, we believe we have designed our platform to be highly scalable and support growth without significant incremental investment in infrastructure, which allows us to scale our business production up or down because of our cost-effective platform. As a result, we believe we will be able to convert a significant portion of our new business spread into operating income. For the nine months ending September 30, 2016 and year ended December 31, 2015, our operating income, net of tax was as follows (dollars in millions):
| Nine months ended September 30, 2016 |
Year ended December 31, 2015 |
|||||||
| Retirement Services |
||||||||
| Net investment earnings |
$ | 2,162 | $ | 2,572 | ||||
| Cost of crediting on deferred annuities |
(755) | (940) | ||||||
| Other liability costs (1) |
(750) | (656) | ||||||
| Operating expenses |
(150) | (166) | ||||||
|
|
|
|
|
|||||
| Operating income before tax |
507 | 810 | ||||||
| Income tax (expense) benefit – operating income |
56 | (41) | ||||||
|
|
|
|
|
|||||
| Operating income, net of tax* |
$ | 563 | $ | 769 | ||||
|
|
|
|
|
|||||
| * | Refer to “Management’s Discussion and Analysis of Financial Conditions and Results of Operations – Key Operating and Non-GAAP Measures” for discussion on operating income, net of taxes and “Management’s Discussion and Analysis of Financial Conditions and Results of Operations – Non-GAAP Measure Reconciliations”. |
| (1) | Other liability costs include DAC, DSI and VOBA amortization and change in GLWB and GMDB reserves for all products, the cost of liabilities on products other than deferred annuities including offsets for premiums, product charges and other revenues. |
Relationship with Apollo
We have a strategic relationship with Apollo which allows us to leverage the scale of its asset management platform. Apollo’s indirect subsidiary, AAM, serves as our investment manager. In addition to co-founding the company, Apollo assists us in identifying and capitalizing on acquisition opportunities that have been critical to our ability to significantly grow our business. Members of the Apollo Group are significant owners of our common shares and Apollo employees serve on our board of directors. We expect our strategic relationship with Apollo to continue for the foreseeable future. See “Certain Relationships and Related Party Transactions—Relationships and Related Party Transactions with Apollo or its Affiliates,” “Principal and Selling Shareholders” and “Shares Eligible for Future Sale—Lock-Up Agreements.”
5
Table of Contents
The Apollo Group controls and is expected, subsequent to the completion of our initial public offering, to continue to control 45% of the total voting power of AHL and five of our 16 directors are employees of or consultants to Apollo and our Chairman, Chief Executive Officer and Chief Investment Officer is a dual employee of both AHL and AAM. Further, our bye-laws generally limit the voting power of our Class A common shares (and certain other of our voting securities) such that no person owns (or is treated as owning) more than 9.9% of the total voting power of our common shares (with certain exceptions). See “Description of Share Capital—Common Shares.”
Our Market Opportunity
The number of individuals reaching retirement age is growing rapidly while some traditional retirement funding sources have declined in the wake of the financial crisis and the ensuing prolonged low interest rate environment. Our tax-efficient savings products are well positioned to meet this increasing customer demand.
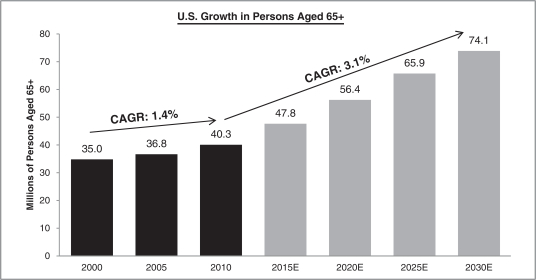
| • | Increasing Retirement-Age Population. Over the next three decades, the retirement-age population is expected to experience unprecedented growth. According to the U.S. Census Bureau, there were approximately 40 million Americans age 65 and older in 2010, representing 13% of the U.S. population. By 2030, this segment of the population is expected to increase by 34 million or 85% to approximately 74 million, which would represent approximately 21% of the U.S. population. Technological advances and improvements in healthcare are projected to continue to contribute to increasing average life expectancy, and aging individuals must be prepared to fund retirement periods that will last longer than ever before. Furthermore, many working households in the United States do not have adequate retirement savings. Demand for traditional fixed rate annuities and FIAs will likely be bolstered by this gap resulting from the growing need for guaranteed income streams and the expanding retirement population’s insufficient savings base. |
|
| Source: U.S. Census Bureau. |
6
Table of Contents
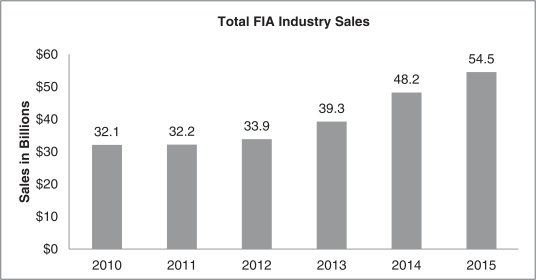
| • | Increasing Demand for Tax-efficient Savings Products. According to a 2015 report published by the Government Accountability Office, approximately 50% of individuals age 55 and older have no retirement savings. As a tool for addressing the unmet need for retirement planning, we believe that many Americans have begun to look to tax-efficient savings products with low-risk or guaranteed return features and potential equity market upside, particularly as federal, state and local marginal tax rates have increased. As a result, sales of FIAs increased by approximately 70% from 2010 to 2015 and FIAs as a percentage of total fixed annuities increased from 39% in 2010 to 53% in 2015 according to the Life Insurance and Market Research Association (“LIMRA”). If interest rates rise, we expect to benefit from increased demand for our tax-efficient savings products as crediting and participation rates become more attractive on an absolute basis, and relative to alternative fixed income and savings vehicles such as certificates of deposit (“CDs”) and corporate bonds. |
|
| Source: U.S. Individual Annuity Yearbook 2014 and 4Q 2015 LIMRA Secure Retirement Institute US Individual Annuity Sales Report. |
7
Table of Contents
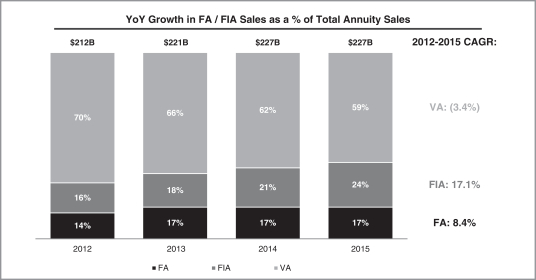
| • | Shift in Industry Product Mix. In addition to prospects of overall market growth due to increases in demand for retirement products, the industry is also experiencing a shift in product mix as demand for variable annuities has been declining, while demand for fixed rate annuities and FIAs has been increasing. Between 2012 and 2015, variable annuities experienced a compound annual growth rate (“CAGR”) of (3.4%), while fixed rate annuities and FIAs experienced CAGRs of 8.4% and 17.1%, respectively. We believe this trend illustrates consumer preference for the relative predictability and safety of fixed rate annuities and FIAs over the volatility often experienced with variable annuities. Given that we focus on sourcing liabilities primarily comprised of fixed rate annuities and FIAs and do not actively source variable annuities, we believe that we stand to benefit from these shifts in industry product mix. |
|
|
Source: Estimated based on sales reported to LIMRA from 2012 through 2015. |
| • | Shift in the Competitive Environment. Products with guarantees require superior asset and risk management expertise to balance policyholder security, regulatory demands and shareholder returns on equity. Since the financial crisis, many companies have placed their fixed annuity businesses in run-off and have sold substantial blocks to third parties including us. The current market and regulatory environment, including the newly-issued U.S. Department of Labor (“DOL”) regulations regarding fiduciary obligations of distributors of products to retirement accounts could provide us additional sources of growth through reinsurance and/or acquisitions to the extent that competitors divest in-force blocks of business as a result of such environment. However, we have also seen and may in the future see additional competitors enter the market who could compete for such sources of growth. |
| • | Increasing Asset Opportunities. Regulatory changes in the wake of the financial crisis have made it less profitable for banks and other traditional lenders to hold certain illiquid and complex asset classes, notwithstanding the fact that these assets may have prudent credit characteristics. This market pullback has resulted in a supply-demand imbalance, which has created the opportunity for knowledgeable investors to acquire high-quality assets that offer attractive returns. As these institutions continue to comply with these new rules, we believe additional assets will become available which could be attractive for our business. |
| • | Large Market Opportunity. The distribution channels we have developed provide us access to large markets for our products. Increasing demand for tax-efficient retirement savings products suggests that |
8
Table of Contents
| these markets will remain robust while many companies are still hesitant to commit significant capital to these channels due to increasing regulation, capital requirements and the low interest rate environment. We believe these market dynamics will enable us to continue to profitably gain share in each of the markets on which we focus. For example, within the retail channel, according to LIMRA, for the six months ended June 30, 2016 (the most recent period that data is currently available), we were the 12th largest company in sales of fixed annuities with a 2.8% market share and the 5th largest company in sales of fixed indexed annuities with a 5.0% market share. We believe we will benefit from both the growth in the overall market as the market expands to meet the increased demand for tax-efficient retirement savings products and from gains in our market share as we continue to build our capabilities, strengthen our relationships and enter new markets within our existing channels. |
| Retail & Flow Reinsurance |
FABN | Total U.S. Pension Assets |
||||||||||
| Market Size |
$ | 125 billion | (1) | $ | 17 billion | (2) | $ | 3.3 trillion | (3) | |||
| (1) | Source: LIMRA – total annuity sales in 2015 via financial institution channels. |
| (2) | Source: IFR Markets – trailing twelve months issuances as of September 30, 2016. |
| (3) | Source: Federal Reserve Statistical Release, Q2 2016 – U.S. private defined benefit pension assets. |
Competitive Strengths
We believe the following strengths will allow us to capitalize on the growth prospects for our business:
| • | Ideal Platform to Capitalize on Positive Demographic and Market Trends. We have designed our products to capitalize on the growing need for retirement savings solutions. Our products provide protection against market downturns and offer interest which compounds on a tax-deferred basis until funds are distributed. Many of our products also provide the potential to earn interest based on the performance of a market index. These features provide distinct advantages over traditional savings vehicles such as bank CDs and variable annuities. Despite a challenging interest rate environment, we have been able to profitably source $3.8 billion of fixed annuity products through our retail channel in the first nine months of 2016 by leveraging our product design capabilities, our investment acumen, which allows us to invest at appropriate investment margins, and our scalable operating platform. We offer prudent product features at attractive prices. If investment rates increase due to a rise in interest rates or widening credit spreads, we would be able to offer higher crediting rates, which we believe would generate additional demand for our products and therefore increased sales. Even in a long-term low rate environment, we believe our underwriting expertise and ability to find and compete in areas of the market that are rationally priced will allow us to maintain strong operating results. For example, in prior years, our retail operations have generally not competed aggressively in the guaranteed income rider segment as we historically believed that such riders were not priced within our pricing discipline. However, recently, competitors have been issuing annuities with what we believe are more rationally-priced lifetime income benefit features. In the current environment, we believe that we can grow our retail sales by offering competitive guaranteed income rates while earning an attractive return. |
| • | Multiple Distribution Channels. We have four dedicated distribution channels to capitalize on retirement services opportunities across market environments and grow our liabilities. Our key distribution channels are retail, reinsurance (including flow and block reinsurance), institutional products (focused on the sale of funding agreements) and acquisitions. We intend to maintain a presence within each of these distribution channels with the ability to underwrite liabilities. However, we do not have any market share targets across our organization, which we believe provides us flexibility to respond to changing market conditions in one or more channels and to opportunistically grow liabilities that generate our desired levels of profitability. In a rising interest rate environment, we believe we will be able to profitably increase the volume of our retail, flow reinsurance and institutional product sales and we believe we will see increased acquisition and block reinsurance opportunities in more challenging market |
9
Table of Contents
| environments. We are diligent in setting our return targets based on market conditions and risks inherent to our products offered and acquisitions or block reinsurance transactions. In general, we may accept lower returns on products which may provide more certain return characteristics, such as FABN, and we may require higher returns for products or transactions where there is more inherent risk in meeting our return targets, such as with acquisitions. If market conditions or risks inherent to a product or transaction create return profiles that are not acceptable to us, we generally will not sacrifice our profitability merely to facilitate growth. |
| • | Superior and Unique Investment Capabilities. We believe our relationships with AAM and Apollo provide access to superior and unique investment capabilities that allow us to invest a portion of our assets in securities that earn us incremental yield by taking liquidity risk and complexity risk, capitalizing on our long-dated and persistent liability profile to prudently achieve higher net investment earned rates, rather than assuming solely credit risk. Our investing capabilities support our ability to sell fixed annuities profitably and to price acquisitions competitively while meeting our return targets. Through AAM, we have access to more than 100 investment and operations professionals who are highly familiar with our business objectives and funding structure. This enables AAM to customize asset allocations and select investments for us that are most appropriate for our business. In addition, our strategic relationship with Apollo provides us with access to Apollo’s broad credit and alternative investment platforms and allows us to leverage the scale, sourcing and investing capabilities, and infrastructure of an asset manager with more than $188 billion of AUM, which includes approximately $71.5 billion of our invested assets, each as of September 30, 2016. Apollo’s global asset sourcing capabilities in a diverse array of asset classes provide AAM with the opportunity to capitalize on attractive investments for us. |
| • | In each of our U.S. acquisitions, we have successfully reinvested our acquired investment portfolio with the objective of achieving higher returns than were achieved on such investments prior to the acquisition. For example, we have reinvested a substantial portion of the investment portfolio acquired in our acquisition of Aviva USA Corporation (“Aviva USA,” now known as Athene USA Corporation, “Athene USA”), which contributed to the increase in fixed income and other net investment earned rates on this block of business to 4.12% for the year ended December 31, 2015 from 3.50% (on an annualized basis) for the fourth quarter of 2013. |
| • | Apollo and AAM work collaboratively to identify and quickly capitalize on opportunities in various asset classes. For example, we were an early investor in distressed non-agency residential mortgage-backed securities (“RMBS”) during 2009 and 2010, prior to the strong recovery of that market in later years. By the end of 2010, we had acquired a portfolio of $448 million (approximately 24% of our total invested assets at such time) of non-agency RMBS at discounts to par, well in advance of the significant price improvements in these investments. Today, RMBS continues to represent an important asset class within our investment portfolio. As of September 30, 2016, 14.7% of our invested assets were invested in RMBS, with such securities having an amortized book price of 84% of aggregate par value. |
| • | AAM selects investments and develops investment strategies prior to our purchase in accordance with our investment limits, and works in concert with our risk management team to stress-test the underwritten assets and asset classes under various negative scenarios. For both the nine months ended September 30, 2016 and the year ended December 31, 2015, our annualized other-than-temporary-impairment (“OTTI”) as a percentage of our average invested assets was 5 basis points. |
| • | We also have access to expertise and capabilities to directly originate a wide range of asset classes through AAM and Apollo. Direct origination allows the selection of assets that meet our liability profile and the sourcing of better quality investments. |
| • | Efficient Corporate Platform to Support Profitability. We believe we have designed an efficient corporate platform to support our portfolio of $70.9 billion of reserve liabilities as of September 30, |
10
Table of Contents
| 2016. Over the 8.4 year weighted average life of our deferred annuities, we expect to generate an annual investment margin of 2-3%. |
In addition, our corporate platform enables us to be highly scalable and to allow us to onboard incremental business without significant additional investment in infrastructure and with low incremental fixed operating cost. As a result, we believe we should be able to convert a significant portion of incremental net investment income from additional invested assets and liabilities into operating income.
| • | Strength of Balance Sheet. We believe the strength of our balance sheet provides confidence to our policyholders and business partners and positions us for continued growth. We presently hold over $1 billion in excess capital and have no financial leverage. We maintain what we believe to be high capital ratios for our rating, with our top level insurance subsidiary, AADE, having a U.S. RBC ratio of 552% and ALRe having a BSCR of 323%, each as of December 31, 2015. To further reinforce our strong liquidity profile, we have access to a $1 billion dollar revolving credit facility that is currently undrawn. Our invested assets comprise what we believe to be a highly rated and well diversified portfolio. As of September 30, 2016, approximately 93.1% of our AFS fixed maturity securities, including related parties, were rated NAIC 1 or NAIC 2. These assets are managed against what we believe to be prudently underwritten liabilities, which were, in each case, priced by us after the financial crisis. |
| • | Robust Risk Management. We have established a comprehensive enterprise risk management (“ERM”) framework and risk management controls throughout our organization, which are further supported by AAM’s and Apollo’s own risk management capabilities that are intended to help us maintain our continued financial strength. We manage our business, capital and liquidity profile with the objective of withstanding severe adverse shocks, such as the 2007-2008 financial crisis, while maintaining a meaningful buffer above regulatory minimums and above certain capital thresholds to meet our desired credit ratings. Risk management is embedded in all of our business decisions and processes, including acquisitions, asset purchases, product design and underwriting, liquidity and liability management. Certain of the key attributes of our risk management profile are: |
| • | We maintain a risk committee of the board of directors charged with the oversight of the development and implementation of systems and processes designed to identify, manage and mitigate reasonably foreseeable material risks and with the duty to assist our board of directors and our other board committees with fulfilling their oversight responsibilities for our risk management function. |
| • | We believe that we underwrite liabilities and manage new product development prudently. Further, we believe that our strong fixed annuity underwriting provides us with long-dated and persistent liabilities, which we believe are priced at desirable levels to enable us to achieve attractive, risk-adjusted returns. |
| • | We believe we have designed our asset liability management (“ALM”) procedures to protect the company, within limits, against significant changes in interest rates. |
| • | As of September 30, 2016, approximately 86% of our annuity products had surrender charges and 73% had MVAs, each of which provide stability to our reserve liabilities. |
| • | As of September 30, 2016, 29% of our invested assets were floating rate investments which would allow us the flexibility to quickly increase our crediting rates in a rising interest rate environment, if desired. |
| • | We believe that we maintain an appropriate amount of assets that could be quickly liquidated, if needed, and have an additional liquidity cushion through a $1.0 billion revolving credit facility, which is undrawn as of the date hereof. |
11
Table of Contents
| • | We believe we hold a high-quality portfolio, with approximately 93.1% of our AFS fixed maturity securities, including related parties, rated as NAIC 1 or NAIC 2 as of September 30, 2016 (with investments of our German operations rated by applying NRSRO equivalent ratings to map NAIC ratings). |
| • | AAM evaluates our structured securities at the time of acquisition using AAM’s proprietary credit models. |
| • | Even during periods of moderate economic stress, based on our modeled estimates, we maintain what we believe to be an appropriate amount of liquidity to invest in opportunities as they arise. |
| • | Highly Experienced Management Team with Demonstrable Track Record. Our highly successful, entrepreneurial senior management team has extensive experience in building companies, insurance operations, and investment management. We have assembled a management team of individuals who bring strong capabilities and experience to each facet of running our company. We are led by three well known and well respected industry executives with an average of 30 years of experience. James R. Belardi, our Chairman and founder, spent the majority of his career as the President of SunAmerica Life Insurance Company and Chief Investment Officer of AIG Retirement Services, Inc. William J. Wheeler, our President, served as President of the Americas Group and Chief Financial Officer at MetLife Inc. prior to joining our company, and Martin P. Klein, our Chief Financial Officer, was previously Chief Financial Officer of Genworth Financial, Inc. Our management team oversees the company’s activities and its day-to-day management, including through various committees designed to manage our strategic initiatives, risk appetite and investment portfolio. See “Management— Corporate Governance—Management Committees.” |
Growth Strategy
The key components of our growth strategy are as follows:
| • | Continue Organic Growth by Expanding Our Distribution Channels. We plan to grow organically by expanding our retail, reinsurance and institutional product distribution channels. We believe that we have the right people, infrastructure and scale to position us for continued growth. We aim to grow our retail channel in the United States by deepening our relationships with our approximately 60 IMOs and approximately 30,000 independent agents. Our strong financial position and capital efficient products allow us to be a dependable partner with IMOs and consistently write new business. We work with our IMOs to develop customized, and at times exclusive, products that help drive sales. |
We expect our retail channel to continue to benefit from the ratings upgrade in 2015, our improving credit profile and recent product launches. We believe this should support growth in sales at our desired cost of crediting through increased volumes via current IMOs and access to new distribution channels, including small to mid-sized banks and regional broker-dealers. We are implementing the necessary technology platform, hiring and training a specialized sales force, and have created products to capture new potential distribution opportunities.
Our reinsurance channel also benefited from the 2015 ratings upgrade. We target reinsurance business consistent with our preferred liability characteristics, and as such, reinsurance provides another opportunistic channel for us to source long-term liabilities with attractive crediting rates. For the nine months ended September 30, 2016, we generated deposits through our flow reinsurance channel of $3.1 billion, while for the full year of 2015, we generated deposits of $1.1 billion, up from $167 million in 2013. We expect to grow this channel further as we continue to add new partners, some of which prefer to do business with higher rated counterparties such as us.
12
Table of Contents
In addition, after having sold our first funding agreement under our FABN program in 2015, we expect to grow our institutional products channel over time. Lastly, we are in the process of developing our capabilities to undertake pension risk transfer transactions.
| • | Pursue Attractive Acquisitions. We plan to continue leveraging our expertise in sourcing and evaluating transactions to grow our business profitably. From our founding through September 30, 2016, we have grown to $71.6 billion in invested assets and $70.9 billion in reserve liabilities, primarily through acquisitions and block reinsurance transactions. We believe that our demonstrated ability to successfully consummate complex transactions, as well as our relationship with Apollo, provide us with distinct advantages relative to other acquirers and reinsurance companies. Furthermore, our business has achieved sufficient scale to provide meaningful operational synergies for the businesses and blocks of business that we acquire. Consequently, we believe we are often sought out by companies looking to transact in the acquisitions and block reinsurance markets. |
| • | Expand Our Product Offering and International Presence. Our efforts to date have focused on developing and sourcing retirement savings products and we are continuing such efforts by expanding our retail product offerings. On April 11, 2016, we launched our largest new retail product initiative, whereby we: (1) enhanced our most popular accumulation product, “Performance Elite,” with two new indices, (2) announced a new MYGA product designed for the bank and broker-dealer channel and (3) introduced an income-focused product, “Ascent Pro.” With the introduction of our new MYGA product and Ascent Pro, our retail channel is now competing in a much broader segment of the overall retirement market. For the six months ended September 30, 2016, new MYGA sales in the IMO and financial institution channels were $456 million and Ascent Pro sales were $1.0 billion. See “Business—Products.” |
Additionally, while our organic growth initiatives and acquisitions have largely been focused on opportunities in the United States, our recent acquisition of Delta Lloyd Deutschland AG (“DLD,” now known as Athene Deutschland GmbH, “AD”) has demonstrated the geographic scalability of our strategy and our ability to capitalize quickly on international market environments as well. While we continue to believe that the European market provides a compelling growth opportunity to amass liabilities at one of the most favorable costs of funding in a number of years, we have come to realize that the opportunity over the next several years is larger than we initially anticipated. We have concluded that, in order to fully capitalize on this opportunity, we would need to commit capital to the European market at a level in excess of our targeted investment size, creating the need for third party capital to support growth. See “Business—Products—German Products—AGER Equity Offering.”
Recently, we have also been developing our capabilities to undertake pension risk transfer transactions. Pension risk transfer transactions usually involve the issuance of a group annuity contract, typically through a separate account, in exchange for the transfer of pension liabilities from a terminating defined benefit plan. U.S. pension liabilities are estimated to be $2 to $3 trillion with an estimated $1 trillion of liabilities that may become available for closeout, with approximately $15 to $20 billion of expected annual closeout activity over the next several years. Typically, each year, there are various small transactions in which a single insurer takes all of the pension liabilities of a company, and a few “jumbo” transactions in which the liabilities of one or more large plan or affiliated plans may be shared among multiple annuity writers to enable the plan fiduciaries to diversify their risk. We are focused on the latter category through which: (i) we believe we can achieve significant growth while engaging in fewer transactions; (ii) the risk is shared with the largest of the industry participants; and (iii) our marginal costs are lower. We believe that we can leverage our sourcing expertise to underwrite these transactions and maintain our focus on writing profitable new business.
| • | Leverage Our Unique Relationship with Apollo and AAM. We intend to continue leveraging our unique relationship with Apollo and AAM to source high-quality assets with attractive risk-adjusted |
13
Table of Contents
| returns. Apollo’s global scale and reach provide us with broad market access across environments and geographies and allow us to actively source assets that exhibit our preferred risk and return characteristics. For instance, through our relationship with Apollo and AAM, we have indirectly invested in companies including MidCap FinCo Limited (“MidCap”) and AmeriHomeMortgage Company, LLC (“AmeriHome”). In 2013, Apollo presented us with an opportunity to fund the acquisition of MidCap, a middle-market lender focused on asset-backed loans, leveraged loans, real estate, rediscount loans and venture loans. Our equity investment in MidCap provides us with an alternative investment that meets the key characteristics we look for including an attractive risk-return profile. Our equity investment in MidCap is held indirectly through an investment fund, AAA Investments (Co-Invest VII), L.P. (“Co-Invest VII”), of which MidCap constituted 99% of the investments of such fund. Co-Invest VII returned an annualized net investment earned rate of 10.93% and 15.98% for the nine months ended September 30, 2016 and for the year ended December 31, 2015, respectively. As of September 30, 2016, our equity investment and loans to Midcap were valued at $511 million and $237 million, respectively. |
Similarly, in 2013, AAM proposed that Athene and an Apollo co-investor fund and launch AmeriHome, a mortgage lender and servicer with expertise in mortgage industry fundamentals that we believe are key to operating a successful and sustainable mortgage lender/servicer. Like our investment in MidCap, our equity investment in AmeriHome meets the key characteristics we look for in an alternative investment. Our equity investment in AmeriHome is held indirectly through an investment fund, A-A Mortgage Opportunities, L.P. (“A-A Mortgage”), and AmeriHome is currently A-A Mortgage’s only investment. Abiding by its core principles, AmeriHome has grown profitably, with A-A Mortgage returning an annualized net investment earned rate of 13.40% and 14.05% for the nine months ended September 30, 2016 and for the year ended December 31, 2015, respectively. As of September 30, 2016, our equity investment in A-A Mortgage was valued at $379 million.
| • | Dynamic Approach to Asset Allocation during Market Dislocations. As we have done successfully in the past, we plan to fully capitalize on future market dislocations to opportunistically reposition our portfolio to capture incremental yield. For example, during 2009-2010, we reinvested a significant portion of our portfolio into RMBS. Additionally, regulatory changes in the wake of the financial crisis have made it more expensive for banks and other traditional lenders to hold certain illiquid and complex assets, notwithstanding the fact that these assets may have prudent credit characteristics. This change in demand has provided opportunities for investors to acquire high-quality assets that offer attractive returns. For example, we see emerging opportunities as banks retreat from direct mortgage lending, structured and asset-backed products, and middle-market commercial loans. We intend to maintain a flexible approach to asset allocation, which will allow us to act quickly on similar opportunities that may arise in the future across a wide variety of asset types. |
| • | Maintain Risk Management Discipline. Our risk management strategy is to proactively manage our exposure to risks associated with interest rate duration, credit risk and structural complexity of our invested assets. We address interest rate duration and liquidity risks through managing the duration of the liabilities we source with the assets we acquire, and through ALM modeling. We assess credit risk by modeling our liquidity and capital under a range of stress scenarios. We manage the risks related to the structural complexity of our invested assets through AAM’s modeling efforts. The goal of our risk management discipline is to be able to continue growth and to achieve profitable results across various market environments. |
Additional Information
Athene is an exempted company organized under the laws of Bermuda. Our principal executive offices are located at Chesney House, First Floor, 96 Pitts Bay Road, Pembroke, HM08, Bermuda, and our telephone
14
Table of Contents
number is (441) 279-8400. Our website address is www.athene.com. Information contained on our website or connected thereto does not constitute a part of, and is not incorporated by reference into, this prospectus or the registration statement of which it forms a part.
Summary Risk Factors
An investment in our common shares involves numerous risks described in “Risk Factors” and elsewhere in this prospectus. You should carefully consider these risks before making an investment in our Class A common shares. Key risks include, but are not limited to, the following:
| • | our business, financial condition, liquidity, results of operations and cash flows depend on the accuracy of our management’s assumptions and estimates, and we could face significant losses if these assumptions and estimates differ significantly from actual results; |
| • | the amount of statutory capital that our insurance and reinsurance subsidiaries have can vary significantly from time to time and is sensitive to a number of factors outside of our control; |
| • | interest rate fluctuations could adversely affect our business, financial condition, liquidity, results of operations and cash flows; |
| • | we may want or need additional capital in the future and such capital may not be available to us on favorable terms or at all due to volatility in the equity or credit markets, adverse economic conditions or our creditworthiness; |
| • | if we do not manage our growth effectively, our financial performance could be adversely affected; our historical growth rates may not be indicative of our future growth; |
| • | if our risk management policies and procedures, which include the use of derivatives and reinsurance, are not adequate to protect us, we may be exposed to unidentified, unanticipated or inadequately managed risks; |
| • | we operate in a highly competitive industry that includes a number of competitors, many of which are larger and more well-known than we are, which could limit our ability to achieve our growth strategies and could materially and adversely affect our business, financial condition, results of operations, cash flows and prospects; |
| • | we are subject to general economic conditions, including prevailing interest rates, levels of unemployment and financial and equity and credit market performance, which may affect, among other things, our ability to sell our products, the fair value of our investments and whether such investments become impaired and the surrender rate and profitability of our policies; |
| • | our investments are subject to market and credit risks that could diminish their value and these risks could be greater during periods of extreme volatility or disruption in the financial and credit markets, which could adversely impact our business, financial condition, liquidity and results of operations; |
| • | our investments linked to real estate are subject to credit, market and servicing risk which could diminish the value that we obtain from such investments; |
| • | many of our invested assets are relatively illiquid and we may fail to realize profits from these assets for a considerable period of time, or lose some or all of the principal amount we invest in these assets if we are required to sell our invested assets at a loss at inopportune times to cover policyholder withdrawals or to meet our insurance, reinsurance or other obligations; |
| • | our investment portfolio may be subject to concentration risk, particularly with regards to our investments in MidCap, AmeriHome and real estate; |
15
Table of Contents
| • | our investment portfolio may include investments in securities of issuers based outside the United States, including emerging markets, which may be riskier than securities of U.S. issuers; |
| • | we previously identified material weaknesses in our internal control over financial reporting and if we fail to maintain effective internal control over financial reporting, we may not be able to accurately report our consolidated financial results; |
| • | our growth strategy includes acquiring business through acquisitions of other insurance companies and reinsurance of insurance obligations written by unaffiliated insurance companies, and our ability to consummate these acquisitions on economically advantageous terms acceptable to us in the future is unknown; |
| • | we may not be able to successfully integrate future acquisitions and such acquisitions may result in greater risks to us, our business, financial condition, results of operations, cash flows and prospects; |
| • | a financial strength rating downgrade, potential downgrade or any other negative action by a rating agency could make our product offerings less attractive, inhibit our ability to acquire future business through acquisitions or reinsurance and increase our cost of capital, which could have a material adverse effect on our business; |
| • | we are subject to significant operating and financial restrictions imposed by our credit agreement; |
| • | we are subject to the credit risk of our counterparties, including ceding companies who reinsure business to ALRe, reinsurers who assume liabilities from our subsidiaries and derivative counterparties; |
| • | we rely significantly on third parties for investment services and certain other services related to our policies, and we may be held responsible for obligations that arise from the acts or omissions of third parties under their respective agreements with us if they are deemed to have acted on our behalf; |
| • | the vote by the United Kingdom mandating its withdrawal from the European Union (“EU”) could have an adverse effect on our business and investments; |
| • | interruption or other operational failures in telecommunications, information technology and other operational systems or a failure to maintain the security, integrity, confidentiality or privacy of sensitive data residing on those systems, including as a result of human error, could have a material adverse effect on our business; |
| • | we may be the target or subject of, and may be required to defend against or respond to, litigation (including class action litigation), enforcement investigations or regulatory scrutiny; |
| • | the historical performance of AAM and Apollo Asset Management Europe, LLP (together with certain of its affiliates, “AAME”) should not be considered as indicative of the future results of our investment portfolio, our future results or any returns expected on our common shares; |
| • | if either AAM or AAME loses or fails to retain its senior executives or other key personnel and is unable to attract qualified personnel, its ability to provide us with investment management and advisory services could be impeded or adversely affected, which could significantly and negatively affect our business; |
| • | increased regulation or scrutiny of alternative investment advisers and certain trading methods may affect AAM’s and AAME’s ability to manage our investment portfolio or affect our business reputation; |
| • | our industry is highly regulated and we are subject to significant legal restrictions, regulations and regulatory oversight in connection with the operations of our business, including the discretion of various governmental entities in applying such restrictions and regulations and these restrictions may have a material adverse effect on our business, financial condition, liquidity, results of operations, cash flows and prospects; |
16
Table of Contents
| • | our failure to obtain or maintain approval of insurance regulators and other regulatory authorities as required for the operations of our insurance subsidiaries may have a material adverse effect on our business, financial condition, results of operations and prospects; |
| • | changes in the laws and regulations governing the insurance industry or otherwise applicable to our business, including the newly-issued DOL fiduciary regulation, may have a material adverse effect on our business, financial condition, liquidity, results of operations and prospects; |
| • | AHL or ALRe may be subject to U.S. federal income taxation; |
| • | U.S. persons who own our Class A common shares may be subject to U.S. federal income taxation at ordinary rates on our undistributed earnings and profits; |
| • | U.S. persons who own our Class A common shares may be subject to U.S. federal income taxation at ordinary income rates on a disproportionate share of our undistributed earnings and profits attributable to related person insurance income (“RPII”); |
| • | the interest of the Apollo Group, which controls and is expected to continue to control 45% of the total voting power of AHL and holds a number of the seats on our board of directors, may conflict with those of other shareholders and could make it more difficult for you and other shareholders to influence significant corporate decisions; |
| • | our bye-laws contain provisions that cause a holder of Class A common shares to lose the right to vote the shares if the holder owns an equity interest in Apollo, AP Alternative Assets, L.P. (“AAA”), or certain other entities; |
| • | our bye-laws contain provisions that could discourage takeovers and business combinations that our shareholders might consider in their best interests, including provisions that prevent a holder of Class A common shares from having a significant stake in Athene; and |
| • | other risks and factors listed under “Risk Factors” and elsewhere in this prospectus. |
Organizational Chart
Below is an organizational chart that summarizes our ownership and corporate structure. We have two classes of voting shares outstanding, Class A common shares and Class B common shares. Each such Class A common share and Class B common share is economically equivalent – the dollar value of one Class A common share is equivalent to the dollar value of one Class B common share. However, Class A common shares and Class B common shares differ in terms of voting power. The Class A common shares currently account for 55% of our aggregate voting power and the Class B common shares currently account for the remaining 45% of our aggregate voting power. The Class B common shares are held by members of the Apollo Group, which includes funds managed by affiliates of Apollo, and accordingly, the Apollo Group beneficially owns or exercises voting control over all of the Class B common shares. Holders of the Class B common shares may convert any or all of their Class B common shares into Class A common shares on a one-to-one basis, at any time, including upon a sale of their shares (subject to any applicable lock-up restrictions), upon notice to us. So long as any member of the Apollo Group owns at least one Class B common share, such member will still be able to assert voting control over 45% of our aggregate voting power. See “Description of Share Capital—Common Shares—Voting Rights.”
As a result of certain regulatory and tax limitations, our bye-laws prohibit holders of Class A common shares and their Control Groups (as defined herein) and certain other classes of common shares (other than those owned by the Apollo Group) from having more than 9.9% of the total voting power of our common shares. Any amounts in excess of such 9.9% will be reallocated proportionately among all other of our Class A common shareholders who were not members of the relevant Control Group so long as such reallocation does not cause such other shareholder or its related Control Group to hold more than 9.9% of the total voting power of our shares. See “Description of Share Capital—Common Shares—Voting Rights—Class A Common Shares.”
17
Table of Contents
AAM acts as the investment manager to our U.S. and Bermuda companies. AAME acts as the investment adviser to our German subsidiaries.
The dotted lines connecting AAM to AHL and certain of its subsidiaries and the dashed line connecting AAME to Athene Deutschland Holding GmbH & Co. KG (“ADKG”) denote our investment management and advisory relationships, respectively.
The ownership percentages shown reflect our percentage ownership prior to the offering and prior to giving effect to a conditional dividend of Athene Class B common shares that was declared by the board of directors of the general partner of AAA on November 7, 2016.(1)(2)
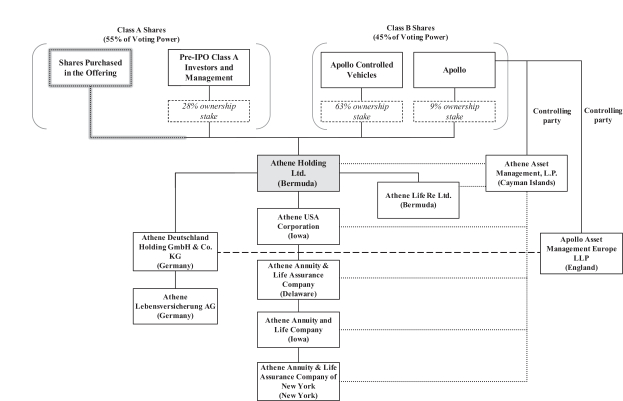
| (1) | The organizational chart shows AHL and its material insurance company and holding company subsidiaries and omits certain of its subsidiaries, including certain insurance companies and intermediate holding companies. For a complete list of subsidiaries of AHL, please see Exhibit 21.1 to the registration statement of which this prospectus is a part. |
| (2) | The ownership structure of AHL shown in the organizational chart is representational only and does not include the names of the direct or beneficial owners of our common shares. On November 8, 2016, AAA announced the declaration of a conditional distribution of common shares of Athene held by AAA to its unitholders. On November 7, 2016, the board of directors of the general partner of AAA approved a conditional distribution of 10,766,297 Athene Class B common shares in the aggregate, constituting 12.5% of the total 86,130,377 of Class B common shares beneficially owned by AAA. The distribution is conditional upon the pricing of this offering. The Class B common shares distributed by AAA will automatically become Class A common shares upon distribution to unitholders unless a unitholder is a member of the Apollo Group. For more information about the beneficial owners of our common shares, please see “Principal and Selling Shareholders.” |
18
Table of Contents
| The Offering | ||
| Class A common shares offered by the selling shareholders in this offering | Class A common shares (plus up to an additional Class A common shares that the selling shareholders may sell upon the exercise of the underwriters’ option to purchase additional Class A common shares). | |
| Class A common shares outstanding as of , 2016 | shares | |
| Class B common shares outstanding as of , 2016 | shares | |
| Class M common shares outstanding as of , 2016 | shares | |
| Voting Rights | The Class A common shares collectively represent 55% of the total voting power of our common shares, subject to certain voting restrictions and adjustments. The Class B common shares, which are beneficially owned by members of the Apollo Group, represent, in aggregate, 45% of the total voting power of our common shares, subject to certain adjustments. Our Class A common shares may be subject to a cap of the voting power attributable to such shares or may be deemed to be non-voting depending upon whether a holder of such shares is subject to the restrictions set forth in our bye-laws. See “Description of Share Capital—Common Shares—Voting Rights.” | |
| Use of proceeds |
We will not receive any proceeds from the sale of the selling shareholders’ Class A common shares. | |
| Conflicts of Interest |
Apollo Global Securities, LLC (“AGS”) is an underwriter in this offering and is an affiliate of entities controlled by or affiliated with Apollo, which beneficially own more than 10% of our outstanding common equity and which may receive 5% or more of the net proceeds of this offering. Accordingly, AGS is deemed to have a “conflict of interest” within the meaning of Rule 5121 of the Financial Industry Regulatory Authority, Inc. (“FINRA”). Accordingly, this offering will be made in compliance with the applicable provisions of FINRA Rule 5121. See “Underwriting (Conflicts of Interest).” | |
19
Table of Contents
| Dividend policy | We do not currently pay dividends on any of our common shares and we currently intend to retain all available funds and any future earnings for use in the operation of our business. We may, however, pay cash dividends on our common shares, including our Class A common shares, in the future. Any future determination to pay dividends will be made at the discretion of our board of directors and will depend upon many factors, including our financial condition, earnings, legal and regulatory requirements, restrictions in our debt agreements and other factors our board of directors deems relevant. See “Dividend Policy” and “Description of Certain Indebtedness—Credit Facility.” | |
| Proposed New York Stock Exchange symbol | We intend to apply to list our Class A common shares on the New York Stock Exchange (“NYSE”) under the symbol “ATH.” | |
20
Table of Contents
Summary Historical Consolidated Financial and Operating Data
The following tables set forth our summary historical consolidated financial and operating data. The summary historical consolidated financial data as of September 30, 2016, and for the nine months ended September 30, 2016 and 2015, have been derived from our historical unaudited condensed consolidated financial statements and notes thereto included elsewhere in this prospectus. The summary historical consolidated financial data, as it relates to each of the years from 2011 through 2015, has been derived from our annual financial statements. The summary historical consolidated financial data as of December 31, 2015 and 2014, and each of the three years in the period ended December 31, 2015, have been derived from our historical audited consolidated financial statements and notes thereto included elsewhere in this prospectus. Our historical results are not necessarily indicative of future operating results and the results for any interim period are not necessarily indicative of the results that may be expected for a full fiscal year.
You should read this information in conjunction with the sections entitled “Selected Historical Consolidated Financial and Operating Data” and “Management’s Discussion and Analysis of Financial Condition and Results of Operations,” and our consolidated financial statements and notes thereto and the consolidated financial statements of Aviva USA and notes thereto, in each case, included elsewhere in this prospectus.
21
Table of Contents
Summary historical consolidated financial and operating data are as follows (dollars in millions, except per share data):
| Nine months ended September 30, | Years ended December 31, | |||||||||||||||||||||||||||
| 2016(2) | 2015 | 2015(1)(2) | 2014 | 2013(1) | 2012(1) | 2011(1) | ||||||||||||||||||||||
| Consolidated Statements of Income Data: |
||||||||||||||||||||||||||||
| Total revenues |
$ | 3,045 | $ | 1,571 | $ | 2,616 | $ | 4,100 | $ | 1,749 | $ | 1,017 | $ | (857 | ) | |||||||||||||
| Total benefits and expenses |
2,678 | 1,199 | 2,024 | 3,568 | 760 | 653 | (860 | ) | ||||||||||||||||||||
| Income before income taxes |
367 | 372 | 592 | 532 | 989 | 365 | 3 | |||||||||||||||||||||
| Net income available to AHL shareholders |
437 | 320 | 562 | 463 | 916 | 377 | — | |||||||||||||||||||||
| Operating income (loss), net of tax (a non-GAAP measure) |
476 | 496 | 740 | 793 | 777 | 232 | (9 | ) | ||||||||||||||||||||
| ROE |
9.4 | % | 8.5 | % | 11.3 | % | 12.7 | % | 39.6 | % | 30.0 | % | (0.1 | )% | ||||||||||||||
| ROE excluding AOCI (a non-GAAP measure) |
9.9 | % | 9.2 | % | 11.8 | % | 14.0 | % | 42.2 | % | 32.9 | % | (0.1 | )% | ||||||||||||||
| Operating ROE excluding AOCI (a non-GAAP measure) |
10.8 | % | 14.3 | % | 15.6 | % | 24.0 | % | 35.8 | % | 20.3 | % | (1.8 | )% | ||||||||||||||
| Earnings (loss) per share on Class A and Class B common shares: |
||||||||||||||||||||||||||||
| Basic |
$ | 2.35 | $ | 1.87 | $ | 3.21 | $ | 3.58 | $ | 8.07 | $ | 5.59 | $ | (0.01 | ) | |||||||||||||
| Diluted |
$ | 2.35 | $ | 1.87 | $ | 3.21 | $ | 3.52 | $ | 7.96 | $ | 5.59 | $ | (0.01 | ) | |||||||||||||
| Operating earnings (loss) per share on Class A and Class B common shares (a non-GAAP measure): |
||||||||||||||||||||||||||||
| Diluted |
$ | 2.56 | $ | 2.89 | $ | 4.23 | $ | 6.03 | $ | 6.75 | $ | 3.45 | $ | (0.22 | ) | |||||||||||||
| Weighted average Class A and Class B common shares outstanding: |
||||||||||||||||||||||||||||
| Basic |
185,924,524 | 171,457,313 | 175,091,802 | 129,519,108 | 113,506,457 | 67,343,297 | 41,434,233 | |||||||||||||||||||||
| Diluted |
186,016,862 | 171,513,944 | 175,178,648 | 131,608,464 | 115,110,030 | 67,343,297 | 41,434,233 | |||||||||||||||||||||
| Retirement Services Data: |
||||||||||||||||||||||||||||
| Operating income, net of tax (a non-GAAP measure) |
$ | 563 | $ | 513 | $ | 769 | $ | 764 | $ | 416 | N/A | (3) | N/A | (3) | ||||||||||||||
| Operating ROE excluding AOCI (a non-GAAP measure) |
17.5 | % | 20.9 | % | 22.7 | % | 32.2 | % | 23.2 | % | N/A | (3) | N/A | (3) | ||||||||||||||
| Investment margin on deferred annuities (a non-GAAP measure) |
2.68 | % | 2.39 | % | 2.45 | % | 2.32 | % | 2.98 | % | N/A | (3) | N/A | (3) | ||||||||||||||
22
Table of Contents
| September 30, 2016(2) | December 31, | |||||||||||||||||||||||
| 2015(1)(2) | 2014 | 2013(1) | 2012(1) | 2011(1) | ||||||||||||||||||||
| Consolidated Balance Sheet Data: |
||||||||||||||||||||||||
| Investments, including related parties |
$ | 73,077 | $ | 64,525 | $ | 60,631 | $ | 58,156 | $ | 13,911 | $ | 9,364 | ||||||||||||
| Investments of consolidated variable interest entities |
837 | 1,565 | 3,409 | 4,348 | 2,478 | 941 | ||||||||||||||||||
| Total assets |
87,000 | 80,854 | 82,710 | 80,807 | 19,315 | 13,475 | ||||||||||||||||||
| Interest sensitive contract liabilities |
60,901 | 57,296 | 60,641 | 60,386 | 13,264 | 10,357 | ||||||||||||||||||
| Future policy benefits |
15,087 | 14,540 | 11,137 | 10,712 | 2,462 | 1,467 | ||||||||||||||||||
| Notes payable, including related party notes payable |
— | — | — | 351 | 153 | 40 | ||||||||||||||||||
| Borrowings of consolidated variable interest entities |
— | 500 | 2,017 | 2,413 | 1,225 | 725 | ||||||||||||||||||
| Total liabilities |
79,926 | 75,491 | 78,122 | 77,952 | 17,452 | 12,826 | ||||||||||||||||||
| Total AHL shareholders’ equity |
7,073 | 5,362 | 4,555 | 2,761 | 1,863 | 648 | ||||||||||||||||||
| Book value per share |
$ | 38.00 | $ | 28.81 | $ | 32.29 | $ | 23.99 | $ | 16.61 | $ | 10.92 | ||||||||||||
| Book value per share, excluding AOCI (a non-GAAP measure) |
$ | 33.06 | $ | 30.09 | $ | 27.73 | $ | 23.39 | $ | 14.66 | $ | 10.87 | ||||||||||||
| Class A and Class B common shares outstanding |
186,166,905 | 186,115,240 | 141,035,628 | 115,099,947 | 112,088,679 | 59,318,698 | ||||||||||||||||||
| (1) | Reflects the acquisition of DLD from October 1, 2015, the acquisition of Aviva USA from October 2, 2013, the acquisition of Presidential Life Corporation from December 28, 2012, the acquisition of Investors Insurance Corporation from July 18, 2011 and the acquisition of AADE (formerly known as Liberty Life Insurance Corporation (“Liberty Life”)) from April 29, 2011. |
| (2) | Effective August 1, 2015, Athene Annuity and Life Company (formerly known as Aviva Life and Annuity Company, “AAIA”) agreed to novate certain open blocks of business ceded to Accordia Life and Annuity Insurance Company (formerly known as Presidential Life Insurance Company – USA, “Accordia”), an affiliate of Global Atlantic Financial Group Limited (“Global Atlantic”), and amended portions of reinsurance agreements between Athene Life Insurance Company of New York (“ALICNY,” formerly known as Aviva Life and Annuity Company of New York, “ALACNY”) and First Allmerica Financial Life Insurance Company (“FAFLIC”), an affiliate of Global Atlantic, which changed the reinsurance agreements from funds withheld coinsurance to coinsurance agreements. Refer to “Note 6 – Reinsurance” to our unaudited condensed consolidated financial statements and notes thereto and “Note 9 – Reinsurance” to our audited consolidated financial statements and notes thereto included elsewhere in this prospectus. |
| (3) | Prior to 2013, we did not operate our business under reporting segments and instead the company was operated as a single operating segment. Therefore, there was no segment operating results during 2012 or 2011. |
Non-GAAP Measures
In addition to our results presented in accordance with GAAP, our results of operations include certain non-GAAP measures commonly used in our industry. Management believes the use of these non-GAAP measures, together with the relevant GAAP measures, provides a better understanding of our results of operations and the underlying profitability drivers of our business. The majority of these non-GAAP measures are intended to remove the effect of market volatility from our results of operations (other than with respect to alternative investments) as well as integration, restructuring and certain other expenses which are not part of our underlying profitability drivers or likely to re-occur in the foreseeable future, as such items fluctuate from period-to-period in a manner inconsistent with these drivers. These measures should be considered supplementary to our results in accordance with GAAP and should not be viewed as a substitute for the GAAP measures. See “Management’s Discussion and Analysis of Financial Condition and Results of Operations—Key Operating and Non-GAAP Measures” for additional discussions regarding non-GAAP measures.
23
Table of Contents
The following are reconciliations of operating income (loss), net of tax, and operating earnings (loss) per share on Class A common shares and Class B common shares to their corresponding GAAP measures, net income available to AHL shareholders and diluted earnings per share on Class A common shares and Class B common shares, respectively, for the periods presented below (dollars in millions, except per share data):
| Nine months ended September 30, |
Years ended December 31, | |||||||||||||||||||||||||||
| 2016 | 2015 | 2015 | 2014 | 2013 | 2012 | 2011 | ||||||||||||||||||||||
| Operating income (loss), net of tax |
$ | 476 | $ | 496 | $ | 740 | $ | 793 | $ | 777 | $ | 232 | $ | (9) | ||||||||||||||
|
|
|
|
|
|
|
|
|
|
|
|
|
|
|
|||||||||||||||
| Non-operating adjustments |
||||||||||||||||||||||||||||
| Investment gains (losses), net of offsets |
97 | (20) | (56) | 151 | (4) | 228 | (96) | |||||||||||||||||||||
| Change in fair values of derivatives and embedded derivatives – FIAs, net of offsets |
(82) | (92) | (27) | (30) | 154 | (38) | (20) | |||||||||||||||||||||
| Integration, restructuring and other non-operating expenses |
(8) | (31) | (58) | (279) | (184) | (38) | — | |||||||||||||||||||||
| Stock compensation expense |
(59) | (51) | (67) | (148) | — | — | — | |||||||||||||||||||||
| Bargain purchase gain |
— | — | — | — | 152 | (2) | 128 | |||||||||||||||||||||
| Provision for income taxes – non-operating |
13 | 18 | 30 | (24) | 21 | (5) | (3) | |||||||||||||||||||||
|
|
|
|
|
|
|
|
|
|
|
|
|
|
|
|||||||||||||||
| Total non-operating adjustments |
(39) | (176) | (178) | (330) | 139 | 145 | 9 | |||||||||||||||||||||
|
|
|
|
|
|
|
|
|
|
|
|
|
|
|
|||||||||||||||
| Net income available to AHL shareholders |
$ | 437 | $ | 320 | $ | 562 | $ | 463 | $ | 916 | $ | 377 | $ | — | ||||||||||||||
|
|
|
|
|
|
|
|
|
|
|
|
|
|
|
|||||||||||||||
| Segment Data: |
||||||||||||||||||||||||||||
| Retirement Services |
$ | 563 | $ | 513 | $ | 769 | $ | 764 | $ | 416 | ||||||||||||||||||
| Corporate and Other |
(87) | (17) | (29) | 29 | 361 | |||||||||||||||||||||||
|
|
|
|
|
|
|
|
|
|
|
|||||||||||||||||||
| Operating income, net of tax |
$ | 476 | $ | 496 | $ | 740 | $ | 793 | $ | 777 | ||||||||||||||||||
|
|
|
|
|
|
|
|
|
|
|
|||||||||||||||||||
24
Table of Contents
| Nine months ended September 30, |
Years ended December 31, | |||||||||||||||||||||||||||
| 2016 | 2015 | 2015 | 2014 | 2013 | 2012 | 2011 | ||||||||||||||||||||||
| Operating earnings (loss) per share - Class A and Class B common shares |
||||||||||||||||||||||||||||
| Diluted |
$ | 2.56 | $ | 2.89 | $ | 4.23 | $ | 6.03 | $ | 6.75 | $ | 3.45 | $ | (0.22) | ||||||||||||||
|
|
|
|
|
|
|
|
|
|
|
|
|
|
|
|||||||||||||||
| Non-operating adjustments |
||||||||||||||||||||||||||||
| Investment gains (losses), net of offsets |
0.53 | (0.11) | (0.33) | 1.15 | (0.03) | 3.38 | (2.31) | |||||||||||||||||||||
| Change in fair values of derivatives and embedded derivatives – FIAs, net of offsets |
(0.45) | (0.54) | (0.15) | (0.24) | 1.33 | (0.56) | (0.48) | |||||||||||||||||||||
| Integration, restructuring and other non-operating expenses |
(0.05) | (0.18) | (0.33) | (2.12) | (1.61) | (0.57) | — | |||||||||||||||||||||
| Stock compensation expense |
(0.32) | (0.30) | (0.38) | (1.12) | — | — | — | |||||||||||||||||||||
| Bargain purchase gain |
— | — | — | — | 1.33 | (0.03) | 3.09 | |||||||||||||||||||||
| Provision for income taxes – non-operating |
0.08 | 0.11 | 0.17 | (0.18) | 0.19 | (0.08) | (0.09) | |||||||||||||||||||||
|
|
|
|
|
|
|
|
|
|
|
|
|
|
|
|||||||||||||||
| Total non-operating adjustments |
(0.21) | (1.02) | (1.02) | (2.51) | 1.21 | 2.14 | 0.21 | |||||||||||||||||||||
|
|
|
|
|
|
|
|
|
|
|
|
|
|
|
|||||||||||||||
| Earnings (loss) per share - Class A and Class B common shares |
||||||||||||||||||||||||||||
| Diluted |
$ | 2.35 | $ | 1.87 | $ | 3.21 | $ | 3.52 | $ | 7.96 | $ | 5.59 | $ | (0.01) | ||||||||||||||
|
|
|
|
|
|
|
|
|
|
|
|
|
|
|
|||||||||||||||
The following is a reconciliation of total AHL shareholders’ equity excluding AOCI, which is used in calculating ROE excluding AOCI, to its corresponding GAAP measure, total AHL shareholders’ equity, for the periods presented (dollars in millions):
| September 30, | December 31, | |||||||||||||||||||||||||||
| 2016 | 2015 | 2015 | 2014 | 2013 | 2012 | 2011 | ||||||||||||||||||||||
| Total AHL shareholders’ equity excluding AOCI |
$ | 6,153 | $ | 5,350 | $ | 5,599 | $ | 3,911 | $ | 2,691 | $ | 1,644 | $ | 645 | ||||||||||||||
| AOCI |
920 | 161 | (237) | 644 | 70 | 219 | 3 | |||||||||||||||||||||
|
|
|
|
|
|
|
|
|
|
|
|
|
|
|
|||||||||||||||
| Total AHL shareholders’ equity |
$ | 7,073 | $ | 5,511 | $ | 5,362 | $ | 4,555 | $ | 2,761 | $ | 1,863 | $ | 648 | ||||||||||||||
|
|
|
|
|
|
|
|
|
|
|
|
|
|
|
|||||||||||||||
| Segment Data: |
||||||||||||||||||||||||||||
| Retirement Services |
$ | 4,584 | $ | 3,738 | $ | 3,974 | $ | 2,807 | $ | 1,941 | ||||||||||||||||||
| Corporate and Other |
1,569 | 1,612 | 1,625 | 1,104 | 750 | |||||||||||||||||||||||
|
|
|
|
|
|
|
|
|
|
|
|||||||||||||||||||
| Total AHL shareholders’ equity excluding AOCI |
$ | 6,153 | $ | 5,350 | $ | 5,599 | $ | 3,911 | $ | 2,691 | ||||||||||||||||||
|
|
|
|
|
|
|
|
|
|
|
|||||||||||||||||||
25
Table of Contents
The following is Retirement Services’ investment margin and its components, net investment earned rate and cost of crediting, each reconciled to their corresponding GAAP measure, net investment income and interest sensitive contract benefits, respectively, for the period presented below (dollars in millions):
| Nine months ended September 30, | Years ended December 31, | |||||||||||||||||||||||||||||||||||||||
| 2016 | 2015 | 2015 | 2014 | 2013 | ||||||||||||||||||||||||||||||||||||
| Dollar | Rate | Dollar | Rate | Dollar | Rate | Dollar | Rate | Dollar | Rate | |||||||||||||||||||||||||||||||
| Retirement Services: |
||||||||||||||||||||||||||||||||||||||||
| Net investment earned rate |
4.65% | 4.31% | 4.37% | 4.26% | 5.40% | |||||||||||||||||||||||||||||||||||
| Cost of crediting on deferred annuities |
1.97% | 1.92% | 1.92% | 1.94% | 2.42% | |||||||||||||||||||||||||||||||||||
|
|
|
|
|
|
|
|
|
|
|
|||||||||||||||||||||||||||||||
| Investment margin on deferred annuities |
2.68% | 2.39% | 2.45% | 2.32% | 2.98% | |||||||||||||||||||||||||||||||||||
|
|
|
|
|
|
|
|
|
|
|
|||||||||||||||||||||||||||||||
| Retirement Services |
$ | 2,162 | 4.65% | $ | 1,897 | 4.31% | $ | 2,572 | 4.37% | $ | 2,483 | 4.26% | $ | 1,363 | 5.40% | |||||||||||||||||||||||||
| Corporate and Other |
28 | 0.53% | 21 | 1.90% | 36 | 1.38% | 55 | 5.91% | 367 | 49.25% | ||||||||||||||||||||||||||||||
|
|
|
|
|
|
|
|
|
|
|
|
|
|
|
|
|
|
|
|
|
|||||||||||||||||||||
| Total net investment earnings/earned rate |
2,190 | 4.23% | 1,918 | 4.25% | 2,608 | 4.24% | 2,538 | 4.29% | 1,730 | 6.66% | ||||||||||||||||||||||||||||||
|
|
|
|
|
|
|
|
|
|
|
|
|
|
|
|
|
|
|
|
|
|||||||||||||||||||||
| Reinsurance embedded derivative impacts |
(144) | (0.28)% | (58) | (0.13)% | (84) | (0.15)% | (67) | (0.10)% | (156) | (0.59)% | ||||||||||||||||||||||||||||||
| Net VIE earnings |
43 | 0.08% | (41) | (0.09)% | (67) | (0.11)% | (146) | (0.25)% | (535) | (2.06)% | ||||||||||||||||||||||||||||||
| Alternative investment (gain) loss |
35 | 0.07% | 2 | — | 42 | 0.07% | (4) | (0.01)% | 22 | 0.08% | ||||||||||||||||||||||||||||||
| Other |
19 | 0.04% | 9 | 0.02% | 9 | 0.01% | 12 | 0.02% | 13 | 0.05% | ||||||||||||||||||||||||||||||
|
|
|
|
|
|
|
|
|
|
|
|
|
|
|
|
|
|
|
|
|
|||||||||||||||||||||
| Total adjustments to arrive at net investment earnings/earned rate |
(47) | (0.09)% | (88) | (0.20)% | (100) | (0.18)% | (205) | (0.34)% | (656) | (2.52)% | ||||||||||||||||||||||||||||||
|
|
|
|
|
|
|
|
|
|
|
|
|
|
|
|
|
|
|
|
|
|||||||||||||||||||||
| GAAP net investment income |
$ | 2,143 | 4.14% | $ | 1,830 | 4.05% | $ | 2,508 | 4.06% | $ | 2,333 | 3.95% | $ | 1,074 | 4.14% | |||||||||||||||||||||||||
|
|
|
|
|
|
|
|
|
|
|
|
|
|
|
|
|
|
|
|
|
|||||||||||||||||||||
| Retirement Services average invested assets |
$ | 61,948 | $ | 58,672 | $ | 58,917 | $ | 58,284 | $ | 25,220 | ||||||||||||||||||||||||||||||
| Corporate and Other average invested assets |
7,120 | 1,442 | 2,567 | 923 | 745 | |||||||||||||||||||||||||||||||||||
|
|
|
|
|
|
|
|
|
|
|
|||||||||||||||||||||||||||||||
| Consolidated average invested assets |
$ | 69,068 | $ | 60,114 | $ | 61,484 | $ | 59,207 | $ | 25,965 | ||||||||||||||||||||||||||||||
|
|
|
|
|
|
|
|
|
|
|
|||||||||||||||||||||||||||||||
| Retirement Services cost of crediting on deferred annuities |
$ | 755 | 1.97% | $ | 702 | 1.92% | $ | 940 | 1.92% | $ | 936 | 1.94% | $ | 491 | 2.42% | |||||||||||||||||||||||||
|
|
|
|
|
|
|
|
|
|
|
|
|
|
|
|
|
|
|
|
|
|||||||||||||||||||||
| Interest credited other than deferred annuities |
89 | 0.23% | 64 | 0.17% | 94 | 0.19% | 107 | 0.22% | 41 | 0.20% | ||||||||||||||||||||||||||||||
| FIA option costs |
(416) | (1.09)% | (377) | (1.03)% | (510) | (1.04)% | (442) | (0.92)% | (131) | (0.65)% | ||||||||||||||||||||||||||||||
| Product charges (strategy fees) |
38 | 0.10% | 23 | 0.06% | 33 | 0.07% | 11 | 0.02% | 1 | —% | ||||||||||||||||||||||||||||||
| Reinsurance embedded derivative |
(21) | (0.05)% | (13) | (0.04)% | (18) | (0.04)% | (14) | (0.03)% | (13) | (0.06)% | ||||||||||||||||||||||||||||||
| Change in fair value of embedded derivatives – FIAs |
658 | 1.72% | (95) | (0.25)% | 174 | 0.36% | 1,294 | 2.68% | 699 | 3.44% | ||||||||||||||||||||||||||||||
| Negative VOBA amortization |
(36) | (0.09)% | (51) | (0.14)% | (68) | (0.14)% | (73) | (0.15)% | (33) | (0.16)% | ||||||||||||||||||||||||||||||
| Unit linked change in reserves |
1 | —% | — | —% | 27 | 0.06% | — | —% | — | —% | ||||||||||||||||||||||||||||||
| Other changes in interest sensitive contract liabilities |
— | —% | 20 | 0.05% | 18 | 0.04% | 3 | 0.01% | 9 | 0.04% | ||||||||||||||||||||||||||||||
|
|
|
|
|
|
|
|
|
|
|
|
|
|
|
|
|
|
|
|
|
|||||||||||||||||||||
| Total adjustments to arrive at cost of crediting on deferred annuities |
313 | 0.82% | (429) | (1.18)% | (250) | (0.50)% | 886 | 1.83% | 573 | 2.81% | ||||||||||||||||||||||||||||||
|
|
|
|
|
|
|
|
|
|
|
|
|
|
|
|
|
|
|
|
|
|||||||||||||||||||||
| GAAP interest sensitive contract benefits |
$ | 1,068 | 2.79% | $ | 273 | 0.74% | $ | 690 | 1.42% | $ | 1,822 | 3.77% | $ | 1,064 | 5.23% | |||||||||||||||||||||||||
|
|
|
|
|
|
|
|
|
|
|
|
|
|
|
|
|
|
|
|
|
|||||||||||||||||||||
| Average account value |
$ | 51,183 | $ | 48,881 | $ | 48,956 | $ | 48,353 | $ | 20,308 | ||||||||||||||||||||||||||||||
|
|
|
|
|
|
|
|
|
|
|
|||||||||||||||||||||||||||||||
26
Table of Contents
Investing in our common shares involves a high degree of risk, including the potential loss of all or part of your investment. Before making an investment decision to purchase our common stock, you should carefully read and consider all of the risks and uncertainties described below, as well as other information included in this prospectus, including “Management’s Discussion and Analysis of Financial Condition and Results of Operations” and the consolidated financial statements and notes thereto included elsewhere in this prospectus. The occurrence of any of the following risks or additional risks and uncertainties that are currently immaterial or unknown could materially and adversely affect our business, financial condition, liquidity, results of operations, cash flows or prospects. This prospectus also contains forward-looking statements and estimates that involve risks and uncertainties. Our actual results could differ materially from those anticipated in the forward-looking statements as a result of specific factors, including the risks and uncertainties described below. See “Special Note Regarding Forward-Looking Statements and Market Data.”
Risks Relating to Our Business
Our business, financial condition, liquidity, results of operations and cash flows depend on the accuracy of our management’s assumptions and estimates, and we could face significant losses if these assumptions and estimates differ significantly from actual results.
We make and rely on certain assumptions and estimates regarding many items, including interest rates, investment returns, expenses and operating costs, tax assets and liabilities, business mix, surrender activity, mortality and contingent liabilities, related to our business and anticipated results that affect amounts reported in our consolidated financial statements and notes thereto. We also use these assumptions and estimates to make decisions crucial to our business operations, including establishing pricing, target returns and expense structures for our insurance subsidiaries’ products, determining the amount of reserves we are required to hold for our policy liabilities, the price we will pay to acquire or reinsure business, the hedging strategies to manage risks to our business and operations and the amount of regulatory and rating agency capital that our insurance subsidiaries must hold to support their businesses. The factors influencing these business decisions cannot be predicted with certainty and if our assumptions and estimates differ significantly from actual outcomes and results, our business, financial condition, liquidity, results of operations and cash flows may be materially and adversely affected.
Insurance Products and Liabilities
Pricing of our annuity and other insurance products, whether issued by us or acquired through reinsurance or acquisitions, is based upon assumptions about persistency. A factor which may affect persistency for some of our products is the value of guaranteed minimum benefits. An increase in the value of guaranteed minimum benefits could result in our policies remaining in force longer than we have estimated, which could adversely affect our results of operations. This could be caused by extended periods of poor equity market performance and/or low interest rates, developments affecting customer perception and other factors outside our control. Alternatively, our persistency estimates could be negatively affected during periods of rising equity markets or interest rates or by other factors outside our control, which could result in fewer policies remaining in force than estimated. Therefore, our results will vary based on differences between actual and expected withdrawals from our subsidiaries’ products.
Certain of our deferred annuity products also contain optional benefit riders, including guaranteed lifetime income or death benefits, that may be exercised at certain points of time under the terms of a contract. We set prices for such products using assumptions about mortality, the rate of election of deferred annuity living benefits and other optional benefits offered to our policyholders. The profitability of these products may be lower than expected if actual policyholder utilization of these benefits varies adversely from our assumptions.
We license analytic software with actuarial modeling capabilities from third parties to facilitate the pricing of our products, make projections of our in-force business for planning purposes and objectively assess the risks
27
Table of Contents
in our subsidiaries’ insurance and reinsurance asset and liability portfolios. These actuarial models help us to measure and control risk accumulation, inform management and other stakeholders of capital requirements and manage the risk/return profile and amount of capital required to cover the risks in each of our subsidiaries’ insurance and reinsurance contracts and our overall portfolio of insurance and reinsurance contracts. However, given the inherent uncertainty of modeling techniques and the application of such techniques, these models and databases may not accurately address the emergence of a variety of matters which might impact certain of our subsidiaries’ products. Accordingly, these models may inaccurately predict the exposures that our subsidiaries are assuming and our financial results may be adversely impacted, perhaps significantly.
If emerging or actual experience deviates from our assumptions regarding any of the above factors, such deviations could have a significant effect on our reserve levels and our related results of operations and financial condition. For example, a significant portion of our in-force and newly issued products contain riders that offer guaranteed lifetime income or death benefits. These riders expose us to mortality, longevity and policyholder behavior risks. If actual utilization of certain rider benefits is adverse when compared to our estimates used in setting our reserves for future policy benefits, these reserves may prove to be inadequate and we may be required to increase them. Conversely, if policies lapse at a significantly higher rate than expected, we may need to accelerate the amortization of deferred acquisition costs (“DAC”), value of business acquired (“VOBA”) and deferred sales inducement (“DSI”) balances. More generally, deviations from our pricing expectations could result in our subsidiaries earning less of a spread between the investment income earned on our subsidiaries’ assets and the interest credited to such products and other costs incurred in servicing the products, or may require our subsidiaries to make more payments under certain products than our subsidiaries had projected. We have limited experience to date on policyholder behavior for our guaranteed minimum benefit products. As a result, future experience could deviate significantly from our assumptions. Such acceleration of expense amortization, reduced spread or increased payments could materially and adversely affect our financial condition, results of operations or cash flows.
Determination of Fair Value
As defined under GAAP, fair value is the price that would be received to sell an asset or paid to transfer a liability between market participants in the principal market or in the most advantageous market when no principal market exists. Adjustments to transaction prices or quoted market prices may be required in illiquid or disorderly markets in order to estimate fair value. Different valuation techniques may be appropriate under the circumstances to determine the value that would be received to sell an asset or paid to transfer a liability in an orderly transaction. Market participants are assumed to be independent, knowledgeable, able and willing to transact an exchange and not under duress. Nonperformance or credit risk is considered in determining fair value. Considerable judgment may be required in interpreting market data used to develop the estimates of fair value. Accordingly, estimates of fair value are not necessarily indicative of the amounts that could be realized in a current or future market exchange.
For example, the valuation of investments involves considerable judgment, is subject to considerable variability and is revised as additional information becomes available. As such, changes in, or deviations from, the assumptions used in such valuations can significantly affect our financial statements. During periods of market disruption, including periods of rapidly changing credit spreads or illiquidity, if trading becomes less frequent or market data becomes less observable, it has been and will likely continue to be difficult to value certain of our investments, such as certain of our real-estate related investments, structured products and alternative investments. There may be certain asset classes in active markets with significant observable data that could become illiquid in a difficult financial environment. Further, rapidly changing credit and equity market conditions could materially impact the valuation of investments as reported within our financial statements, and the period-to-period changes in value could vary significantly. Our ability to sell investments, or the price ultimately realized for investments, depends upon the demand and liquidity in the market and increases the use of judgment in determining the estimated fair value of certain investments. Even if our assumptions and valuations are accurate at the time that they are made, the same factors influencing our valuations of such investments could
28
Table of Contents
cause the market value of these investments to decline, which could materially and adversely impact our financial condition, results of operations or cash flows.
Additionally, we also use, and may in the future use, derivatives, including swaps, options, futures and forward contracts, and reinsurance contracts to hedge risks such as current or future changes in the fair value of our assets and liabilities, current or future changes in cash flows, changes in interest rates, equity markets and credit spreads, the occurrence of credit defaults, currency fluctuations and changes in mortality and longevity. We use equity derivatives to hedge the liabilities associated with our FIAs. Our hedging strategies also rely on assumptions and projections regarding our assets, liabilities (including with respect to the optional benefits offered as part of our products), general market factors and the creditworthiness of our counterparties that may prove to be incorrect or inadequate. Accordingly, our hedging activities may not have the desired beneficial impact on our financial condition or results of operations. Hedging strategies involve transaction and other costs, and if we terminate any hedging arrangements, including reinsurance contracts, we may also be required to pay additional costs, such as transaction fees or breakage costs. We may also incur losses on transactions after taking into account our hedging strategies, which may have a material and adverse effect on our financial condition and cash flows.
Financial Statements and Results
The preparation of our consolidated financial statements and notes thereto in accordance with GAAP requires management to make various estimates and assumptions that affect the reported amounts in our financial statements. These estimates include, but are not limited to, the fair value of investments, impairment of investments and valuation allowances, the valuation of derivatives, including embedded derivatives, DAC, DSI and VOBA, future policy benefit reserves, valuation allowances on deferred tax assets and stock-based compensation. For example, the calculations we use to estimate DAC, DSI and VOBA are necessarily complex and involve analyzing and interpreting large quantities of data. The assumptions and estimates required for these calculations involve judgment and by their nature are imprecise and subject to changes and revisions over time. Accordingly, our results may be adversely affected from time to time by actual results differing from assumptions, changes in estimates and changes resulting from implementing more sophisticated administrative systems and procedures that facilitate the calculation of more precise estimates. Any of these inaccuracies could require us, among other things, to accelerate the amortization of DAC, DSI and VOBA, which would result in a charge to earnings, or in a restatement of our historical financial statements or other material adjustments to our financial statements. Additionally, the potential for unforeseen developments, including changes in laws, may result in losses and loss expenses materially different from the reserves initially established, which could also materially and adversely impact our business, financial condition, results of operations and prospects.
The amount of statutory capital that our insurance and reinsurance subsidiaries have can vary significantly from time to time and is sensitive to a number of factors outside of our control.
Our U.S. insurance subsidiaries are subject to state regulations that provide for minimum capitalization requirements (“MCR”) based on RBC formulas for life insurance companies relating to insurance, business, asset, interest rate and certain other risks. Similarly, ALRe is subject to MCR imposed by the Bermuda Monetary Authority (the “BMA”) through its Enhanced Capital Requirement (“ECR”) and Minimum Margin of Solvency (“MMS”). The BSCR is based on the BMA’s Economic Balance Sheet (“EBS”) regulatory framework, which was granted equivalency to the European Union’s Directive (2009/138/EC) (“Solvency II”) in March 2016. EBS is effective as of January 1, 2016 with the first filing due in 2017 for the year ended December 31, 2016. Our German Group Companies are subject to solvency capital requirements (“SCR”) and MCR pursuant to Solvency II (as implemented in Germany), which applies at the level of Athene Lebenversicherung AG (“ALV,” formerly known as Delta Lloyd Lebensversicherung AG) and at the level of the group. ALV and Athene Pensionskasse AG (“APK,” formerly known as Delta Lloyd Pensionskasse AG) are subject to SCR and MCR pursuant to the German regulation on capitalization (Kapitalausstattungsverordnung).
29
Table of Contents
In any particular year, our subsidiaries’ capital ratios and/or statutory surplus amounts may increase or decrease depending on a variety of factors, most of which are outside of our control, including, but not limited to, the following:
| • | the amount of statutory income or losses generated by our insurance subsidiaries (which itself is sensitive to equity and credit market conditions); |
| • | the amount of additional capital our insurance subsidiaries must hold to support their business growth; |
| • | changes in reserve requirements applicable to our insurance subsidiaries; |
| • | changes in market value of certain securities in our investment portfolio; |
| • | changes in the credit ratings of investments held in our investment portfolio; |
| • | the value of certain derivative instruments; |
| • | changes in interest rates; |
| • | credit market volatility; |
| • | changes in policyholder behavior; |
| • | changes to the RBC formulas and interpretations of the NAIC instructions with respect to RBC calculation methodologies; |
| • | changes to the ECR, BSCR or target capital level (“TCL”) formulas and interpretations of the BMA’s instructions with respect to ECR, BSCR or TCL calculation methodologies; and |
| • | changes to the SCR formulas and interpretations with respect to SCR calculation methodologies and MCR pursuant to Solvency II and German regulations. |
The financial strength and credit ratings of our insurance subsidiaries are significantly influenced by their statutory surplus amounts and these MCRs. NRSROs may also implement changes to their internal models, which differ from the RBC, BSCR and SCR capital models, that have the effect of increasing or decreasing the amount of statutory capital our subsidiaries must hold in order to maintain their current ratings. Additional statutory reserves may be required as the result of mandatory annual asset adequacy analysis, and rising or falling interest rates and widening credit spreads could alter this cash flow testing analysis. In addition, NRSROs may downgrade the investments held in our portfolio, which could result in impairments and therefore a reduction of the RBC ratios of our U.S. domiciled insurance subsidiaries, a decrease in the solvency ratio of our German Group Companies, or an increase in the ECR of ALRe.
To the extent that one of our insurance subsidiary’s solvency or capital ratios is deemed to be insufficient by one or more NRSROs, we may take actions either to increase the capitalization of the insurer or to reduce the capitalization requirements. If we are unable to accomplish such actions, NRSROs may view this as a reason for a ratings downgrade. If a subsidiary’s solvency or capital ratios reach certain minimum levels, it could subject us to further examination or corrective action imposed by our insurance regulators, including limitations on our subsidiaries’ ability to write additional business, supervision by regulators, seizure or liquidation, each of which could materially and adversely affect our business, financial condition, results of operations, cash flows and prospects.
Interest rate fluctuations could adversely affect our business, financial condition, liquidity, results of operations and cash flows.
Interest rate risk is a significant market risk for us. We define interest rate risk as the risk of an economic loss due to changes in interest rates. This risk arises from our holdings in interest rate-sensitive assets and liabilities, primarily as a result of issuing or reinsuring fixed deferred and immediate annuities and investing primarily in fixed income assets. As of September 30, 2016, reserves for fixed deferred and immediate annuities net of reinsurance made up substantially all of our reserve liabilities. Substantial and sustained increases or
30
Table of Contents
decreases in market interest rates can affect the profitability of our insurance products and the fair value of our investments. These fluctuations could materially and adversely affect our business, financial condition, liquidity, results of operations and cash flows, including in the following respects:
| • | Significant changes in interest rates expose us to the risk of not realizing anticipated spreads between overall net investment earned rates and the crediting rates to our policyholders, which are a significant source of our operating profits. We have the ability to adjust crediting rates, including caps and participation rates for FIAs, on many of our annuity liabilities (subject to minimum guaranteed values). However, we may not be able to adjust such rates in a timely manner or to the extent desired to adequately respond to the effect that changes in interest rates may have on the returns on our investments. Many of our annuity products have surrender and withdrawal penalty provisions designed to prevent early policyholder withdrawals in rising interest rate environments and to help ensure targeted spreads are earned. However, competitive factors, including the need or desire to manage levels of surrenders and withdrawals, may limit our ability to adjust or maintain crediting rates at levels necessary to avoid narrowing of spreads under certain market conditions. |
| • | Changes in interest rates may also negatively affect the value of our assets and our ability to realize gains or avoid losses from the sale of those assets, all of which also ultimately affect our earnings and/or capital. Significant volatility in interest rates may have a larger adverse impact on certain assets in our investment portfolio which are highly structured or have limited liquidity, including our real estate-related assets, structured products and alternative investments, which may not have active trading markets, making the disposition of such assets difficult. |
| • | Changes in interest rates may also affect changes in prepayment rates on certain of the real estate-related assets, structured products and alternative investments we invest in. For instance, falling interest rates may accelerate the rate of prepayment on mortgage loans, while rising interest rates may decrease such prepayments below the level of our expectations. At the same time, falling interest rates may result in the lengthening of duration for our policies and liabilities due to the guaranteed minimum benefits contained in our products, while rising interest rates could lead to increased policyholder withdrawals and a shortening of duration for our liabilities. In either case, we could experience a mismatch in our assets and liabilities and potentially incur economic losses, which may have an adverse effect on our financial condition, results of operations and cash flows. |
| • | During periods of declining interest rates or a prolonged period of low interest rates, life insurance and annuity products may be relatively more attractive to consumers due to minimum guarantees that are mandated by law or by regulators at the time that we price these products, resulting in a higher persistency than we anticipated, potentially resulting in greater claims costs on our guaranteed minimum benefit riders than we expected and cash flow mismatches between our assets and liabilities. In addition, the surrender and withdrawal penalties we impose on certain of our annuity products may further increase persistency during such periods. Certain statutory capital and reserve requirements are based on formulas or models that consider interest rates, and an extended period of low interest rates may increase the statutory capital we are required to hold and the amount of assets we must allocate to support statutory reserves, which could decrease the spread income that we are able to earn from these products. This reduced spread could also force us to accelerate amortization of DAC and/or VOBA, which would have an adverse effect on our financial condition and results of operations. Our German life insurance company subsidiaries are required by law to set up an additional premium reserve if the interest rate guaranteed to policyholders of certain endowment and annuity products issued exceeds a certain reference rate which is based on the rolling ten-year average of an AAA Eurobond. If interest rates remain at current low levels or further decline as a result of further quantitative easing in response to declining economic conditions, we could be required to provide additional capital to our German insurance company subsidiaries or increase reserves allocated to certain products which could in turn have a material adverse effect on our financial condition and results of operations. |
| • | Additionally, during periods of declining interest rates, we may have to reinvest the cash we receive as interest or return of principal on our investments into lower-yielding high-grade instruments or seek |
31
Table of Contents
| lower-credit instruments in order to maintain comparable returns, each of which could have a material and adverse effect on our financial condition and results of operations. |
| • | Certain securitized financial assets are accounted for based on expectations of future cash flows. To the extent the coupon on these instruments or the underlying collateral is based on a reference rate (for example, the London Interbank Offered Rate (“LIBOR”)), we use the market observed forward curve in our cash flow projections. As of September 30, 2016, we held $17.6 billion of securitized financial assets that have floating rate coupons or adjustable rate collateral. To the extent interest rates are lower than we have projected, we will experience slower accretion of discounts on these assets and will have a lower yield on our portfolio, which would adversely affect our financial condition and results of operations. |
| • | An extended period of declining interest rates or a prolonged period of low interest rates may cause us to change our long-term view of the interest rates that we can earn on our investments, causing us to change the long-term interest rate that we assume in our evaluation of our insurance liabilities, reducing the attractiveness of our subsidiaries’ products. |
| • | In periods of rapidly increasing interest rates, withdrawals from and/or surrenders of annuity contracts may increase as policyholders choose to seek higher investment returns elsewhere. Obtaining cash to satisfy these obligations may require our insurance subsidiaries to liquidate fixed income investments at a time when market prices for those assets are depressed because of increases in interest rates. This may result in realized investment losses. Regardless of whether we realize an investment loss, such cash payments would result in a decrease in total invested assets and may decrease our levels of profitability or results of operations. Premature withdrawals or unexpected surrenders may also cause us to accelerate amortization of DAC and/or VOBA, which would also adversely affect our financial condition and results of operations. |
| • | An increase in market interest rates could also reduce the value of certain of our alternative investments held as collateral under reinsurance agreements and create a need for ALRe to provide additional collateral to support the reserve requirements of our ceding companies, thereby reducing our available capital and potentially creating a need for additional capital which may not be available to us on favorable terms, or at all, when needed. |
We may want or need additional capital in the future, and such capital may not be available to us on favorable terms or at all due to volatility in the equity or credit markets, adverse economic conditions or our creditworthiness.
We may want or need to raise additional capital in the future through offerings of debt or equity securities or otherwise to:
| • | operate and expand our business; |
| • | make acquisitions or assume business through reinsurance; |
| • | fund our liquidity needs caused by investment losses; |
| • | replace capital lost in the event of significant investment, insurance or reinsurance losses or adverse reserve developments; |
| • | meet rating agency or regulatory capital requirements; or |
| • | meet other requirements and obligations. |
Additional capital may not be available on terms favorable to us, or at all, when we seek to raise such capital. Availability of additional capital will depend on a variety of factors such as market conditions, our credit ratings and adverse regulatory actions taken against us. Our inability to raise capital at such times can have a range of effects, including forcing us to forego profitable growth opportunities and impairing the capital ratios of
32
Table of Contents
our insurance subsidiaries. This would have the potential to decrease both our profitability and our financial flexibility. Further, any additional capital raised through the sale of equity could dilute your ownership interest in our company and may cause the value of our shares to decline.
If we do not manage our growth effectively, our financial performance could be adversely affected; our historical growth rates may not be indicative of our future growth.
We have experienced rapid growth since we commenced operations in 2009. As of September 30, 2016, our reserve liabilities have grown to $70.9 billion, our work force has grown to approximately 1,360 employees and our independent agent base has grown to approximately 30,000 agents. We intend to continue to grow by recruiting new independent agents, increasing the productivity of our existing agents, expanding our insurance distribution network, making strategic acquisitions, developing new products, expanding into new product lines and continuing to develop new incentives for our sales agents. We believe that we have the right people, infrastructure and scale to position us for continued growth. Future growth will impose significant added responsibilities on our management, including the need to identify, recruit, maintain and integrate additional employees, including management. There can be no assurance that our systems, procedures and controls will be adequate to support our operations as they expand. In addition, due to our rapid growth and resulting increased size, it may be necessary to expand the scope of our investing activities to asset classes in which we historically have not invested or have not had significant exposure. If we are unable to adequately manage our investments in these classes, our financial condition and results of operations in the future could be less favorable than in the past. Further, we have utilized reinsurance to support our growth and the future availability of such reinsurance is uncertain. Our failure to manage growth effectively, or our inability to recruit, maintain and integrate additional qualified employees and independent agents, could have a material adverse effect on our business, financial condition and results of operations. In addition, due to our rapid growth, our historical growth rates are not likely to accurately reflect our future growth rates or our growth potential. We cannot assure you that our future revenues will increase or that we will continue to be profitable.
If our risk management policies and procedures, which include the use of derivatives and reinsurance, are not adequate to protect us, we may be exposed to unidentified, unanticipated or inadequately managed risks.
We place a high priority on risk management and risk control. We have developed risk management policies and procedures, including hedging programs and risk management programs that utilize derivatives and reinsurance, and expect to continually refine and enhance these techniques, strategies and assessment methods. Nonetheless, our policies and procedures to identify, monitor and manage risks may not be fully effective, particularly during extremely turbulent market conditions. Many of our methods of managing risk and exposures are based upon observed historical market behavior or statistics based on historical data. These methods are also based upon certain assumptions and estimates made by management. As a result, these methods may not accurately anticipate future market outcomes or policyholder behavior, which could result in volatility that is significantly greater than historical measures indicate. See also “—Our business, financial condition, liquidity, results of operations and cash flows depend on the accuracy of our management’s assumptions and estimates, and we could face significant losses if these assumptions and estimates differ significantly from actual results.” Other risk management methods depend on the evaluation of information regarding markets, customers or other matters that are publicly available or otherwise accessible to management. This information may not always be accurate, complete, up-to-date or properly evaluated. Management of operational, legal and regulatory risks requires, among other things, policies and procedures to record and verify large numbers of transactions and events. These policies and procedures may not be fully effective to manage or mitigate our risks which may have a material and adverse effect on our business, financial condition, liquidity, results of operations, cash flows and prospects.
33
Table of Contents
We operate in a highly competitive industry that includes a number of competitors, many of which are larger and more well-known than we are, which could limit our ability to achieve our growth strategies and could materially and adversely affect our business, financial condition, results of operations, cash flows and prospects.
We operate in highly competitive markets and compete with large and small industry participants. These companies compete for an increasing pool of retirement assets, driven primarily by aging of the U.S. population and the reduction in, and concerns about the viability of, financial safety nets historically provided by governments and employers. In each of our subsidiaries’ businesses we face intense competition, including from U.S. and non-U.S. insurance and reinsurance companies, broker-dealers, financial advisors, asset managers and diversified financial institutions, both for customers for our subsidiaries’ products and in the acquisition and block reinsurance markets. See “—Our growth strategy includes acquiring business through acquisitions of other insurance companies and reinsurance of insurance obligations written by unaffiliated insurance companies, and our ability to consummate these acquisitions on economically advantageous terms acceptable to us in the future is unknown.” We compete based on a number of factors including perceived financial strength, credit ratings, brand recognition, reputation, quality of service, performance of our products, product features, scope of distribution and price. A decline in our competitive position as to one or more of these factors could adversely affect our profitability. In addition, we may in the future sacrifice our competitive or market position in order to improve our short-term profitability, particularly in the highly competitive retail markets, which may adversely affect our long-term growth and results of operations. Alternatively, we may sacrifice short-term profitability to maintain market share and longer term growth.
In recent years, there has been substantial consolidation among companies in the financial services industry due to economic turmoil resulting in increased competition from large, efficient, well-capitalized financial services firms. Many of our competitors are large and well-established and some have greater market share or breadth of distribution, offer a broader range of products, services or features, assume a greater level of risk while maintaining financial strength ratings or have higher financial strength, claims-paying or credit ratings than we do. Our competitors may also have lower operating costs or return on capital requirements than us which may allow them to price products, reinsurance arrangements or acquisitions more competitively. The competitive pressures arising from consolidation could result in increased pressure on the pricing of certain of our products and services, and could harm our ability to maintain or increase profitability. In addition, if our financial strength and credit ratings remain lower than the ratings of certain of our competitors, we may experience increased surrenders and/or an inability to reach sales targets, which may have a material and adverse effect on our growth, business, financial condition, results of operations, cash flows and prospects.
A significant portion of our retail annuities are sold through a proprietary distribution network.
We distribute annuity products through independent producers affiliated with certain IMOs. A significant portion of our retail annuity production results from sales of product in our BalancedChoice Annuity (“BCA”) product series, which contains certain product features that are licensed from a third-party actuarial firm. Only IMOs which are affiliated with the Annexus Group are permitted to distribute the BCA product series. If we experienced a disruption in our relationship with the Annexus Group, it could have an adverse effect for a period of time on our annuity sales of the BCA product series.
We are subject to general economic conditions, including prevailing interest rates, levels of unemployment and financial and equity and credit market performance, which may affect, among other things, our ability to sell our products, the fair value of our investments and whether such investments become impaired and the surrender rate and profitability of our policies.
Our business and results of operations are materially affected by conditions in the global capital markets and the economy generally. A general economic slowdown could adversely affect us in the form of changes in consumer behavior and decreases in the returns on and value of our investment portfolio. Concerns over the slow
34
Table of Contents
economic recovery, the level of U.S. national debt, currency fluctuations and volatility, the stability of the EU and the potential exit of the United Kingdom (“Brexit”) and of certain other EU members, the rate of growth of China and other Asian economies, unemployment, the availability and cost of credit, the U.S. housing market, inflation levels, negative interest rates, energy costs and geopolitical issues have contributed to increased volatility and diminished expectations for the economy and the markets. Declining economic growth rates globally and resultant diverging paths of monetary policy could increase volatility in the credit markets, potentially impacting the availability and cost of credit.
Factors such as equity prices, equity market volatility, interest rates, counterparty risks, availability of credit, inflation rates, economic uncertainty, changes in laws or regulations (including laws relating to the financial markets generally or the taxation or regulation of the insurance industry), trade barriers, commodity prices, currency exchange rates and controls and national and international political circumstances (including governmental instability, wars, terrorist acts or security operations) can have a material impact on the value of our investment portfolio and our subsidiaries’ ability to sell their products. Equity market volatility can negatively affect our revenues and profitability in various ways, particularly as a result of guaranteed minimum withdrawal or surrender benefits in our products. The estimated cost of providing guaranteed minimum withdrawal benefits incorporates various assumptions about the overall performance of equity markets over certain time periods. Periods of significant and sustained downturns in equity markets, increased equity volatility or reduced interest rates could result in an increase in the valuation of the future policy benefit or policyholder account balance liabilities associated with such products, resulting in a reduction in our revenues and net income. The rate of amortization of DAC and VOBA costs relating to FIA products and the cost of providing guaranteed minimum withdrawal or surrender benefits could also increase if equity market performance is worse than assumed, which could have a material and adverse effect on our growth, business, financial condition, results of operations and cash flows.
Additionally, the possibility of volatility in the capital markets spreading through a highly integrated and interdependent banking system remains. These factors, combined with reduced business and consumer confidence, have negatively impacted U.S. economic growth. The Board of Governors of the Federal Reserve System (the “Federal Reserve”) has scaled back programs that have in recent years fostered a historically low interest rate environment, which could generate volatility in debt and equity markets including increases in interest rates and associated declining values on fixed income investments. As the Federal Reserve moves towards normalizing monetary policy and moving short-term interest rates off of their lower levels, the central bank may adversely affect prospects for continued economic recovery with little room for incremental monetary accommodation. Furthermore, long-term structural concerns remain with regard to the Eurozone’s move towards a closer currency, fiscal, economic and monetary union, particularly in the wake of the United Kingdom’s vote to exit the EU. In addition, significant risks persist regarding the sovereign debt of Greece, as well as certain other countries, which in some cases have required countries to obtain emergency financing. While economic policy measures and commitments have stabilized the Euro’s volatility, the EU’s fiscal outlook remains negative, and further substantial decline in the value of the Euro could expose us to significantly greater foreign currency exposure than we estimate at this time. The financial turmoil in Europe, including the recent downgrades of the sovereign rating of the United Kingdom and uncertainty resulting from Brexit, continues to be a long-term threat to global capital markets and remains a challenge to global financial stability. If these or other countries require additional financial support or if sovereign credit ratings decline further, yields on the sovereign debt of certain countries may increase, the cost of borrowing may increase and the availability of credit may become more limited. Our results of operations and investment portfolio are exposed to these risks and may be adversely affected as a result. In addition, in the event of extreme prolonged market events, such as the recent global credit crisis, we could incur significant losses.
Our investments are subject to market and credit risks that could diminish their value and these risks could be greater during periods of extreme volatility or disruption in the financial and credit markets, which could adversely impact our business, financial condition, liquidity and results of operations.
Our investments and derivative financial instruments are subject to risks of credit defaults and changes in market values. Periods of extreme volatility or disruption in the financial and credit markets could increase these
35
Table of Contents
risks. Underlying factors relating to volatility affecting the financial and credit markets could lead to other than temporary impairment of assets in our investment portfolio. We are also subject to the risk that cash flows resulting from payments on assets that serve as collateral underlying the structured products we own may differ from our expectations in timing or size. In addition, many of our classes of investments, but in particular our alternative investments, may produce investment income that fluctuates from period to period and is more variable than may be the case with other asset classes, such as corporate bonds. Any event reducing the estimated fair value of these securities, other than on a temporary basis, could have a material and adverse effect on our business, results of operations, financial condition and cash flows. If our investment manager, AAM, or our German subsidiaries’ investment adviser, AAME, fails to react appropriately to difficult market, economic and geopolitical conditions, our investment portfolio could incur material losses. Some of our investments are more vulnerable to these risks than others, as described more fully below.
Approximately 82% of our total invested assets as of September 30, 2016 were invested in fixed maturity securities, equity securities and short-term investments, including our investments in investment grade and high-yield corporate bonds and structured products, which include RMBS and collateralized loan obligations (“CLOs”). As of September 30, 2016, approximately 46% of our total invested assets were invested in non-structured investment grade bonds, approximately 3% in high-yield non-structured securities and approximately 5% in structured securities (other than commercial mortgage-backed securities (“CMBS”), RMBS and CLOs). Issuers or guarantors of such fixed income securities may default on principal or interest payments they owe us, or the underlying collateral may default on such payments, causing an adverse change in cash flows. An economic downturn affecting the issuers or underlying collateral of these securities, a ratings downgrade affecting the issuers or guarantors of such securities, or similar trends and issues could cause the estimated fair value of our fixed income securities portfolio and our earnings to decline and the default rates of the fixed income securities in our portfolio to increase.
As of September 30, 2016, approximately 8% of our total invested assets were invested in senior and mezzanine tranches issued by CLOs and 0.4% was invested in equity tranches issued by CLOs. As of September 30, 2016, 93% of our investments in CLOs were managed by Apollo and its affiliates other than AAM. See “—Risks Relating to this Offering and an Investment in Our Class A Common Shares—The interest of the Apollo Group, which controls and is expected to continue to control 45% of the total voting power of AHL and holds a number of the seats on our board of directors, may conflict with those of other shareholders and could make it more difficult for you and other shareholders to influence significant corporate decisions.” CLOs are a form of securitization where payments from multiple large business loans, generally below investment grade, are pooled together and sold to different classes of owners in various tranches. Senior tranches of CLOs have some protection from credit losses by more junior tranches while junior tranches often have higher yields than those of the collateral loans and receive higher coupons to compensate for higher risk. CLOs thus provide investment opportunities with varying risk/return profiles and diversified exposure to multiple borrowers. Control over the CLOs in which we invest is exercised through collateral managers, who may take actions that could adversely affect our interests, and we may not have the right to direct collateral management. There may also be less information available to us regarding the underlying debt instruments held by CLOs than if we had invested directly in the debt of the underlying companies. Additionally, as subordinated interests, the estimated fair values of CLOs tend to be much more sensitive to adverse economic downturns and underlying borrower defaults than those of more senior securities. For example, as the secondary market pricing of the loans underlying CLOs deteriorated during the fourth quarter of 2008, it is our understanding that many investors were forced to raise cash by selling their interests in performing loans which resulted in a forced deleveraging cycle of price declines, compulsory sales and further price declines. While loan prices have recovered from the low levels experienced during the financial crisis, conditions in the large corporate leveraged loan market may deteriorate again, which may cause pricing levels to decline. Furthermore, our investments in CLOs are also subject to liquidity risk as there is a limited market for CLOs. Accordingly, we may suffer unrealized depreciation and could incur realized losses in connection with the sale of our CLO interests, which could have a material adverse effect on our business, financial condition and results of operations.
36
Table of Contents
Included in assets of AAA Investment (Co-Invest VI), L.P. (“Co-Invest VI”), one of our consolidated VIEs, are equity investments in publicly traded shares of Caesars Entertainment Corporation (“CEC”) and Caesars Acquisition Company (“CAC”). We received the CEC and CAC shares as part of a contribution agreement in 2012 with AAA Guarantor - Athene, L.P. (the “AAA Investor”) and its subsidiary, Apollo Life Re Ltd., in order to provide a capital base to support future acquisitions. There are pending claims against CEC, CAC and/or others related to certain guaranties issued for debt of Caesars Entertainment Operating Company, Inc. (“CEOC”) and/or certain transactions involving CEOC and certain of its subsidiaries (collectively, the “Debtors”), CEC, CAC and others. CEC and the Debtors announced on or about September 26, 2016 that CEC and CEOC had received confirmations from representatives of CEOC’s major creditor groups of those groups’ support for a term sheet that describes the key economic terms of a proposed consensual chapter 11 plan for the Debtors. A term of the proposed consensual chapter 11 plan provides that Co-Invest VI and others will not retain their CEC shares, and Co-Invest VI and others will receive releases to the fullest extent permitted by law. As a result, Co-Invest VI recorded a loss of $25 million during the third quarter of 2016 for the carrying value of the CEC shares. As of September 30, 2016, Co-Invest VI’s investment in CAC is carried at its fair value of $42 million.
We have a risk management framework in place to identify, assess and prioritize risks, including the market and credit risks to which our investments are subject. As part of that framework, we test our investment portfolio based on various market scenarios. Under certain stressed market scenarios, unrealized losses on our investment portfolio could lead to material reductions in its carrying value. Under some extreme scenarios, total AHL shareholders’ equity could be negative for the period of time prior to any potential market recovery. See “Management’s Discussion and Analysis of Financial Condition and Results of Operations—Quantitative and Qualitative Disclosures About Market Risks.”
A decline in fair value below the amortized cost of a security requires management to assess whether an OTTI has occurred. The decision on whether to record an OTTI is determined in part by our assessment of the financial condition and prospects of a particular issuer, projections of future cash flows and recoverability of the particular security as well as management’s assertion of whether it is more likely than not that we will sell the particular security before recovery.
Our investments linked to real estate are subject to credit, market and servicing risk, which could diminish the value that we obtain from such investments.
As of September 30, 2016, approximately 18% of our total invested assets were invested in fixed maturity and equity securities linked to real estate, such as CMBS and RMBS. Additionally, as of September 30, 2016, approximately 8% of our total invested assets were invested in commercial mortgage loans (“CMLs”) and RMLs and approximately 1% of our total invested assets were invested in real estate held for investment. In total, as of September 30, 2016, approximately 27% of our total invested assets were invested in assets linked to real estate. Defaults by third parties in the payment or performance of their obligations underlying these assets could reduce our investment income and realized investment gains or result in the recognition of investment losses. For example, the value of our real estate-related assets depends in part on the financial condition of the borrowers, the value of the real properties underlying the mortgages and, for commercial properties, the financial condition of the tenants of the properties underlying those mortgages, as well as general and specific economic trends affecting the overall default rate. An unexpectedly high rate of default on mortgages held by a CMBS or RMBS may limit substantially the ability of the issuer of such security to make payments to holders of such securities, reducing the value of those securities or rendering them worthless. The risk of such defaults is generally higher in the case of mortgage securitizations that include “sub-prime” or “alt-A” mortgages. As of September 30, 2016, approximately 30% of our holdings in assets linked to real estate were invested in such “sub-prime” mortgages and “alt-A” mortgages. Changes in laws and other regulatory developments relating to mortgage loans may impact the investments of our portfolio linked to real estate in the future. Additionally, cash flow variability arising from an unexpected acceleration in mortgage prepayment behavior can be significant, and could cause a decline in the estimated fair value of certain “interest only” securities or loans.
37
Table of Contents
The CMLs we hold, and CMLs underlying the CMBS that we hold, face both default and delinquency risk. For CMLs that we hold directly, we establish loan specific estimated impairments at each balance sheet date based on the excess carrying value of a loan over the present value of expected future cash flows discounted at the loan’s original effective interest rate, the estimated fair value of the loan’s collateral if the loan is in the process of foreclosure or otherwise collateral dependent, or the loan’s observable market price. We also establish valuation allowances for loan losses when it is probable that a credit event has occurred and the amount of loss can be reasonably estimated. As of September 30, 2016, our CML investments comprised 8% of our total invested assets, of which 0.2% were in the process of foreclosure. Legislative proposals that would allow or require modifications to the terms of CMLs, an increase in the delinquency or default rate of our CML portfolio or geographic or sector concentration within our CML portfolio could materially and adversely impact our financial condition and results of operations.
Our investments in RMLs and RMBS also involve credit risks. Higher than expected rates of default or loss severities on our RML investments and the assets underlying our RMBS investments may adversely affect the value of such assets. A significant number of the mortgages underlying our RML and RMBS investments are concentrated in certain geographic areas. Certain markets within those areas experienced significant decreases in home values during the financial crisis of 2007-2008 and the years thereafter. Any event that adversely affects the economic or real estate market in any of these areas could have a disproportionately adverse effect on our RML and RMBS investments. While we actively monitor our exposure to these and other risks inherent in this strategy, we cannot assure you that our hedging and risk management strategies will be effective; any failure to manage these risks effectively could materially and adversely affect our results of operations and financial condition. A rise in home prices, the concern over further introduction of or changes to government policies aimed at altering prepayment behavior, and an increased availability of housing-related credit could combine to increase expected or actual prepayment speeds, which would likely lower the valuations of RMLs and the valuations of RMBS that are structured as interest only securities and inverse interest only securities. In general, any material decline in the economy or significant problems in a particular real estate market would likely cause a decline in the value of residential properties securing the mortgages in that market, thereby increasing the risk of delinquency, default and foreclosure. This could, in turn, have a material adverse effect on our credit loss experience in the affected market.
Control over the underlying assets in all of our real estate-related investments is exercised through a servicer that we do not control. If a servicer is not vigilant in seeing that borrowers make their required periodic payments, borrowers may be less likely to make these payments, resulting in a higher frequency of default. If a servicer takes longer to liquidate non-performing mortgages, our losses related to those loans may be higher than originally anticipated. Any failure by a servicer to service mortgages in which we are invested or which underlie a RMBS in which we are invested could negatively impact the value of our investments in the related RMLs or RMBS.
Our German Group Companies and the Luxembourg investment fund managed by our Luxembourg subsidiary in which we have invested are significantly (directly or indirectly) invested in real estate in Germany and rely to a large extent on earnings from rentals and mortgage loan financing. Rents, real estate prices and default risk of mortgage loans largely depend on economic and business conditions in Germany. Declining economic conditions could cause us to be unable to re-let our real estate on the current terms, encounter difficulties in divesting parts of the real estate and lead to an increased number of mortgage loan defaults. This could impair the performance of our German Group Companies and the Luxembourg investment fund managed by our Luxembourg subsidiary in which we have invested (including the investments of the Luxembourg investment fund, in particular Elementae S.A., a holding company in which our Luxembourg subsidiary is the sole shareholder) and have material adverse effects on our business, financial condition, results of operations and cash flows.
In addition to the credit and market risk that we face in relation to all of our real estate-related investments, certain of these investments may expose us to various environmental, regulatory and other risks. For example, our investment in RMLs could result in claims being assessed against us as a mortgage holder or property owner, including assignee liability, responsibility for tax payments, environmental hazards and other liabilities, including liabilities under the federal Comprehensive Environmental Response, Compensation and Liability Act
38
Table of Contents
of 1980 (“CERCLA”). We may continue to be liable under such claims after foreclosing on a property securing a mortgage loan held by us. Additionally, we may be subject to regulation by the Consumer Financial Protection Bureau (“CFPB”) as a mortgage holder or property owner. We are currently unable to predict the impact of such regulation on our business. Any adverse environmental claim or regulatory action against us resulting from our investment in RMLs could adversely impact our reputation, business and results of operations.
Many of our invested assets are relatively illiquid and we may fail to realize profits from these assets for a considerable period of time, or lose some or all of the principal amount we invest in these assets if we are required to sell our invested assets at a loss at inopportune times to cover policyholder withdrawals or to meet our insurance, reinsurance or other obligations.
We offer certain products that allow policyholders to withdraw their funds under defined circumstances. In order to meet such obligations, we seek to manage our liabilities and configure our investment portfolios to provide and maintain sufficient liquidity to support expected withdrawal demands and contract benefits and maturities. However, in order to provide necessary long-term returns and to achieve our strategic goals, a certain portion of our assets are relatively illiquid. Many of our investments are in securities that are not publicly traded or that otherwise lack liquidity, such as our privately placed fixed maturity securities, below investment grade securities, investments in mortgage loans and alternative investments.
We record our relatively illiquid types of investments at fair value. If we were forced to sell certain of our assets, there can be no assurance that we would be able to sell them for the prices at which we have recorded them and we might be forced to sell them at significantly lower prices. In many cases, we may be prohibited by contract or applicable securities laws from selling such securities for a period of time. When we hold a security or position, it is vulnerable to price and value fluctuations and may experience losses if we are unable to timely sell, hedge or transfer the position. Thus, it may be impossible or costly for us to liquidate positions rapidly in order to meet unexpected withdrawal or recapture obligations. This potential mismatch between the liquidity of our assets and liabilities could have a material and adverse effect on our business, financial condition, results of operations and cash flows.
Our investment portfolio may be subject to concentration risk, particularly with regards to our investments in MidCap, AmeriHome and real estate.
Concentration risk arises from exposure to significant asset defaults of a single issuer, industry or class of securities, based on economic conditions, geography or as a result of adverse regulatory or court decisions. When an investor’s assets are concentrated and that particular asset or class of assets experiences significant defaults, the default of such assets could threaten the investor’s financial condition. Our most significant potential exposure to concentration risk are our investments in MidCap, a provider of revolving and term debt facilities to middle market companies in North America and Europe, and in A-A Mortgage and its indirect investment in AmeriHome, a mortgage lender and mortgage servicer. As of September 30, 2016, our exposure to, including amounts loaned to, MidCap totaled $748 million, which represented approximately 1.0% of our total invested assets and 10.6% of total AHL shareholders’ equity. As of September 30, 2016, our exposure to A-A Mortgage totaled $379 million, which represented less than 1% of our total invested assets and 5.4% of total AHL shareholders’ equity. To the extent that we suffer a significant loss on our investment in MidCap or A-A Mortgage, our financial condition and results of operations could be adversely affected.
As of September 30, 2016, approximately 27% of our total invested assets were invested in real estate-related assets. Any significant decline in the value of real estate generally or the occurrence of any of the risks described above with respect to our real estate related-investments could materially and adversely affect our financial condition and results of operations. See “—Our investments linked to real estate are subject to credit, market and servicing risk, which could diminish the value that we obtain from such investments.”
39
Table of Contents
Our investment portfolio may include investments in securities of issuers based outside the United States, including emerging markets, which may be riskier than securities of U.S. issuers.
We may invest in securities of issuers organized or based outside the United States that may involve heightened risks in comparison to the risks of investing in U.S. securities, including unfavorable changes in currency rates and exchange control regulations, reduced and less reliable information about issuers and markets, less stringent accounting standards, illiquidity of securities and markets, higher brokerage commissions, transfer taxes and custody fees, local economic or political instability and greater market risk in general. In particular, investing in securities of issuers located in emerging market countries involves additional risks, such as exposure to economic structures that are generally less diverse and mature than, and to political systems that can be expected to have less stability than, those of developed countries, national policies that restrict investment by foreigners in certain issuers or industries of that country, the absence of legal structures governing foreign investment and private property and an increased risk of foreclosure on collateral located in such countries, a lack of liquidity due to the small size of markets for securities of issuers located in emerging markets and price volatility. The recent vote by the United Kingdom to exit the EU has created significant volatility in the global financial markets. The effect of Brexit on our investment portfolios at this time is uncertain and this uncertainty will likely continue as negotiations commence to determine the future terms of the United Kingdom’s relationship with the EU. Brexit is likely to continue to adversely affect European and worldwide economic conditions and could contribute to greater instability in the global financial markets before and after the terms of the United Kingdom’s future relationship with the EU are settled.
As of September 30, 2016, 32% of the carrying value of our AFS fixed maturity securities, including related parties, was comprised of securities of issuers based outside of the United States and debt securities of foreign governments. Of those, 7% of our AFS fixed maturity securities, including related parties, were invested in securities of non-U.S. issuers by our German Group Companies, 8% were invested in CLOs of Cayman Islands issuers (where underlying assets are largely loans to U.S. issuers) and 17% were invested in other non-U.S. issuers. While we invest in securities of non-U.S. issuers, the currency denominations of such securities usually match the currency denominations of the liabilities that the assets support. When the currency denominations of the assets and liabilities do not match, we generally undertake hedging activities to eliminate or mitigate currency mismatch risk.
We previously identified material weaknesses in our internal control over financial reporting. If we fail to maintain effective internal control over financial reporting, we may not be able to accurately report our consolidated financial results.
As part of our financial integration of Aviva USA, we identified material weaknesses in our internal control over financial reporting as of and for the years ended December 31, 2014 and 2013. A material weakness is a deficiency, or combination of deficiencies, in internal control over financial reporting, such that there is a reasonable possibility that a material misstatement of the company’s annual or interim financial statements will not be prevented or detected on a timely basis. If we fail to maintain effective internal control over financial reporting, we may not be able to accurately report our consolidated financial results.
During the process of preparing and completing our consolidated financial statements for the year ended December 31, 2013, we determined that we did not have sufficient internal control over financial reporting related to: (1) actuarial balances of the blocks of business acquired from Aviva USA and (2) the preparation and accuracy of income tax balances, each of which constitutes a material weakness. We are not currently required to evaluate our internal control over financial reporting in the same manner that is currently required of certain public companies, nor have we performed such an evaluation. Such evaluation would include documentation of internal control activities and procedures over financial reporting, assessment of design effectiveness of such controls and testing of operating effectiveness of such controls, which could result in the identification of additional material weaknesses in our internal control over financial reporting.
Any failure to maintain adequate internal control over financial reporting or to implement required, new or improved internal controls, or difficulties encountered in their implementation, could cause us to report
40
Table of Contents
additional material weaknesses in our internal control over financial reporting, which may result in our inability to accurately report our consolidated financial results. Any such failure could have a material and adverse effect on our consolidated financial results and the value of our common shares.
Internal Control Over Actuarial Balances of the Blocks of Business Acquired from Aviva USA
As a private company, we have grown rapidly through acquisitions, including the acquisition of Aviva USA, which resulted in growing to approximately four times our size immediately prior to the acquisition (as measured by total assets). Immediately prior to our acquisition, Aviva USA identified a deficiency in its internal control over financial reporting for actuarial balances. With respect to actuarial balances of this type, the accounting practices under International Financial Reporting Standards (“IFRS”) and GAAP are substantially similar. Similar issues arose in the preparation of our GAAP consolidated financial statements for the year ended December 31, 2013, and we concluded that a material weakness existed in our internal control over financial reporting for actuarial balances related to the acquisition of Aviva USA. In particular, we determined we did not have sufficient internal controls in place to control the completeness and accuracy of data used in calculating the material actuarial reserves acquired from Aviva USA and monitor the accuracy of complex actuarial models. This material weakness resulted in adjustments to interest-sensitive contract liabilities, VOBA and DAC on our consolidated balance sheets.
To address this material weakness, we designed and implemented controls to review the data inputs, models, reserve systems, valuations and other processes related to material reserves acquired from Aviva USA. Finally, we designed and implemented review controls over actuarial model changes in the actuarial units across our company. Management believes that this deficiency no longer constitutes a material weakness as of December 31, 2015, and currently assesses it as a significant deficiency.
Internal Control Over Income Tax Balances
As a private company which, prior to 2011, did not have any material operations subject to U.S. income tax, we have substantially relied on the tax staff, systems and processes of the U.S. companies we have acquired to prepare our U.S. income tax returns and to provide for the impact of U.S. income tax in our financial reporting. The acquisition of Aviva USA significantly increased the complexity of our U.S. income tax position and the associated accounting. This complexity arises not only from the significantly greater size and scope of Aviva USA’s historical operations relative to our historical operations, but also from the complexity of the accounting necessary to report the income tax consequences of our near simultaneous purchase of Aviva USA, the sale of Aviva USA’s life operations to certain U.S. insurance subsidiaries of Global Atlantic, the reinsurance of a significant part of Aviva USA’s annuity business to ALRe and several other related transactions.
As we prepared our consolidated financial statements for the year ended December 31, 2013, we identified a lack of internal control over the preparation and accuracy of income tax balances. Delays in the timely preparation of our income tax basis for the opening balance sheet for the acquisition of Aviva USA, delays in the creation of income tax accounting entries and supporting schedules and documentation, limitations in the systems that support our income tax accounting records, deficiencies in the documentation of supporting tax workpapers and deficiencies in the number of and in the training of our tax staff all contributed to our conclusion that this constitutes a material weakness in our internal control over financial reporting.
To address this material weakness, we have taken several actions, including adding expertise and resources to our tax staff, including a global senior head of tax with significant experience, and enhancing our capabilities and processes to support financial reporting for income taxes. Additionally, we have designed controls to support the comprehensive review over our income tax processes, which include providing supporting documentation and analyses of our income tax accounting positions in a timely manner and managing the response to complex accounting for the income tax consequences of insurance acquisitions to prevent or detect misstatements in the determination of the income tax consequences of future acquisitions. Management believes that this deficiency
41
Table of Contents
no longer constitutes a material weakness as of December 31, 2015, and currently assesses it as a significant deficiency.
Our growth strategy includes acquiring business through acquisitions of other insurance companies and reinsurance of insurance obligations written by unaffiliated insurance companies, and our ability to consummate these acquisitions on economically advantageous terms acceptable to us in the future is unknown.
We have grown and intend to grow our business in the future in part by acquisitions of other insurance companies and businesses, including through reinsurance, which could require additional capital, systems development and skilled personnel. We may experience challenges identifying, financing, consummating and integrating such acquisitions. While we have reviewed various acquisition opportunities and have successfully completed acquisitions in the past to facilitate our growth, competition exists in the market for profitable blocks of insurance and businesses. Such competition is likely to intensify as insurance businesses become more attractive acquisition targets. It is also possible that merger and acquisition transactions will become less frequent, which could also make it more difficult for us to implement our growth strategy as we have done in the past. Thus, in the future, we may not be able to find suitable acquisition opportunities that are available at attractive valuations, if at all. Even if we do find suitable acquisition opportunities, we may not be able to consummate the acquisitions on commercially acceptable terms. In addition, to the extent we determine to finance an acquisition, suitable financing arrangements may not be available on acceptable terms, on a timely basis, or at all. Our acquisition activities may also divert the attention of our management from our business, which may have an adverse effect on our business and results of operations.
Occasionally we may acquire or seek to acquire an insurance company or business that writes traditional life insurance business or other businesses that are not core to our business. In the past, except in limited circumstances, we have arranged for the sale or transfer, through reinsurance or otherwise, of such business prior to or following our acquisitions to the extent that we did not want to retain these non-core businesses. As we grow, the ability of our management to transfer or source sufficient reasonably priced reinsurance for traditional life insurance or other non-core businesses that we may acquire and want to dispose of may be limited. As we acquire new businesses and write a larger volume of business, it may be difficult to find buyers or reinsurers willing to assume increased risk, and added reinsurance may increase the associated costs. Ultimately, we may not be able to find buyers or source adequate reinsurance at all. In the event that we were unable to find buyers or purchase adequate reinsurance, we would have to accept an increase in our net risk exposures, revise our pricing to reflect higher reinsurance premiums, or otherwise modify our acquisitions and product offerings, each of which could have an adverse effect on our business, financial condition, results of operations and cash flows.
We may not be able to successfully integrate future acquisitions and such acquisitions may result in greater risks to us, our business, financial condition, results of operations, cash flows and prospects.
Any failure to manage our growth and integrate our future acquisitions successfully may adversely affect us. Additionally, our ability to incorporate effectively the components of any businesses we may in the future acquire into our previously existing framework is unknown.
Potential difficulties that we may encounter in integrating new acquisitions include, but are not limited to:
| • | our failure to successfully execute plans to reinvest investments acquired in such acquisitions into higher yielding assets at acceptable levels of credit and other risks; |
| • | the risks relating to integrating accounting and financial systems and accounting policies and the related risk of having to restate our historical financial statements; |
| • | the challenge of integrating complex systems, operating procedures, regulatory compliance programs, technology, pricing structures, networks and other assets and strategies in a manner that minimizes any adverse impact on customers, suppliers, employees and other constituencies; |
42
Table of Contents
| • | the challenge of integrating workforces; |
| • | potential unknown liabilities that are significantly larger than we anticipate at the time of acquisition, and unforeseen increased expenses or delays associated with acquisitions, including costs in excess of the cash transition costs that we estimate at the outset of a transaction; |
| • | conditions that we must comply with in order to obtain regulatory approvals for such acquisitions; |
| • | the diversion of the attention of our management and other key employees; |
| • | the potential loss of key employees or business at the target company; |
| • | the inability to successfully combine our businesses in a manner that permits us to achieve the synergies and other benefits anticipated to result from future acquisitions; |
| • | the challenge of forming and maintaining a cohesive management team; |
| • | the risks of incurring significant goodwill and/or VOBA impairment charges in the future; |
| • | the risk that the target will incur dramatic and significant lapses, withdrawals or sales declines shortly after signing or closing of an acquisition; |
| • | our inability to secure hedges on adverse changes on interest rates, currencies and spreads on assets in the target company’s investment portfolio on commercially reasonable terms or at all, or that such hedges perform poorly and do not properly hedge these risks; |
| • | potential ratings downgrades of us or of the acquired entity; |
| • | increased regulatory scrutiny as a result of our entry into new markets or our increase in size or market share; and |
| • | branding or rebranding initiatives that involve substantial costs and may not be favorably received by customers of the target. |
The failure to appropriately mitigate these difficulties and manage our growth effectively could have a material adverse effect on our business, financial condition, results of operations, cash flows and prospects.
If we are unable to attract and retain IMOs and agents, sales of our products may be adversely affected.
We distribute our annuity products through a variable cost distribution network which currently includes approximately 60 IMOs and approximately 30,000 independent agents. Insurance companies compete vigorously for productive and profitable agents. We must attract and retain such marketers and agents to sell our products. We compete with other life insurance companies for marketers and agents primarily on the basis of our financial position, support services, compensation and product features. Such marketers and agents may promote products offered by other life insurance companies that may offer a larger variety of products than we do. Our competitiveness for such marketers and agents also depends upon the long-term relationships we develop with them. There can be no assurance that such relationships will continue in the future. In addition, as a result of our ratings upgrades in 2015, our growth plans include distributing annuity products through small and mid-size banks and regional broker-dealers. If we are unable to attract and retain sufficient marketers and agents to sell our products or we are not successful in expanding our distribution channels through the bank and broker-dealer markets, our ability to compete and our revenues and resulting financial condition and results of operations could be adversely affected.
Repurchase agreement programs subject us to potential liquidity and other risks.
We may engage in repurchase agreement transactions whereby we sell fixed income securities to third parties, primarily major brokerage firms or commercial banks, with a concurrent agreement to repurchase such securities at a determined future date. These repurchase agreements provide us with liquidity and in certain
43
Table of Contents
instances also allow us to earn spread income. Under such agreements we may be required to deliver additional securities or cash as margin to the counterparty if the value of the securities sold decreases prior to the repurchase date. The cash proceeds received by us under such repurchase agreements are typically invested in fixed income securities and may not be available to be returned prior to the scheduled repurchase date, and it is possible that we will enter into other repurchase transactions and use cash proceeds from such transactions to pay the repurchase prices on maturing repurchase transactions. Repurchase agreements, however, are generally not committed arrangements, and market and other conditions on the repurchase date or at other times may limit our ability to enter into new repurchase transactions or to enter into transactions on favorable terms. To the extent that we are not able to enter into new transactions or to enter into sufficient new transactions, we may need to find other sources to pay the repurchase prices under these transactions, which may or may not be available to us. Additionally, during difficult market situations, we may not be able to access funds under such repurchase agreements, which may require us to sell securities on unfavorable terms in order to ensure short-term liquidity.
In some cases, the maturity of the securities purchased by us with the cash proceeds received in the repurchase transaction may exceed the term of the related transaction and/or the market value of securities sold in such repurchase transactions may fall below stipulated margin requirements in the applicable repurchase agreement. If we are required to return significant amounts of cash collateral or post cash or securities as margin on short notice and we are forced to sell securities to meet such obligations, we may have difficulty doing so in a timely manner, may be forced to sell securities in a volatile or illiquid market for less than they otherwise would have been able to realize under normal market conditions, or both. In addition, under adverse capital market and economic conditions, liquidity may broadly deteriorate, which would further restrict our ability to sell securities.
A financial strength rating downgrade, potential downgrade or any other negative action by a rating agency could make our product offerings less attractive, inhibit our ability to acquire future business through acquisitions or reinsurance and increase our cost of capital, which could have a material adverse effect on our business.
Various NRSROs review the financial performance and condition of insurers and reinsurers, including our subsidiaries, and publish their financial strength ratings as indicators of an insurer’s ability to meet policyholder obligations. These ratings are important to maintaining public confidence in our insurance subsidiaries’ products, our insurance subsidiaries’ ability to market their products and our competitive position. Factors that could negatively influence this analysis include:
| • | changes to our business practices or organizational business plan in a manner that no longer supports our ratings; |
| • | unfavorable financial or market trends; |
| • | a need to increase reserves to support our outstanding insurance obligations; |
| • | our inability to retain our senior management and other key personnel; |
| • | rapid or excessive growth, especially through large reinsurance or acquisitions, beyond the bounds of capital sufficiency or management capabilities as judged by the NRSROs; |
| • | significant losses to our investment portfolio; and |
| • | changes in NRSROs’ capital adequacy assessment methodologies in a manner that would adversely affect the financial strength ratings of our insurance subsidiaries. |
Some other factors may also relate to circumstances outside of our control, such as views of the NRSRO and general economic conditions. Any downgrade or other negative action by a NRSRO with respect to the financial strength ratings of our insurance subsidiaries, or an entity we acquire, or our credit ratings, could materially adversely affect us and our ability to compete in many ways, including the following:
| • | reducing new sales of insurance products; |
44
Table of Contents
| • | harming relationships with or perceptions of distributors, IMOs and sales agents; |
| • | increasing the number or amount of policy lapses or surrenders and withdrawals of funds, which may result in a mismatch of our overall asset and liability position; |
| • | requiring us to offer higher crediting rates or greater policyholder guarantees on our insurance products in order to remain competitive; |
| • | increase our borrowing costs; |
| • | reducing our level of profitability and capital position generally or hindering our ability to raise new capital; or |
| • | requiring us to collateralize obligations under or result in early or unplanned termination of hedging agreements and harming our ability to enter into new hedging agreements. |
In order to improve or maintain their financial strength ratings, our subsidiaries may attempt to implement business strategies to improve their capital ratios. We cannot guarantee any such measures will be successful. We cannot predict what actions NRSROs may take in the future, and failure to improve or maintain current financial strength ratings could materially and adversely affect our business, financial condition, results of operations and cash flows.
We are subject to significant operating and financial restrictions imposed by our credit agreement.
The Credit Agreement dated as of January 22, 2016 by and among AHL, ALRe and Athene USA, as borrowers, each lender from time to time party thereto and Citibank, N.A., as administrative agent (the “AHL Credit Agreement”) contains various restrictive covenants which limit, among other things, AHL’s, ALRe’s and Athene USA’s ability, and in certain instances, some or all of their subsidiaries’ ability, to:
| • | incur additional indebtedness, make guarantees and enter into derivative arrangements; |
| • | create liens on our or such subsidiaries’ assets; |
| • | make fundamental changes; |
| • | engage in certain transactions with affiliates; |
| • | make changes in the nature of our business; and |
| • | pay dividends and distributions or repurchase our common shares. |
These covenants, some of which are financial, may prevent or restrict us from capitalizing on business opportunities, including making additional acquisitions or growing our business. In addition, if AHL undergoes a “change of control” as defined in the AHL Credit Agreement, the lenders under the AHL Credit Agreement will have the right to terminate the facility and/or accelerate the maturity of all outstanding loans. As of the date of this prospectus, AHL is in compliance with all covenants and no borrowings under the AHL Credit Agreement are outstanding. As a result of these restrictions and their effects on us, we may be limited in how we conduct our business and may be unable to raise additional debt financing to compete effectively or to take advantage of new business opportunities. The terms of any future indebtedness we may incur may contain additional restrictive covenants.
We are subject to the credit risk of our counterparties, including ceding companies who reinsure business to ALRe, reinsurers who assume liabilities from our subsidiaries and derivative counterparties.
Our insurance subsidiaries may cede insurance and transfer related assets and certain liabilities to third-party insurance companies through reinsurance. Under such reinsurance agreements, our insurance subsidiaries will be liable for losses on insurance risks if such reinsurers fail to perform under their respective reinsurance agreements with our subsidiaries.
45
Table of Contents
In connection with the acquisitions of our two largest U.S. insurance subsidiaries, we entered into reinsurance agreements with Protective Life Insurance Company (“Protective”) and Global Atlantic. As part of our acquisition of AADE, we effected a sale of substantially all of AADE’s life insurance business by reinsuring such business to Protective. Similarly, in connection with our acquisition of Aviva USA, we effectuated a sale of substantially all of Aviva USA’s life insurance business by reinsuring such business to Global Atlantic. Because these agreements involve reinsurance of entire business segments, each covers a much larger volume of business than a traditional reinsurance agreement. Additionally, although certain of Protective’s financial obligations under its reinsurance agreement with us are secured by assets placed in a trust for our benefit and Global Atlantic is obligated to maintain assets in custody accounts for our benefit to support substantially all of its financial obligations under its reinsurance agreements with us, as each of Protective and Global Atlantic are the only counterparties under each respective agreement, we face a heightened risk of default with respect to those reinsurers in particular. In addition, we do not have a security interest in the assets in the custody accounts supporting the Global Atlantic reinsurance agreements. Therefore, in the event of an insolvency of the Global Atlantic insurance company acting as reinsurer, our claims would be subordinated to those of such insurance company’s policyholders and the assets in the relevant custody accounts may be available to satisfy the claims of such insurance company’s general creditors in addition to us. See “Business—Distribution Channels—Acquisitions—Global Atlantic” and “Business—Distribution Channels—Acquisitions—Protective.” As with any other reinsurance agreement, we remain liable to our policyholders even if Protective or Global Atlantic fail to perform. Although each agreement provides that Protective and Global Atlantic, respectively, agree to indemnify us for losses sustained in connection with their respective performances of each agreement, such indemnification may not be adequate to compensate us for losses actually incurred in the event that Protective or Global Atlantic are either unable or unwilling to perform according to the agreements’ terms. In addition to possible losses that could be incurred if our subsidiaries are forced to recapture these blocks, such subsidiaries may also face a substantial shortfall in capital to support the recaptured business, possibly resulting in material declines to the insurer’s RBC ratio and/or creditworthiness and potentially expose the insurer to ratings downgrades, regulatory intervention, increased policyholder withdrawals or other negative effects.
Conversely, ALRe and certain of our U.S. insurance subsidiaries assume liabilities from other insurance companies. Changes in the ratings, creditworthiness or market perception of such ceding companies or in the administration of policies reinsured to us could cause policyholders of contracts reinsured to us to surrender or lapse their policies in unexpected amounts. In addition, to the extent such ceding companies do not perform under their reinsurance agreements with us, we may not achieve the results we intended and could suffer unexpected losses. In either case, we have exposure to our subsidiaries’ reinsurance counterparties which could materially adversely affect our business, financial condition, results of operations and cash flows.
Finally, we are exposed to credit loss in the event of nonperformance by our counterparties on derivative agreements. We seek to further reduce the risk associated with such agreements by entering into such agreements with large, well-established financial institutions. In addition, rules recently adopted by the U.S. Commodity Futures Trading Commission (“CFTC”) and the prudential regulators will require us and our swap dealer counterparties to collect and post initial and variation margin with respect to non-cleared swaps. Any initial margin required to be posted to our swap dealer counterparties under these rules will be segregated with a third-party custodian. However, there can be no assurance that we will not suffer losses in the event a counterparty or custodian fails to perform or is subject to a bankruptcy or similar proceeding.
We rely significantly on third parties for investment services and certain other services related to our policies, and we may be held responsible for obligations that arise from the acts or omissions of third parties under their respective agreements with us if they are deemed to have acted on our behalf.
We rely significantly on various third parties to provide investment services to us as well as to sell, distribute and provide administrative services for our subsidiaries’ policies. As such, our results may be affected by the performance of those parties. Additionally, our operations are dependent on various service providers and on various technologies, some of which are provided or maintained by certain key outsourcing partners and other parties. See “—Risks Relating to Our Investment Manager—Interruption or other operational failures in
46
Table of Contents
telecommunications, information technology and other operational systems at AAM or AAME or a failure to maintain the security, integrity, confidentiality or privacy of sensitive data residing on AAM’s or AAME’s systems, including as a result of human error, could have a material adverse effect on our business.”
Many of our subsidiaries’ products and services are sold through third-party intermediaries. In particular, our insurance businesses are reliant on such intermediaries to describe and explain their products to potential customers, and although we take precautions to avoid this result, such intermediaries may be deemed to have acted on our behalf. If that occurs, the intentional or unintentional misrepresentation of our subsidiaries’ products and services in advertising materials or other external communications, or inappropriate activities by our personnel or an intermediary could result in liability for us and have an adverse effect on our reputation and business prospects, as well as lead to potential regulatory actions or litigation. In addition, as a result of our acquisitions, we rely on third-party administrators (“TPAs”) to administer a portion of our annuity contracts, as well as a small amount of legacy life insurance business written by Athene Annuity & Life Assurance Company of New York (“AANY”). We currently rely on these TPAs to administer a number of our policies. In addition, to the extent any of these TPAs do not administer our business appropriately, we may experience customer complaints, regulatory intervention and other adverse impacts, which could affect our future growth and profitability. If any of these TPAs or their employees are found to have made material misrepresentations to our policyholders, violated applicable insurance, privacy or other laws and regulations or otherwise engaged in misconduct, we could be held liable for their actions, which could adversely affect our reputation and business prospects, as well as lead to potential regulatory actions or litigation. Additionally, if any of these TPAs fails to perform in accordance with our standards, we may incur additional costs in connection with finding and retaining new TPAs, which may divert the time and attention of our senior management from our business.
Additionally, past or future misconduct by agents that distribute our subsidiaries’ products or employees of our vendors could result in violations of law by us, regulatory sanctions and/or serious reputational or financial harm and the precautions we take to prevent and detect this activity may not be effective in all cases. Although we employ controls and procedures designed to monitor associates’ business decisions and to prevent us from taking excessive or inappropriate risks, associates may take such risks regardless of such controls and procedures. In addition, annuity sales to seniors have been the subject of increased scrutiny by FINRA and state insurance regulators, and have been the source of industry litigation in situations where annuity sales have allegedly been unsuitable for the financial needs of seniors. Further, on April 6, 2016, the DOL issued a new regulation which imposes upon third parties who sell annuities within Employee Retirement Income Security Act of 1974 (as amended, “ERISA”) plans or to individual retirement account (“IRA”) holders a fiduciary duty to the retirement investor. For the nine months ended September 30, 2016, of our total deposits of approximately $6.9 billion from our organic channels, 38% was associated with sales of FIAs to employee benefit plans and IRAs and 16% was associated with traditional fixed annuities sold to employee benefit plans and IRAs. For the year ended December 31, 2015, of our total deposits of $3.9 billion from our organic channels, 48% was associated with sales of FIAs to employee benefit plans and IRAs and 8% was associated with traditional fixed annuities sold to employee benefit plans and IRAs. See “Business—Products—Annuities.” The requirements of the regulation will begin to be implemented on April 10, 2017, with full implementation on January 1, 2018. The DOL regulation regarding fiduciary obligations of distributors of products to retirement accounts may result in additional compliance costs to us, regulatory scrutiny and litigation, as well as reduced sales of our products. As the fiduciary regulations are not currently in effect, we are not able to assess the actual impact such regulations may have on us and our associates. However, when fully implemented such regulations may have an adverse effect on our results of operations and financial condition.
If we lose or fail to retain our senior executives or other key personnel and are unable to attract qualified personnel, our ability to execute our growth plans and operate our business could be impeded or adversely affected, which could significantly and negatively affect our business.
Our success depends in large part on our ability to attract and retain key people, including senior executives, sales and distribution professionals, actuarial and finance professionals and information technology
47
Table of Contents
professionals. Intense competition exists for key employees with demonstrated ability, and we may be unable to hire or retain such employees. Accordingly, the loss of services of one or more of the members of our senior management could delay or prevent us from fully implementing our business strategy and, consequently, significantly and negatively impact our business. The unexpected loss of members of our senior management or other key employees could have a material adverse effect on our operations due to the loss of their skills, knowledge of our business and their years of industry experience as well as the potential difficulty of promptly finding qualified replacement employees. We also rely upon the knowledge and experience of employees involved in functions that require technical expertise in order to provide for sound operational controls for our overall enterprise, including the accurate and timely preparation of required regulatory filings and financial statements and operation of internal controls. A loss of such employees could adversely impact our ability to execute key operational functions and could adversely affect our operational controls, including our internal control over financial reporting.
Foreign currency fluctuations may reduce our net income and our capital levels, adversely affecting our financial condition.
We are exposed to foreign currency exchange rate risk both as a result of our acquisition of our German Group Companies, which conduct business in a variety of non-U.S. currencies, and the investments in our investment portfolio that are denominated in currencies other than the U.S. dollar or are issued by entities which primarily conduct their business outside of the U.S. We may employ various strategies (including hedging) to largely manage our exposure to foreign currency exchange risk. To the extent that these exposures are not fully hedged or the hedges are ineffective, our results or equity may be reduced by fluctuations in foreign currency exchange rates that could materially adversely affect our financial condition and results of operations.
The vote by the United Kingdom mandating its withdrawal from the EU could have an adverse affect on our business and investments.
The recent vote by the United Kingdom to exit the EU, or Brexit, has created significant volatility in the global financial markets. However, the eventual effects of the UK’s withdrawal from the EU on our business or our investment portfolios is uncertain at this time and will depend on agreements the UK makes to retain access to EU markets either during a transitional period or more permanently. Brexit could impair the ability of our German companies to transact business in the future in the UK, including by restricting the free travel of employees from and to the UK and through legal uncertainty and potentially divergent national laws and regulations as the UK determines which EU laws to replace or replicate. Furthermore, Brexit is likely to continue to adversely affect European and worldwide economic conditions and could contribute to greater instability in the global financial markets before and after the terms of the UK’s future relationship with the EU are settled. These effects could have an adverse affect on our business and investments.
Our operations may be affected by the introduction of an EU financial transaction tax (“FTT”).
On February 14, 2013, the European Commission (the “EC”) published a proposal for a Directive for a common FTT in those EU Member States which choose to participate (the “FTT Zone”) and the proposal was included in the EC’s work program for 2014, published on October 22, 2013.
The proposed FTT has broad scope and would apply to financial transactions where at least one party to the transaction is established in the FTT Zone and either that party or another party is a financial institution establised in the FTT Zone. The term “financial institution” covers a wide range of entities, including insurance and reinsurance undertakings. The term “financial transaction” includes the sale and purchase of a financial instrument, a transfer of risk associated with a financial instrument and the conclusion or modification of a derivative. The proposed minimum rate of tax is 0.1% of the consideration, or 0.01% of the notional amount in relation to a derivative. A financial institution may be deemed to be “established” in the FTT Zone, even if it has no business presence there, for example, if the underlying financial instrument is issued in the FTT Zone.
48
Table of Contents
In the period following its publication in February 2013, the FTT proposal has both been subject to significant negotiation between the participating EU Member States and the subject of a legal challenge. As a result, both the scope of any FTT, as well as the timing of implementation, has been somewhat unclear.
In December 2015, those EU Member States that remain committed to the introduction of the FTT announced that they had reached a broad understanding as to the possible foundations for the FTT. At that time, those EU Member States intended to reach a final agreement by the summer of 2016. Although an agreement was not reached during the summer of 2016, the relevant EU Member States reached an agreement in October 2016 on the basic outline of the FTT, and have directed the European Commission to draft an EU directive authorizing the FTT. A draft of this directive and the FTT legislation is expected in December 2016. It is now possible that a form of FTT could be enacted, taking effect in 2018.
It remains clear, however, that further work will still be required in order to settle both the scope and application of any FTT, and further legal challenges may yet arise.
The introduction of an FTT in this or similar form could have an adverse effect on our results of operations.
Our business in Bermuda could be adversely affected by Bermuda employment restrictions.
As of September 30, 2016, we employed approximately 20 non-Bermudians in our Bermuda office (other than spouses of Bermudians, holders of permanent residents’ certificates and holders of working residents’ certificates). We may hire additional non-Bermudians as our business grows. Under Bermuda law, non-Bermudians (other than spouses of Bermudians, holders of permanent residents’ certificates and holders of working residents’ certificates) generally may not engage in any gainful occupation in Bermuda without a valid government work permit (with certain exceptions). A work permit is generally granted or renewed upon showing that, after proper public advertisement, no Bermudian, spouse of a Bermudian, or holder of a permanent resident’s or working resident’s certificate who meets the minimum standards reasonably required by the employer has applied for the job. Work permit terms that are available for request range from three months to five years. We may not be able to use the services of one or more of our non-Bermudian employees if we are not able to obtain work permits for them, which could have a material adverse effect on our business, financial condition and results of operations.
Interruption or other operational failures in telecommunications, information technology and other operational systems or a failure to maintain the security, integrity, confidentiality or privacy of sensitive data residing on those systems, including as a result of human error, could have a material adverse effect on our business.
We are highly dependent on automated and information technology systems to record and process our internal transactions and transactions involving our customers, as well as to calculate reserves, value our investment portfolio and complete certain other components of our financial statements. We could experience a failure of one of these systems, our employees or agents could fail to monitor and implement enhancements or other modifications to a system in a timely and effective manner or our employees or agents could fail to complete all necessary data reconciliation or other conversion controls when implementing a new software system or modifications to an existing system. Additionally, anyone who is able to circumvent our security measures and penetrate our information technology systems could access, view, misappropriate, alter or delete information in the systems, including personally identifiable customer information and proprietary business information. Information security risks also exist with respect to the use of portable electronic devices, such as laptops, which are particularly vulnerable to loss and theft.
We believe that we have established and implemented appropriate security measures, controls and procedures to safeguard our information technology systems and to prevent unauthorized access to such systems and any data processed or stored in such systems, and we periodically evaluate and test the adequacy of such
49
Table of Contents
systems, controls and procedures. In addition, we have established a business continuity plan which is designed to ensure that we are able to maintain all aspects of our key business processes functioning in the midst of certain disruptive events, including any disruptions to or breaches of our information technology systems. Despite the implementation of security and back-up measures, our information technology systems may be vulnerable to physical or electronic intrusions, viruses or other attacks, programming errors and similar disruptions. We may also be subject to disruptions of any of these systems arising from events that are wholly or partially beyond our control (for example, natural disasters, acts of terrorism, epidemics, computer viruses and electrical or telecommunications outages). All of these risks are also applicable where we rely on outside vendors to provide services to us and our customers. The failure of any one of these systems for any reason, or errors made by our employees or agents, could in each case cause significant interruptions to our operations, which could harm our reputation, adversely affect our internal control over financial reporting or have a material adverse effect on our business, financial condition and results of operations.
We retain confidential information in our information technology systems and those of our business partners, and we rely on industry standard commercial technologies to maintain the security of those systems. Despite our implementation of network security measures, our servers could be subject to physical and electronic intrusions, and similar disruptions from unauthorized tampering with our computer systems. While we perform annual penetration tests and have adopted a number of measures to protect the security of customer and company data, and to our knowledge have not experienced a successful cyber attack that has resulted in any material compromise in the security of our information technology systems, there is no guarantee that such an attack will not occur or be successful in the future.
In addition, an increasing number of jurisdictions require that customers be notified if a security breach results in the disclosure of personally identifiable customer information. Any compromise of the security of our information technology systems that results in inappropriate disclosure or use of personally identifiable customer information could damage the reputation of our brand in the marketplace, deter purchases of our products, subject us to heightened regulatory scrutiny or significant civil and criminal liability and require us to incur significant technical, legal and other expenses.
We may be the target or subject of, and may be required to defend against or respond to, litigation (including class action litigation), enforcement investigations or regulatory scrutiny.
We, like other financial services companies, are involved in litigation and arbitration in the ordinary course of business. More generally, we operate in an industry in which various practices are subject to regulatory scrutiny and potential litigation, including class actions and enforcement investigations. Plaintiffs may seek large or indeterminate amounts of damages, including compensatory, liquidated, treble and/or punitive damages. In addition, we sell our products through third parties, including IMOs, whose activities may be difficult to monitor. Civil jury verdicts have been returned against insurers and other financial services companies involving sales, underwriting practices, product design, product disclosure, administration, denial or delay of benefits, charging excessive or impermissible fees, recommending unsuitable products to customers, breaching fiduciary or other duties to customers, refund or claims practices, alleged agent misconduct, failure to properly supervise representatives, relationships with agents or other persons with whom the insurer does business, payment of sales or other contingent commissions and other matters. Such lawsuits can result in substantial judgments that are disproportionate to actual damages, including material amounts of punitive or non-economic compensatory damages. In some states, juries, judges and arbitrators have substantial discretion in awarding punitive, or non-economic, compensatory damages, which creates the potential for unpredictable material adverse judgments or awards in any given lawsuit or arbitration. Arbitration awards are subject to very limited appellate review. In addition, in some class action and other lawsuits, financial services companies have made material settlement payments. Given the large or indeterminate amounts sometimes sought, and the inherent unpredictability of litigation, it is also possible that in certain cases an ultimate unfavorable resolution of one or more pending litigation matters could have a material and adverse effect on our financial condition. See “Business—Legal Proceedings.”
50
Table of Contents
Risks Relating to Our Investment Manager
We rely on our investment management or advisory agreements with AAM and AAME for the management of our investment portfolio. AAM and AAME may terminate these arrangements at any time, and there are limitations on our ability to terminate such arrangements, which may adversely affect our investment results.
We rely on AAM and AAME to provide us with investment management and advisory services pursuant to various investment management agreements (“IMAs”) and advisory agreements. AAM and AAME rely in part on their ability to attract and retain key people, and the loss of services of one or more of the members of AAM’s or AAME’s senior management could delay or prevent AAM or AAME from fully implementing our investment strategy. Our bye-laws provide that we may not, and will cause our subsidiaries not to, terminate any IMA or advisory agreement among us, our subsidiaries and AAM or AAME without cause before October 31, 2018 (or any third anniversary thereafter) (each such date, an “IMA Termination Date”) and any termination on an IMA Termination Date without cause requires (i) the approval of our board of directors and at least 50% of the total issued shares of AHL that are entitled to vote (giving effect to the voting allocation provisions set forth in our bye-laws) and (ii) six months’ prior written notice to AAM or AAME of such termination. Notwithstanding the foregoing, any such IMA may be terminated by our board of directors for cause (as defined in our bye-laws), which includes (a) material violations of law relating to AAM’s or AAME’s advisory business, (b) AAM’s or AAME’s gross negligence, willful misconduct or reckless disregard of AAM’s or AAME’s obligations under the relevant agreement, (c) a determination by the board of directors, in its sole discretion and acting in good faith, on an annual basis, of unsatisfactory long-term performance of AAM or AAME, or (d) a determination by the board of directors, in its sole discretion and acting in good faith, on an annual basis, that the fees being charged by AAM or AAME are unfair and excessive compared to a comparable asset manager (provided, that in the case of the immediately preceding clauses (c) and (d), the board of directors must deliver notice of such determination to AAM or AAME, as applicable, and AAM or AAME, as applicable, shall have 30 days after receipt of such notice to address the board of directors’ concerns, and provided, further, that in the case of the immediately preceding clause (d), AAM or AAME has the right to lower its fees to match the fees of such comparable asset manager). However, our organizational documents give our board of directors complete discretion as to whether to determine if a for cause termination event has occurred under any IMA and therefore the board of directors may never elect to make such a determination. Five of our 16 directors are employees of or consultants to Apollo and our Chairman, Chief Executive Officer and Chief Investment Officer is an employee of AAM, and under Bermuda law, such directors would be allowed to vote on any resolution to terminate an IMA as long as they declare their conflict. Further, except in limited circumstances, we currently pay AAM 40 basis points per annum on assets managed and we pay additional fees to Apollo and its affiliates for providing sub-advisory services and acting as manager of investment funds in which we invest. Any such fees may be higher than what other investment managers may be willing to charge us currently for investment services. Because of the services and the unique acquisition opportunities provided by AAM that we are able to access that many other companies cannot access, we do not currently expect our board of directors would elect to terminate any IMA. These limitations on our ability to terminate the IMAs or advisory agreements with AAM or AAME could have a negative effect on our financial condition and results of operations. In addition, the boards of directors of AHL’s subsidiaries may terminate an investment management or advisory agreement with AAM or AAME relating to the applicable subsidiary if such subsidiary’s board of directors determines that such termination is required in the exercise of its fiduciary duties. If our subsidiaries do elect to terminate any such agreement, other than as provided above, we may be in breach of our bye-laws, which could subject us to regulatory scrutiny, expose us to shareholder lawsuits and could have a negative effect on our financial condition and results of operations.
Conversely, we may be adversely affected if AAM or AAME elect to terminate an IMA at a time when such agreement remains advantageous to us. We depend upon AAM and AAME to implement our investment strategy. However, AAM and AAME do not face the restrictions described above with regards to its ability to terminate any of its agreements with us and may terminate such agreements at any time. If AAM or AAME choose to terminate such agreements, there is no assurance that we could find a suitable replacement or that certain of the opportunities made available to us as a result of our relationship with AAM and AAME would be offered by a suitable replacement, and therefore our results of operations and financial condition could be adversely impacted by our failure to retain a satisfactory investment manager.
51
Table of Contents
Interruption or other operational failures in telecommunications, information technology and other operational systems at AAM or AAME or a failure to maintain the security, integrity, confidentiality or privacy of sensitive data residing on AAM’s or AAME’s systems, including as a result of human error, could have a material adverse effect on our business.
We are highly dependent on AAM and AAME, as our investment manager and adviser, respectively, to maintain information technology and other operational systems to record and process their transactions with respect to our investment portfolio, which includes providing information to us to enable us to value our investment portfolio that may affect our GAAP or U.S. statutory accounting principles (“SAP”) financial statements. AAM or AAME could experience a failure of one of these systems, their employees or agents could fail to monitor and implement enhancements or other modifications to a system in a timely and effective manner or their employees or agents could fail to complete all necessary data reconciliation or other conversion controls when implementing a new software system or modifications to an existing system. Additionally, anyone who is able to circumvent AAM’s or AAME’s security measures and penetrate their information technology systems could access, view, misappropriate, alter or delete information in the systems, including proprietary information relating to our investment portfolio. The maintenance and implementation of these systems at AAM and AAME is not within our control. Should AAM’s or AAME’s systems fail to accurately record information pertaining to our investment portfolio, we may inadvertently include inaccurate information in our financial statements and experience a lapse in our internal control over financial reporting. The failure of any one of these systems at AAM or AAME for any reason, or errors made by their employees or agents, could in each case cause significant interruptions to their operations, which could adversely affect our internal control over financial reporting or have a material adverse effect on our business, financial condition and results of operations.
The historical performance of AAM and AAME should not be considered as indicative of the future results of our investment portfolio, our future results or any returns expected on our common shares.
Our investment portfolio’s returns have benefitted historically from investment opportunities and general market conditions that currently may not exist and may not repeat themselves, and there can be no assurance that either AAM or AAME will be able to avail itself of profitable investment opportunities in the future. Furthermore, the historical returns of our investments managed by AAM and AAME are not directly linked to returns on our common shares, which are affected by various factors, one of which is the value of our investment portfolio. In addition, each of AAM and AAME are compensated based solely on our assets which they manage rather than by investment return targets. Accordingly, there can be no guarantee that either AAM or AAME will be able to achieve any particular return for our investment portfolio in the future.
We evaluate AAM’s past performance, in part, based upon the total return that AAM is able to generate in managing our investment portfolio. Such total return values have been included in this prospectus. See “Business—Investment Management.” Such values are prepared by AAM and involve the use of estimates and assumptions that are not within our control and further involve the use of certain figures that are not derived from our books and records and may be unaudited.
If either AAM or AAME loses or fails to retain its senior executives or other key personnel and is unable to attract qualified personnel, its ability to provide us with investment management and advisory services could be impeded or adversely affected, which could significantly and negatively affect our business.
AAM and AAME depend in large part on their ability to attract and retain key people, including senior executives, finance professionals and information technology professionals. Intense competition exists for key employees with demonstrated ability, and AAM or AAME may be unable to hire or retain such employees. Accordingly, the loss of services of one or more of the members of AAM’s or AAME’s senior management could delay or prevent AAM or AAME from fully implementing our investment strategy and, consequently, significantly and negatively impact our business. The unexpected loss of members of AAM’s or AAME’s senior management or other key employees could have a material adverse effect on AAM’s or AAME’s operations due
52
Table of Contents
to the loss of their skills, knowledge of AAM’s or AAME’s business and their years of industry experience as well as the potential difficulty of promptly finding qualified replacement employees. A loss of such employees could adversely impact AAM’s or AAME’s ability to execute key operational functions and could adversely affect our investment portfolio and results of operations.
Increased regulation or scrutiny of alternative investment advisers and certain trading methods may affect AAM’s and AAME’s ability to manage our investment portfolio or affect our business reputation.
The regulatory environment for investment managers is evolving, and changes in the regulation of investment managers may adversely affect the ability of AAM and AAME to effect transactions that utilize leverage or to pursue their strategies in managing our investment portfolio. In addition, the securities and futures markets are subject to comprehensive statutes, regulations and margin requirements. Furthermore, our German Group Companies and their investments are subject to additional investment restrictions that may prevent our German Group Companies from investing in assets with sufficient yields to meet our targeted returns. The Securities and Exchange Commission (“SEC”), other regulators and self-regulatory organizations and exchanges are authorized to take extraordinary actions in the event of market emergencies. Due to our reliance on AAM and AAME to manage our investment portfolio, any regulatory action or enforcement against AAM or AAME could have an adverse effect on our financial condition. Additionally, the regulation of derivatives transactions is an evolving area of law and is subject to modification by government and judicial action. Any future regulatory change could have a significant negative impact on our financial condition and results of operations.
Risks Relating to Insurance and Other Regulatory Matters
Our industry is highly regulated and we are subject to significant legal restrictions, regulations and regulatory oversight in connection with the operations of our business, including the discretion of various governmental entities in applying such restrictions and regulations and these restrictions may have a material adverse effect on our business, financial condition, liquidity, results of operations, cash flows and prospects.
U.S. State Regulation
Our domestic insurance subsidiaries’ businesses are subject to government regulation in each of the states in which they conduct business. Such regulation is vested in state agencies having broad administrative, and in some instances discretionary, authority with respect to many aspects of our business, which may include, among other things, the investments we can acquire and hold, reserve requirements, marketing practices, advertising, maintaining policyholder privacy, policy forms, restrictions on the ability of our subsidiaries to pay dividends or other distributions to us, reinsurance and other transactions with our affiliates, acquisitions, mergers and capital adequacy. These requirements are concerned primarily with the protection of policyholders rather than shareholders. See “Business—Regulation—United States—General.” Regulators and other authorities have the power to bring administrative or judicial proceedings against us, which could result, among other things, in suspension or revocation of our licenses, cease and desist orders, fines, civil penalties, criminal penalties or other disciplinary action which could materially harm our results of operations and financial condition. If we fail to address, or appear to fail to address, appropriately any of these matters, our reputation could be harmed and we could be subject to additional legal risk, which could increase the size and number of claims and damages asserted against us or subject us to enforcement actions, fines and penalties.
Each state has legislation in place that requires U.S. insurers domiciled in such state to furnish certain information concerning their operations and the interrelationships and transactions among companies within their holding company systems and their respective affiliates that may materially affect the operations, management or financial condition of the insurers within the system. Generally, these laws require that all transactions between insurers and affiliates be fair and reasonable and sometimes require prior notice to the regulators and regulatory approval. Changes to these laws that result in more stringent requirements could negatively impact our ability to conduct transactions with our affiliates, including investments into funds managed by Apollo and its affiliates,
53
Table of Contents
dividends or distributions from our subsidiaries to us (as described more fully below) and by us to our shareholders, reinsurance agreements among our affiliates or our acquisition strategy. Such changes and any resulting inability to or increased cost associated with transactions with our affiliates could materially adversely impact our business, financial condition, results of operations and cash flows.
Current law of the States of Delaware, Iowa and New York (the “Athene Domiciliary States”) permits the payment of dividends or distributions which, together with dividends or distributions paid during (i) in the case of Delaware and Iowa, the preceding twelve months, do not exceed the greater of (1) 10% of the insurer’s surplus as regards policyholders as of the immediately preceding year end, or (2) the net gain from operations of the insurer for the preceding twelve-month period ending as of the immediately preceding year end or (ii) in the case of New York, any calendar year, do not exceed the lesser of (1) 10% of the insurer’s surplus as regards policyholders as of the end of the immediately preceding calendar year, or (2) the net gain from operations of the insurer for the immediately preceding calendar year, not including realized capital gains. Any proposed dividend in excess of this amount is considered an “extraordinary dividend” or “extraordinary distribution” and may not be paid until it has been approved, or a 30-day waiting period has passed during which it has not been disapproved, by the commissioner or director of the insurance department of the applicable Athene Domiciliary State (each, a “Commissioner”). These restrictions limit our U.S. insurance subsidiaries’ ability to pay dividends to us. Any further changes to state regulations that further restrict our U.S. insurance subsidiaries’ ability to declare and pay dividends or pay distributions to us could have a materially adverse effect on our financial condition and results of operations.
At any given time, we and our domestic insurance subsidiaries may be the subject of a number of ongoing financial or market conduct examinations, audits or inquiries. From time to time, regulators raise issues during such examinations that could, if determined adversely, have a material impact on our insurance subsidiaries’ businesses or result in fines for improper market conduct. As part of their routine regulatory oversight process, state insurance departments conduct periodic detailed examinations, generally once every three to five years, of the books, records, accounts and operations of insurance companies that are domiciled in their states. Examinations are generally carried out in cooperation with the insurance departments of other, non-domiciliary states under guidelines promulgated by the NAIC. Financial examinations of our domestic insurance subsidiaries were recently completed in each Athene Domiciliary State with no findings that are expected to have a material adverse effect on our domestic insurance subsidiaries. Additionally, our domestic insurance subsidiaries are also subject to periodic market conduct examinations in each state in which they do business, pursuant to which state regulators examine an insurer’s compliance with applicable insurance laws and regulations, including, among other things, the form and content of disclosure to consumers, illustrations, advertising, sales practices and complaint handling of any insurance company doing business in that state.
Another topic of which various regulators and state officials have had an interest in recent years is the topic of unclaimed property and the use of the U.S. Social Security Administration’s Social Security Death Index (the “Death Master File”). In 2013, prior to our acquisition of the company, Aviva USA entered into multi-state settlement agreements with the insurance regulators and treasurers for 48 states in connection with certain of its subsidiaries’ use of the Death Master File. As part of the settlement, AAIA and its subsidiary ALICNY agreed to pay a $4 million assessment for examination, compliance and monitoring costs without admitting any liability or wrongdoing, and further agreed to adopt policies and procedures reasonably designed to ensure timely payment of valid claims to beneficiaries in accordance with insurance laws and to timely report and remit unclaimed proceeds to the appropriate states in connection with unpaid property laws. Our U.S. insurance subsidiaries could continue to be subject to risks related to unpaid benefits, the Death Master File, and the procedures required by the prior multi-state settlement as they relate to our annuity business. Furthermore, administrative challenges associated with implementing the procedures described above may make compliance with the multi-state settlement and applicable law difficult and could have a material and adverse effect on our results of operations. Moreover, AADE is currently undergoing a multi-state unclaimed property examination led by Verus Financial, on behalf of California, Florida, Georgia, Indiana, Louisiana, North Carolina, Ohio, Pennsylvania, Tennessee, and Texas. Further, Liberty Life is a defendant in a lawsuit filed by the West Virginia Treasurer, State of West Virginia ex rel. John D. Perdue v. Liberty Life Ins. Co., Case No. 12-C-419, pursuant to which the Treasurer
54
Table of Contents
alleges that Liberty Life failed to adopt reasonable procedures, such as using the Death Master File, to identify deceased insureds with unpaid death benefits and timely escheat those unclaimed benefits to the state. The Treasurer accordingly seeks to recover unpaid death benefits, statutory interest and penalties. We are unable to determine with any certainty whether such unclaimed property examination and litigation could result in a finding of unpaid benefits or other liability, but given the nature of such examinations, litigation and past settlements at our other subsidiaries and within the life insurance industry in general, it is possible the examination could result in a material and adverse effect on our results of operations.
We are also subject to state regulation regarding any potential acquisitions or changes of control, both with regards to our own subsidiaries and to those companies or businesses which we may in the future acquire. Most state insurance holding company system acts require consents from applicable insurance departments prior to the direct or indirect acquisition or change of control of an insurer or its holding company. Generally, acquiring a 10% or greater voting interest in an insurance company or its parent company is presumptively considered a change of control under these statutes, and the acquirer is presumptively a controlling person of the insurer or its holding company. Current regulatory barriers to acquisitions of insurers and any new regulatory barriers adopted may increase the costs of implementing our acquisition strategy or may prevent certain acquisitions entirely. Additionally, these regulatory barriers and limitations on ownership that potential purchasers of our common shares may observe in order to avoid being deemed controlling persons may decrease the attractiveness of any future offering of our common shares and may delay, defer or prevent a change of control of us or impede a merger, takeover or other business combination which our shareholders may otherwise view favorably. See “Business—Regulation—United States—Insurance Holding Company Regulation.”
Most, if not all, of the states where we are licensed to transact business require that insurers doing business within the state participate in a guaranty association, which is organized to pay contractual benefits owed pursuant to insurance policies issued by impaired, insolvent or failed insurers. These associations have the right to assess insurance companies doing business in their state in order to help pay the obligations of insolvent insurance companies to policyholders and claimants. Because the amount and timing of an assessment is beyond our control, liabilities we have currently established for these potential assessments may not be adequate.
Other U.S. Regulation
Our subsidiaries’ insurance, annuity, retirement and investment products are subject to a complex and extensive array of laws that are administered and enforced by state securities administrators, state banking authorities, the SEC, FINRA, the DOL, the Internal Revenue Service (“IRS”) and the Office of the Comptroller of the Currency. Failure to comply with these laws and limitations could subject us to administrative penalties imposed by a particular governmental or self-regulatory authority, unanticipated costs associated with remedying such failure or other claims, harm to our reputation, interruption of our operations or an adverse impact on our profitability.
We also may be subject to regulation by the DOL when providing a variety of products and services to employee benefit plans governed by ERISA. Severe penalties are imposed for breach of duties under ERISA. In addition, we will be subject to regulation by the DOL with respect to recommendations involving an IRA.
In addition to the foregoing risks, the financial services industry is the focus of increased regulatory scrutiny as various state and federal governmental agencies and self-regulatory organizations conduct inquiries and investigations into the products and practices of the financial services industries. The extreme turmoil in the financial markets in recent years has increased the likelihood of changes in the way the financial services industry is regulated. Governmental authorities in the United States and worldwide have become increasingly interested in potential risks posed by the insurance industry as a whole, and to commercial and financial systems in general. Among the proposals that are at present being considered are the possible introduction of global regulatory standards for the amount of capital that insurance groups must maintain across the group. While we cannot predict the exact nature, timing or scope of possible governmental initiatives, there may be increased regulatory intervention in the insurance and financial services industry in the future.
55
Table of Contents
Bermuda Licensing
Because we are a Bermuda company, we are subject to changes in Bermuda law and regulation that may have an adverse impact on our operations, including through the imposition of tax liability or increased regulatory supervision. As a holding company, AHL is not subject to the laws of Bermuda governing insurance companies; however, ALRe is registered in Bermuda under the Insurance Act of 1978 (Bermuda) as a Class E insurer and is subject to the Insurance Act of 1978 (Bermuda) and the rules and regulations promulgated thereunder (the “Bermuda Insurance Act”).
Additionally, the BMA sought “regulatory equivalency” which enables Bermuda’s commercial insurers to transact business with the EU on a “level playing field.” In connection with its initial efforts to achieve equivalency under Solvency II, the BMA implemented and imposed additional requirements on the companies it regulates, such as ALRe. On November 26, 2015, via delegated act, the EC granted Bermuda’s commercial insurers full equivalence in all areas of Solvency II for an indefinite period of time. The EC’s act was reviewed and approved by the European Parliament and Council and no objection was made. On March 4, 2016, the delegated act was published in the official journal of the EU. The grant of full equivalence came into force on March 24, 2016 and applies from January 1, 2016.
Additionally, changes to applicable Bermuda laws and regulations regarding dividends or distributions from our subsidiaries to us could adversely affect us. All Bermuda companies must comply with the provisions of the Companies Act 1981 (Bermuda) (the “Companies Act”) regulating the payment of dividends and distributions from contributed surplus. Under the Companies Act, a Bermuda company may not declare or pay a dividend or make a distribution out of contributed surplus if the company has reasonable grounds for believing that it is or will after the payment be unable to pay its liabilities as they become due or the realizable value of the company’s assets would thereby be less than its liabilities. As ALRe is a licensed reinsurer and regulated by the BMA, it is additionally required to comply with the provisions of the Bermuda Insurance Act regarding payments of dividends and distributions. Under the Bermuda Insurance Act, an insurer is prohibited from declaring or paying a dividend if in breach of its ECR or MMS or if the declaration or payment of such dividend would cause such a breach. Where an insurer fails to meet its solvency margin on the last day of any financial year, it is prohibited from declaring or paying any dividends during the next financial year without the approval of the BMA.
Under the Bermuda Insurance Act, ALRe is prohibited from paying a dividend in an amount exceeding 25% of the prior year’s total statutory capital and surplus, unless at least two members of ALRe’s board of directors and its principal representative in Bermuda sign and submit to the BMA an affidavit attesting that a dividend in excess of this amount would not cause ALRe to fail to meet its relevant margins. In certain instances, ALRe would also be required to provide prior notice to the BMA in advance of the payment of dividends. In the event that such an affidavit is submitted to the BMA in accordance with the Bermuda Insurance Act, and further subject to ALRe meeting its MMS and ECR, ALRe is permitted to distribute up to the sum of 100% of statutory surplus and an amount less than 15% of its total statutory capital. Distributions in excess of this amount require the approval of the BMA.
Further, ALRe must obtain the BMA’s prior approval before reducing its total statutory capital as shown in its previous financial year statutory balance sheet by 15% or more. ALRe is also required to obtain a certification from its approved actuary prior to declaring or paying any dividends and such certificate will not be given unless the value of its long-term business assets exceeds its long-term business liabilities, as certified by its approved actuary, by the amount of the dividend and at least the MMS.
German Laws and Regulation
Our German Group Companies licensed as insurers are subject to the relevant laws and regulations applicable to insurers in Germany which regulate and mandate, among other things, eligibility criteria for investments, policyholder participation in income, accounting principles, corporate governance requirements,
56
Table of Contents
regulatory capital, reporting of insurance undertakings, insurance contracts, consumer protection laws, data protection requirements and anti-money-laundering requirements. Our German Group Companies are subject to supervision by the Federal Financial Supervisory Authority (“BaFin”). BaFin is the central financial regulatory authority for Germany and has wide powers to interpret and execute the insurance supervisory law in Germany, in particular via issuing regulatory ordinances and guidelines. Further, BaFin plays a significant role in interpreting the requirements of the Solvency II regime which became effective as of January 1, 2016. While we strive to ensure strict regulatory compliance, in particular compliance with all regulations and guidelines as issued by BaFin, we may be subject to non-compliance with these regulations which could result in unforeseen rectification costs and/or regulatory fines, which could adversely affect our business.
We are also subject to German laws and regulations regarding potential future acquisitions of German companies or businesses. Pursuant to German regulatory law, the direct or indirect acquisition of a significant interest in a German insurance undertaking or the increase of a qualified participating interest in a German insurance undertaking exceeding certain thresholds is subject to BaFin approval or the expiration of a statutory non-objection period. Generally, indirectly or directly acquiring a 10% or greater capital or voting interest in an insurance undertaking or obtaining the ability to significantly influence the management of the insurance undertaking is considered a qualified participating interest under German regulatory laws. Laws such as these prevent any person from directly or indirectly acquiring qualified participating interests in any of our German insurance subsidiaries unless that person has filed a notification requiring specified information with BaFin and has obtained BaFin’s prior approval or waited for the expiration of a statutory non-objection period. Since we are indirectly holding a 100% capital and voting interest in German insurance undertakings, the acquisition of a capital or voting interest of 10% or more in AHL could qualify as an indirect acquisition of a qualified participating interest in German insurance undertakings. Persons directly or indirectly holding a qualified participating interest in a German insurance undertaking are subject to notification and other regulatory obligations imposed by BaFin.
Current and future regulatory barriers to acquisitions of insurers may increase the costs of implementing our acquisition strategy or may prevent certain acquisitions entirely. Additionally, regulatory barriers on acquisitions or the increase of qualified participating interests (among other things, the avoidance of an acquisition of capital or voting interest of 10% or more in AHL) that potential purchasers of our common shares may be required to observe in order to avoid being deemed a person acquiring or increasing a qualified participating interest may decrease the attractiveness of this offering and any future offering of our common shares. These regulatory barriers may also delay, defer or prevent a change of control if the potential purchaser acquires a qualified participating interest, as BaFin effectively has the right to void such a purchase.
Further, purchases of our common shares significantly in excess of 10% may result in the formation of a Solvency II group, resulting in the application of Solvency II to the purchaser or its ultimate parent, thereby subjecting such entity to requirements including group solvency requirements and group corporate governance provisions. Formation of a Solvency II group may occur if the purchaser qualifies as an indirect parent of the German insurers (if the purchaser acquires more than 50% of capital or voting interest in AHL or otherwise controls AHL). This applies regardless of the home state of the ultimate parent, but excludes countries with regulatory regimes deemed equivalent to Solvency II.
Luxembourg Regulation
Our Luxembourg subsidiary is subject to supervision by the Commission de Surveillance du Secteur Financier (“CSSF”) and Luxembourg regulation for management companies of investment funds. We do not believe that our Luxembourg subsidiary is governed by directive 2011/61/EU of the European Parliament and of the Council of June 8, 2011 on Alternative Investment Fund Managers and it is currently registered accordingly with the CSSF on the basis of a self-assessment. In the absence of a final decision by the relevant Luxembourg authorities and subject to any policy changes and changes in circumstances on which the self-assessment is based, namely regarding the holding and investment structure, we cannot eliminate the risk of our Luxembourg
57
Table of Contents
subsidiary qualifying as an Alternative Investment Fund Manager, which would subject our subsidiary to enhanced administrative and operating requirements and require us to support our subsidiary with more capital, and could thus adversely affect our financial condition and results of operations. The Luxembourg investment fund managed by our Luxembourg subsidiary is regulated as a specialized investment fund under Luxembourg law and thus is also subject to legislative and/or regulatory developments, which may impact, directly or indirectly, the position and performance of our Luxembourg subsidiary.
Our failure to obtain or maintain approval of insurance regulators and other regulatory authorities as required for the operations of our insurance subsidiaries may have a material adverse effect on our business, financial condition, results of operations, liquidity and prospects.
U.S. state regulators retain the authority to license insurers in their states and an insurer may not operate in a state in which it is not licensed. We have U.S. domiciled insurance subsidiaries that are currently licensed to do business in all 50 states and the District of Columbia. Our ability to retain these licenses depends on our and our subsidiaries’ ability to meet requirements established by the NAIC and adopted by each state such as RBC standards and surplus requirements. Further, our German Group Companies operating insurance businesses are licensed by BaFin. Maintaining such licenses requires compliance with the relevant regulatory provisions, including in particular MCRs as set out under German law and under the Solvency II regime.
Some of the factors influencing these licensing requirements, particularly factors such as changes in equity market levels, the value of certain derivative instruments that do not receive hedge accounting, the value and credit ratings of certain fixed-income and equity securities in our investment portfolio, interest rate changes and changes to the RBC formulas and the interpretation of the NAIC’s instructions with respect to RBC calculation methodologies, are out of our control. If these factors adversely affect us and we are unable to meet the requirements above, our subsidiaries could lose their licenses to do business in certain states, be subject to additional regulatory oversight, have their licenses suspended or be subject to seizure of assets. A loss or suspension of any of our subsidiaries’ licenses may negatively impact our reputation in the insurance market and result in our subsidiaries’ inability to write new business, distribute funds or pursue our investment/overall business strategy.
ALRe, as a Bermuda domiciled insurer, is also required to maintain licenses. ALRe is licensed as a reinsurer only in Bermuda. Bermuda insurance statutes and regulations and policies of the BMA require that ALRe, among other things, maintain a minimum level of capital and surplus, satisfy solvency standards, restrict dividends and distributions, obtain prior approval or provide notification to the BMA, as the case may be, of ownership, transfer and disposition of Shareholder Controller shares, maintain a head office, and have certain officers and a director resident in Bermuda, appoint and maintain a principal representative in Bermuda and provide for the performance of certain periodic examinations of itself and its financial conditions. A failure to meet these conditions may result in the suspension or revocation of ALRe’s license to do business as a reinsurance company in Bermuda, which would mean that ALRe would not be able to enter into any new reinsurance contracts until the suspension ended or it became licensed in another jurisdiction. For any or a number of reasons, the BMA could revoke or suspend ALRe’s license. Any such suspension or revocation of ALRe’s license would negatively impact its and our reputation in the reinsurance marketplace and could have a material adverse effect on our results of operations.
The process of obtaining licenses is time consuming and costly, and we may not be able to become licensed in jurisdictions other than those in which our subsidiaries are currently licensed. The modification of the conduct of our business resulting from our and our subsidiaries becoming licensed in certain jurisdictions could significantly and negatively affect our business. In addition, our inability to comply with insurance statutes and regulations could significantly and adversely affect our business by limiting our ability to conduct business as well as subjecting us to penalties and fines.
58
Table of Contents
Changes in the laws and regulations governing the insurance industry or otherwise applicable to our business, including the newly-issued DOL fiduciary regulation, may have a material adverse effect on our business, financial condition, liquidity, results of operations and prospects.
U.S. Federal Oversight
The recent economic crisis has resulted in numerous changes to regulation and oversight of the financial industry, the full impact of which has yet to be realized. The Dodd-Frank Wall Street Reform and Consumer Protection Act of 2010 (the “Dodd-Frank Act”) makes sweeping changes to the regulation of financial services entities, products and markets. Historically, the federal government has not regulated the insurance business, however, the Dodd-Frank Act generally provides for enhanced federal supervision of financial institutions, including insurance companies in certain circumstances, and financial activities that represent a systemic risk to financial stability or the economy. Certain provisions of the Dodd-Frank Act are or may become applicable to us, our competitors or those entities with which we do business, including, but not limited to: the establishment of a comprehensive federal regulatory regime with respect to derivatives; the establishment of consolidated federal regulation and resolution authority over systemically important financial institutions (“SIFIs”); the establishment of the Federal Insurance Office (“FIO”); changes to the regulation of broker-dealers and investment advisors; changes to the regulation of reinsurance; changes to regulations affecting the rights of shareholders; the imposition of additional regulation over credit rating agencies; the imposition of concentration limits on financial institutions that restrict the amount of credit that may be extended to a single person or entity; and mandatory on-facility execution and clearing of certain derivative contracts.
Numerous provisions of the Dodd-Frank Act require the adoption or implementation of rules or regulations. The process of adopting such implementing rules and/or regulations have in some instances been delayed beyond the timeframes imposed by the Dodd-Frank Act. Until the various final regulations are promulgated, the full impact of the regulations on the company will remain unclear. In addition, the Dodd-Frank Act mandated multiple studies, which could result in additional legislation or regulation applicable to the insurance industry, us, our competitors or those entities with which we do business. Legislative or regulatory requirements imposed by or promulgated in connection with the Dodd-Frank Act may impact us in many ways, including, but not limited to: placing us at a competitive disadvantage relative to our competition or other financial services entities; changing the competitive landscape of the financial services sector or the insurance industry; making it more expensive for us to conduct our business; requiring the reallocation of significant company resources to government affairs; increasing our legal and compliance related activities and the costs associated therewith as the Dodd-Frank Act may permit the preemption of certain state laws when inconsistent with international agreements; and otherwise having a material adverse effect on the overall business climate as well as our financial condition and results of operations.
On April 6, 2016, the DOL issued a new regulation more broadly defining the circumstances under which a person is considered to be a fiduciary by reason of giving investment advice or recommendations to an employee benefit plan or a plan’s participants or to IRA holders. In addition to releasing the investment advice regulation, the DOL: (1) issued a new prohibited transaction class exemption titled the “Best Interest Contract Exemption” (“BICE”), to be used in connection with the sale of FIAs or variable annuities, and (2) updated the previously prohibited transaction class exemption 84-24, to be used in connection with the sale of traditional fixed rate annuities. For the nine months ended September 30, 2016, of our total deposits of approximately $6.9 billion from our organic channels, 38% was associated with sales of FIAs to employee benefit plans and IRAs and 16% was associated with traditional fixed annuities sold to employee benefit plans and IRAs. For the year ended December 31, 2015, of our total deposits of $3.9 billion from our organic channels, 48% was associated with sales of FIAs to employee benefit plans and IRAs and 8% was associated with traditional fixed annuities sold to employee benefit plans and IRAs. See “Business—Products—Annuities.” We cannot predict with any certainty the impact of the new regulation and exemptions, but the regulation and exemptions will alter the way our products and services are marketed and sold, particularly to purchasers of IRAs and individual retirement annuities. If implemented in its current form, the DOL regulation could have an adverse effect on our ability to write new business. The SEC also has indicated that it may propose rules creating a uniform standard of conduct
59
Table of Contents
applicable to broker-dealers and investment advisers, which, if adopted may affect the distribution of our products. Should the SEC rules, if adopted, not align with the finalized DOL regulations related to conflicts of interest in the provision of investment advice, the distribution of our products could be further complicated.
Heightened standards of conduct as a result of the DOL regulation, the SEC proposed rules or another similar proposed rule or regulation could also increase the compliance and regulatory burdens on our representatives, and could lead to increased litigation and regulatory risks, changes to our business model, a decrease in the number of our securities-licensed representatives and a reduction in the products we offer to our clients, any of which could have a material adverse effect on our business, financial condition and results of operations.
In addition, we expect the worldwide demographic trend of population aging will cause policymakers to continue to focus on the framework of U.S. and non-U.S. retirement systems, which may drive additional changes regarding the manner in which individuals plan for and fund their retirement, the extent of government involvement in retirement savings and funding, the regulation of retirement products and services and the oversight of industry participants. Any incremental requirements, costs and risks imposed on us in connection with such current or future legislative or regulatory changes, may constrain our ability to market our products and services to potential customers, and could negatively impact our profitability and make it more difficult for us to pursue our growth strategy.
Non-Bank SIFIs
Title I of the Dodd-Frank Act established the Financial Stability Oversight Council (“FSOC”), which has authority to designate non-bank financial companies as SIFIs, thereby subjecting them to enhanced prudential standards and supervision by the Federal Reserve. The prudential standards for non-bank SIFIs include enhanced RBC requirements, leverage limits, liquidity requirements, single counterparty exposure limits, governance requirements for risk management, stress test requirements, special debt-to-equity limits for certain companies, early remediation procedures, and recovery and resolution planning. Athene USA is above the initial quantitative threshold for treatment as a non-bank SIFI (total consolidated assets of $50 billion, including the assets of its subsidiaries). If the FSOC were to designate Athene USA as a non-bank SIFI, Athene USA would become subject to certain of these enhanced prudential standards.
FIAs
In recent years, the SEC and state securities regulators have questioned whether FIAs, such as those sold by us, should be treated as securities under the federal and state securities laws rather than as insurance products exempted from such laws. Under the Dodd-Frank Act, annuities that meet specific requirements, including requirements relating to certain state suitability rules, are specifically exempted from being treated as securities by the SEC. We expect that the types of FIAs that we currently sell will meet those requirements and therefore will remain exempt from being treated as securities by the SEC and state securities regulators. However, there can be no assurance that federal or state securities laws or state insurance laws and regulations will not be amended or interpreted to impose further requirements on FIAs. Treatment of these products as securities would require additional registration and licensing of these products and the agents selling them, as well as cause us to seek new or additional marketing relationships for these products, any of which may impose significant restrictions on our ability to conduct business as currently operated.
Regulation of Over-The-Counter (“OTC”) Derivatives
We use derivatives to mitigate a wide range of risks in connection with our businesses, including options purchased to hedge the derivatives embedded in the FIAs we have issued, and swaps, futures and/or options may be used to manage the impact of increased benefit exposures from our annuity products that offer guaranteed benefits. Title VII of the Dodd-Frank Act creates a comprehensive framework for the federal oversight and regulation of the OTC derivatives market and entities, such as Athene, that participate in the market, and requires regulators to promulgate rules and regulations implementing its provisions. Regulations have been finalized and implemented in many areas and are being finalized for implementation in others.
60
Table of Contents
The Dodd-Frank Act divides the regulatory responsibility for swaps in the United States between the SEC and the CFTC. The CFTC regulates swaps and swap entities, and the SEC regulates security-based swaps and security-based swap entities. The CFTC and the SEC have jointly finalized certain regulations under the Dodd-Frank Act, including critical rulemakings on the definition of “swap,” “security-based swap,” “swap dealer,” “security-based swap dealer,” “major swap participant” and “major security-based swap participant.” The CFTC has also finalized a number of other regulations under the Dodd-Frank Act which apply to swap and swap market participants subject to the CFTC’s oversight, including regulations relating to registration for swap dealers, major swap participants and swap execution facilities, reporting, recordkeeping, clearing and on-facility trade execution. The SEC has yet to finalize most of its similar regulations which would apply to the security-based swaps and security-based swap market participants subject to the SEC’s oversight, including security-based swap dealers. As a result of this bifurcation and the different pace at which the agencies have promulgated regulations, different transactions are subject to different levels of regulation. In addition, because the CFTC has not yet finalized all of its regulations with respect to swaps and the SEC has yet to finalize most of its regulations with respect to security-based swaps, it is not possible to predict with certainty the full effect of the Dodd-Frank Act on us and our business or the timing of such effects.
The Dodd-Frank Act and the CFTC rules thereunder currently require us, in connection with certain swap transactions, to comply with clearing and trade execution requirements, and it is anticipated that the types of OTC derivatives that will be subject to the clearing and trade execution requirements will be expanded over time. In addition, regulations recently adopted will require us to comply with mandatory minimum margin requirements for uncleared derivative transactions. The derivative clearing requirements and mandatory margin requirements of the Dodd-Frank Act could increase the cost of our risk mitigation and could have other material adverse effects on our businesses. For example, increased margin requirements, combined with restrictions on assets that qualify as eligible collateral, could reduce our liquidity and require increased holdings of cash and highly liquid assets with lower yields causing a reduction in income. In addition, the requirement that certain trades be centrally cleared through clearinghouses concentrates counterparty risk in both clearinghouses and clearing members. The failure of a clearinghouse or a clearinghouse member could have a significant impact on the financial system. Even if a clearinghouse itself does not fail, large losses caused by the default of a single clearinghouse member could force significant capital calls on the remaining clearinghouse members during a financial crisis, which could then lead other clearinghouse members to default. Because clearinghouses are still developing and the related bankruptcy process is untested, it is difficult to speculate as to the actual risks related to the default of a clearinghouse.
The Dodd-Frank Act and new regulations thereunder could significantly increase the cost of OTC derivatives, reduce the availability of OTC derivatives to protect against risks we encounter, reduce our ability to monetize or restructure our existing OTC derivatives, and increase our credit risk exposure. If we reduce our use of OTC derivatives as a result of the Dodd-Frank Act and the regulations thereunder, the results of our operations may become more volatile and our cash flows may be less predictable which could adversely affect our financial performance. Additionally, we have always been subject to the risk that hedging and other management procedures might prove ineffective in reducing the risks to which insurance policies expose us or that unanticipated policyholder behavior or mortality, combined with adverse market events, could produce economic losses beyond the scope of the risk management techniques employed. Any such losses could be increased by the increased cost of entering into OTC derivatives and the reduced availability of bespoke OTC derivatives that might result from the enactment and implementation of the Dodd-Frank Act.
U.S. Consumer Protection Laws and Privacy Regulation
As part of the Dodd-Frank Act, Congress established the CFPB to supervise and regulate institutions that provide certain financial products and services to consumers. The consumer financial services subject to the CFPB’s jurisdiction generally exclude insurance business of the kind in which we engage. The CFPB is, however, exploring the possibility of regulating the way Americans manage their retirement savings and is considering the extent of its authority in that area. We are unable at this time to predict the impact of these activities on our business.
61
Table of Contents
NAIC
Although our businesses are subject to regulation in each state in which they conduct business, in many instances the state insurance laws and regulations emanate from the NAIC. State insurance regulators and the NAIC regularly re-examine existing laws and regulations applicable to insurance companies and their products. Any proposed or future legislation or NAIC initiatives, if adopted, may be more restrictive on our ability to conduct business than current regulatory requirements or may result in higher costs or increased statutory capital and reserve requirements. Changes in these laws and regulations or interpretations thereof are often made for the benefit of the consumer and at the expense of the insurer and could have a material adverse effect on our domestic insurance subsidiaries’ businesses, operations and financial conditions. We and they are also subject to the risk that compliance with any particular regulator’s interpretation of a legal or accounting issue may not result in compliance with another regulator’s interpretation of the same issue, particularly when compliance is judged in hindsight. There is an additional risk that any particular regulator’s interpretation of a legal or accounting issue may change over time to our detriment, or that changes to the overall legal or market environment, even absent any change of interpretation by a particular regulator, may cause us to change our views regarding the actions we need to take from a legal risk management perspective, which could necessitate changes to our practices that may, in some cases, limit our ability to grow and improve profitability. See “Business—Regulation—United States—NAIC.”
Risks Relating to Taxation
AHL or ALRe may be subject to U.S. federal income taxation.
AHL and ALRe are incorporated under the laws of Bermuda and intend to operate in a manner that will not cause either to be treated as being engaged in a trade or business within the United States or subject to current U.S. federal income taxation on their net income. However, because there is considerable uncertainty as to when a foreign corporation is engaged in a trade or business within the United States, as the law is unclear and the determination is highly factual and must be made annually, there can be no assurance that the IRS will not contend successfully that AHL or ALRe is engaged in a trade or business in the United States. If AHL or ALRe were considered to be engaged in a trade or business in the United States, it could be subject to U.S. federal income taxation on a net basis on its income that is effectively connected with such U.S. trade or business (including branch profits tax on the portion of its earnings and profits that is attributable to such income). Any such U.S. federal income taxation could result in substantial tax liabilities and consequently could have a material adverse effect on our financial condition and results of future operations. See “Tax Considerations—U.S. Federal Income Tax Considerations—Taxation of AHL and ALRe.”
U.S. persons who own our Class A common shares may be subject to U.S. federal income taxation at ordinary income rates on our undistributed earnings and profits.
AHL’s bye-laws generally limit the voting power of our Class A common shares (and certain other of our voting securities) such that no person owns (or is treated as owning) more than 9.9% of the total voting power of our common shares (with certain exceptions). AHL’s bye-laws also generally reduce the voting power of Class B common shares held by certain holders if (A) one or more U.S. persons that own (or are treated as owning) more than 9.9% of the total voting power of our common shares own (or are treated as owning) individually or in the aggregate more than 24.9% of the voting power or the value of our common shares or (B) a U.S. person that is classified as an individual, an estate or a trust for U.S. federal income tax purposes owns (or is treated as owning) more than 9.9% of the total voting power of our common shares. Additionally, AHL’s bye-laws require the board of AHL to refer certain decisions with respect to our non-U.S. subsidiaries to our shareholders, and to vote our shares accordingly. These provisions are intended to reduce the likelihood that AHL, ALRe or any of the German Group Companies will be treated as a controlled foreign corporation (“CFC”) in any taxable year (other than for purposes of taking into account RPII). If these provisions were not in force or effective and AHL, ALRe or a German Group Company were treated as a CFC in a taxable year, each U.S. person treated as a “10% U.S. Shareholder” with respect to AHL, ALRe or such German Group Company that held our common shares directly
62
Table of Contents
or indirectly through non-U.S. entities as of the last day in such taxable year that AHL, ALRe or such German Group Company was a CFC would generally be required to include in gross income as ordinary income its pro rata share of AHL’s, ALRe’s or such German Group Company’s insurance and reinsurance income and certain other investment income, regardless of whether that income was actually distributed to such U.S. person (with certain adjustments). For these purposes, a “10% U.S. Shareholder” of a non-U.S. corporation generally is any U.S. person that owns (or is treated as owning) stock of the non-U.S. corporation possessing 10% or more of the total voting power of such non-U.S. corporation’s stock. In general, a non-U.S. corporation is a CFC if 10% U.S. Shareholders, in the aggregate, own (or are treated as owning) stock of the non-U.S. corporation possessing more than 50% of the voting power or value of such corporation’s stock. However, this threshold is lowered to more than 25% for purposes of taking into account the insurance income of a non-U.S. corporation. Special rules apply for purposes of taking into account any RPII of a non-U.S. corporation, as described below.
In addition, if a U.S. person disposes of shares in a non-U.S. corporation and the U.S. person was a 10% U.S. Shareholder at any time when the corporation was a CFC during the five-year period ending on the date of disposition, any gain from the disposition will generally be treated as a dividend to the extent of the U.S. person’s share of the corporation’s undistributed earnings and profits that were accumulated during the period or periods that the U.S. person owned the shares while the corporation was a CFC (with certain adjustments). Also, a U.S. person may be required to comply with specified reporting requirements, regardless of the number of shares owned. See “Tax Considerations—U.S. Federal Income Tax Considerations—Taxation of U.S. Holders—CFC Provisions.”
Because of the limitations in AHL’s bye-laws referred to above, among other factors (including the expected ownership of our common shares following this offering), we believe it is unlikely that any U.S. person that acquires our Class A common shares in this offering would thereby become a 10% U.S. Shareholder of AHL, ALRe or any German Group Company. However, because the relevant attribution rules are complex and there is no definitive legal authority on whether the voting provisions included in AHL’s organizational documents are effective for purposes of the CFC provisions, there can be no assurance that this will be the case. Further, our ability to obtain information that would permit us to enforce the limitation described above may be limited. We will take reasonable steps to obtain such information, but there can be no assurance that such steps will be adequate or that we will be successful in this regard. Accordingly, we may not be able to fully enforce the limitation described above.
U.S. persons who own our Class A common shares may be subject to U.S. federal income taxation at ordinary income rates on a disproportionate share of our undistributed earnings and profits attributable to RPII.
If ALRe is treated as recognizing RPII in a taxable year and ALRe is treated as a CFC for such taxable year, each U.S. person that owns our Class A common shares directly or indirectly through non-U.S. entities as of the last day in such taxable year must generally include in gross income its pro rata share of the RPII, determined as if the RPII were distributed proportionately only to all such U.S. persons, regardless of whether that income is distributed (with certain adjustments). For this purpose, ALRe generally will be treated as a CFC if U.S. persons in the aggregate own (or are treated as owning) 25% or more of the total voting power or value of AHL’s or ALRe’s stock for an uninterrupted period of 30 days or more during the taxable year. We believe that ALRe will be treated as a CFC for this purpose based on the expected ownership of our shares.
RPII generally is any income of a non-U.S. corporation attributable to insuring or reinsuring risks of a U.S. person that owns (or is treated as owning) stock of such non-U.S. corporation, or risks of a person that is “related” to such a U.S. person. For this purpose, (1) a person is “related” to another person if such person “controls,” or is “controlled” by, such other person, or if both are “controlled” by the same persons, and (2) “control” of a corporation means ownership (or deemed ownership) of stock possessing more than 50% of the total voting power or value of such corporation’s stock and “control” of a partnership, trust or estate for U.S. federal income tax purposes means ownership (or deemed ownership) of more than 50% by value of the beneficial interests in such partnership, trust or estate.
63
Table of Contents
Athene and Apollo have considerable overlap in ownership. If it is determined that the same persons “control” both us and Apollo through owning (or being treated as owning) more than 50% of the vote or value of Athene and Apollo, substantially all of ALRe’s income might constitute RPII. This would trigger the adverse RPII consequences described above to all U.S. persons that hold our Class A common shares directly or indirectly through non-U.S. entities and would have a material adverse effect on the value of their investment in our Class A common shares.
Existing voting restrictions set forth in AHL’s bye-laws are generally intended to prevent a person who owns (or is treated as owning) shares in Apollo from owning (or being treated as owning) any of the voting power of our Class A common shares, thus preventing persons who own (or are treated as owning) both AHL and Apollo from owning (or being treated as owning) more than 50% of the voting power of our stock. However, these restrictions do not prevent members of the Apollo Group from retaining the right to vote on newly acquired Class A common shares, should they choose to do so nor do they prevent persons who own (or are treated as owning) both AHL and Apollo from owning (or being treated as owning) more than 50% of the value of our stock. The “Apollo Group” means (A) Apollo, (B) the AAA Investor, (C) any investment fund or other collective investment vehicle whose general partner or managing member is owned, directly or indirectly, by Apollo or one or more of Apollo’s subsidiaries, (D) BRH Holdings GP, Ltd. and its shareholders and (E) any affiliate of any of the foregoing (except that AHL and its subsidiaries and employees of AHL, its subsidiaries or AAM are not members of the Apollo Group). AHL’s bye-laws also generally provide that no person (nor certain direct or indirect beneficial owners or related persons to such person) who owns our common shares, other than a member of the Apollo Group, may acquire any shares of Apollo or otherwise make any investment that would cause such person, or any other person that is a U.S. person, to own (or be treated as owning) more than 50% of the vote or value of AHL’s stock. Any holder of our common shares that violates this provision may be required, at the board’s discretion, to sell its common shares or take any other reasonable action that the board deems necessary.
Because of the restrictions described above, among other factors (including the expected ownership of our common shares following this offering), we believe it is likely that one or more exceptions under the RPII rules will apply such that U.S. persons will not be required to include any RPII in their gross income with respect to ALRe or the German Group Companies. However, there can be no assurance that this will be the case. Further, our ability to obtain information that would permit us to enforce the restrictions described above may be limited. We will take reasonable steps to obtain such information, but there can be no assurance that such steps will be adequate or that we will be successful in this regard. Accordingly, we may not be able to fully enforce these restrictions. See “Tax Considerations—U.S. Federal Income Tax Considerations—Taxation of U.S. Holders—CFC Provisions.”
U.S. persons who dispose of our Class A common shares may be required to treat any gain as ordinary income for U.S. federal income tax purposes and comply with other specified reporting requirements.
If a U.S. person disposes of shares in a non-U.S. corporation that is an insurance company that had RPII and the 25% threshold described above is met at any time when the U.S. person owned any shares in the corporation during the five-year period ending on the date of disposition, any gain from the disposition will generally be treated as a dividend to the extent of the U.S. person’s share of the corporation’s undistributed earnings and profits that were accumulated during the period that the U.S. person owned the shares (possibly whether or not those earnings and profits are attributable to RPII). In addition, the shareholder will be required to comply with specified reporting requirements, regardless of the amount of shares owned. We believe that these rules should not apply to a disposition of our Class A common shares because AHL is not itself directly engaged in the insurance business. We cannot assure you, however, that the IRS will not successfully assert that these rules apply to a disposition of our Class A common shares. See “Tax Considerations—U.S. Federal Income Tax Considerations—Taxation of U.S. Holders—Dispositions of Our Class A Common Shares.”
U.S. tax-exempt organizations that own our Class A common shares may recognize unrelated business taxable income.
A U.S. tax-exempt organization that directly or indirectly owns our Class A common shares generally will recognize unrelated business taxable income and be subject to additional U.S. tax filing obligations to the extent
64
Table of Contents
such tax-exempt organization is required to take into account any of our insurance income or RPII pursuant to the CFC and RPII rules described above. U.S. tax-exempt organizations should consult their own tax advisors regarding the risk of recognizing unrelated business taxable income as a result of the ownership of our Class A common shares. See “Tax Considerations—U.S. Federal Income Tax Considerations—Taxation of U.S. Holders—CFC Provisions—Tax-Exempt U.S. Holders.”
U.S. persons who own our Class A common shares may be subject to adverse tax consequences if AHL, ALRe or any of the German Group Companies is considered a passive foreign investment company for U.S. federal income tax purposes.
If AHL, ALRe or any of the German Group Companies is considered a passive foreign investment company (“PFIC”) for U.S. federal income tax purposes, a U.S. person who directly or, in certain cases, indirectly owns our Class A common shares could be subject to adverse tax consequences, including a greater tax liability than might otherwise apply, an interest charge on certain taxes that are deemed deferred as a result of AHL’s, ALRe’s or any of the German Group Companies’ non-U.S. status and additional U.S. tax filing obligations, regardless of the number of shares owned. We currently do not expect that AHL, ALRe or any of the German Group Companies will be a PFIC for U.S. federal income tax purposes in the current taxable year or the foreseeable future because ALRe, the German Group Companies, and, through its insurance subsidiaries, AHL each intend to be predominantly engaged in the active conduct of an insurance and reinsurance business. We cannot assure you, however, that AHL, ALRe and the German Group Companies will not be deemed to be PFICs by the IRS. No final or temporary regulations currently exist regarding the application of the PFIC provisions to an insurance company. Proposed regulations have recently been issued, which will not be effective until adopted in final form. At this time it is unclear whether and how such regulations would affect the characterization of AHL and its subsidiaries. Additionally, legislation has been introduced in Congress that, if enacted, would characterize a non-U.S. insurance company with insurance liabilities of 25% or less of such company’s assets as a PFIC unless it can qualify for a temporary exception based on both an asset test and a facts and circumstances test. We cannot predict what effect, if any, any new legislation would have on an investor that is subject to U.S. federal income taxation. See “Tax Considerations—U.S. Federal Income Tax Considerations—Taxation of U.S. Holders—PFIC Provisions.”
Changes in U.S. tax law might adversely affect us or our shareholders.
The tax treatment of non-U.S. companies and their U.S. and non-U.S. insurance subsidiaries has been the subject of Congressional discussion and legislative proposals. Legislative proposals relating to the tax treatment of non-U.S. companies have been introduced that could, if enacted, materially affect us. One legislative proposal, the Stop Tax Haven Abuse Act (S. 174, H.R. 297), introduced in both the U.S. Senate and the U.S. House of Representatives in January 2015, would cause certain entities otherwise treated as non-U.S. corporations to be treated as U.S. corporations for U.S. federal income tax purposes if the “management and control” of such corporations occurs, directly or indirectly, primarily within the United States.
In addition, President Obama’s 2017 budget proposal includes a provision that, if adopted in legislation, would deny an insurance company a deduction for reinsurance premiums and other amounts paid to an affiliated foreign reinsurance company to the extent that the foreign reinsurer (or its parent company) is not subject to U.S. federal income tax with respect to the premiums received.
Additionally, interpretations of U.S. federal income tax law, including those regarding whether a company is engaged in a trade or business (or has a permanent establishment) within the United States or is a PFIC, or whether U.S. persons are required to include in their gross income “subpart F income” or RPII of a CFC, are subject to change, possibly on a retroactive basis. Regulations regarding the application of the PFIC rules to insurance companies and regarding RPII are only in proposed form. New regulations or pronouncements interpreting or clarifying such regulations may be forthcoming. We cannot be certain if, when or in what form such regulations or pronouncements may be provided and whether such guidance will have a retroactive effect.
65
Table of Contents
We cannot assure you that future legislative, administrative or judicial developments will not result in an increase in the amount of U.S. tax payable by us or by an investor in our Class A common shares or reduce the attractiveness of our products. If any such developments occur, an investment in our common shares could be materially adversely affected. See “Tax Considerations—U.S. Federal Income Tax Considerations—Proposed U.S. Tax Legislation” and “Tax Considerations—U.S. Federal Income Tax Considerations—Possible Changes in U.S. Tax Law.”
Changes in U.S. tax law might adversely affect demand for our products.
Many of the products that we sell and reinsure benefit from one or more forms of tax-favored status under current U.S. federal and state income tax regimes. For example, we sell and reinsure annuity contracts that allow the policyholders to defer the recognition of taxable income earned within the contract. Changes in U.S. federal or state tax law could reduce or eliminate the attractiveness of such products, which could affect the sale of our products or increase the expected lapse rate with respect to products that have already been sold.
There is U.S. income tax risk associated with reinsurance between U.S. insurance companies and their Bermuda affiliates.
If a reinsurance agreement is entered into among related parties, the IRS is permitted to reallocate or recharacterize income, deductions or certain other items, and to make any other adjustment, to reflect the proper amount, source or character of the taxable income of each of the parties. If the IRS were to successfully challenge our reinsurance arrangements, our financial condition and results of operations could be adversely affected and the price of our Class A common shares could be adversely affected.
We may become subject to U.S. withholding tax under certain U.S. tax provisions commonly known as “FATCA.”
Certain U.S. tax provisions commonly known as the “Foreign Account Tax Compliance Act” or “FATCA” impose a 30% withholding tax on certain payments of U.S. source income and the proceeds from the disposition after December 31, 2018, of property of a type that can produce U.S. source interest or dividends, in each case, to certain “foreign financial institutions” and “non-financial foreign entities.” The withholding tax also applies to certain “foreign passthru payments” made by foreign financial institutions after December 31, 2018. The U.S. government has signed intergovernmental agreements to facilitate the implementation of FATCA with the governments of Bermuda and Germany (the “Bermuda IGA” and “German IGA,” respectively). AHL and its foreign subsidiaries intend to comply with the obligations imposed on them under FATCA and the Bermuda IGA and German IGA, as applicable, to avoid being subject to withholding under FATCA on payments made to them or penalties. To avoid any withholding under FATCA or penalties, we may be required to report the identity of, and certain other information regarding, certain U.S. persons that directly or indirectly own our common shares or exercise control over our shareholders to counterparties or governmental authorities, including the IRS or the Bermuda government. We may also be required to withhold on payments and/or take other actions with respect to holders of our common shares who do not provide us with certain information or documentation required to fully comply with FATCA. However, we expect that the shareholders who acquire Class A common shares issued in this offering will not be subject to such requirements pursuant to an exception for equity interests that are regularly traded on an established securities market, provided that the shareholder (and any intermediaries through which the shareholder holds its shares) is not a foreign financial institution that is treated as a “nonparticipating FFI” under FATCA. However, no assurance can be provided in this regard. We may become subject to withholding tax or penalties if we are unable to comply with FATCA.
If AHL is treated as engaged in a U.S. trade or business in any taxable year, all or a portion of the dividends on our Class A common shares may be treated as U.S. source income and may be subject to withholding and information reporting under FATCA unless a shareholder (and any intermediaries through which the shareholder holds its shares) establishes an exemption from such withholding and information reporting. In addition, any
66
Table of Contents
gross proceeds from the sale or other disposition of our Class A common shares after December 31, 2018 might also be subject to withholding and information reporting under FATCA in such circumstances, absent an exemption. As discussed above, we currently intend to limit our U.S. activities so that AHL is not considered to be engaged in a U.S. trade or business, although no assurances can be provided in this regard. See “Tax Considerations—U.S. Federal Income Tax Considerations—FATCA Withholding.”
Our operations may be affected by the introduction of the Common Reporting Standard.
The Common Reporting Standard (“CRS”) has been introduced as an initiative by the Organisation for Economic Co-operation and Development (the “OECD”). CRS is imposed on members of the EU by the European Directive on Administrative Co-operation. Countries outside the EU may enter into the Multilateral Competent Authority Agreement, in which they agree to exchange information with participating jurisdictions. Similar to FATCA introduced by the U.S., CRS requires financial institutions which are subject to the rules to report certain information in respect of account holders. German financial institutions are presently subject to certain requirements under CRS, and they must report information beginning in 2017. We intend to operate in compliance with CRS. Any inadvertent failure to do so may have an adverse effect on our results.
We are subject to the risk that Bermuda tax laws may change and that we may become subject to new Bermuda taxes following the expiration of a current exemption after 2035.
The Bermuda Minister of Finance (the “Minister”), under the Exempted Undertakings Tax Protection Act 1966 of Bermuda, as amended, has given us an assurance that if any legislation is enacted in Bermuda that would impose tax computed on profits or income, or computed on any capital asset, gain or appreciation, or any tax in the nature of estate duty or inheritance tax, then the imposition of any such tax will not be applicable to us or any of our operations, shares, debentures or other obligations until March 31, 2035, except insofar as such tax applies to persons ordinarily resident in Bermuda or to any taxes payable by us in respect of real property owned or leased by us in Bermuda. Given the limited duration of the Minister’s assurance, we cannot assure you that we will not be subject to any Bermuda tax after March 31, 2035. See “Tax Considerations—Bermuda Tax Considerations.”
The impact of the OECD’s directives to eliminate harmful tax practices and recommendations on base erosion and profit shifting is uncertain and could impose adverse tax consequences on us.
The OECD has published reports and launched a global dialogue among member and non-member countries on measures to limit harmful tax competition. These measures are largely directed at counteracting the effects of tax havens and preferential tax regimes in countries around the world. In the OECD’s report dated April 18, 2002, and as periodically updated, Bermuda was not listed as an uncooperative tax haven jurisdiction because it had previously committed to eliminate harmful tax practices and to embrace international tax standards for transparency, exchange of information and the elimination of any aspects of the regimes for financial and other services that attract business with no substantial domestic activity. We are not able to predict what changes will arise from the commitment or whether such changes will subject us to additional taxes.
In 2015, the OECD published final recommendations on base erosion and profit shifting. These recommendations propose the development of rules directed at counteracting the effects of tax havens and preferential tax regimes in countries around the world. The recommendations include revisions to the definition of a “permanent establishment” and the rules for attributing profit to a permanent establishment. Other recommended actions relate to the goal of ensuring that transfer pricing outcomes are in line with value creation, noting that the current rules may facilitate the transfer of risks or capital away from countries where the economic activity takes place. We expect many countries to change their tax laws in response to this project, and several countries have already changed or proposed changes to their tax laws. Changes to tax laws could increase their complexity and the burden and costs of compliance. Additionally, such changes could also result in significant modifications to the existing transfer pricing rules and could potentially have an impact on our taxable profits in various jurisdictions.
67
Table of Contents
Risks Relating to this Offering and an Investment in Our Class A Common Shares
There is currently no market for our Class A common shares, an active trading market may not develop or continue to be liquid and the market price of our common shares may be volatile.
Prior to this offering, there has not been a public market for our common shares, and an active market for our common shares may not develop or be sustained after this offering, which could depress the market price of our common shares and could affect your ability to sell your shares. In the absence of an active public trading market, you may not be able to liquidate your investment in our common shares. An inactive market may also impair our ability to raise capital by selling our common shares, our ability to motivate our employees through equity incentive awards and our ability to acquire other companies, products or technologies by using our common shares as consideration. In addition, the market price of our common shares may fluctuate significantly in response to various factors, some of which are beyond our control. The initial public offering price per share was determined by negotiations among us, the selling shareholders and the representatives of the underwriters and therefore, that price may not be indicative of the market price of our common shares after this offering. In particular, we cannot assure you that you will be able to resell your shares at or above the initial public offering price. The stock markets have experienced volatility in recent years that has been unrelated to the operating performance of particular companies. These broad market fluctuations may adversely affect the trading price of our common shares. In addition to the factors discussed elsewhere in this prospectus, the factors that could affect our share price are:
| • | United States and international political and economic factors unrelated to our performance; |
| • | actual or anticipated fluctuations in our quarterly operating results; |
| • | changes in or failure to meet publicly disclosed expectations as to our future financial performance; |
| • | changes in securities analysts’ estimates of our financial performance or lack of research and reports by industry analysts; |
| • | action by institutional shareholders, including purchases or sales of large blocks of common shares; |
| • | speculation in the press or investment community; |
| • | changes in market valuations or earnings of similar companies; and |
| • | announcements by us or our competitors of significant products, contracts, acquisitions or strategic partnerships. |
In the past, following periods of volatility in the market price of a company’s securities, class action litigation has often been instituted against such company. Any litigation of this type brought against us could result in substantial costs and a diversion of our management’s attention and resources, which would harm our business, results of operations and financial condition.
There may be sales of a substantial amount of our common shares after this offering by our current shareholders as certain restrictions on sale expire, and these sales could cause the price of our common shares to fall.
Our directors, executive officers and shareholders holding 100% of our common shares outstanding prior to this offering agreed that they will not sell any shares prior to the expiration of certain time periods after the date of this prospectus. See “Certain Relationships and Related Party Transactions—Relationships and Related Party Transactions with Apollo or its Affiliates—Registration Rights Agreement” and “Shares Eligible for Future Sale—Lock-Up Agreements.” Certain of our shareholders, other than our directors, executive officers, Apollo and employees of Apollo, are selling Class A common shares in this offering outside of these lockup restrictions. Lock-up expiration periods applicable to existing holders end with respect to one-third of the shares owned by such holders at each of 225 days, 375 days and 450 days after the date of this prospectus, provided that certain of our executive officers, directors and holders representing approximately % and % of our common
68
Table of Contents
shares have agreed not to sell any shares for 450 days and two years, respectively, from the date of this prospectus. Approximately , , and of our common shares will be eligible for future sale at the expiration of such 225 day, 375 day, 450 day and two-year periods, respectively. These restrictions are subject to waiver by our board of directors, including in the event holders are permitted to sell their shares in follow-on registered offerings by us after the date of this initial public offering. In addition, substantially all of our common shares outstanding prior to this offering will be subject to a 180 day lock-up entered into with the underwriters in connection with this offering. As these lock-up periods end, the market price of our common shares could decline if the holders of those shares sell them or are perceived by the market as intending to sell them. Additionally, existing holders of our common shares have registration rights under the Third Amended and Restated Registration Rights Agreement (the “Registration Rights Agreement”), subject to some conditions, which require us to file registration statements covering the sale of their shares or to include their shares in registration statements that we may file for ourselves or other shareholders in the future.
We may raise additional equity capital in the future. Future issuances or the possibility of future sales of a substantial amount of equity by our shareholders or by us may depress the price of your investment in our common shares and result in substantial dilution to you.
If our shareholders sell a large number of shares of our common shares, or if we issue a large number of our common shares in connection with future acquisitions, financings or other circumstances, the market price of our common shares could decline significantly. Moreover, the perception in the public market that our shareholders might sell our common shares could depress the market price of those shares.
The interest of the Apollo Group, which controls and is expected to continue to control 45% of the total voting power of AHL and holds a number of the seats on our board of directors, may conflict with those of other shareholders and could make it more difficult for you and other shareholders to influence significant corporate decisions.
The Apollo Group controls and is expected, subsequent to the completion of our initial public offering, to continue to control 45% of the total voting power of AHL. As a result, the Apollo Group could exercise significant influence over all matters requiring shareholder approval for the foreseeable future, including approval of significant corporate transactions, appointment of members of our management, election of directors, approval of the termination of our IMAs and determination of our corporate policies, which may reduce the market price of our common shares. Even if the Apollo Group reduces its beneficial ownership below its current holdings or we raise additional equity from investors other than members of the Apollo Group, because of its control over 45% of our aggregate voting power, for so long as any member of the Apollo Group owns at least one Class B common share, such member will still be able to assert significant influence over our board of directors and certain corporate actions.
The interests of our existing shareholders, particularly members of the Apollo Group, may conflict with the interests of our other shareholders. Actions that members of the Apollo Group take as shareholders may not be favorable to our other shareholders. For example, the concentration of voting power held by the Apollo Group, the significant representation on our board of directors by the Apollo Group or the limitations on our ability to terminate any IMA with AAM or AAME could delay, defer or prevent a change of control of us or impede a merger, takeover or other business combination which another shareholder may otherwise view favorably. Our conflicts committee and our disinterested directors with respect to a transaction analyze certain of these conflicts to protect against potential harm resulting from conflicts of interest in connection with transactions that we have entered into or will enter into with Apollo or its affiliates. Specifically, our bye-laws require that the conflicts committee (in accordance with its charter and procedures) must approve of certain material transactions by and between us and Apollo or its affiliates, including entering into material agreements or the imposition of any new fee or increase in the rate at which fees are charged to us, subject to certain exceptions. See “Certain Relationships and Related Party Transactions—Related Party Transaction Policy.” In addition, our conflicts committee may exclusively rely on information provided by AAM, including with respect to fees charged by
69
Table of Contents
AAM or Apollo or its affiliates, and with respect to the historical performance or fees of unrelated service providers used for comparison purposes, and may not independently verify the information so provided. However, these conflicts guidelines will not, by themselves, prohibit transactions with Apollo or its affiliates.
Additionally, our investment manager, AAM, and our investment adviser, AAME, are indirect subsidiaries of Apollo and charge us management fees that are based on our assets. Under our IMAs with AAM and AAME, substantially all of our invested assets are managed by AAM and AAME. Our investment policies permit AAM to invest in securities of issuers affiliated with Apollo, including funds managed by Apollo, and to retain on our behalf and at our cost sub-advisors, including Apollo. AAM may make such investments or retain such sub-advisors at its discretion, subject only to the approval of our conflicts committee in certain cases and/or certain regulatory approvals. Accordingly, AAM may have a conflict of interest in managing our investments, including by retaining its affiliate, Apollo, to act as its sub-advisor, which would increase amounts payable by us for investment advisory services or could cause us to receive less return on our investments than if our investment portfolio was managed by another party. In addition, asset management fees are paid based on the amount of our AUM regardless of the results of our operations. Therefore, Apollo could be incentivized to exercise its influence to cause us to increase our AUM, which may have an adverse impact on our financial condition or results of operations.
Certain of our investments are managed by other Apollo affiliates retained as sub-advisors by AAM to manage such investments. Currently, substantially all of the assets subject to sub-advisory arrangements are managed by Apollo affiliates. In addition, we have made investments in collective investment vehicles managed by Apollo affiliates, including seed investments in new investment vehicles or investment strategies offered by Apollo which have limited track records, as well as junior and subordinated tranches of structured investment vehicles which may assist Apollo in meeting certain regulatory requirements applicable to Apollo as the sponsor of such vehicles. Such Apollo affiliates charge us a sub-advisory fee, or charge such vehicles management fees, that independently, or when taken together with the fees charged by AAM, may not be the lowest fee available for similar sub-advisory or investment management services offered by unrelated managers. In addition, it is possible that such unrelated managers may perform better than the Apollo affiliates retained by AAM as sub-advisors or which manage such collective investment funds. Apollo is not obligated to devote any specific amount of time to the affairs of our company, or to the funds in which we are invested and we have limited rights to terminate any IMA or sub-advisory arrangement. Affiliates of Apollo manage and expect to continue to manage other client accounts, some of which have objectives similar to ours, including collective investment vehicles managed by Apollo and in which Apollo may have an equity interest. We will compete with other Apollo clients not only in terms of time spent on management of our portfolio, but also for allocation of assets that do not have significant supply. In addition, there may be different investment teams for AAM and Apollo investing in the same strategies for different clients, including us. As a result, we may compete with other Apollo clients for the same investment opportunities, potentially disadvantaging us. Apollo may also manage accounts whose advisory fee schedules, investment objectives and policies differ from ours, which may cause Apollo to allocate securities in a manner that may have an adverse effect on our ability to source appropriate assets and meet our strategic objectives. In addition, where AAM has retained an Apollo affiliate as our sub-advisor, it is possible that due to the fees charged by such sub-advisor in addition to the AAM fees that we pay, we may either experience a reduced return on an investment or may forego purchasing an investment that we would have purchased if such investment opportunity were sourced directly by AAM.
From time to time, AAM or Apollo may acquire investments on our behalf which are senior or junior to other instruments of the same issuer that are held by, or acquired for, another AAM or Apollo client (for example, we may acquire junior debt while another Apollo client may acquire senior debt). In the event such an issuer enters bankruptcy or becomes otherwise insolvent, the client holding securities which are senior in preference may have the right to aggressively pursue the issuer’s assets to fully satisfy the issuer’s indebtedness to the client, and the client holding the investment which is junior in the capital structure may not have access to sufficient assets of the issuer to completely satisfy its claim against the issuer and may suffer a loss. AAM and Apollo have adopted procedures that are designed to enable AAM and Apollo to address such conflicts and to ensure that clients are treated fairly and equitably in these situations. However, given AAM’s or Apollo’s fiduciary obligations to the other
70
Table of Contents
client, AAM and Apollo may be unable to manage our investment in the same manner as would have been possible without the conflict of interest. In such event, we may receive less return on such investment than if another AAM or Apollo client was not in a different part of the capital structure of the issuer.
Apollo and its affiliates have diverse and expansive private equity, credit and real estate investment platforms, investing in numerous companies across many industries. If Apollo acquires or forms a company with a business strategy competing with ours, additional conflicts may arise between us and Apollo or between us and such company in executing our plans, including with respect to the allocation of investments or the ability to execute on corporate opportunities. Our bye-laws provide that Apollo and its members and affiliates (including certain of our directors) generally have no duty to refrain from engaging, directly or indirectly, in the same or similar business activities or lines of business that we do.
Apollo and its affiliates regularly obtain material non-public information regarding various potential acquisition or trading targets. When Apollo and its affiliates obtain material non-public information regarding a potential acquisition or trading target, AAM and Apollo become restricted from trading such acquisition or trading target’s outstanding securities. Some of such securities may be potential investment opportunities for us, or may be owned by us and be potential disposition opportunities. The inability of AAM or Apollo to purchase or sell such investments on our behalf as a result of these restrictions may result in us acquiring investments that may otherwise underperform the restricted investments that AAM or Apollo would have acquired, or incurring losses on investments that AAM or Apollo would have sold, on our behalf, had such restrictions not been in place.
Certain of AAM’s executives and employees have incentive compensation tied to our financial performance. This compensation arrangement may incentivize such executives and employees to invest in riskier assets in an attempt to achieve higher returns.
James R. Belardi, our Chief Executive Officer, also serves as Chief Executive Officer of AAM, owns a profits interest in the equity of AAM and receives compensation from AAM for services he provides to AAM. Accordingly, his involvement as a member of our board of directors and management team and as an officer and director of AAM may lead to a conflict of interest. Furthermore, certain members of our board of directors also serve on the board of directors of AAM or are employees of Apollo or its affiliates, which could also lead to potential conflicts of interest. See “Certain Relationships and Related Party Transactions—Relationships and Related Party Transactions with Apollo or its Affiliates—Investment Management Relations.”
Our bye-laws contain provisions that cause a holder of Class A common shares to lose the right to vote the shares if the holder owns an equity interest in Apollo, AAA or certain other entities.
Our bye-laws contain provisions that impose restrictions on certain Class A common shares in order to reduce the likelihood that U.S. persons that directly or indirectly own our common shares will experience adverse tax consequences attributable to RPII. These provisions could cause a holder to lose the right to vote its Class A common shares if the holder or one of its affiliates owns (or is treated as owning) any equity interests (or instruments treated as equity interests) in Apollo or AAA, if the holder or one of its affiliates owns (or is treated as owning) any of our Class B common shares or if the holder or one of its affiliates is a member of the Apollo Group. These restrictions do not affect the transferability of Class A common shares and do not apply unless the holder or one of its affiliates meets one of these conditions.
Investors may experience dilution in the future.
We have issued restricted Class M common shares to certain of our employees and to employees of AAM which enable them, upon meeting certain vesting criteria, to acquire Class A common shares at prices below the initial public offering price. To the extent the outstanding restricted Class M common shares are ultimately exercised and/or to the extent we issue additional equity in the future, there will be dilution to investors.
71
Table of Contents
Our bye-laws contain provisions that could discourage takeovers and business combinations that our shareholders might consider in their best interests, including provisions that prevent a holder of Class A common shares from having a significant stake in Athene.
Our bye-laws include certain provisions that could have the effect of delaying, deferring, preventing or rendering more difficult a change of control that holders of our Class A common shares might consider in their best interests. For example, our bye-laws prohibit holders of our Class A common shares and certain other classes of our common shares (other than those owned by the Apollo Group) from having more than 9.9% of the total voting power of our common shares. Subject to certain exceptions determined by our board on the basis set forth in our bye-laws, the votes attributable to a holder of Class A common shares above 9.9% of the total voting power of our common shares are redistributed to other holders of Class A common shares pro rata based on the then current voting power of each holder. Such adjustments are likely to result in a shareholder having voting rights in excess of one vote per share. Therefore, a shareholder’s voting rights may increase above 5% of the aggregate voting power of the outstanding common shares, thereby possibly resulting in the shareholder becoming a reporting person subject to Schedule 13D or 13G filing requirements under the Securities Exchange Act of 1934, as amended (the “Exchange Act”). These requirements could discourage any potential investment in our Class A common shares. In addition, our board is classified into three classes of directors, with directors of each class serving staggered three-year terms. Any change in the number of directors is required by our bye-laws to be apportioned among the classes so as to maintain the number of directors in each class as nearly equal as possible, and any additional director of any class elected to fill a vacancy resulting from an increase in such class or from the removal of a director will hold such directorship for a term that coincides with the remaining term of that class. Moreover, our bye-laws require specific advance notice procedures and other protocols for holders of common shares to make shareholder proposals and nominate directors. Among other requirements, a shareholder must meet the minimum requirements for eligible shareholders to submit shareholder proposals under Rule 14a-8 of the Exchange Act, and submit specific information and make specific undertakings in relation to the shareholder proposal or director nomination. See “Description of Share Capital—Certain Bye-law Provisions—Shareholder Advance Notice Procedures.”
Any or all of these provisions could prevent holders of our Class A common shares from receiving the benefit from any premium to the market price of our Class A common shares offered by a bidder in a takeover context. Even in the absence of a takeover attempt, the existence of any of these provisions could adversely affect the prevailing market price of our Class A common shares if they were viewed as discouraging takeover attempts in the future.
AHL is a holding company with limited operations of its own. As a consequence, AHL’s ability to pay dividends on its common shares and to make timely payments on its debt obligations will depend on the ability of its subsidiaries to make distributions or other payments to it, which may be restricted by law.
AHL is a holding company with limited business operations of its own. AHL’s primary subsidiaries are insurance and reinsurance companies that own substantially all of its assets and conduct substantially all of its operations. Accordingly, AHL’s payment of dividends and ability to make timely payments on its debt obligations is dependent, to a significant extent, on the generation of cash flow by its subsidiaries and their ability to make such cash or other assets available to it, by dividend or otherwise. Dividends or distributions that may be paid by AHL’s insurance subsidiaries to it are limited or restricted by applicable insurance or other laws that are based in part on the prior year’s statutory income and surplus, or other sources. See “—Risks Relating to Insurance and Other Regulatory Matters—Our industry is highly regulated and we are subject to significant legal restrictions, regulations and regulatory oversight in connection with the operations of our business, including the discretion of various governmental entities in applying such restrictions and regulations and these restrictions may have a material adverse effect on our business, financial condition, liquidity, results of operations, cash flows and prospects.” AHL’s subsidiaries may not be able to, or may not be permitted to, make distributions to enable AHL to meet its obligations and pay dividends. In particular, as a condition to the New York State Department of Financial Services’ (“NYSDFS”) approval of our acquisition of ALICNY (formerly known as
72
Table of Contents
ALACNY) in connection with the broader Aviva USA acquisition, we have agreed not to cause ALICNY to declare, distribute or pay any dividend for five years from the date of acquisition of control of ALICNY without the prior written consent of the NYSDFS, which period expires on October 2, 2018. Similarly, as a condition to the approval of the Iowa Insurance Division (“IID”) of our acquisition of Aviva USA’s Iowa-domiciled subsidiaries, we have agreed not to cause AAIA to pay any dividend or other distribution to shareholders for five years, which period expires on August 15, 2018, without the prior approval of the IID. Further, any dividends paid to AHL by its U.S. subsidiaries would be subject to a 30% withholding tax under the U.S. Internal Revenue Code of 1986, as amended (the “Code”), which creates a significant disincentive for AHL’s subsidiaries to pay such dividends and could have the effect of significantly reducing dividends or other amounts payable to AHL by its U.S. subsidiaries. These limitations on AHL’s U.S. subsidiaries’ abilities to pay dividends to it as a shareholder may negatively impact its financial condition, results of operations and cash flows.
Each subsidiary is a distinct legal entity and legal and contractual restrictions may also limit AHL’s ability to obtain cash from its subsidiaries. In addition to the specific restrictions described above, AHL’s subsidiaries, as members of its insurance holding company system, are subject to various statutory and regulatory restrictions on their ability to pay dividends to AHL, as further described under “Business—Regulation—United States—Restrictions on Dividends and Other Distributions” and “Business—Regulation—Bermuda—MMS, ECR and Restrictions on Dividends and Distributions.”
AHL may in the future incur indebtedness in order to pay dividends to shareholders. If AHL did determine to incur additional indebtedness in order to pay dividends, such dividends would be subject to the terms of AHL’s existing indebtedness as well as any credit agreement that AHL may enter into in the future. See “Description of Certain Indebtedness—Credit Facility.” AHL does not currently anticipate paying any regular cash dividends on its common shares following this offering. Any decision to declare and pay dividends in the future will be made at the discretion of AHL’s board of directors and will depend on, among other things, AHL’s results of operations, financial condition, cash requirements, contractual restrictions and other factors that AHL’s board of directors may deem relevant. Therefore, any return on investment in AHL’s common stock may be solely dependent upon the appreciation of the price of AHL’s common stock on the open market, which may not occur.
Fulfilling our obligations incident to being a public company, including with respect to the requirements of and related rules under the Sarbanes-Oxley Act of 2002 will be expensive and time-consuming, and any delays or difficulties in satisfying these obligations could have a material adverse effect on our future results of operations and our share price.
We have historically operated as a private company and have not been subject to the same financial and other reporting and corporate governance requirements as a public company. As a public company, we will be required, among other things, to:
| • | prepare and file periodic reports, and distribute other shareholder communications, in compliance with the federal securities laws and NYSE rules; |
| • | define and expand the roles and the duties of our board of directors and its committees; |
| • | institute more comprehensive compliance, investor relations and internal audit functions; and |
| • | evaluate and maintain our system of internal control over financial reporting, and report on management’s assessment thereof, in compliance with rules and regulations of the SEC and the Public Company Accounting Oversight Board. |
The changes necessitated by becoming a public company will require a significant commitment of additional resources and management oversight which will increase our operating costs. These changes will also place significant additional demands on our actuarial, finance and accounting staff, who may not have prior public company experience or experience working for a newly public company, and on our financial accounting and information systems. We may in the future hire additional accounting and financial staff with appropriate public company reporting experience and technical accounting knowledge. Other expenses associated with being a public company include, but are not limited to, increases in auditing, accounting and legal fees and expenses, investor relations expenses, increased directors’ fees and director and officer liability insurance costs, registrar and transfer agent fees and listing fees.
73
Table of Contents
In particular, upon completion of this offering, the Sarbanes-Oxley Act of 2002 will require us to document and test the effectiveness of our internal control over financial reporting in accordance with an established internal control framework, and to report on our conclusions as to the effectiveness of our internal controls. As described in “—We previously identified material weaknesses in our internal control over financial reporting. If we fail to maintain effective internal control over financial reporting, we may not be able to accurately report our consolidated financial results,” we previously identified material weaknesses in our internal control over financial reporting. Likewise, our independent registered public accounting firm will be required to provide an attestation report on the effectiveness of our internal control over financial reporting pursuant to Section 404(b) of the Sarbanes-Oxley Act of 2002, starting with the filing of our annual report on Form 10-K for the year ended December 31, 2017. In addition, upon completion of this offering, we will be required under the Exchange Act to maintain disclosure controls and procedures and internal control over financial reporting. Any failure to implement required new or improved controls, or difficulties encountered in their implementation, could harm our operating results or cause us to fail to meet our reporting obligations. If we are unable to conclude that we have effective internal control over financial reporting, investors could lose confidence in the reliability of our financial statements. This could result in a decrease in the value of our common shares. Failure to comply with the Sarbanes-Oxley Act of 2002 could potentially subject us to sanctions or investigations by the SEC, the NYSE or other regulatory authorities.
Holders of our shares may have difficulty effecting service of process on us or enforcing judgments against us in the United States.
AHL is incorporated pursuant to the laws of Bermuda and is domiciled in Bermuda. In addition, certain of our directors and officers reside outside the United States, and a substantial portion of our assets are located in jurisdictions outside the United States. As such, we have been advised that there is doubt as to whether:
| • | a holder of our shares would be able to enforce, in the courts of Bermuda, judgments of U.S. courts against us or against persons who reside in Bermuda based upon the civil liability provisions of the U.S. federal securities laws; or |
| • | a holder of our shares would be able to bring an original action in the Bermuda courts to enforce liabilities against us or our directors and officers who reside outside the United States based solely upon U.S. federal securities laws. |
Further, we have been advised that there is no treaty in effect between the United States and Bermuda providing for the enforcement of judgments of U.S. courts, and there are grounds upon which Bermuda courts may not enforce judgments of U.S. courts. Because judgments of U.S. courts are not automatically enforceable in Bermuda, it may be difficult for you to recover against us based upon such judgments. Additionally, we have been advised that the United States and Bermuda do not currently have a treaty providing for reciprocal recognition and enforcement of judgments in civil and commercial matters. A Bermuda court may, however, impose civil liability on us or our directors or officers in a suit brought in the Supreme Court of Bermuda provided that the facts alleged constitute or give rise to a cause of action under Bermuda law. Certain remedies available under the laws of U.S. jurisdictions, including certain remedies under the U.S. federal securities laws, would not be allowed in Bermuda courts to the extent that they are contrary to public policy.
Our choice of forum provisions in our bye-laws may limit your ability to bring suits against us or our directors and officers.
Our bye-laws currently provide that if any dispute arises concerning the Companies Act or out of or in connection with our bye-laws, including any question regarding the existence and scope of any bye-law and/or whether there has been a breach of the Companies Act or our bye-laws by an officer or director (whether or not such a claim is brought in the name of a shareholder or in the name of the company), any such dispute shall be
74
Table of Contents
subject to the exclusive jurisdiction of the Supreme Court of Bermuda. This choice of forum provision may limit a shareholder’s ability to bring a claim in a judicial forum that the shareholder believes is favorable for disputes with us or our directors or officers, which may discourage lawsuits against us and our directors and officers. Alternatively, if a court were to find this provision of our bye-laws inapplicable to, or unenforceable in respect of, one or more of the specified types of actions or proceedings, we may incur additional costs associated with resolving such matters in other jurisdictions, which could adversely affect our business and financial condition.
U.S. persons who own our shares may have more difficulty in protecting their interests than U.S. persons who are shareholders of a U.S. corporation.
The Companies Act, which applies to AHL, differs in certain material respects from laws generally applicable to U.S. corporations and their shareholders. Set forth below is a summary of certain significant provisions of the Companies Act and our bye-laws which differ in certain respects from provisions of Delaware corporate law. Because the following statements are summaries, they do not discuss all aspects of Bermuda law that may be relevant to us and our shareholders.
Interested Directors
Bermuda law provides that we cannot void any transaction we enter into in which a director has an interest, nor can such director be liable to us for any profit realized pursuant to such transaction, provided the nature of the interest is disclosed at the first opportunity at a meeting of directors, or in writing, to the directors. Under Delaware law such transaction would not be voidable if:
| • | the material facts as to such interested director’s relationship or interests were disclosed or were known to the board of directors and the board of directors had in good faith authorized the transaction by the affirmative vote of a majority of the disinterested directors; |
| • | such material facts were disclosed or were known to the shareholders entitled to vote on such transaction and the transaction was specifically approved in good faith by vote of the majority of shares entitled to vote thereon; or |
| • | the transaction was fair to the corporation as of the time it was authorized, approved or ratified. |
Under Delaware law, the interested director could be held liable for a transaction in which the director derived an improper personal benefit.
Shareholders’ Suits
The rights of shareholders under Bermuda law are not as extensive as the rights of shareholders in many U.S. jurisdictions. Class actions and derivative actions are generally not available to shareholders under the laws of Bermuda. However, the Bermuda courts ordinarily would be expected to follow English case law precedent, which would permit a shareholder to commence an action in the name of the company to remedy a wrong done to the company where an act is alleged to be beyond the corporate power of the company, is illegal or would result in the violation of our memorandum of association or bye-laws. Furthermore, a court would consider acts that are alleged to constitute a fraud against the minority shareholders or acts requiring the approval of a greater percentage of our shareholders than actually approved it. The winning party in such an action generally would be able to recover a portion of attorneys’ fees incurred in connection with such action. Class actions and derivative actions generally are available to shareholders under Delaware law for, among other things, breach of fiduciary duty, corporate waste and actions not taken in accordance with applicable law. In such actions, the court has discretion to permit the winning party to recover attorneys’ fees incurred in connection with such action. See “Enforcement of Civil Liabilities Under U.S. Federal Securities Laws.”
75
Table of Contents
Indemnification of Directors
Prior to the completion of this offering, we entered into indemnification agreements with our directors and officers. The indemnification agreements provide that we will indemnify our directors and officers or any person appointed to any committee by the board of directors acting in their capacity as such for any loss arising or liability attaching to them by virtue of any rule of law in respect of any negligence, default, breach of duty or breach of trust of which such person may be guilty in relation to Athene other than in respect of his own fraud or dishonesty. However, we are required to indemnify our directors and officers in any proceeding in which they are successful. The indemnification agreements are limited to those payments that are lawful under Bermuda law. See “Comparison of Shareholder Rights.”
Furthermore, pursuant to our bye-laws, our shareholders have agreed to waive any claim or right of action such shareholder may have, whether individually or by or in right of AHL, against any director or officer of AHL on account of any action taken by such director or officer, or the failure of such director or officer to take any action in the performance of his or her duties with or for AHL or any subsidiary of AHL; provided that such waiver does not extend to any matter in respect of any fraud or dishonesty which may attach to such director or officer.
If securities or industry analysts do not publish research or publish misleading or unfavorable research about our business, our share price and trading volume could decline.
The trading market for our Class A common shares will depend in part on the research and reports that securities or industry analysts publish about us or our business. We do not currently have and may never obtain research coverage by securities and industry analysts. If there is no coverage of our company by securities or industry analysts, the trading price for our Class A common shares would be negatively impacted. In the event we obtain securities or industry analyst coverage, or if one or more of these analysts downgrades our Class A common shares or publishes misleading or unfavorable research about our business, our share price would likely decline. If one or more of these analysts ceases coverage of our company or fails to publish reports on us regularly, demand for our Class A common shares could decrease, which could cause our share price or trading volume to decline.
76
Table of Contents
SPECIAL NOTE REGARDING FORWARD-LOOKING STATEMENTS AND MARKET DATA
This prospectus contains forward-looking statements that are subject to certain risks and uncertainties. You can identify forward-looking statements by the fact that they do not relate strictly to historical or current facts. These statements may include words such as “anticipate,” “estimate,” “expect,” “project,” “plan,” “intend,” “seek,” “assume,” “believe,” “may,” “will,” “should,” “could,” “would,” “likely” and other words and terms of similar meaning, including the negative of these or similar words and terms, in connection with any discussion of the timing or nature of future operating or financial performance or other events. However, not all forward-looking statements contain these identifying words. Forward-looking statements appear in a number of places throughout this prospectus and give our current expectations and projections relating to our financial condition, results of operations, plans, strategies, objectives, future performance, business and other matters.
We caution you that forward-looking statements are not guarantees of future performance and that our actual consolidated results of operations, financial condition and liquidity may differ materially from those made in or suggested by the forward-looking statements contained in this prospectus. There can be no assurance that actual developments will be those anticipated by us. In addition, even if our consolidated results of operations, financial condition and liquidity are consistent with the forward-looking statements contained in this prospectus, those results or developments may not be indicative of results or developments in subsequent periods. A number of important factors could cause actual results or conditions to differ materially from those contained or implied by the forward-looking statements, including the risks discussed in “Risk Factors.” Factors that could cause actual results or conditions to differ from those reflected in the forward-looking statements contained in this prospectus include:
| • | the accuracy of management’s assumptions and estimates; |
| • | variability in the amount of statutory capital that our insurance and reinsurance subsidiaries have; |
| • | interest rate fluctuations; |
| • | our potential need for additional capital in the future and the potential unavailability of such capital to us on favorable terms or at all; |
| • | the activities of our competitors and our ability to grow our retail business in a highly competitive environment; |
| • | the impact of general economic conditions on our ability to sell our products and the fair value of our investments; |
| • | our ability to successfully acquire new companies or businesses and/or integrate such acquisitions into our existing framework; |
| • | downgrades, potential downgrades or other negative actions by rating agencies; |
| • | our dependence on key executives and inability to attract qualified personnel, or the potential loss of Bermudian personnel as a result of Bermuda employment restrictions; |
| • | market and credit risks that could diminish the value of our investments; |
| • | foreign currency fluctuations; |
| • | effects of Brexit on our business, investments and growth strategy; |
| • | introduction of an EU FTT; |
| • | potential litigation (including class action litigation), enforcement investigations or regulatory scrutiny against us and our subsidiaries, which we may be required to defend against or respond to; |
| • | the impact of new accounting rules or changes to existing accounting rules on our business; |
| • | interruption or other operational failures in telecommunication and information technology and other operating systems, as well as our ability to maintain the security of those systems; |
77
Table of Contents
| • | the termination by AAM or AAME of its IMAs with us and limitations on our ability to terminate such arrangements; |
| • | AAM’s or AAME’s dependence on key executives and inability to attract qualified personnel; |
| • | increased regulation or scrutiny of alternative investment advisers and certain trading methods; |
| • | potential changes to regulations affecting, among other things, transactions with our affiliates, the ability of our subsidiaries to make dividend payments or distributions to us, acquisitions by or of us, minimum capitalization and statutory reserve requirements for insurance companies and fiduciary obligations on parties who distribute our products; |
| • | suspension or revocation of our subsidiaries’ insurance and reinsurance licenses; |
| • | AHL or ALRe becoming subject to U.S. federal income taxation; |
| • | adverse changes in U.S. tax law; |
| • | our being subject to U.S. withholding tax under FATCA; |
| • | our potential inability to pay dividends or distributions; and |
| • | other risks and factors listed under “Risk Factors” and elsewhere in this prospectus. |
We caution you that the important factors referenced above may not contain all of the factors that are important to you in making a decision to invest in our Class A common shares. In addition, we cannot assure you that we will realize the results or developments we expect or anticipate or, even if substantially realized, that they will result in the consequences or affect us or our operations in the way we expect or anticipate. In light of these risks, you should not place undue reliance upon any forward-looking statements contained in this prospectus. The forward-looking statements included in this prospectus are made only as of the date hereof. We undertake no obligation, except as may be required by law, to publicly update or revise any forward-looking statement as a result of new information, future events or otherwise. Comparisons of results for current and any prior periods are not intended to express any future trends, or indications of future performance, unless expressed as such, and should only be viewed as historical data.
78
Table of Contents
We will not receive any proceeds from the sale of the Class A common shares being sold by the selling shareholders in this offering. See “Principal and Selling Shareholders—Selling Shareholders.”
79
Table of Contents
We do not currently pay dividends on any of our common shares and we currently intend to retain all available funds and any future earnings for use in the operation of our business. We may, however, pay cash dividends on our common shares, including our Class A common shares, in the future. Any future determination to pay dividends will be made at the discretion of our board of directors and will depend upon many factors, including our financial condition, earnings, legal and regulatory requirements, restrictions in our debt agreements and other factors our board of directors deems relevant. While we do not currently have any preference shares, if we issue such shares in the future, our board of directors may declare and pay a dividend on one or more classes of shares to the extent one or more classes of shares ranks senior to or has a priority over another class of shares. Our ability to pay dividends on our Class A common shares is limited by the terms of our existing indebtedness and may be restricted by the terms of any future credit agreement or any future debt or preferred securities of ours or of our subsidiaries. See “Description of Certain Indebtedness—Credit Facility” and “Management’s Discussion and Analysis of Financial Condition and Results of Operations—Liquidity and Capital Resources—Holding Company Liquidity.”
Furthermore, AHL is a holding company and it has no direct operations. All of AHL’s business operations are conducted through its subsidiaries. Any dividends AHL pays will depend upon its funds legally available for distribution, including dividends from its subsidiaries. AHL’s insurance subsidiaries are highly regulated and are required to comply with various conditions before they are able to pay dividends or make distributions to AHL. See “Business—Regulation—United States—Restrictions on Dividends and Other Distributions.” In addition, any dividends payable to AHL by its U.S. insurance subsidiaries, if permitted, would be subject to a 30% withholding tax.
80
Table of Contents
The following table summarizes, as of October 31, 2016, the total number of Class A common shares purchased or to be purchased, the total consideration paid or to be paid and the average price per share paid or to be paid by the (i) existing shareholders (including the selling shareholders) and (ii) new investors purchasing shares in this offering, based on an initial public offering price of $ per Class A common share (the mid-point of the price range set forth on the cover page of this prospectus) before deducting the underwriting discounts and commissions in connection with this offering and estimated offering expenses payable (amounts in thousands, except percentages and per share data):
| Class A and Class B Common Shares Purchased |
Total Consideration |
Average Price Per Share |
||||||||||||||||||
| Number | Percent | Amount | Percent | |||||||||||||||||
| Existing holders of common shares(1) |
||||||||||||||||||||
| New investors(1) |
||||||||||||||||||||
| Total |
||||||||||||||||||||
| (1) | The number of shares disclosed for the existing shareholders includes Class A common shares being sold by the selling shareholders in this offering. The number of shares disclosed for the new investors includes Class A common shares being purchased by the new investors from the selling shareholders in this offering. The sale of shares of Class A common shares to be sold by the selling shareholders in this offering will reduce the number of Class A and Class B common shares held by existing shareholders to shares, or % of the total Class A and Class B common shares outstanding, and will increase the number of shares held by investors participating in this offering to shares, or % of the total Class A and Class B common shares outstanding. |
Because the total number of shares outstanding following this offering will not be impacted by any exercise of the underwriters’ option to purchase additional shares of common stock from the selling stockholders and we will not receive any net proceeds from such exercise, there will be no change to the dilution in net tangible book value per share of common stock to purchasers in the offering due to any such exercise of the option.
If the underwriters exercise in full their option to purchase additional shares, the number of Class A and Class B common shares held by existing shareholders after the completion of this offering and after giving effect to the sale by the selling shareholders of Class A common shares in this offering will be , or % of the total Class A and Class B common shares outstanding after this offering, and the number of shares of Class A common shares held by new investors will be , or % of the total Class A and Class B common shares outstanding after this offering.
The number of Class A and Class B common shares to be outstanding after this offering is based on (1) 52,879,773 shares of Class A common shares outstanding as of October 31, 2016, (2) the number of Class A common shares offered in this offering and (3) 135,963,975 shares of Class B common shares outstanding as of October 31, 2016, and excludes:
| • | 11,863,197 shares of outstanding restricted Class M common shares with a weighted average conversion price of $ per share, which following the completion of this offering, will be convertible (subject to vesting) into 11,863,197 Class A common shares; and |
| • | options outstanding under our share option plans or share options to be granted at or after this offering. |
81
Table of Contents
SELECTED HISTORICAL CONSOLIDATED FINANCIAL AND OPERATING DATA
The following tables set forth our selected historical consolidated financial and operating data. The selected historical consolidated financial data as of September 30, 2016, and for the nine months ended September 30, 2016 and 2015, have been derived from our historical unaudited condensed consolidated financial statements and notes thereto included elsewhere in this prospectus. The selected historical consolidated financial data, as it relates to each of the years from 2011 through 2015, has been derived from our annual financial statements. The selected historical consolidated financial data as of December 31, 2015 and 2014, and each of the three years in the period ended December 31, 2015, have been derived from our historical audited consolidated financial statements and notes thereto included elsewhere in this prospectus. Our historical results are not necessarily indicative of future operating results and the results for any interim period are not necessarily indicative of the results that may be expected for a full fiscal year.
You should read this information in conjunction with the section entitled “Management’s Discussion and Analysis of Financial Condition and Results of Operations” and our consolidated financial statements and notes thereto and the consolidated financial statements of Aviva USA and notes thereto, in each case, included elsewhere in this prospectus.
82
Table of Contents
Selected historical consolidated financial and operating data are as follows (dollars in millions, except per share data):
| Nine months ended September 30, |
Years ended December 31, | |||||||||||||||||||||||||||
| 2016(2) | 2015 | 2015(1)(2) | 2014 | 2013(1) | 2012(1) | 2011(1) | ||||||||||||||||||||||
| Consolidated Statements of Income Data: |
||||||||||||||||||||||||||||
| Total revenues |
$ | 3,045 | $ | 1,571 | $ | 2,616 | $ | 4,100 | $ | 1,749 | $ | 1,017 | $ | (857) | ||||||||||||||
| Total benefits and expenses |
2,678 | 1,199 | 2,024 | 3,568 | 760 | 653 | (860) | |||||||||||||||||||||
| Income before income taxes |
367 | 372 | 592 | 532 | 989 | 365 | 3 | |||||||||||||||||||||
| Net income available to AHL shareholders |
437 | 320 | 562 | 463 | 916 | 377 | — | |||||||||||||||||||||
| Operating income (loss), net of tax (a non-GAAP measure) |
476 | 496 | 740 | 793 | 777 | 232 | (9) | |||||||||||||||||||||
| ROE |
9.4% | 8.5% | 11.3% | 12.7% | 39.6% | 30.0% | (0.1)% | |||||||||||||||||||||
| ROE excluding AOCI (a non-GAAP measure) |
9.9% | 9.2% | 11.8% | 14.0% | 42.2% | 32.9% | (0.1)% | |||||||||||||||||||||
| Operating ROE excluding AOCI (a non-GAAP measure) |
10.8% | 14.3% | 15.6% | 24.0% | 35.8% | 20.3% | (1.8)% | |||||||||||||||||||||
| Earnings (loss) per share on Class A and Class B common shares: |
||||||||||||||||||||||||||||
| Basic |
$ | 2.35 | $ | 1.87 | $ | 3.21 | $ | 3.58 | $ | 8.07 | $ | 5.59 | $ | (0.01) | ||||||||||||||
| Diluted(3) |
$ | 2.35 | $ | 1.87 | $ | 3.21 | $ | 3.52 | $ | 7.96 | $ | 5.59 | $ | (0.01) | ||||||||||||||
| Operating earnings (loss) per share on Class A and Class B common shares (a non-GAAP measure): |
||||||||||||||||||||||||||||
| Diluted |
$ | 2.56 | $ | 2.89 | $ | 4.23 | $ | 6.03 | $ | 6.75 | $ | 3.45 | $ | (0.22) | ||||||||||||||
| Weighted average Class A and Class B common shares outstanding: |
||||||||||||||||||||||||||||
| Basic |
185,924,524 | 171,457,313 | 175,091,802 | 129,519,108 | 113,506,457 | 67,343,297 | 41,434,233 | |||||||||||||||||||||
| Diluted(3) |
186,016,862 | 171,513,944 | 175,178,648 | 131,608,464 | 115,110,030 | 67,343,297 | 41,434,233 | |||||||||||||||||||||
| September 30, |
December 31, | |||||||||||||||||||||||
| 2016(2) | 2015(1)(2) | 2014 | 2013(1) | 2012(1) | 2011(1) | |||||||||||||||||||
| Consolidated Balance Sheet Data: |
||||||||||||||||||||||||
| Investments, including related parties |
$ | 73,077 | $ | 64,525 | $ | 60,631 | $ | 58,156 | $ | 13,911 | $ | 9,364 | ||||||||||||
| Investments of consolidated variable interest entities |
837 | 1,565 | 3,409 | 4,348 | 2,478 | 941 | ||||||||||||||||||
| Total assets |
87,000 | 80,854 | 82,710 | 80,807 | 19,315 | 13,475 | ||||||||||||||||||
| Interest sensitive contract liabilities |
60,901 | 57,296 | 60,641 | 60,386 | 13,264 | 10,357 | ||||||||||||||||||
| Future policy benefits |
15,087 | 14,540 | 11,137 | 10,712 | 2,462 | 1,467 | ||||||||||||||||||
| Notes payable, including related party notes payable |
— | — | — | 351 | 153 | 40 | ||||||||||||||||||
| Borrowings of consolidated variable interest entities |
— | 500 | 2,017 | 2,413 | 1,225 | 725 | ||||||||||||||||||
| Total liabilities |
79,926 | 75,491 | 78,122 | 77,952 | 17,452 | 12,826 | ||||||||||||||||||
| Total AHL shareholders’ equity |
7,073 | 5,362 | 4,555 | 2,761 | 1,863 | 648 | ||||||||||||||||||
| Book value per share |
$ | 38.00 | $ | 28.81 | $ | 32.29 | $ | 23.99 | $ | 16.61 | $ | 10.92 | ||||||||||||
| Book value per share, excluding AOCI (a non-GAAP measure) |
$ | 33.06 | $ | 30.09 | $ | 27.73 | $ | 23.39 | $ | 14.66 | $ | 10.87 | ||||||||||||
| Class A and Class B common shares outstanding |
186,166,905 | 186,115,240 | 141,035,628 | 115,099,947 | 112,088,679 | 59,318,698 | ||||||||||||||||||
83
Table of Contents
| (1) | Reflects the acquisition of DLD from October 1, 2015, the acquisition of Aviva USA from October 2, 2013, the acquisition of Presidential Life Corporation from December 28, 2012, the acquisition of Investors Insurance Corporation from July 18, 2011 and the acquisition of Athene Annuity (formerly known as Liberty Life) from April 29, 2011. |
| (2) | Effective August 1, 2015, AAIA agreed to novate certain open blocks of business ceded to Accordia, an affiliate of Global Atlantic, and amended portions of reinsurance agreements between ALICNY and FAFLIC, an affiliate of Global Atlantic, which changed the reinsurance agreements from funds withheld coinsurance to coinsurance agreements. Refer to “Note 6 – Reinsurance” to our unaudited condensed consolidated financial statements and notes thereto and “Note 9 – Reinsurance” to our audited consolidated financial statements and notes thereto included elsewhere in this prospectus. |
| (3) | Diluted EPS for each of the periods presented excludes Class M shares and RSUs, in each case, for which issuance restrictions had not been satisfied as of the respective period end. As of September 30, 2016, excluded from the diluted EPS calculation were 12,720,694 Class M shares and RSUs. Had the relevant issuance restrictions been satisfied as of September 30, 2016 and such securities been included in the calculation of diluted EPS for the nine months ended September 30, 2016, diluted EPS would have been $2.27 and weighted average shares outstanding would have been 193,009,029. |
84
Table of Contents
MANAGEMENT’S DISCUSSION AND ANALYSIS OF
FINANCIAL CONDITION AND RESULTS OF OPERATIONS
General
Management’s discussion and analysis of our financial condition and results of operations should be read in conjunction with the sections entitled “Prospectus Summary—Summary Historical Consolidated Financial and Operating Data,” “Selected Historical Consolidated Financial and Operating Data” and our consolidated financial statements and notes thereto included elsewhere in this prospectus. This discussion includes forward-looking statements and involves numerous risks and uncertainties, including, but not limited to those described in the “Risk Factors” section of this prospectus. See “Special Note Regarding Forward-Looking Statements and Market Data.” Future results could differ significantly from the historical results presented in this section.
Overview
We are a leading retirement services company that issues, reinsures and acquires retirement savings products designed for the increasing number of individuals and institutions seeking to fund retirement needs. We generate attractive financial results for our policyholders and shareholders by combining our two core competencies of (1) sourcing long-term, generally illiquid liabilities and (2) investing in a high quality investment portfolio, which takes advantage of the illiquid nature of our liabilities. Our steady and significant base of earnings generates capital that we opportunistically invest across our business to source attractively-priced liabilities and capitalize on opportunities. Our differentiated investment strategy benefits from our strategic relationship with Apollo and its indirect subsidiary, AAM. AAM provides a full suite of services for our investment portfolio, including direct investment management, asset allocation, mergers and acquisition asset diligence, and certain operational support services, including investment compliance, tax, legal and risk management support. Our relationship with Apollo and AAM also provides us with access to Apollo’s investment professionals across the world as well as Apollo’s global asset management infrastructure that, as of September 30, 2016, supported more than $188 billion of AUM across a broad array of asset classes. We are led by a highly skilled management team with extensive industry experience. We are based in Bermuda with our U.S. subsidiaries’ headquarters located in Iowa.
We began operating in 2009 when the burdens of the financial crisis and resulting capital demands caused many companies to exit the retirement market, creating the need for a well-capitalized company with an experienced management team to fill the void. Taking advantage of this market dislocation, we have been able to acquire substantial blocks of long-duration liabilities and reinvest the related investments to produce profitable returns. We have established a significant base of earnings and as of September 30, 2016, have an expected annual investment margin of 2-3% over the 8.4 year weighted-average life of our deferred annuities, which make up a substantial portion of our reserve liabilities. Even as we have grown to $73.1 billion in investments, including related parties, $71.6 billion in invested assets and $87.0 billion of total assets as of September 30, 2016, we have continued to approach both sides of the balance sheet with an opportunistic mindset because we believe quickly identifying and capitalizing on market dislocations allows us to generate attractive, risk-adjusted returns for our shareholders. Further, our multiple distribution channels support growing origination across market environments and better enable us to achieve continued balance sheet growth while maintaining attractive profitability. We believe that in a typical market environment, we will be able to profitably grow through our organic channels, including retail, flow reinsurance and institutional products. In more challenging market environments, we believe that we will see additional opportunities to grow through our inorganic channels, including acquisitions and block reinsurance, due to market stress during those periods.
As a result of our focus on issuing, reinsuring and acquiring attractively-priced liabilities, our differentiated investment strategy and our significant scale, for the nine months ended September 30, 2016 and the year ended December 31, 2015, in our Retirement Services segment described below, we generated an annualized investment margin on deferred annuities of 2.68% and 2.45%, respectively, annualized operating ROE excluding
85
Table of Contents
AOCI of 17.5% and 22.7%, respectively, and an operating ROE excluding AOCI for the trailing twelve month period ended September 30, 2016 of 20.1%. We currently maintain what we believe to be high capital ratios for our rating and hold more than $1 billion of excess capital, and view this excess as strategic capital available to reinvest into organic and inorganic growth opportunities. Because we hold such strategic capital to implement our opportunistic strategy and to enable us to explore deployment opportunities as they arise, and because we are investing for future growth, our annualized consolidated ROE for the nine months ended September 30, 2016 and the year ended December 31, 2015 was 9.4% and 11.3%, respectively, and our consolidated annualized operating ROE excluding AOCI for the same periods was 10.8% and 15.6%, respectively.
We operate our core business strategies out of one reportable segment, Retirement Services. In addition to Retirement Services, we report certain other operations in Corporate and Other. Retirement Services is comprised of our U.S. and Bermuda operations which issue and reinsure retirement savings products and institutional products. Corporate and Other includes certain other operations related to our corporate activities and our German operations, which is primarily comprised of participating long-duration savings products.
We have developed organic and inorganic channels to address the retirement services market and grow our assets and liabilities. By focusing on the retirement services market, we believe that we will benefit from several demographic and economic trends, including the increasing number of retirees in the United States, the lack of tax advantaged alternatives for people trying to save for retirement and expectations of a rising interest rate environment. To date, most of our products sold and acquired have been fixed annuities, which offer people saving for retirement a product that is tax advantaged, has a minimum guaranteed rate of return or minimum cash value and provides protection against investment loss. Our policies often include surrender charges (86% of our annuity products, as of September 30, 2016) or MVAs (73% of our annuity products, as of September 30, 2016), both of which increase persistency and protect our ability to meet our obligations to policyholders. Our organic channels, including retail, flow reinsurance and institutional products, provided deposits of $6.9 billion and $2.6 billion for the nine months ended September 30, 2016 and 2015, respectively, and provided deposits of $3.9 billion, $2.9 billion and $1.5 billion for the years ended December 31, 2015, 2014 and 2013, respectively. We believe the 2015 upgrade of our financial strength ratings to A- by each of S&P, Fitch and A.M. Best, as well as our 2016 outlook upgrade to positive by A.M. Best and our recent FIA and MYGA new product launches, have enabled and will continue to enable us to increase penetration in our existing organic channels, and access new markets within our retail channel, such as financial institutions. This increased penetration will allow us to source additional volumes of profitably underwritten liabilities. Our inorganic channels, including acquisitions and block reinsurance, have contributed significantly to our growth. We believe our internal acquisitions team, with support from Apollo, has an industry-leading ability to source, underwrite, and expeditiously close transactions, which makes us a competitive counterparty for acquisition or block reinsurance transactions. The aggregate purchase price of our acquisitions was less than the aggregate statutory book value of the businesses acquired.
We plan to grow organically by expanding our retail, reinsurance and institutional product distribution channels. We believe that we have the right people, infrastructure and scale to position us for continued growth. Within our retail channel we had fixed annuity sales of $3.8 billion and $1.9 billion for the nine months ended September 30, 2016 and 2015, respectively, and sales of $2.5 billion, $2.5 billion and $1.3 billion for the years ended December 31, 2015, 2014 and 2013, respectively. We aim to grow our retail channel in the United States by deepening our relationships with our approximately 60 IMOs and approximately 30,000 independent agents. Our strong financial position and capital efficient products allow us to be a dependable partner with IMOs and consistently write new business. We work with our IMOs to develop customized, and at times exclusive, products that help drive sales. We expect our retail channel to continue to benefit from the ratings upgrade in 2015, our improving credit profile and recent product launches. We believe this should support growth in sales at our desired cost of crediting through increased volumes via current IMOs and access to new distribution channels, including small to mid-sized banks and regional broker-dealers. We are implementing the necessary technology platform, hiring and training a specialized sales force, and have created products to capture new potential distribution opportunities. Our reinsurance channel also benefited from the 2015 ratings upgrade. We target reinsurance business consistent with our preferred liability characteristics, and as such, reinsurance
86
Table of Contents
provides another opportunistic channel for us to source long-term liabilities with attractive crediting rates. For the nine months ended September 30, 2016, we generated deposits through our flow reinsurance channel of $3.1 billion, while for the full year of 2015, we generated deposits of $1.1 billion, up from $167 million in 2013. We expect to grow this channel further as we continue to add new partners, some of which prefer to do business with higher rated counterparties such as us. In addition, after having sold our first funding agreement under our FABN program in 2015, we expect to grow this channel over time.
Acquisition Summary Included in Results of Operations
The following description of our financial condition and results of operations reflect the acquisitions of Aviva USA and DLD, as well as certain reinsurance and other transactions entered into in connection with such acquisitions. The significant impact of these transactions has a material effect on the comparability of our historical results. For this reason in particular, historical discussions of changes between periods are not necessarily indicative of future results. To enhance comparability of September 30, 2016 and 2015, and December 31, 2015, 2014 and 2013 results, we highlight the financial results applicable to the acquisitions of Aviva USA and DLD where meaningful.
On October 2, 2013, we acquired 100% of the common shares of Aviva USA from Aviva plc. and renamed the business Athene USA. At closing, we ceded substantially all of the risk of Aviva USA’s life insurance business to affiliates of Global Atlantic. As a result of the acquisition, we acquired $58.2 billion of assets and $57.5 billion of liabilities, excluding the impact of reinsurance transactions and grew to approximately four times our size immediately prior to the acquisition (as measured by total assets). We recognized a bargain purchase gain related to this transaction of $152 million in our 2013 financial results. The increase in assets and liabilities related to this acquisition are reflected in the results of operations discussed in this section and drove the majority of our variances when comparing 2014 and 2013.
As part of our acquisition of Aviva USA, we effectuated a sale of substantially all of Aviva USA’s life insurance business by reinsuring such business to affiliates of Global Atlantic. We entered into a 100% coinsurance and assumption agreement with Accordia covering all open block life insurance business issued by AAIA, with the exception of enhanced guarantee universal life insurance products. In addition, the coinsurance and assumption agreement provides separate excess of loss coverage for policy liabilities of AAIA related to the former AmerUs Life Insurance Company (“AmerUs”) closed block (“AmerUs Closed Block”) that are also subject to existing reinsurance through Athene Re USA IV, Inc. (formerly known as Aviva Re IV, “Athene Re IV”). We have elected the fair value option to value the AmerUs Closed Block, whereby the unrealized gains and losses on the assets flow through the income statement with a fair value liability offsetting the asset movements in the future policy and other policy benefits line of our consolidated financial statements.
On October 1, 2015, we acquired 100% of the outstanding shares of DLD from Delta Lloyd N.V., an Amsterdam-based financial services provider. As a result of the acquisition, we acquired $5.9 billion of assets and $5.9 billion of liabilities (as of the acquisition date) and began operating in Germany.
Industry Trends and Competition
Market Conditions
Our business and results of operations are materially affected by conditions in the global capital markets and the economy generally. A general economic slowdown could adversely affect us in the form of changes in consumer behavior and decreases in the returns on and value of our investment portfolio. Concerns over the slow economic recovery, the level of U.S. national debt, currency fluctuations and volatility, the stability of the EU, Brexit and the potential exit of certain other EU members, the rate of growth of China and other Asian economies, unemployment, the availability and cost of credit, the U.S. housing market, inflation levels, low or negative interest rates, energy costs and geopolitical issues have contributed to increased volatility and
87
Table of Contents
diminished expectations for the economy and the markets. Declining economic growth rates globally and resultant diverging paths of monetary policy could increase volatility in the credit markets, potentially impacting the availability and cost of credit. Factors such as equity prices, equity market volatility, interest rates, counterparty risks, availability of credit, inflation rates, economic uncertainty, changes in laws or regulations (including laws relating to the financial markets generally or the taxation or regulation of the insurance industry), trade barriers, commodity prices, currency exchange rates and controls and national and international political circumstances (including governmental instability, wars, terrorist acts or security operations) can have a material impact on the value of our investment portfolio and our ability to sell our products. We adjust the structure of our products depending on the economic environment, the behavior of customers and other factors, including mortality rates, morbidity rates, cap rates, rollup rates, annuitization rates and lapse rates, which can vary in response to changes in market conditions. We believe continued economic growth, stable financial markets and a potentially rising interest rate environment may ultimately enhance the attractiveness of our product portfolio. However, we remain exposed to potential slowdowns in economic activity, which could be characterized by rising unemployment, falling interest rates, widening credit spreads and an increase in corporate credit and real estate-related defaults.
Interest Rate Environment
As a retirement services company focused on issuing and reinsuring fixed annuities, we are affected by the monetary policy of the Federal Reserve in the United States as well as other central banks around the world. In spite of the Federal Reserve increasing federal funds rates in December 2015 for the first time in almost a decade, interest rates in the United States remain lower than historical levels. The lower interest rates in part are due to a number of actions taken in recent years by the Federal Reserve in an effort to stimulate economic activity. Any future increases in federal funds rates are uncertain and will depend on the economic outlook.
Our investment portfolio consists predominantly of fixed maturity investments. See “—Consolidated Investment Portfolio.” If prevailing interest rates were to rise, we believe the yield on our new investment purchases would also rise and the value of our existing investments may decline. If prevailing interest rates were to decline, it is likely that the yield on our new investment purchases would decline and the value of our existing investments may increase. We address interest rate risk through managing the duration of the liabilities we source with assets we acquire and through ALM modeling. We endeavor to limit reinvestment risk related to cash flows by managing our asset portfolio to ensure it provides adequate cash flows to meet our expected policyholder benefit cash flows to within tolerable risk management limits. Our strategy is to achieve sustainable yields that allow us to maintain an attractive investment margin. As part of our investment strategy, we purchase floating rate investments, which we expect will perform well in a rising interest rate environment. Our investment portfolio includes $20.5 billion of floating rate investments, or approximately 29% of our total invested assets as of September 30, 2016. As part of our reinvestment strategy for the investment portfolios of our acquired companies, we generally seek to reinvest assets at yields higher than the related assets being liquidated for reinvestment. We continuously seek to optimize our investment portfolio to achieve favorable returns over the long term.
If prevailing interest rates were to rise, we believe our products would be more attractive to consumers and our sales would likely increase. In periods of prolonged low interest rates, the investment margin earned on deferred annuities may be negatively impacted to the extent our ability to reduce policyholder crediting rates are limited by policyholder guarantees in the form of minimum crediting rates. Additionally, certain policies may exhibit lower profitability in periods of prolonged low interest rates due to reduced investment income. As of September 30, 2016, most of our products were fixed annuities with approximately 35% of our FIAs at the minimum guarantees and approximately 52% of our fixed rate annuities at the minimum crediting rates. As of September 30, 2016, minimum guarantees on all of our deferred annuities, including those with crediting rates already at their minimum guarantees, were, on average, 65 to 75 basis points below the crediting rates on such deferred annuities, allowing us room to reduce rates before reaching the minimum guarantees. The remaining liabilities are associated with immediate annuities, funding agreements or life contracts which have crediting
88
Table of Contents
rates or costs that are less sensitive or insensitive to interest rate movements. A significant majority of our products have crediting rates that we may reset annually upon renewal following the expiration of the current guaranteed period. While we have the contractual ability to lower these crediting rates to the guaranteed minimum levels, our willingness to do so may be limited by competitive pressures.
See “—Quantitative and Qualitative Disclosures About Market Risk” for more detail on market risk, which includes interest rate and other significant risks and our strategies for managing these risks.
Demographics
Over the next four decades, the retirement-age population is expected to experience unprecedented growth. Technological advances and improvements in healthcare are projected to continue to contribute to increasing average life expectancy, and aging individuals must be prepared to fund retirement periods that will last longer than ever before. Further, many working households in the United States do not have adequate retirement savings. As a tool for addressing the unmet need for retirement planning, we believe that many Americans have begun to look to tax-efficient savings products with low-risk or guaranteed return features and potential equity market upside, particularly as federal, state and local marginal tax rates have increased. Our tax-efficient savings products are well positioned to meet this increasing customer demand. The impact of this growth in demand may be offset to some extent by asset outflows as an increasing percentage of the population begins withdrawing assets to convert their savings into income.
We believe that our strong presence in the FIA market and strength of our relationships with IMOs position us to effectively serve consumers’ demand in the rapidly growing retirement savings market. We expect our retail channel to continue to benefit from the ratings upgrade in 2015, our improving credit profile and recent product launches. We believe this should help us to grow sales at our desired cost of crediting through increased volumes via current IMOs and access to new distribution channels, including small to mid-sized banks and regional broker-dealers. We also believe that the 2015 financial strength ratings upgrades and our 2016 outlook upgrade to positive by A.M. Best have enabled and will continue to enable us to increase penetration in our existing organic channels, such as flow reinsurance and the FABN market while also helping us enter into the pension risk transfer market.
Competition
We operate in highly competitive markets. We face a variety of large and small industry participants, including diversified financial institutions and insurance and reinsurance companies. These companies compete in one form or another for the growing pool of retirement assets driven by a number of external factors such as the continued aging of the population and the reduction in safety nets provided by governments and private employers. In many segments, product differentiation is difficult as product development and life cycles have shortened. In addition, we have experienced pressure on fees as product unbundling and lower cost alternatives have emerged. As a result, scale and the ability to provide value-added services and build long-term relationships are important factors to compete effectively. We believe that our leading presence in the retirement market, diverse range of capabilities and broad distribution network uniquely position us to effectively serve consumers’ increasing demand for retirement solutions, particularly in the FIA market.
According to LIMRA, total fixed annuity market sales in the United States were $63.8 billion for the six months ended June 30, 2016 (the most recent period for which information is available), a 39.4% increase from the same time period in 2015. This increase was driven by an increase in traditional fixed rate deferred annuities of $9.0 billion, or 66.7%, and an increase in FIA products of $7.8 billion, or 32.4%. In the total fixed annuity market, for the six months ended June 30, 2016, we were the 12th largest company based on sales with a 2.8% market share and $1.8 billion in sales. For the six months ended June 30, 2015, our market share was 2.9% with sales of $1.3 billion.
According to LIMRA, total fixed annuity market sales in the United States were $103.7 billion for the year ended December 31, 2015, a 7.1% increase from the same time period in 2014. This increase was largely driven
89
Table of Contents
by an increase in FIA products of 13.1% and an increase in traditional fixed rate deferred annuities of 3.6%. In the total fixed annuity market, for the year ended December 31, 2015, we were the 13th largest company based on sales with a 2.4% market share and $2.5 billion in sales. For the year ended December 31, 2014, our market share was 2.6% with sales of $2.5 billion.
FIAs are one of the fastest growing annuity products having grown from $27.3 billion in 2005 to $54.5 billion in sales for the year ended December 31, 2015. According to LIMRA, for the six months ended June 30, 2016, we were the 5th largest provider of FIAs in terms of sales, and our market share for the same period was 5.0% with sales of $1.6 billion. For the six months ended June 30, 2015, our market share was 5.5% with sales of $1.3 billion. According to LIMRA, for the year ended December 31, 2015, we were the 6th largest provider of FIAs based on sales, and our market share for the same period was 4.5% with sales of $2.4 billion. For the year ended December 31, 2014, our market share was 5.0% with sales of $2.4 billion.
Regulatory Developments
On April 6, 2016, the DOL issued a new regulation more broadly defining the circumstances under which a person is considered to be a fiduciary by reason of giving investment advice or recommendations to an employee benefit plan or a plan’s participants or to IRA holders. In addition to releasing the investment advice regulation, the DOL: (1) issued a new prohibited transaction class exemption titled the “Best Interest Contract Exemption,” to be used in connection with the sale of FIAs or variable annuities, and (2) updated the previously prohibited transaction class exemption 84-24, to be used in connection with the sale of traditional fixed rate annuities. We cannot predict with any certainty the impact of the new regulation and exemptions, but the regulation and exemptions may alter the way our products and services are marketed and sold, particularly to purchasers of IRAs and individual retirement annuities.
Key Operating and Non-GAAP Measures
In addition to our results presented in accordance with GAAP, our results of operations include certain non-GAAP measures commonly used in our industry. Management believes the use of these non-GAAP measures, together with the relevant GAAP measures, provides a better understanding of our results of operations and the underlying profitability drivers of our business. The majority of these non-GAAP measures are intended to remove the effect of market volatility from our results of operations (other than with respect to alternative investments) as well as integration, restructuring and certain other expenses which are not part of our underlying profitability drivers or likely to re-occur in the foreseeable future, as such items fluctuate from period-to-period in a manner inconsistent with these drivers. These measures should be considered supplementary to our results in accordance with GAAP and should not be viewed as a substitute for the GAAP measures. See “—Non-GAAP Measure Reconciliations” for the appropriate reconciliations to the GAAP measures.
Operating Income, Net of Tax
Operating income, net of tax, a commonly used operating measure in the life insurance industry, is a non-GAAP measure used to evaluate our financial performance excluding market volatility and expenses related to integration, restructuring, stock compensation, and other expenses. Our operating income, net of tax, equals net income available to AHL’s shareholders adjusted to eliminate the impact of the following (collectively, the “non-operating adjustments”):
| • | Investment Gains (Losses), Net of Offsets - Investment gains (losses), net of offsets, consist of the realized gains and losses on the sale of AFS securities, the change in assumed modified coinsurance and funds withheld reinsurance embedded derivatives, unrealized gains and losses, impairments, and other investment gains and losses. Unrealized, impairments and other investment gains and losses are comprised of the fair value adjustments of trading securities (other than CLOs) and investments held under the fair value option, derivative gains and losses not hedging FIA index credits, and the net OTTI |
90
Table of Contents
| impacts recognized in operations net of the change in AmerUs Closed Block fair value reserve related to the corresponding change in fair value of investments and the change in unit linked reserves related to the corresponding trading securities. Investment gains and losses are net of offsets related to DAC, DSI, and VOBA amortization and changes to guaranteed living withdrawal benefits (“GLWB”) and guaranteed minimum death benefits (“GMDB”) reserves as well as the MVAs associated with surrenders or terminations of contracts. |
| • | Change in Fair Values of Derivatives and Embedded Derivatives - FIAs, Net of Offsets - Impacts related to the fair value accounting for derivatives hedging the FIA index credits and the related embedded derivative liability fluctuate from period-to-period. The index reserve is measured at fair value for the current period and all periods beyond the current policyholder index term. However, the FIA hedging derivatives are purchased to hedge only the current index period. Upon policyholder renewal at the end of the period, new FIA hedging derivatives are purchased to align with the new term. The difference in duration between the FIA hedging derivatives and the index credit reserves creates a timing difference in earnings. This timing difference of the FIA hedging derivatives and index credit reserves is included as a non-operating adjustment, net of offsets related to DAC, DSI, and VOBA amortization and changes to GLWB and GMDB reserves. |
We primarily hedge with options that align with the index terms of our FIA products (typically 1-2 years). From an economic basis, we believe this is suitable because policyholder accounts are credited with index performance at the end of each index term. However, because the “value of an embedded derivative” in an FIA contract is longer-dated, there is a duration mismatch which may lead to mismatches for accounting purposes.
| • | Integration, Restructuring, and Other Non-operating Expenses - Integration, restructuring, and other non-operating expenses consist of restructuring and integration expenses related to mergers and acquisitions as well as certain other expenses which are not part of our core operations or likely to re-occur in the foreseeable future. |
| • | Stock Compensation Expense - To date, stock compensation expenses associated with our share incentive plans, excluding our long-term incentive plan, are not part of our core operating expenses and fluctuate from time to time due to the structure of our plans. |
| • | Bargain Purchase Gain - Bargain purchase gains associated with acquisitions are adjustments to net income as they are not consistent with our core operations. |
| • | Provision for Income Taxes - Non-operating - The non-operating income tax expense is comprised of the appropriate jurisdiction’s tax rate applied to the non-operating adjustments that are subject to income tax. |
We consider these non-operating adjustments to be meaningful adjustments to net income available to AHL’s shareholders for the reasons discussed in greater detail above. Accordingly, we believe using a measure which excludes the impact of these items is effective in analyzing the trends in our results of operations. Together with net income available to AHL’s shareholders, we believe operating income, net of tax, provides a meaningful financial metric that helps investors understand our underlying results and profitability. Operating income, net of tax, should not be used as a substitute for net income available to AHL’s shareholders.
ROE Excluding AOCI, Operating ROE Excluding AOCI and Book Value Per Share Excluding AOCI
ROE excluding AOCI, operating ROE excluding AOCI and book value per share excluding AOCI are non-GAAP measures used to evaluate our financial performance excluding the impacts of AOCI. AOCI fluctuates period-to-period in a manner inconsistent with our underlying profitability drivers as the majority of such fluctuation is related to the market volatility of the unrealized gains and losses associated with our AFS securities. Once we have reinvested acquired blocks of businesses, we typically buy and hold AFS investments to maturity throughout the duration of market fluctuations, therefore, the period-over-period impacts in unrealized gains and losses are not necessarily indicative of current operating fundamentals or future performance.
91
Table of Contents
Accordingly, we believe using measures which exclude AOCI is more effective in analyzing the trends of our operations. To enhance the ability to analyze these measures across periods, interim periods are annualized. ROE excluding AOCI, operating ROE excluding AOCI and book value per share excluding AOCI should not be used as a substitute for ROE or book value per share. However, we believe the adjustments to equity are significant to gaining an understanding of our overall results of operations.
Retirement Services Net Investment Earned Rate, Cost of Crediting and Investment Margin on Deferred Annuities
Investment margin is a key measurement of the financial health of our Retirement Services core deferred annuities. Investment margin on our deferred annuities is generated from the excess of our net investment earned rate over the cost of crediting to our policyholders. Net investment earned rate is a key measure of investment returns and cost of crediting is a key measure of the policyholder benefits on our deferred annuities.
Net investment earned rate is a non-GAAP measure we use to evaluate the performance of our invested assets that does not correspond to GAAP net investment income. Net investment earned rate is computed as the income from our invested assets divided by the average invested assets for the relevant period. To enhance the ability to analyze these measures across periods, interim periods are annualized. The adjustments to arrive at our net investment earned rate add alternative investment gains and losses, gains and losses related to trading securities for CLOs, net variable interest entity (“VIE”) impacts (revenues, expenses and noncontrolling interest) and the change in reinsurance embedded derivatives. We include the income and assets supporting our assumed reinsurance by evaluating the underlying investments of the funds withheld at interest receivables and we include the net investment income from those underlying investments which does not correspond to the GAAP presentation of reinsurance embedded derivatives. We exclude the income and assets supporting business that we have exited through ceded reinsurance including funds withheld agreements. We believe the adjustments for reinsurance provide a net investment earned rate on the assets for which we have economic exposure.
Cost of crediting is the interest credited to the policyholders on our fixed strategies as well as the option costs on the index annuity strategies. With respect to FIAs, the cost of providing index credits includes the expenses incurred to fund the annual index credits, and where applicable, minimum guaranteed interest credited. The interest credited on fixed strategies and option costs on index annuity strategies are divided by the average account value of our deferred annuities. Under GAAP, deposits and withdrawals for fixed indexed and fixed rate annuities are reported as deposit liabilities (or policyholder funds). Our average account values are averaged over the number of quarters in the relevant period to obtain our cost of crediting for such period. To enhance the ability to analyze these measures across periods, interim periods are annualized.
Net investment earned rate, cost of crediting and investment margin on deferred annuities are non-GAAP measures we use to evaluate the profitability of our core deferred annuities business. Deferred annuities include our fixed rate annuities and FIAs, which account for approximately 79.1% of our Retirement Services reserve liabilities as of September 30, 2016. We believe measures like net investment earned rate, cost of crediting and investment margin on deferred annuities are effective in analyzing the trends of our core business operations, profitability and pricing discipline. While we believe net investment earned rate, cost of crediting and investment margin on deferred annuities are meaningful financial metrics and enhance our understanding of the underlying profitability drivers of our business, they should not be used as a substitute for net investment income and interest sensitive contract benefits presented under GAAP.
Invested Assets
In managing our business we analyze invested assets, which do not correspond to total investments, including investments in related parties, as disclosed in our consolidated financial statements and notes thereto. Invested assets represent the investments that directly back our policyholder liabilities as well as surplus assets. Invested assets is used in the computation of net investment earned rate, which allows us to analyze the
92
Table of Contents
profitability of our investment portfolio. Invested assets includes (a) total investments on the consolidated balance sheet with AFS securities at cost or amortized cost, excluding derivatives, (b) cash and cash equivalents and restricted cash, (c) investments in related parties, (d) accrued investment income, (e) the consolidated VIE assets, liabilities and noncontrolling interest and (f) policy loans ceded (which offset the direct policy loans in total investments). Invested assets also excludes assets associated with funds withheld liabilities related to business exited through reinsurance agreements and derivative collateral (offsetting the related cash positions). We include the underlying investments supporting our assumed funds withheld and modified coinsurance agreements in our invested assets calculation in order to match the assets with the income received. We believe the adjustments for reinsurance provide a view of the assets for which we have economic exposure. Our invested assets are averaged over the number of quarters in the relevant period to compute our net investment earned rate for such period.
Reserve Liabilities
In managing our business we also analyze reserve liabilities, which does not correspond to total liabilities as disclosed in our consolidated financial statements and notes thereto. Reserve liabilities represents our policyholder liability obligations net of reinsurance. Reserve liabilities is used to analyze the costs of our liabilities. Reserve liabilities includes (a) the interest sensitive contract liabilities, (b) future policy benefits, (c) dividends payable to policyholders, and (d) other policy claims and benefits, offset by reinsurance recoverables, excluding policy loans ceded. Reserve liabilities is net of the ceded liabilities to third-party reinsurers as the costs of the liabilities are passed to such reinsurers and therefore we have no net economic exposure to such liabilities, assuming our reinsurance counterparties perform under our agreements. The majority of our ceded reinsurance is a result of reinsuring large blocks of life business following acquisitions. For such transactions, GAAP requires the ceded liabilities and related reinsurance recoverables to continue to be recorded in our consolidated financial statements despite the transfer of economic risk to the counterparty in connection with the reinsurance transaction.
Sales
Sales statistics do not correspond to revenues under GAAP, but are used as relevant measures of understanding our business performance. Our sales statistics include fixed rate annuities and FIAs and align with the LIMRA definition of all money paid into an individual annuity, including money paid into new contracts with initial purchase occurring in the specified period and existing contracts with initial purchase occurring prior to the specified period (excluding internal transfers).
93
Table of Contents
Consolidated Results of Operations
The following summarizes the consolidated results of operations for the periods indicated (dollars in millions):
| Nine months ended September 30, |
Years ended December 31, | |||||||||||||||||||
| 2016 | 2015 | 2015 | 2014 | 2013 | ||||||||||||||||
| Revenues |
$ | 3,045 | $ | 1,571 | $ | 2,616 | $ | 4,100 | $ | 1,749 | ||||||||||
| Benefits and expenses |
2,678 | 1,199 | 2,024 | 3,568 | 760 | |||||||||||||||
|
|
|
|
|
|
|
|
|
|
|
|||||||||||
| Income before income taxes |
367 | 372 | 592 | 532 | 989 | |||||||||||||||
| Income tax expense (benefit) |
(70) | 36 | 14 | 54 | (8) | |||||||||||||||
|
|
|
|
|
|
|
|
|
|
|
|||||||||||
| Net income |
437 | 336 | 578 | 478 | 997 | |||||||||||||||
| Less: Net income attributable to noncontrolling interests |
— | 16 | 16 | 15 | 81 | |||||||||||||||
|
|
|
|
|
|
|
|
|
|
|
|||||||||||
| Net income available to AHL shareholders |
$ | 437 | $ | 320 | $ | 562 | $ | 463 | $ | 916 | ||||||||||
|
|
|
|
|
|
|
|
|
|
|
|||||||||||
| Operating income, net of tax by segment |
||||||||||||||||||||
| Retirement Services |
$ | 563 | $ | 513 | $ | 769 | $ | 764 | $ | 416 | ||||||||||
| Corporate and Other |
(87) | (17) | (29) | 29 | 361 | |||||||||||||||
|
|
|
|
|
|
|
|
|
|
|
|||||||||||
| Operating income, net of tax |
476 | 496 | 740 | 793 | 777 | |||||||||||||||
|
|
|
|
|
|
|
|
|
|
|
|||||||||||
| Non-operating adjustments |
||||||||||||||||||||
| Realized gains (losses) on sale of AFS securities |
37 | 69 | 83 | 199 | 93 | |||||||||||||||
| Unrealized, impairments, and other investment gains (losses) |
(37) | (23) | (30) | 1 | (63) | |||||||||||||||
| Assumed modco and funds withheld reinsurance embedded derivatives |
144 | (36) | (75) | (1) | (2) | |||||||||||||||
| Offsets to investment gains (losses) |
(47) | (30) | (34) | (48) | (32) | |||||||||||||||
|
|
|
|
|
|
|
|
|
|
|
|||||||||||
| Investment gains (losses), net of offsets |
97 | (20) | (56) | 151 | (4) | |||||||||||||||
| Change in fair values of derivatives and embedded derivatives—FIAs, net of offsets |
(82) | (92) | (27) | (30) | 154 | |||||||||||||||
| Integration, restructuring and other non-operating expenses |
(8) | (31) | (58) | (279) | (184) | |||||||||||||||
| Stock compensation expense |
(59) | (51) | (67) | (148) | — | |||||||||||||||
| Bargain purchase gain |
— | — | — | — | 152 | |||||||||||||||
| Provision for income taxes—non-operating |
13 | 18 | 30 | (24) | 21 | |||||||||||||||
|
|
|
|
|
|
|
|
|
|
|
|||||||||||
| Total non-operating adjustments |
(39) | (176) | (178) | (330) | 139 | |||||||||||||||
|
|
|
|
|
|
|
|
|
|
|
|||||||||||
| Net income available to AHL shareholders |
$ | 437 | $ | 320 | $ | 562 | $ | 463 | $ | 916 | ||||||||||
|
|
|
|
|
|
|
|
|
|
|
|||||||||||
| ROE |
9.4% | 8.5% | 11.3% | 12.7% | 39.6% | |||||||||||||||
| ROE excluding AOCI |
9.9% | 9.2% | 11.8% | 14.0% | 42.2% | |||||||||||||||
| Operating ROE excluding AOCI |
10.8% | 14.3% | 15.6% | 24.0% | 35.8% | |||||||||||||||
We operate our core business strategies out of one reportable segment, Retirement Services. In addition to Retirement Services, we report certain other operations in Corporate and Other. See “—Results of Operations by Segment” for further detail on the results of the segments.
Nine Months Ended September 30, 2016 Compared to the Nine Months Ended September 30, 2015
Net Income Available to AHL Shareholders
Net income available to AHL shareholders increased by $117 million, or 37%, to $437 million for the nine months ended September 30, 2016 from $320 million in the prior period. ROE and ROE excluding AOCI increased to 9.4% and 9.9%, respectively, from 8.5% and 9.2% in the prior period, respectively, benefiting from
94
Table of Contents
the increase in net income. ROE and ROE excluding AOCI were each adversely impacted by our drawing of the remaining $1.1 billion of capital raise proceeds in April 2015, catalyzing a ratings upgrade and providing us with significant excess capital to reinvest into market opportunities, offset by the increase in net income available to AHL shareholders. The increase in net income available to AHL shareholders was driven by an increase in investment related gains and losses, net investment income and a release of a deferred tax valuation allowance. The change in investment related gains and losses was primarily driven by the change in assumed reinsurance embedded derivatives. The increase in net investment income was primarily driven by higher bond call and mortgage prepayment income, growth in our investment portfolio and the reinvestment of the Aviva USA acquired investments into higher yielding investments throughout 2015.
These increases were partially offset by an unfavorable change in the GLWB and GMDB reserves, an increase in DAC, DSI and VOBA amortization, the change in VIE investment related gains and losses and higher expenses. The unfavorable change in the GLWB and GMDB reserves and an increase in DAC, DSI and VOBA amortization were driven by the unfavorable change in unlocking of assumptions of our GLWB and GMDB reserves and our DAC, DSI and VOBA assets as well as growth in the FIA block increasing our DAC asset. The VIE investment related gains and losses decrease was attributed to the decline in market value of public equity positions in one of our funds. Expenses were higher primarily attributed to growing our business and expanding our distribution channels.
Operating Income, Net of Tax
Operating income, net of tax decreased by $20 million, or 4%, to $476 million for the nine months ended September 30, 2016 from $496 million in the prior period. Operating ROE excluding AOCI was 10.8%, down from 14.3% in the prior period, as we drew the remaining $1.1 billion of capital raise proceeds in April 2015, catalyzing a ratings upgrade and providing us with significant excess capital to reinvest into market opportunities. The decrease in operating income, net of tax was primarily driven by an unfavorable change of $182 million attributed to our annual unlocking of assumptions in our GLWB and GMDB reserves and our DAC, DSI and VOBA assets, combining for an expense of $158 million in the third quarter of 2016 compared to a benefit of $24 million in the prior period. In the third quarter of 2016, we recognized a tax benefit of $102 million related to the release of a deferred tax valuation allowance.
The remaining increase in operating income, net of tax after unlocking impacts and the deferred tax valuation release was primarily driven by an increase in fixed income and other investment income due to higher bond call and mortgage prepayment income, growth in our Retirement Services invested assets of $5.2 billion over prior period reflecting strong deposit growth, income from capital raise proceeds received in April 2015, and the reinvestment of the Aviva USA acquired investments. Lower alternative investment income performance attributed to a decline in market value of public equity positions in one of our funds, higher cost of crediting due to higher option costs and a change in the mix of business related to MYGA growth, an increase in DAC and VOBA amortization related to growth in our FIA block of business and higher operating expenses attributed to growing our business and expanding our distribution channels partially offset this increase in fixed income and other investment income.
Our consolidated net investment earned rate was 4.23% for the nine months ended September 30, 2016, a slight decline from 4.25% in the prior period, primarily attributed to a decrease of approximately 6 basis points related to lower alternative investment performance as well as a decrease of approximately 24 basis points related to the acquisition of DLD which contributed lower net investment earned rates reflecting the different economic environment and the yield adjustments related to purchase accounting. The decrease from alternative investments and the acquisition of DLD was partially offset by an increase in the fixed income and other investment portfolios due to higher bond call and mortgage prepayment income and the reinvestment of the Aviva USA acquired investments into higher yielding investments. Our alternative investment net investment earned rate was 5.58% for the nine months ended September 30, 2016, down from 6.80% in the prior period, attributed to a decline in market value of public equity positions in one of our funds partially offset by the tightening of credit
95
Table of Contents
spreads increasing income from our credit funds. We underwrite alternative investments over their expected lives, and as such, believe it is appropriate to evaluate their performance over the multi-year periods rather than on an annual basis. The average alternative investment net investment earned rate over the period of December 31, 2013 through the nine months ended September 30, 2016 was 12.13%, which benefited from strong alternative investment income in 2013 related to the initial public offerings of two underlying investments.
Revenues
Total revenue increased by $1.4 billion to $3.0 billion for the nine months ended September 30, 2016 from $1.6 billion in the prior period. The increase was driven by favorable changes in investment related gains and losses, an increase in net investment income and an increase in premiums. These increases were partially offset by the unfavorable change in VIE investment related gains and losses.
The change in investment related gains and losses increased by $1.1 billion to $523 million for the nine months ended September 30, 2016 from $(609) million in the prior period, primarily due to the change in fair value of FIA hedging derivatives, the change in assumed reinsurance embedded derivatives and the change in unrealized gains and losses on trading securities. The change in fair value of FIA hedging derivatives increased by $703 million driven by the performance of the indices upon which our call options are based. The majority of our call options are based on the S&P 500 index which experienced a 6.1% increase for the nine months ended September 30, 2016, compared to an 6.7% decrease in the prior period. The assumed reinsurance embedded derivatives are based on the change in the fair value of the underlying investments held in modified coinsurance and funds withheld portfolios (see “Note 3 – Derivative Instruments” to our unaudited consolidated financial statements and notes thereto) which increased by $262 million as a result of $188 million of net unrealized gains during the nine months ended September 30, 2016 primarily due to decreases in the U.S. treasury rates and credit spread tightening on corporate securities and RMBS compared to losses in the prior period with the remaining change attributable to growth in the flow reinsurance channel. The favorable change in unrealized gains and losses on trading securities was primarily attributed to an increase in AmerUs Closed Block assets of $201 million primarily driven by decreases in the U.S. treasury rates as well as credit spread tightening on corporate securities.
Net investment income increased by $313 million to $2.1 billion for the nine months ended September 30, 2016 from $1.8 billion in the prior period, which was primarily driven by higher bond call and mortgage prepayment income of $68 million in 2016 compared to prior year, growth in our investment portfolio due to strong deposit growth and the reinvestment of the Aviva USA acquired investments into higher yielding strategies. Also contributing to the increase in net investment income was the acquisition of DLD in October 2015 contributing $74 million of net investment income for the nine months ended September 30, 2016.
Premiums increased by $106 million to $205 million for the nine months ended September 30, 2016 from $99 million in the prior period, primarily due to the acquisition of DLD contributing $136 million of premiums in the nine months ended September 30, 2016. The increase was partially offset by a decrease in other life premiums.
The change in VIE investment related gains and losses decreased by $103 million to $(70) million for the nine months ended September 30, 2016 from $33 million in the prior period, primarily driven by a decline in market value of public equity positions in one of our funds, as the share prices of these public equity positions decreased in 2016 compared to the prior period.
Benefits and Expenses
Total benefits and expenses increased by $1.5 billion to $2.7 billion for the nine months ended September 30, 2016 from $1.2 billion in the prior period. The increase was driven by an unfavorable change in interest sensitive contract benefits, an unfavorable increase in future policy and other policy benefits and higher policy and other operating expenses.
96
Table of Contents
Interest sensitive contract benefits increased by $795 million to $1.1 billion for the nine months ended September 30, 2016 from $273 million in the prior period, primarily due to the change in FIA fair value embedded derivatives and higher interest credited to policyholders related to strong deposit growth. The change in FIA fair value embedded derivatives increased by $753 million primarily driven by the performance of the equity indices to which our FIA policies are linked, primarily the S&P 500 index, which experienced a 6.1% increase for the nine months ended September 30, 2016, compared to a 6.7% decrease in the prior period. Also contributing to the increase was a decrease in the discount rates used in our embedded derivative calculations which increased the FIA embedded derivatives compared to an increase in the prior period partially offset by a decrease in the credit spread, included in the discount rate determination, following our rating upgrades to A- in the second quarter of 2015.
Future policy and other policy benefits increased by $523 million to $862 million for the nine months ended September 30, 2016 from $339 million in the prior period, primarily attributable to an increase in the change in AmerUs Closed Block fair value liability, an unfavorable change in the GLWB and GMDB reserves and the acquisition of DLD, which increased our benefits by $191 million for the nine months ended September 30, 2016. The increase in the change in AmerUs Closed Block fair value liability of $214 million was primarily attributed to the increase in unrealized gains on the underlying investments driven by decreases in the U.S. treasury rates. We have elected the fair value option to value the AmerUs Closed Block whereby the fair value of liabilities is the sum of the fair value of the assets plus our cost of capital in the AmerUs Closed Block. The unfavorable change in GLWB and GMDB reserves of $182 million was driven by the unfavorable change of $181 million attributed to our annual unlocking of assumptions. The unlocking impact in the third quarter of 2016 of $133 million related to a decrease in projected net investment earned rates and lower projected lapse rate assumptions while the 2015 unlocking impacts were favorable by $48 million.
Policy and other operating expenses increased by $73 million to $441 million for the nine months ended September 30, 2016 from $368 million in the prior period, primarily attributed to growing our business, expanding our distribution channels, project spend and expenses attributable to our Germany operations. These increases were partially offset by lower integration expenses related to the acquisition of DLD in the prior period.
DAC, DSI and VOBA amortization increased by $65 million to $223 million for the nine months ended September 30, 2016 from $158 million in the prior period, primarily attributable to growth in the FIA block increasing our DAC asset and the $3 million unfavorable change in unlocking of assumptions of our DAC, DSI and VOBA assets. The unlocking impact in the third quarter of 2016 of $38 million primarily related to a decrease in projected net investment earned rates partially offset by lower projected lapse rate assumptions while the 2015 unlocking impacts were unfavorable by $35 million.
Taxes
Income tax expense (benefit) decreased by $106 million to $(70) million for the nine months ended September 30, 2016 from $36 million in the prior period. The decrease was primarily driven by a release of a deferred tax valuation allowance of $102 million and a favorable change in other provision adjustments compared to 2015. The decrease in income tax expense was partially offset by a slight increase in income subject to U.S. income tax. During the third quarter of 2016, we identified a tax plan that, when implemented, will allow us to use a significant portion of the U.S. non-life insurance companies’ net operating losses, which are scheduled to expire beginning in 2022, and other deductible temporary differences. As a result, we released $102 million of deferred tax valuation allowance, as it is more likely than not that these attributes will be realized.
Our effective tax rates were (19)% for the nine months ended September 30, 2016 and 10% in the prior period. Our effective tax rates may vary year-to-year depending upon the relationship of income and loss subject to tax compared to consolidated income and loss before income taxes.
97
Table of Contents
Year Ended December 31, 2015 Compared to December 31, 2014
In this section, references to 2015 refer to the year ended December 31, 2015, and references to 2014 refer to the year ended December 31, 2014.
Net Income Available to AHL Shareholders
Net income available to AHL shareholders increased by $99 million, or 21%, to $562 million in 2015 from $463 million in 2014. ROE and ROE excluding AOCI declined to 11.3% and 11.8%, respectively, from 12.7% and 14.0% in 2014, respectively, as we drew the remaining $1.1 billion of capital raise proceeds in April 2015, catalyzing a ratings upgrade and providing us with significant excess capital to reinvest into market opportunities. The increase in net income available to AHL shareholders was driven by the reduction of expenses as a result of the termination of the Transaction Advisory Services Agreement (“TASA”) with Apollo at the end of 2014, strong fixed investment income performance, lower stock compensation expense and lower income tax expense. Net investment income increased by $175 million driven primarily by the reinvestment of Aviva USA acquired investments into higher yielding investments, which continued to increase our net investment earned rates on our fixed income and other investment portfolio (as further discussed in “—Retirement Services—Year Ended December 31, 2015 Compared to December 31, 2014—Investment Margin on Deferred Annuities”) as well as the income from capital raise proceeds. Stock compensation expense decreased by $81 million primarily due to a $131 million expense in 2014 triggered by amendments to the stock plan and assumption changes which was partially offset by an increase in the valuation of our common share price in 2015.
These increases were partially offset by lower investment gains and losses as well as an increase in the amortization of DAC, DSI and VOBA. Investment gains and losses decreased from elevated levels in 2014, which were primarily due to recognizing gains on investments acquired in the Aviva USA transaction as we reinvested such acquired investments to align with our investment strategy which benefited from a favorable market in 2014. Also contributing to the decline in investment gains and losses was an unfavorable change in assumed reinsurance embedded derivatives driven by market movements in 2015. Amortization of DAC, DSI and VOBA increased primarily due to the unfavorable change in unlocking of assumptions and the growth in the FIA block.
Operating Income, Net of Tax
Operating income, net of tax decreased by $53 million, or 7%, to $740 million in 2015 from $793 million in 2014. Operating ROE excluding AOCI declined to 15.6% from 24.0% in 2014, as we drew the remaining $1.1 billion of capital raise proceeds in April 2015, catalyzing a ratings upgrade and providing us with significant excess capital to reinvest into market opportunities. The decrease in operating income, net of tax was primarily driven by the increase in amortization of DAC, DSI, and VOBA due to the unfavorable unlocking of assumptions and growth in the FIA block. The decreases were partially offset by the favorable increase in net investment income resulting from the reinvestment of Aviva USA acquired investments and income from capital raise proceeds.
Our consolidated net investment earned rate was 4.24% in 2015, down slightly from 4.29% in 2014, attributed to lower alternative investment performance partially offset by an increase in the fixed income and other investment portfolios due to reinvestment of Aviva USA’s acquired investments and income from capital raise proceeds. Our alternative investment net investment earned rate was 6.16% in 2015, down from 8.78% in 2014, attributed to market value volatility in public equity positions in one of our funds as well as the widening of credit spreads in 2015. We underwrite alternative investments over the long term, and as such, believe it is appropriate to evaluate their performance over the long term rather than on an annual basis. The average of our alternative investment net investment earned rate over the three year period ending December 31, 2015 was 14.32%, which benefited from strong alternative investment income in 2013 related to the initial public offerings of two underlying investments.
98
Table of Contents
Revenues
Total revenue decreased by $1.5 billion to $2.6 billion in 2015 from $4.1 billion in 2014. The decrease was driven by lower investment related gains and losses as well as a decrease in VIE net investment income. These decreases were partially offset by the favorable increase in net investment income as well as an increase in premiums.
The change in investment related gains and losses decreased by $1.6 billion from elevated levels in 2014, to $(430) million in 2015 from $1.2 billion in 2014, which were primarily due to recognizing gains on investments acquired in the Aviva USA transaction as we reinvested such acquired investments to align with our investment strategy. The change in fair value of FIA hedging derivatives decreased by $1.1 billion driven by the performance of the indices upon which our call options are based. The majority of our call options are based on the S&P 500 index which experienced a 0.7% decrease in 2015, compared to an 11.4% increase in 2014. Unrealized gains and losses on trading securities related to our AmerUs Closed Block investments decreased by $234 million primarily driven by the widening of credit spreads and an increase in U.S. treasury rates during 2015. The assumed reinsurance embedded derivatives are based on the change in the fair value of the underlying investments held in modified coinsurance and funds withheld portfolios (see “Note 5 – Derivative Instruments” to our audited consolidated financial statements and notes thereto) which decreased by $124 million as a result of net unrealized losses during 2015 primarily due to credit spreads widening and the increase in U.S. treasury rates during 2015. FIA option cost amortization increased by $72 million driven by the higher cost of options acquired to hedge our FIA index credits as well as growth in our FIA block of business. The remaining decrease in investment related gains and losses was primarily due to the reinvestment of the investments acquired in the Aviva USA acquisition producing gains in 2014 when the market was favorable.
VIE net investment income decreased by $107 million to $67 million in 2015 from $174 million in 2014, which is primarily attributable to the deconsolidation of MidCap Financial Holdings, LLC (“MidCap Financial”) at the beginning of 2015. At that time, we contributed our ownership interest in MidCap Financial to MidCap, and with significant ownership by other investors in MidCap, the activities of MidCap are not considered to be conducted substantially on our behalf.
Net investment income increased by $175 million to $2.5 billion in 2015 from $2.3 billion in 2014, which was primarily driven by the reinvestment of Aviva USA acquired investments into higher yielding strategies and the income contribution from the capital raise proceeds of $1.1 billion in April 2015. Also contributing to the increase in net investment income was the acquisition of DLD in October 2015 contributing $23 million of investment income in the fourth quarter.
Premiums increased by $95 million to $195 million in 2015 from $100 million in 2014, primarily due to the acquisition of DLD contributing $74 million of premiums. The remaining increase was driven by the increase in annuitizations with life contingencies in our Retirement Services segment.
Benefits and Expenses
Total benefits and expenses decreased by $1.6 billion to $2.0 billion in 2015 from $3.6 billion in 2014. The decrease was driven by the change in FIA embedded derivatives, $226 million related to the reduction of expenses as a result of the termination of the TASA with Apollo at the end of 2014, a favorable decrease in future policy benefits and the decrease in consolidated VIE expenses due to the deconsolidation of MidCap Financial. These decreases were partially offset by an increase in DAC, DSI and VOBA amortization.
The change in FIA fair value embedded derivatives, included in our interest sensitive contract benefits, decreased by $1.1 billion compared to 2014 primarily due to the performance of the equity indices to which our FIA policies are linked, primarily the S&P 500 index, which experienced a 0.7% decrease in 2015, compared to a 11.4% increase in 2014. Also contributing to the change was an increase in discount rates used in our embedded derivative calculations compared to 2014, resulting in an overall favorable impact. This was partially offset by unfavorable impacts to our embedded derivatives due to a decrease in the credit spread, included in the discount rate determination, following our rating agency upgrades to an A- rating.
99
Table of Contents
Future policy benefits decreased by $179 million to $517 million in 2015 from $696 million in 2014, primarily attributable to the $236 million decrease in the change in AmerUs Closed Block fair value liability, which was related to unrealized losses on the underlying investments attributable to the decrease in U.S. treasury rates. Additionally, gains recognized from favorable mortality experience contributed to the decrease in future policy benefits which were partially offset by an increase in benefits from the DLD acquisition. The GLWB and GMDB change in reserves was consistent with 2014 as the increase from equity market performance and higher than expected persistency was offset by favorable unlocking of lapse rate assumptions and the decrease related to changes in FIA embedded derivatives and investment related gains and losses.
Amortization of DAC, DSI and VOBA increased by $100 million to $223 million in 2015 from $123 million in 2014, due to the unfavorable change in unlocking of assumptions of $71 million, the growth in DAC and DSI asset balance from growth in the FIA block, and a slight increase in gross profits during 2015. The unlocking impacts in 2015 increased amortization by $35 million primarily related to a decrease in net investment earned rate projections, while the 2014 impacts decreased amortization by $36 million.
Taxes
Income tax expense decreased by $40 million to $14 million in 2015 from $54 million in 2014. The decrease was mainly attributed to lower investment and derivative income, which decreased U.S. income subject to U.S. income tax by $187 million, or approximately $65 million of tax based on a 35% U.S. statutory rate. This was partially offset by an increase of $3 million of expense related to our German operations as a result of the DLD acquisition. The decrease in income subject to tax was also partially offset by unfavorable provision adjustments of $23 million in 2015 when compared to 2014 related to the change in valuation allowance of $16 million, prior year true-ups of $14 million and other adjustments of $(7) million. The change in valuation allowance was primarily driven by favorable life capital loss carryforwards of $15 million in 2014 as well as the reduction in the allowance against non-life deferred tax assets of $1 million in 2014.
Our effective tax rates were 2% in 2015 and 10% in 2014. Our effective tax rates may vary year-to-year depending upon the relationship of income and loss subject to tax compared to consolidated income and loss before income taxes. The decrease in the effective tax rate was mainly attributed to the decrease in income subject to U.S. income tax, partially offset by the unfavorable provision adjustments noted above.
Year Ended December 31, 2014 Compared to December 31, 2013
In this section, references to 2014 refer to the year ended December 31, 2014 and references to 2013 refer to the year ended December 31, 2013.
Net Income Available to AHL Shareholders
Net income available to AHL shareholders decreased by $453 million, or 49%, to $463 million in 2014 from $916 million in 2013. ROE and ROE excluding AOCI declined to 12.7% and 14.0%, respectively, from 39.6% and 42.2% in 2013, reflecting the decrease in net income available to AHL shareholders. The decrease in net income available to AHL shareholders was driven by an increase in stock compensation and TASA expenses, an unfavorable net change in FIA derivatives, the recognition of a bargain purchase gain of $152 million during 2013 related to the Aviva USA acquisition and the increase in policyholder liability benefits. Stock compensation expense increased $148 million due to $131 million of expenses triggered by amendments to the stock plan and assumption changes. The TASA expenses increased $95 million due to the increase in the value of AHL following the Aviva USA acquisition in October 2013. The net change in FIA derivatives was unfavorable by $184 million primarily due to the additional volume of FIA policies in 2014, the performance of the equity indices to which our FIA policies are linked and the decrease in discount rates used in our embedded derivative calculations. Policyholder liability benefits increased primarily due to the full year increase in benefits related to the Aviva USA acquired business.
100
Table of Contents
These decreases were partially offset by an increase in net investment income and favorable investment gains and losses. The increase in net investment income was driven by the growth in invested assets of approximately $45 billion related to the Aviva USA acquisition contributing a full year of investment income partially offset by 2013 benefiting from strong alternative investment performance. The increase in investment related gains and losses was driven by recognizing gains on investments acquired in the Aviva USA transaction as we reinvested such acquired investments to align with our investment strategy.
Operating Income, Net of Tax
Operating income, net of tax increased by $16 million, or 2%, to $793 million in 2014 from $777 million in 2013. Operating ROE excluding AOCI declined to 24.0% from 35.8% in 2013, reflecting the strong performance of alternative investments in 2013 as a percentage of lower average equity as the Aviva USA acquisition only impacted the fourth quarter of 2013. The increase in operating income, net of tax was driven by the asset and liability growth from the Aviva USA acquisition which contributed an increase of $417 million of operating income net of tax compared to one quarter’s contribution in 2013. The acquired business increased revenues including net investment income, product charges, and premiums while also increasing benefits and expenses as well as changes to policyholder liabilities. The favorable increase from the acquired assets and liabilities was partially offset by the strong performance of alternative investments during 2013, which reflected the initial public offerings of two underlying investments.
Our consolidated net investment earned rate was 4.29% down from 6.66% in 2013, reflecting the strong performance of alternative investments in 2013. Our alternative investment net investment earned rate was 8.78% in 2014, down from 28.01% in 2013, reflecting the strong performance of our alternative investments during 2013.
Revenues
Total revenue increased by $2.4 billion to $4.1 billion in 2014 from $1.7 billion in 2013. The increase was driven by the asset and liability growth from the Aviva USA acquisition as well as the initial ceded life premiums of approximately $1.2 billion related to the cession of the former Aviva USA life insurance business (primarily traditional whole life and term business) to an affiliate of Global Atlantic in October 2013 driving premiums in 2013 to be negative. These increases were partially offset by the decrease in investment gains related to VIEs and the decrease related to the bargain purchase gain in 2013 attributed to the acquisition of Aviva USA in October 2013.
Premiums increased by $1.2 billion, to $100 million in 2014 from $(1.1) billion in 2013, primarily due to the initial ceded life premiums in 2013 and an increase in single premium annuities with life contingencies and retained life business acquired in the Aviva USA acquisition.
Net investment income increased by $1.2 billion, to $2.3 billion in 2014 from $1.1 billion in 2013, primarily attributable to the growth in invested assets of approximately $45 billion from the Aviva USA acquisition in October 2013, resulting in an increase in net investment income of $1.3 billion during 2014 compared to one quarter of investment income in 2013.
Investment related gains increased by $283 million, to $1.2 billion in 2014 from $927 million in 2013, reflecting the favorable economic conditions in 2014 compared to 2013 and the impacts of a full year of Aviva USA acquired investments compared to one quarter in 2013. The change in fair value of FIA hedging derivatives increased by $353 million driven by the Aviva USA acquisition increasing our options and futures hedging FIA products by $1.1 billion. Additionally, the derivatives change was driven by the performance of the indices upon which our call options are based, primarily the S&P 500 index, which increased 11.4% in 2014, compared to an increase of 29.6% during 2013, with an increase of 9.9% during the fourth quarter which drove an increase in the value of the Aviva USA acquired options. Unrealized gains on trading securities related to our AmerUs Closed
101
Table of Contents
Block investments increased by $116 million primarily driven by the decrease in U.S. treasury rates during 2014. The remaining increase in other investment gains was primarily due to the reinvestment of the investments acquired in the Aviva USA acquisition along with favorable decreases in U.S. treasury rates during 2014 producing realized gains and a favorable change of $69 million related to a 2013 interest rate swaption hedging acquired investment portfolios. The reinvestment activity was a result of aligning the acquired investments with our investment strategies. These increases in investment gains were partially offset by an increase in FIA option cost amortization of $312 million driven by the increase in options related to the Aviva USA acquired policies and a full year of costs.
Product charges increased by $146 million, to $218 million in 2014 from $72 million in 2013, primarily attributed to the growth in liabilities related to the Aviva USA acquired business. A full year of the acquired business resulted in an additional $59 million of surrender charge fees and $88 million of GMDB and GLWB charges deducted from policyholder accounts for the respective benefits during 2014 compared to 2013 reflecting one quarter of activity relating to the Aviva USA business.
Investment related gains related to consolidated VIEs decreased by $513 million, to $51 million in 2014 from $564 million in 2013, driven by 2013 benefiting from the strong performance of public equity positions in one of our funds as a result of the initial public offerings of two of the underlying investments. Also, contributing to the decrease were realized losses on investments and unrealized losses on derivatives in the CMBS funds partially offset by realized gains on the liquidation of another one of our VIE funds.
Benefits and Expenses
Total benefits and expenses increased by $2.8 billion to $3.6 billion in 2014 from $760 million in 2013. The increase was primarily driven by the liability growth and increase in expenses from the Aviva USA acquisition as well as the initial ceded life reserves of approximately $1.2 billion related to the cession of the former Aviva USA life insurance business (primarily traditional whole life and term business) to an affiliate of Global Atlantic in October 2013 driving the change in reserves in 2013 to be favorable and the acquisition of Aviva USA in October 2013.
Future policy and other policy benefits increased by $1.6 billion, to $696 million in 2014 from $(950) million in 2013, driven by the initial ceded life reserves, higher benefits to policyholders related to the Aviva USA acquisition and the change in fair value liability related to the AmerUs Closed Block. Future policy claims, benefits and reserves increased by $228 million due to the increase in volume of benefits acquired in the Aviva USA acquisition. The GLWB and GMDB change in reserves increased by $137 million due to the increase in the number of policies with benefits as well as $27 million in unlocking of assumptions primarily related to a decrease in net investment earned rate projections. The AmerUs Closed Block fair value liability increased by $94 million due to unrealized gains on the underlying investments attributed to the decrease in U.S. treasury rates increasing the liability to the policyholders.
Interest sensitive contract benefits increased by $758 million, to $1.8 billion in 2014 from $1.1 billion in 2013, primarily attributed to the growth in average deferred annuity account values of approximately 138%, to $48 billion in 2014 from $20 billion in 2013. The increase in liabilities was driven by the acquisition of Aviva USA, increasing our interest sensitive contract liabilities by $48 billion at the time of acquisition which increased our interest credited to policyholders and the change in FIA fair value embedded derivatives. The change in FIA fair value embedded derivatives increased by $595 million primarily due to this additional volume of FIA policies in 2014 as well as the performance of the equity indices to which our FIA policies are linked, primarily the S&P 500 index, which increased 11.4% during 2014. Also contributing to the change was a decrease in discount rates used in our embedded derivative calculations which resulted in an unfavorable impact.
Policy and other operating expenses increased by $366 million, to $797 million in 2014 from $431 million in 2013, primarily attributed to an increase in stock compensation expense of $148 million, an increase of $95
102
Table of Contents
million due to the increase in TASA expenses related to the value of AHL following the Aviva USA acquisition in October 2013 and such acquisition resulting in a full year increase in policy and other operating expenses of $163 million. The stock compensation expense was primarily driven by $131 million of expense in the second quarter of 2014 as a result of equity plan amendments which triggered the recording of expense that was not required to be recognized under the previous terms of the plans. The amendments resulted in the recognition of expense that included the impacts of increases in the fair value of awards since their initial granting, which in some cases date back to AHL’s inception. Additional stock compensation expense was recognized relating to a change in assumptions related to our 2014 capital raise embedded in our equity expense models. Finally, the granting of discounted shares as compensation to certain employees also contributed to the increase in stock compensation expense. Stock compensation expense and TASA expense are non-operating adjustments as discussed in “—Key Operating and Non-GAAP Measures.”
Taxes
Income tax expense (benefit) increased by $62 million to $54 million in 2014 from $(8) million in 2013. The increase was mainly attributed to the increase in net income subject to U.S. income tax of $312 million, or approximately $109 million of tax based on a 35% U.S. statutory rate. The increase in income subject to tax was partially offset by favorable provision adjustments of $47 million in 2014 when compared to 2013 related to the change in valuation allowance of $30 million and prior year true-ups of $17 million. The change in valuation allowance was primarily driven by favorable life capital loss carryforwards of $15 million in 2014 as well as the reduction in the allowance against non-life deferred tax assets of $7 million in 2014 compared to an $8 million increase in 2013.
The effective tax rates were 10% in 2014 and (1)% in 2013.
Noncontrolling Interest
Noncontrolling interest decreased by $66 million to $15 million in 2014 from $81 million in 2013. Noncontrolling interest primarily represents the carried interest allocated to the general partners in our consolidated investment funds. Carried interest is allocated to the general partners based on realized gains in the funds, along with unrealized positions at the end of each reporting period. The decline in 2014 was due primarily to initial public offerings executed by two investees of one of our funds in 2013 that led to large unrealized gains, which resulted in significant allocated carried interest to the general partner.
Results of Operations by Segment
The following summarizes our operating income, net of tax by segment for the periods indicated (dollars in millions):
| Nine months ended September 30, | Years ended December 31, | |||||||||||||||||||
| 2016 | 2015 | 2015 | 2014 | 2013 | ||||||||||||||||
| Operating income, net of tax by segment |
||||||||||||||||||||
| Retirement Services |
$ | 563 | $ | 513 | $ | 769 | $ | 764 | $ | 416 | ||||||||||
| Corporate and Other |
(87) | (17) | (29) | 29 | 361 | |||||||||||||||
|
|
|
|
|
|
|
|
|
|
|
|||||||||||
| Operating income, net of tax |
$ | 476 | $ | 496 | $ | 740 | $ | 793 | $ | 777 | ||||||||||
|
|
|
|
|
|
|
|
|
|
|
|||||||||||
| Retirement Services operating ROE excluding AOCI |
17.5% | 20.9% | 22.7% | 32.2% | 23.2% | |||||||||||||||
Retirement Services
Retirement Services is comprised of our United States and Bermuda operations which issue and reinsure retirement savings products and institutional products. Retirement Services has retail operations, which provide
103
Table of Contents
annuity retirement solutions to our policyholders. Retirement Services also has reinsurance operations, which reinsure MYGAs, FIAs, traditional one year guarantee fixed deferred annuities, immediate annuities and institutional products from our reinsurance partners. In addition, our FABN program is included in our Retirement Services segment.
Nine Months Ended September 30, 2016 Compared to the Nine Months Ended September 30, 2015
Operating Income, Net of Tax
Operating income, net of tax increased by $50 million, or 10%, to $563 million for the nine months ended September 30, 2016 from $513 million in the prior period. Operating ROE excluding AOCI was 17.5%, down from 20.9% in the prior period, reflecting the increase in equity allocated to Retirement Services as we increased our capital within Retirement Services which management considered necessary to support the segment’s growth and ratings aspirations, partially offset by an increase in operating income, net of tax. The increase in operating income, net of tax was primarily driven by the increase in net investment income related to higher bond call and mortgage prepayment income, growth in the segment’s invested assets and reinvestment of the Aviva USA acquired investments throughout 2015. Additionally, we recognized a tax benefit of $102 million related to the release of a deferred tax valuation allowance. The increases in operating income, net of tax were partially offset by an unfavorable change of $182 million attributed to our annual unlocking of assumptions in our GLWB and GMDB reserves and our DAC, DSI and VOBA assets, an increase in cost of crediting due to an increase in option costs and a change in the mix of business related to MYGA growth, an increase in DAC and VOBA amortization related to growth in our FIA block of business and higher operating expenses of $37 million primarily attributed to growing our business, expanding our distribution channels and project spend.
Net investment income increased $265 million primarily driven by a $224 million increase in fixed income and other investment income attributed to higher bond call and mortgage prepayment income of $68 million in 2016, growth in the segment’s invested assets of $5.2 billion over prior period reflecting strong deposit growth and the favorable reinvestment of the Aviva USA acquired investments into higher yielding strategies. Alternative investment income increased $41 million related to an increase in the value of our credit funds related to credit spread tightening in 2016 and an increase in the value of our equity investment in A-A Mortgage.
GLWB and GMDB change in reserves increased by $184 million driven by the unfavorable change of $178 million attributed to our annual unlocking of assumptions. The unlocking impact in the third quarter of 2016 of $126 million related to a decrease in projected net investment earned rates and lower projected lapse rate assumptions while the 2015 unlocking impacts were favorable by $52 million.
Amortization of DAC, DSI and VOBA increased by $44 million driven by the growth in DAC and DSI asset balance from growth in the FIA block and the unfavorable change of $4 million attributed to our annual unlocking of assumptions. The unlocking impact in the third quarter of 2016 of $32 million related to a decrease in projected net investment earned rates partially offset by lower projected lapse rate assumptions while the 2015 unlocking impacts were unfavorable by $28 million.
Investment Margin on Deferred Annuities
| Nine months ended September 30, | ||||||||
| 2016 | 2015 | |||||||
| Net investment earned rate |
4.65% | 4.31% | ||||||
| Cost of crediting |
1.97% | 1.92% | ||||||
|
|
|
|
|
|||||
| Investment margin on deferred annuities |
2.68% | 2.39% | ||||||
|
|
|
|
|
|||||
Investment margin on deferred annuities increased by 29 basis points to 2.68% for the nine months ended September 30, 2016 from 2.39% in the prior period. The increase in the investment margin on deferred annuities
104
Table of Contents
was driven by the increase in net investment earned rate of 34 basis points, showing strength in our investment portfolio, partially offset by an unfavorable increase in cost of crediting of 5 basis points.
Net investment earned rate increased due to the increase in our fixed income and other investment income as well as an increase in alternative investment income. The fixed income and other net investment earned rate increased throughout the nine months ended September 30, 2016 and 2015 to 4.40% from 4.10% in the prior period primarily driven by higher bond call and mortgage prepayment income and the reinvestment of the Aviva USA acquired investments into higher yielding strategies with a focus on liquidity and complexity risk rather than assuming solely credit risk. Although we were substantially complete with our reinvestment of the Aviva USA acquired investments as of December 31, 2015, our net investment earned rates for the nine months ended September 30, 2015 were impacted as we reinvested sizable portions of the portfolio throughout the year. The net investment earned rates continue to reflect impacts of holding approximately 29% of total invested assets in floating rate investments and 2% of invested assets in cash holdings to opportunistically capitalize on market dislocations. The alternative investments net investments earned rate increased to 10.96% for the nine months ended September 30, 2016 from 9.72% in the prior period driven by an increase in credit funds related to credit spreads tightening in 2016 and an increase in our equity investment in A-A Mortgage.
Cost of crediting on deferred annuities increased by 5 basis points to 1.97% for the nine months ended September 30, 2016 from 1.92% in the prior year. The increase in cost of crediting was driven by an increase in option costs on our index annuity strategies, a change in the mix of business related to MYGA growth and a favorable reserve movement in prior period. We continue to focus on pricing discipline, managing interest rates credited to policyholders and managing the cost of options to fund the annual index credits on our FIA products.
Year Ended December 31, 2015 Compared to December 31, 2014
Operating Income, Net of Tax
Operating income, net of tax increased by $5 million, or 1%, to $769 million in 2015 from $764 million in 2014. Operating ROE excluding AOCI declined to 22.7% in 2015 from 32.2% in 2014, reflecting the increase in equity allocated to Retirement Services as we increased our capital within Retirement Services which management considered necessary to support the segment’s growth and our ratings aspirations. The increase in operating income, net of tax was primarily driven by the increase in net investment income as we continued to reinvest the Aviva USA acquired investments during 2015 as well as an increase in GLWB and GMDB charges over the change in reserve. The increases in operating income, net of tax were offset by an increase in amortization of DAC, DSI, and VOBA.
Net investment income increased by $89 million primarily driven by a $152 million increase in fixed income and other investment income attributed to the favorable reinvestment of the Aviva USA acquired investments into higher yielding strategies as well as income from investing the capital raise proceeds as a portion was allocated to the Retirement Services segment when increasing our capital to support the segment’s growth and our ratings aspirations. Additionally, the volatility in our alternative investment portfolio resulted in a decrease of $56 million primarily due to our credit funds’ performance as credit spreads widened in 2015.
The increase in GLWB and GMDB charges of $46 million was partially offset by the increase in the change in reserves of $22 million. The increase in charges was driven by new product offerings with rider charges. The change in reserve was primarily due to the unfavorable equity market performance in 2015 as well as higher than expected persistency increasing projected benefits partially offset by favorable change in unlocking of assumptions of $79 million. The change in unlocking in 2015 decreased reserves by $52 million primarily related to favorable updates to lapse assumptions partially offset by a decrease in net investment earned rate projections, while the 2014 impacts increased reserves by $27 million.
Amortization of DAC, DSI and VOBA increased by $107 million primarily due to the unfavorable change in unlocking of assumptions of $64 million, the growth in DAC and DSI asset balance from growth in the FIA
105
Table of Contents
block and a slight increase in gross profits during 2015. The unlocking impacts in 2015 increased amortization by $28 million primarily related to a decrease in net investment earned rate projections, while the 2014 impacts decreased amortization by $36 million.
Investment Margin on Deferred Annuities
| Years ended December 31, | ||||||||
| 2015 | 2014 | |||||||
| Net investment earned rate |
4.37% | 4.26% | ||||||
| Cost of crediting |
1.92% | 1.94% | ||||||
|
|
|
|
|
|||||
| Investment margin on deferred annuities |
2.45% | 2.32% | ||||||
|
|
|
|
|
|||||
Investment margin on deferred annuities increased by 13 basis points to 2.45% in 2015 from 2.32% in 2014. The increase in investment margin was driven by the increase in net investment earned rate of 11 basis points, showing strength in our investment portfolio, combined with a favorable decrease in cost of crediting of 2 basis points due to our disciplined pricing platform.
Net investment earned rate increased primarily due to the increase in our fixed income and other investment income partially offset by the decrease in alternative investment income. The fixed income and other net investment earned rate increased throughout 2015 to 4.17% from 4.00% in 2014 as we continued to reinvest the Aviva USA acquired investments under our preferred investment strategies. We reinvested a substantial portion of the investment portfolio acquired in the Aviva USA acquisition to align the acquired investments with our investment strategy of investing in higher yielding assets with an emphasis on liquidity and complexity risk rather than assuming solely credit risk. The reinvestment of the acquired investments contributed to the increase in fixed income and other net investment earned rates of 62 basis points to 4.12% in 2015 from 3.50% (on an annualized basis) for the fourth quarter of 2013 for this block of Aviva USA acquired investments. The net investment earned rates reflect continuing impacts of holding approximately 27% of total invested assets in floating rate investments, 3% of invested assets in cash holdings to opportunistically capitalize on market dislocations, and the yield adjustments from recognition of the higher overall amortized cost basis of the Aviva USA acquired investments as part of purchase accounting lowering yields. The alternative investments net investments earned rate decreased to 9.40% in 2015 from 9.77% in 2014 primarily due to market conditions unfavorably impacting our credit and CMBS funds as credit spreads widened, as well as fund liquidations. These unfavorable impacts were partially offset by the increase in alternative investment income from MidCap during 2015.
Cost of crediting on deferred annuities decreased by 2 basis points to 1.92% in 2015 reflecting continued discipline in pricing, managing interest rates credited to policyholders and managing the cost of options to fund the annual index credits on our FIA products.
Year Ended December 31, 2014 Compared to December 31, 2013
Operating Income, Net of Tax
Operating income, net of tax increased by $348 million, or 84%, to $764 million in 2014 from $416 million in 2013. Operating ROE excluding AOCI increased to 32.2% in 2014 from 23.2% in 2013, reflecting the increase in operating income, net of tax. The increase in operating income, net of tax was driven by the asset and liability growth from the Aviva USA acquisition which contributed $416 million of operating income, net of tax compared to one quarter’s contribution in 2013. The acquired business increased revenues including net investment income, product charges, and premiums while also increasing benefits and expenses as well as changes to policyholder liabilities. The increase in operating income, net of tax from the Aviva USA acquired assets and liabilities was offset by the strong performance of alternative investments during 2013.
106
Table of Contents
Net investment income increased by $1.1 billion driven by the growth in invested assets of approximately $45 billion from the Aviva USA acquisition in October 2013, resulting in an increase in net investment income of $1.3 billion during 2014. The increase from the Aviva USA acquisition was partially offset by a decrease in alternative investment income of $92 million primarily due to favorable 2013 performance of the public equities included in one of our investment funds. In 2014, these public equities were allocated to corporate as our excess capital increased. For more discussion on our investment results and net investment earned rates, see “—Investment Margin on Deferred Annuities.”
Product charges increased by $151 million primarily attributed to the growth in liabilities related to the Aviva USA acquired business. A full year of the acquired business resulted in an additional $59 million of surrender charge fees and $88 million of GLWB and GMDB charges deducted from policyholder accounts for the respective benefits during 2014 compared to 2013 reflecting one quarter of activity relating to the Aviva USA business.
The favorable increases in net investment income and product charges were partially offset by the liability growth. Interest credited to policyholders increased by $209 million mainly attributed to the growth in average deferred annuity account values following the Aviva USA acquisition of approximately 138%, to $48 billion in 2014 from $20 billion in 2013. FIA option costs increased by $312 million driven by the Aviva USA acquired policies and a full year of costs. Future policy benefits paid net of the change in reserves increased by $228 million driven by the increase in volume of benefits acquired in the Aviva USA acquisition. GLWB and GMDB change in reserves increased by $150 million driven by the increase in the number of policies with benefits as well as an increase of $27 million in unlocking of assumptions primarily related to the decrease in long-term net investment earned rate projections.
Investment Margin on Deferred Annuities
| Years ended December 31, | ||||||||
| 2014 | 2013 | |||||||
| Net investment earned rate |
4.26% | 5.40% | ||||||
| Cost of crediting |
1.94% | 2.42% | ||||||
|
|
|
|
|
|||||
| Investment margin on deferred annuities |
2.32% | 2.98% | ||||||
|
|
|
|
|
|||||
Investment margin on deferred annuities decreased 66 basis points to 2.32% in 2014 from 2.98% in 2013. The decrease in investment margin was driven by the decrease in the net investment earned rate of 114 basis points partially offset by a favorable decrease in cost of crediting of 48 basis points. The main drivers of the changes in net investment earned rates and cost of crediting were the impacts of the Aviva USA acquisition as well as 2013 alternative investment performance.
The decrease in net investment earned rate was primarily driven by the impact of the Aviva USA acquired investments decreasing our fixed income and other investments returns as well as 2013 benefiting from strong performance of our alternative investments. The fixed income and other investments net investment earned rate decreased in 2014 to 4.00% from 4.30% in 2013 reflecting the negative impact of the yield adjustments from recognition of the higher overall amortized cost basis of the Aviva USA acquired investments as part of purchase accounting, therefore lowering our returns during 2014. The fixed income and other net investment earned rate increased throughout 2014 as we reinvested the Aviva USA acquired investments under our preferred investment strategies. Through December 31, 2014, we reinvested a portion of the investment portfolio acquired in the Aviva USA acquisition to align the acquired investments with our investment strategy of investing in higher yielding investments with an emphasis on liquidity and complexity risk rather than assuming solely credit risk. The reinvestment of the acquired investments contributed to the increase in fixed income and other net investment earned rates of 27 basis points to 3.77% in 2014 from 3.50% (on an annualized basis) for the fourth quarter of 2013 for this block of Aviva USA business. The net investment earned rates also reflect the impacts of holding approximately 24% of total invested assets in floating rate investments in 2014 and cash holdings.
107
Table of Contents
The decrease in alternative net investment earned rates was primarily due to 2013 benefiting from the strong performance of public equities included in one of our investment funds. In 2014, these public equities were allocated to corporate as our excess capital increased. During 2014 market conditions unfavorably impacted our credit and CMBS funds compared to the favorable impacts in 2013. We also purchased new alternative investments in 2014 which have increased our net asset values but had a slight timing difference of producing earnings.
The cost of crediting on deferred annuities decreased 48 basis points to 1.94% in 2014 reflecting continued discipline in pricing, managing interest rates credited to policyholders and managing the cost of options to fund the annual index credits on our FIA products. The 2014 cost of crediting benefited from a full year of the lower cost of crediting associated with the Aviva USA acquired liabilities. The cost of crediting on the Aviva USA acquired liabilities for 2014 was 1.71% on an average account value of $37 billion compared to a rate of 2.78% for non-Aviva liabilities on an average account value of $11 billion. The trends in the cost of crediting portion of the table above reflect the impact of our acquisitions over the periods.
Corporate and Other
Corporate and Other includes certain other operations related to our corporate activities and our German operations, which is primarily comprised of participating long-duration savings products. In addition to our German operations, included in Corporate and Other are corporate allocated expenses, merger and acquisition costs, debt costs, certain integration and restructuring costs, certain stock-based compensation and intersegment eliminations. In Corporate and Other we also hold capital in excess of the level of capital we hold in Retirement Services to support our operating strategy.
Operating Income (Loss), Net of Tax
Operating (loss), net of tax decreased by $70 million to $(87) million for the nine months ended September 30, 2016 from $(17) million in the prior period. The decrease in operating income (loss), net of tax was driven by lower alternative investment income. Alternative investment income decreased by $70 million primarily due to unfavorable market value volatility in public equity positions of one of our funds.
Operating income (loss), net of tax decreased by $58 million, or 200%, to $(29) million in 2015 from $29 million in 2014. The decrease in operating income (loss), net of tax was driven by a decrease in alternative investment income and an increase in expenses. Alternative investment income decreased by $51 million primarily driven by market value volatility in public equity positions in one of our funds reflecting unfavorable market conditions in 2015 as well as unfavorable earnings in CMBS funds impacted by the widening of credit spreads in 2015. The increase in operating expenses was primarily driven by an increase in corporate employee expenses as well as acquisition expenses. Our German operations’ operating income, net of tax, related to the acquisition of DLD partially offset the unfavorable decreases.
Operating income, net of tax decreased by $332 million, or 92%, to $29 million in 2014 from $361 million in 2013. The decrease in operating income, net of tax, in 2014 was driven by the 2013 strong performance of our public equity positions in one of our funds as a result of the initial public offerings of two of the underlying investments.
Consolidated Investment Portfolio
We had consolidated investments, including related parties, of $73.1 billion, $64.5 billion and $60.6 billion as of September 30, 2016, December 31, 2015 and 2014, respectively. Our investment strategy seeks to achieve sustainable risk-adjusted returns through disciplined managing of investment characteristics with our long-duration liabilities and the diversification of risk. The investment strategies utilized by our investment managers focus primarily on a buy and hold asset allocation strategy that may be adjusted periodically in response to changing market conditions and the nature of our liability profile. The majority of our investment portfolio,
108
Table of Contents
excluding investments of our German subsidiary, are managed by AAM, an indirect subsidiary of Apollo founded for the express purpose of managing Athene’s portfolio. AAM provides a full suite of services for our investment portfolio, including direct investment management, asset allocation, mergers and acquisition asset diligence, and certain operational support services, including investment compliance, tax, legal and risk management support. Our relationship with AAM and Apollo allows us to take advantage of our generally illiquid liability profile by identifying investment opportunities with an emphasis on earning incremental yield by taking liquidity and complexity risk rather than assuming solely credit risk. The deep experience of the AAM investment team and Apollo’s credit portfolio managers assist us in sourcing and underwriting complex asset classes. AAM has selected a diverse array of corporate bonds and more structured, but highly rated asset classes. We also maintain holdings in floating rate and less rate-sensitive instruments, including CLOs, non-agency RMBS and various types of structured products. In addition to our fixed income portfolio, we opportunistically allocate 5-10% of our portfolio to alternative investments where we primarily focus on fixed income-like, cash flow-based investments.
Our invested assets, which are those which directly back our policyholder liabilities as well as surplus assets (as further discussed in “—Key Operating and Non-GAAP Measures”), were $71.6 billion, $67.0 billion and $59.0 billion as of September 30, 2016, December 31, 2015 and 2014, respectively. AAM manages, directly and indirectly, approximately $66.2 billion and AAME sub-advises approximately $5.3 billion, which in the aggregate constitute the vast majority of our investment portfolio as of September 30, 2016, comprising a diversified portfolio of fixed maturity and other securities. Through our relationship with Apollo, AAM has identified unique investment opportunities for us. AAM’s knowledge of our funding structure and regulatory requirements allows it to design customized strategies and investments for our portfolio.
Our asset portfolio is managed within the limits and constraints set forth in our Investment and Credit Risk Policy. Under this policy, we set limits on investments in our portfolio by asset class, such as corporate bonds, emerging markets securities, municipal bonds, non-agency RMBS, CMBS, CLOs, commercial mortgage whole loans and mezzanine loans and investment funds. We also set credit risk limits for exposure to a single issuer that vary based on ratings. In addition, our investment portfolio is constrained by its scenario-based capital ratio limit and its stressed liquidity limit.
109
Table of Contents
The following table presents the carrying values of our total investments and investments in related parties as of the dates indicated (dollars in millions):
| September 30, 2016 | December 31, 2015 | December 31, 2014 | ||||||||||||||||||||||
| Carrying Value | Percent of Total |
Carrying Value | Percent of Total |
Carrying Value | Percent of Total |
|||||||||||||||||||
| AFS securities at fair value: |
||||||||||||||||||||||||
| Fixed maturity securities |
$ | 52,923 | 72.4% | $ | 47,816 | 74.1% | $ | 44,703 | 73.7% | |||||||||||||||
| Equity securities |
335 | 0.5% | 407 | 0.6% | 190 | 0.3% | ||||||||||||||||||
| Trading securities, at fair value |
2,721 | 3.7% | 2,468 | 3.8% | 2,795 | 4.6% | ||||||||||||||||||
| Mortgage loans, net of allowances |
5,518 | 7.6% | 5,500 | 8.5% | 5,465 | 9.0% | ||||||||||||||||||
| Investment funds |
725 | 1.0% | 733 | 1.1% | 832 | 1.4% | ||||||||||||||||||
| Policy loans |
606 | 0.8% | 642 | 1.0% | 778 | 1.3% | ||||||||||||||||||
| Funds withheld at interest |
6,375 | 8.7% | 3,482 | 5.4% | 2,774 | 4.6% | ||||||||||||||||||
| Derivative assets |
1,169 | 1.6% | 871 | 1.3% | 1,842 | 3.0% | ||||||||||||||||||
| Real estate |
603 | 0.8% | 566 | 0.9% | — | —% | ||||||||||||||||||
| Short-term investments |
164 | 0.2% | 135 | 0.2% | 17 | —% | ||||||||||||||||||
| Other investments |
84 | 0.2% | 83 | 0.3% | 56 | 0.1% | ||||||||||||||||||
|
|
|
|
|
|
|
|
|
|
|
|
|
|||||||||||||
| Total investments |
71,223 | 97.5% | 62,703 | 97.2% | 59,452 | 98.0% | ||||||||||||||||||
|
|
|
|
|
|
|
|
|
|
|
|
|
|||||||||||||
| Investment in related parties: |
||||||||||||||||||||||||
| AFS securities at fair value: |
||||||||||||||||||||||||
| Fixed maturity securities |
313 | 0.4% | 308 | 0.5% | 326 | 0.5% | ||||||||||||||||||
| Equity securities |
20 | —% | — | —% | — | —% | ||||||||||||||||||
| Trading securities, at fair value |
211 | 0.3% | 217 | 0.3% | 268 | 0.4% | ||||||||||||||||||
| Investment funds |
1,073 | 1.5% | 997 | 1.5% | 585 | 1.1% | ||||||||||||||||||
| Other investments |
237 | 0.3% | 245 | 0.4% | — | —% | ||||||||||||||||||
| Short-term investments |
— | —% | 55 | 0.1% | — | —% | ||||||||||||||||||
|
|
|
|
|
|
|
|
|
|
|
|
|
|||||||||||||
| Total related party investments |
1,854 | 2.5% | 1,822 | 2.8% | 1,179 | 2.0% | ||||||||||||||||||
|
|
|
|
|
|
|
|
|
|
|
|
|
|||||||||||||
| Total investments, including related party |
$ | 73,077 | 100.0% | $ | 64,525 | 100.0% | $ | 60,631 | 100.0% | |||||||||||||||
|
|
|
|
|
|
|
|
|
|
|
|
|
|||||||||||||
The increase in our total investments, including related parties, as of September 30, 2016 of $8.6 billion compared to December 31, 2015 was driven by the strong growth in deposits attributed to significant flow reinsurance business of $3.1 billion as well as strong growth in our retail sales for the nine months ended September 30, 2016 and $1.1 billion of primarily non-agency RMBS purchased from ARI in the third quarter of 2016. Additionally, unrealized gains on investments during the nine months ended September 30, 2016 contributed to the increase in total investments, including related parties, by $2.7 billion, primarily attributed to a decrease in U.S. treasury rates.
The increase in our total investments, including related parties, as of December 31, 2015 of $3.9 billion compared to December 31, 2014 was driven by the acquisition of DLD, growth in deposits attributed to flow reinsurance business of $1.1 billion in 2015 and the capital raise proceeds of $1.1 billion in April 2015. Partially offsetting the increases were unrealized losses in our AFS securities during the year, a decrease in trading securities and a decrease in derivative assets. The acquisition of DLD occurred in October 2015 and added $5.5 billion to our total investments. The unrealized losses of $1.7 billion were primarily attributed to the increase in U.S. treasury rates as well as the widening of credit spreads in 2015. The decrease in trading securities was driven by the conversion of two funds withheld reinsurance agreements with an affiliate of Global Atlantic to coinsurance. The derivative assets decrease was primarily due to the change in value of the options hedging our FIA policyholder liabilities, which reflected poor overall market performance in 2015.
As we have completed the acquisitions of Liberty Life, Investors Insurance Corporation, Presidential Life Corporation and Aviva USA, through December 31, 2015 we focused on the reinvestment of the acquired
110
Table of Contents
companies’ portfolios into our investment strategies. From the acquisition of Aviva USA in October 2013, we reinvested a substantial portion of the acquired investments to align with our investment strategy of seeking high quality investments with attractive returns. We reinvested a portion of the acquired Aviva USA portfolio into corporate bonds, CMLs and high quality investments that offer more diversification in structures including RMBS, CLOs and asset-backed securities (“ABS”) as well as attractive risk-return alternative investments. The reinvestment of the acquired investments contributed to the increase in fixed income and other net investment earned rates from 3.50% (on an annualized basis) for the fourth quarter of 2013 to 4.12% for the year ended December 31, 2015 for this block of Aviva USA business. As of December 31, 2015, the reinvestment of the Aviva USA acquired investments was substantially complete.
Our investment portfolio consists largely of high quality fixed maturity securities, loans and short-term investments as well as additional opportunistic holdings in investment funds and other instruments, including a small amount of equity holdings. Fixed maturity securities and loans include publicly issued corporate bonds, government bonds, privately placed corporate bonds and loans, mortgage loans, CMBS, RMBS, CLOs and other ABS.
While the substantial majority of our investment portfolio has been allocated to corporate bonds and structured credit products, a key component of our investment strategy is the opportunistic acquisition of investment funds with attractive risk and return profiles. Our investment fund portfolio consists of funds that employ various strategies including mortgage and real estate funds, credit funds, private equity funds and hedge funds. We currently target investments that are fixed-income-like or income producing and that have embedded downside protection. We also prefer investment funds that have a high degree of co-investment, have a stated maturity value or have reduced volatility versus pure equity. A majority of our investments in traditional private equity investments and hedge funds are a result of the acquisition of Aviva USA, which had existing private equity and hedge fund investment portfolios at the time of acquisition. We also acquired certain investment funds from the AAA Investor (which are classified as private equity investments and consolidated VIEs) as a one-time capital contribution by our largest shareholder in advance of the Aviva USA acquisition. With respect to investment fund portfolios that we receive in these transactions, we actively reinvest these investments in our preferred credit-oriented strategies over time as we liquidate these holdings.
We hold derivatives for economic hedging purposes to reduce our exposure to the cash flow variability of assets and liabilities, equity market risk, interest rate risk, credit risk, and to a lesser extent, foreign exchange risk. Our primary use of derivative instruments relates to providing the income needed to fund the annual indexed credits on our FIA products. We use fixed indexed options primarily to economically hedge FIA products that guarantee the return of principal to the policyholder and credit interest based on a percentage of the gain in a specific market index.
With respect to derivative positions, we transact with highly rated counterparties, and do not expect the counterparties to fail to meet their obligations under the contracts. We generally use industry standard agreements and annexes with bilateral collateral provisions to further reduce counterparty credit exposure.
AFS Securities
We invest with the intent to hold investments to maturity. In selecting investments we attempt to source investments that match our future cash flow needs. However, we may sell any of our investments in advance of maturity in order to timely satisfy our liabilities as they become due or in order to respond to a change in the credit profile or other characteristics of the particular investment.
AFS fixed maturity securities are carried at fair value on our consolidated balance sheets. Changes in fair value for our AFS portfolio, net of related DAC, DSI and VOBA amortization and GLWB and GMDB reserve changes, are charged or credited to other comprehensive income, net of tax. Declines in fair value that are other than temporary are recorded as realized losses in the consolidated statements of income, net of any applicable non-credit component of the loss, which is recorded as an adjustment to other comprehensive income.
111
Table of Contents
The distribution of our AFS securities, including related parties, by type is as follows as of the dates indicated (dollars in millions):
| September 30, 2016 | ||||||||||||||||||||
| Cost or Amortized Cost |
Unrealized Gain |
Unrealized Loss |
Fair Value | Percent of Total |
||||||||||||||||
| Fixed maturity securities portfolio by type: |
||||||||||||||||||||
| U.S. government and agencies |
$ | 71 | $ | 2 | $ | — | $ | 73 | 0.1% | |||||||||||
| U.S. state, municipal, and political subdivisions |
1,026 | 204 | — | 1,230 | 2.3% | |||||||||||||||
| Foreign governments |
2,284 | 264 | (6) | 2,542 | 4.7% | |||||||||||||||
| Corporate |
28,883 | 1,874 | (138) | 30,619 | 57.2% | |||||||||||||||
| CLOs |
5,078 | 14 | (213) | 4,879 | 9.1% | |||||||||||||||
| ABS |
2,726 | 45 | (59) | 2,712 | 5.1% | |||||||||||||||
| CMBS |
1,946 | 77 | (10) | 2,013 | 3.8% | |||||||||||||||
| RMBS |
8,656 | 292 | (93) | 8,855 | 16.5% | |||||||||||||||
|
|
|
|
|
|
|
|
|
|
|
|||||||||||
| Total fixed maturity securities |
50,670 | 2,772 | (519) | 52,923 | 98.8% | |||||||||||||||
| Equity securities |
311 | 25 | (1) | 335 | 0.6% | |||||||||||||||
|
|
|
|
|
|
|
|
|
|
|
|||||||||||
| Total AFS securities |
50,981 | 2,797 | (520) | 53,258 | 99.4% | |||||||||||||||
|
|
|
|
|
|
|
|
|
|
|
|||||||||||
| Fixed maturity securities – related parties |
||||||||||||||||||||
| CLOs |
264 | 2 | (10) | 256 | 0.5% | |||||||||||||||
| ABS |
58 | — | (1) | 57 | 0.1% | |||||||||||||||
|
|
|
|
|
|
|
|
|
|
|
|||||||||||
| Total fixed maturity securities – related party |
322 | 2 | (11) | 313 | 0.6% | |||||||||||||||
| Equity securities – related party |
20 | — | — | 20 | —% | |||||||||||||||
|
|
|
|
|
|
|
|
|
|
|
|||||||||||
| Total AFS securities – related parties |
342 | 2 | (11) | 333 | 0.6% | |||||||||||||||
|
|
|
|
|
|
|
|
|
|
|
|||||||||||
| Total AFS securities, including related parties |
$ | 51,323 | $ | 2,799 | $ | (531) | $ | 53,591 | 100.0% | |||||||||||
|
|
|
|
|
|
|
|
|
|
|
|||||||||||
| December 31, 2015 | ||||||||||||||||||||
| Cost or Amortized Cost |
Unrealized Gain |
Unrealized Loss |
Fair Value | Percent of Total |
||||||||||||||||
| Fixed maturity securities portfolio by type: |
||||||||||||||||||||
| U.S. government and agencies |
$ | 44 | $ | 1 | $ | — | $ | 45 | 0.1% | |||||||||||
| U.S. state, municipal, and political subdivisions |
1,075 | 100 | (10) | 1,165 | 2.4% | |||||||||||||||
| Foreign governments |
2,467 | 17 | (20) | 2,464 | 5.1% | |||||||||||||||
| Corporate |
26,979 | 523 | (566) | 26,936 | 55.5% | |||||||||||||||
| CLOs |
4,943 | 4 | (392) | 4,555 | 9.4% | |||||||||||||||
| ABS |
2,944 | 33 | (59) | 2,918 | 6.0% | |||||||||||||||
| CMBS |
1,725 | 33 | (20) | 1,738 | 3.6% | |||||||||||||||
| RMBS |
8,050 | 128 | (183) | 7,995 | 16.5% | |||||||||||||||
|
|
|
|
|
|
|
|
|
|
|
|||||||||||
| Total fixed maturity securities |
48,227 | 839 | (1,250) | 47,816 | 98.6% | |||||||||||||||
| Equity securities |
367 | 40 | — | 407 | 0.8% | |||||||||||||||
|
|
|
|
|
|
|
|
|
|
|
|||||||||||
| Total AFS securities |
48,594 | 879 | (1,250) | 48,223 | 99.4% | |||||||||||||||
|
|
|
|
|
|
|
|
|
|
|
|||||||||||
| Fixed maturity securities – related parties |
||||||||||||||||||||
| CLOs |
271 | — | (23) | 248 | 0.5% | |||||||||||||||
| ABS |
61 | — | (1) | 60 | 0.1% | |||||||||||||||
|
|
|
|
|
|
|
|
|
|
|
|||||||||||
| Total AFS securities – related parties |
332 | — | (24) | 308 | 0.6% | |||||||||||||||
|
|
|
|
|
|
|
|
|
|
|
|||||||||||
| Total AFS securities, including related parties |
$ | 48,926 | $ | 879 | $ | (1,274) | $ | 48,531 | 100.0% | |||||||||||
|
|
|
|
|
|
|
|
|
|
|
|||||||||||
112
Table of Contents
| December 31, 2014 | ||||||||||||||||||||
| Cost or Amortized Cost |
Unrealized Gain |
Unrealized Loss |
Fair Value | Percent of Total |
||||||||||||||||
| Fixed maturity securities portfolio by type: |
||||||||||||||||||||
| U.S. government and agencies |
$ | 68 | $ | 3 | $ | — | $ | 71 | 0.2% | |||||||||||
| U.S. state, municipal, and political subdivisions |
1,304 | 168 | (1) | 1,471 | 3.3% | |||||||||||||||
| Corporate |
26,750 | 1,062 | (90) | 27,722 | 61.2% | |||||||||||||||
| CLOs |
3,719 | 16 | (115) | 3,620 | 8.0% | |||||||||||||||
| ABS |
2,636 | 48 | (18) | 2,666 | 5.9% | |||||||||||||||
| CMBS |
2,890 | 54 | (14) | 2,930 | 6.5% | |||||||||||||||
| RMBS |
6,040 | 221 | (38) | 6,223 | 13.8% | |||||||||||||||
|
|
|
|
|
|
|
|
|
|
|
|||||||||||
| Total fixed maturity securities |
43,407 | 1,572 | (276) | 44,703 | 98.9% | |||||||||||||||
| Equity securities |
142 | 48 | — | 190 | 0.4% | |||||||||||||||
|
|
|
|
|
|
|
|
|
|
|
|||||||||||
| Total AFS securities |
43,549 | 1,620 | (276) | 44,893 | 99.3% | |||||||||||||||
|
|
|
|
|
|
|
|
|
|
|
|||||||||||
| Fixed maturity securities – related parties |
||||||||||||||||||||
| CLOs |
270 | — | (10) | 260 | 0.6% | |||||||||||||||
| ABS |
66 | — | — | 66 | 0.1% | |||||||||||||||
|
|
|
|
|
|
|
|
|
|
|
|||||||||||
| Total AFS securities – related parties |
336 | — | (10) | 326 | 0.7% | |||||||||||||||
|
|
|
|
|
|
|
|
|
|
|
|||||||||||
| Total AFS securities, including related parties |
$ | 43,885 | $ | 1,620 | $ | (286) | $ | 45,219 | 100.0% | |||||||||||
|
|
|
|
|
|
|
|
|
|
|
|||||||||||
Fixed Maturity Securities
We maintain a diversified AFS portfolio of corporate fixed maturity securities across industries and issuers, and a diversified portfolio of structured securities. The composition of our AFS fixed maturity securities, including related parties, is as follows (dollars in millions):
| September 30, 2016 | December 31, 2015 | December 31, 2014 | ||||||||||||||||||||||
| Fair Value | Percent of Total |
Fair Value | Percent of Total |
Fair Value | Percent of Total |
|||||||||||||||||||
| Corporate: |
||||||||||||||||||||||||
| Industrial other (1) |
$ | 10,787 | 20.3% | $ | 9,918 | 20.6% | $ | 10,691 | 23.7% | |||||||||||||||
| Financial |
9,454 | 17.8% | 7,941 | 16.5% | 7,291 | 16.2% | ||||||||||||||||||
| Utilities |
6,558 | 12.3% | 5,864 | 12.2% | 6,648 | 14.8% | ||||||||||||||||||
| Communication |
2,298 | 4.3% | 1,820 | 3.8% | 1,763 | 3.9% | ||||||||||||||||||
| Transportation |
1,522 | 2.9% | 1,393 | 2.9% | 1,329 | 3.0% | ||||||||||||||||||
|
|
|
|
|
|
|
|
|
|
|
|
|
|||||||||||||
| Total corporate |
30,619 | 57.6% | 26,936 | 56.0% | 27,722 | 61.6% | ||||||||||||||||||
| Other government-related securities |
||||||||||||||||||||||||
| State, municipal and political subdivisions |
1,230 | 2.3% | 1,165 | 2.4% | 1,471 | 3.3% | ||||||||||||||||||
| Foreign governments |
2,542 | 4.8% | 2,464 | 5.1% | — | —% | ||||||||||||||||||
| U.S. treasuries |
73 | 0.1% | 45 | 0.1% | 71 | 0.2% | ||||||||||||||||||
|
|
|
|
|
|
|
|
|
|
|
|
|
|||||||||||||
| Total non-structured securities |
34,464 | 64.8% | 30,610 | 63.6% | 29,264 | 65.1% | ||||||||||||||||||
|
|
|
|
|
|
|
|
|
|
|
|
|
|||||||||||||
| Structured securities: |
||||||||||||||||||||||||
| CLOs |
5,135 | 9.6% | 4,803 | 10.0% | 3,880 | 8.6% | ||||||||||||||||||
| ABS |
2,769 | 5.2% | 2,978 | 6.2% | 2,732 | 6.1% | ||||||||||||||||||
| CMBS |
2,013 | 3.8% | 1,738 | 3.6% | 2,930 | 6.5% | ||||||||||||||||||
| RMBS: |
||||||||||||||||||||||||
| Agency |
122 | 0.2% | 142 | 0.3% | 247 | 0.5% | ||||||||||||||||||
| Non-agency |
8,733 | 16.4% | 7,853 | 16.3% | 5,976 | 13.2% | ||||||||||||||||||
|
|
|
|
|
|
|
|
|
|
|
|
|
|||||||||||||
| Total structured securities |
18,772 | 35.2% | 17,514 | 36.4% | 15,765 | 34.9% | ||||||||||||||||||
|
|
|
|
|
|
|
|
|
|
|
|
|
|||||||||||||
| Total fixed maturity securities, including related parties |
$ | 53,236 | 100.0% | $ | 48,124 | 100.0% | $ | 45,029 | 100.0% | |||||||||||||||
|
|
|
|
|
|
|
|
|
|
|
|
|
|||||||||||||
| (1) | Includes securities within various industry segments including capital goods, basic industry, consumer cyclical, consumer non-cyclical, industrial, and technology. |
113
Table of Contents
The fair value of our total fixed maturity securities, including related parties, was $53.2 billion and $48.1 billion as of September 30, 2016 and December 31, 2015, respectively. The increase was driven by the strong growth in deposits attributed to growth in our retail sales for the nine months ended September 30, 2016, $1.1 billion of primarily non-agency RMBS purchased in the third quarter of 2016 and unrealized gains on fixed maturity securities during the nine months ended September 30, 2016 primarily attributed to a decrease in U.S. treasury rates.
The fair value of our total fixed maturity securities, including related parties, was $48.1 billion and $45.0 billion as of December 31, 2015 and 2014, respectively. The increase in 2015 was primarily attributed to the acquisition of DLD and the investment of the capital raise proceeds, partially offset by unrealized losses in 2015. The acquisition of DLD in October 2015 increased our total fixed maturity securities by $4.0 billion. The unrealized losses of $1.7 billion were primarily driven by the increase in U.S. treasury rates as well as the widening of credit spreads in 2015.
The Securities Valuation Office (“SVO”) of the NAIC is responsible for the credit quality assessment and valuation of securities owned by state regulated insurance companies. Insurance companies report ownership of securities to the SVO when such securities are eligible for filing on the relevant schedule of the NAIC Financial Statement Blank. The SVO conducts credit analysis on these securities for the purpose of assigning an NAIC designation and/or unit price. Typically, if a security has been rated by an NRSRO, the SVO utilizes that rating and assigns an NAIC designation based upon the following system:
|
NAIC designation
|
NRSRO equivalent rating
| |
| 1 |
AAA/AA/A | |
| 2 |
BBB | |
| 3 |
BB | |
| 4 |
B | |
| 5 |
CCC | |
| 6 |
CC and lower |
The SVO’s loan-backed and structured securities (“LBaSS”) methodology is focused on determining the risk associated with the recovery of the amortized cost of each security. In contrast, the NRSRO ratings methodology is focused on the likelihood of recovery of all contractual payments, including principal at par regardless of entry price. The NRSRO rating assumes that the holder is the original purchaser at par whereas the modeled and non-modeled LBaSS ratings are focused on the recovery of current amortized cost. As the NAIC ratings methodology considers our investment and amortized cost, and the likelihood of recovery of that book value as opposed to the likelihood of default of the security, we view the NAIC ratings methodology as the most appropriate way to view our fixed maturity portfolio from a ratings perspective since a large portion of our holdings were purchased at a significant discount to par.
Specific to LBaSS, the SVO has developed a ratings process and provides instruction on both modeled and non-modeled LBaSS. The modeled LBaSS process is specific to the RMBS and CMBS asset classes. In order to establish ratings at the individual security level, the SVO obtains loan-level analysis of each RMBS and CMBS using a selected vendor’s proprietary financial model. The SVO ensures that the vendor has extensive internal quality-control processes in place and the SVO conducts its own quality-control checks of the selected vendor’s valuation process. The NAIC retained the services of Pacific Investment Management Co.’s advisory services (“PIMCO Advisory”) to model non-agency RMBS owned by U.S. insurers in 2014. The SVO switched from PIMCO Advisory to Blackrock, Inc. (“Blackrock”) for non-agency RMBS in 2015. For CMBS, the SVO has retained the services of Blackrock for all years presented. PIMCO Advisory and Blackrock, specific to the periods referred to above (the “selected vendors”), provide five prices (“breakpoints” based on each U.S. insurer’s statutory book value price) to utilize in determining the NAIC designation for each modeled LBaSS.
114
Table of Contents
For non-modeled LBaSS (ABS and CLOs) with the initial rating of NAIC 1 or NAIC 6, the rating remains the same through the life of the security. For non-modeled LBaSS with the initial rating of NAIC 2 through NAIC 5, the selected vendors are not utilized and the NAIC designations are set using a standardized table of breakpoints provided by the SVO for application to the insurer’s statutory book value price. The NAIC designation determines the associated level of RBC that an insurer is required to hold for modeled LBaSS owned by the insurer. In general, under both the modeled and non-modeled LBaSS processes, the larger the discount to par value, the stronger the NAIC rating the LBaSS will have.
A summary of our AFS fixed maturity securities, including related parties, by NAIC designation (with our German operations applying NRSRO ratings to map to NAIC ratings as noted above) is as follows (dollars in millions):
| September 30, 2016 | December 31, 2015 | December 31, 2014 | ||||||||||||||||||||||||||||||||||
| NAIC designation | Amortized Cost |
Fair Value | Percent of Total |
Amortized Cost |
Fair Value | Percent of Total |
Amortized Cost |
Fair Value | Percent of Total |
|||||||||||||||||||||||||||
| 1 |
$ | 29,018 | $ | 30,500 | 57.3% | $ | 28,961 | $ | 29,022 | 60.3% | $ | 26,225 | $ | 27,072 | 60.1% | |||||||||||||||||||||
| 2 |
18,182 | 19,070 | 35.8% | 16,983 | 16,696 | 34.7% | 15,635 | 16,098 | 35.8% | |||||||||||||||||||||||||||
|
|
|
|
|
|
|
|
|
|
|
|
|
|
|
|
|
|
|
|||||||||||||||||||
| Total investment grade |
47,200 | 49,570 | 93.1% | 45,944 | 45,718 | 95.0% | 41,860 | 43,170 | 95.9% | |||||||||||||||||||||||||||
|
|
|
|
|
|
|
|
|
|
|
|
|
|
|
|
|
|
|
|||||||||||||||||||
| 3 |
3,047 | 2,958 | 5.6% | 2,358 | 2,182 | 4.6% | 1,578 | 1,562 | 3.5% | |||||||||||||||||||||||||||
| 4 |
639 | 602 | 1.1% | 216 | 194 | 0.4% | 282 | 273 | 0.6% | |||||||||||||||||||||||||||
| 5 |
40 | 37 | 0.1% | 23 | 14 | —% | 10 | 10 | —% | |||||||||||||||||||||||||||
| 6 |
66 | 69 | 0.1% | 18 | 16 | —% | 13 | 14 | —% | |||||||||||||||||||||||||||
|
|
|
|
|
|
|
|
|
|
|
|
|
|
|
|
|
|
|
|||||||||||||||||||
| Total below investment grade |
3,792 | 3,666 | 6.9% | 2,615 | 2,406 | 5.0% | 1,883 | 1,859 | 4.1% | |||||||||||||||||||||||||||
|
|
|
|
|
|
|
|
|
|
|
|
|
|
|
|
|
|
|
|||||||||||||||||||
| Total fixed maturity securities, including related parties |
$ | 50,992 | $ | 53,236 | 100.0% | $ | 48,559 | $ | 48,124 | 100.0% | $ | 43,743 | $ | 45,029 | 100.0% | |||||||||||||||||||||
|
|
|
|
|
|
|
|
|
|
|
|
|
|
|
|
|
|
|
|||||||||||||||||||
Substantially all of our AFS fixed maturity portfolio, 93.1%, 95.0% and 95.9% as of September 30, 2016, December 31, 2015 and 2014, respectively, was invested in investment grade assets with a NAIC rating of 1 or 2.
A summary of our AFS fixed maturity securities, including related parties, by NRSRO ratings is set forth below (dollars in millions):
| September 30, 2016 | December 31, 2015 | December 31, 2014 | ||||||||||||||||||||||
| NRSRO rating agency designation | Fair Value | Percent of Total |
Fair Value | Percent of Total |
Fair Value | Percent of Total |
||||||||||||||||||
| AAA/AA/A |
$ | 19,417 | 36.5% | $ | 17,906 | 37.2% | $ | 16,885 | 37.5% | |||||||||||||||
| BBB |
18,262 | 34.3% | 16,481 | 34.2% | 15,837 | 35.2% | ||||||||||||||||||
| Non-rated (1) |
5,373 | 10.1% | 5,325 | 11.1% | 4,696 | 10.4% | ||||||||||||||||||
|
|
|
|
|
|
|
|
|
|
|
|
|
|||||||||||||
| Total investment grade |
43,052 | 80.9% | 39,712 | 82.5% | 37,418 | 83.1% | ||||||||||||||||||
|
|
|
|
|
|
|
|
|
|
|
|
|
|||||||||||||
| BB |
3,432 | 6.4% | 2,937 | 6.1% | 2,896 | 6.4% | ||||||||||||||||||
| B |
1,353 | 2.5% | 729 | 1.5% | 774 | 1.7% | ||||||||||||||||||
| CCC |
2,358 | 4.4% | 2,104 | 4.4% | 2,026 | 4.5% | ||||||||||||||||||
| CC and lower |
2,479 | 4.7% | 2,211 | 4.6% | 1,688 | 3.8% | ||||||||||||||||||
| Non-rated (1) |
562 | 1.1% | 431 | 0.9% | 227 | 0.5% | ||||||||||||||||||
|
|
|
|
|
|
|
|
|
|
|
|
|
|||||||||||||
| Total below investment grade |
10,184 | 19.1% | 8,412 | 17.5% | 7,611 | 16.9% | ||||||||||||||||||
|
|
|
|
|
|
|
|
|
|
|
|
|
|||||||||||||
| Total fixed maturity securities, including related parties |
$ | 53,236 | 100.0% | $ | 48,124 | 100.0% | $ | 45,029 | 100.0% | |||||||||||||||
|
|
|
|
|
|
|
|
|
|
|
|
|
|||||||||||||
| (1) | Securities denoted as non-rated by the NRSRO were classified as investment or non-investment grade according to the security’s respective NAIC rating. |
Consistent with the NAIC Process and Procedures Manual, an NRSRO rating was assigned based on the following criteria: (a) the equivalent S&P rating where the security is rated by one NRSRO; (b) the equivalent
115
Table of Contents
S&P rating of the lowest NRSRO when the security is rated by two NRSROs; and (c) the equivalent S&P rating of the second lowest NRSRO if the security is rated by three or more NRSROs. If the lowest two NRSRO ratings are equal, then such rating will be the assigned rating. NRSRO ratings available for the periods presented were S&P, Fitch, Moody’s Investor Service (“Moody’s”), DBRS, and Kroll Bond Rating Agency, Inc. (“KBRA”).
The portion of our AFS fixed maturity portfolio that was considered below investment grade based on NRSRO ratings was 19.1%, 17.5% and 16.9% as of September 30, 2016, December 31, 2015 and 2014, respectively. The primary driver of the difference in the percentage of securities considered below investment grade by NRSROs as compared to the securities considered below investment grade by the NAIC relates to the difference in ratings methodologies between the NRSRO and NAIC for RMBS due to investments acquired at a discount to par value, as discussed above. The primary driver of the increase in the percentage of NRSRO below investment grade securities and the corresponding increase in NAIC below investment grade securities as of September 30, 2016 from December 31, 2015 was the purchase of $1.1 billion of primarily non-agency RMBS in the third quarter of 2016, many of which were purchased at a discount to par. The primary driver of the increase in the percentage of NRSRO below investment grade securities and the corresponding increase in NAIC below investment grade securities as of December 31, 2015 from 2014 was driven by the reinvestment activity and the volatile economic environment.
As of September 30, 2016, December 31, 2015 and 2014, the non-rated securities shown above were comprised of 39%, 52% and 63%, respectively, of private placement securities for which we have not sought individual ratings from the NRSROs and 43%, 43% and 22%, respectively, of RMBS, many of which were acquired at a significant discount to par. We rely on internal analysis of credit risk and ratings assigned by the NAIC. As of September 30, 2016, December 31, 2015 and 2014, 91%, 93% and 95%, respectively, of the non-rated securities were designated NAIC 1 or 2.
Asset-backed Securities - We invest in ABS which are securitized by pools of assets such as consumer loans, student loans, insurance-linked securities (“ILS”) and corporate debt. These holdings were $2.8 billion, $3.0 billion and $2.7 billion as of September 30, 2016, December 31, 2015 and 2014, respectively. As of September 30, 2016, December 31, 2015 and 2014, our ABS portfolio included approximately $2.6 billion (92% of the total), $2.8 billion (95% of the total) and $2.6 billion (95% of the total), respectively, of securities that are considered investment grade based on NAIC ratings, while approximately $2.3 billion (84% of the total), $2.6 billion (86% of the total) and $2.4 billion (88% of the total), respectively, of securities were considered investment grade based on NRSRO ratings.
Collateralized Loan Obligations - We also invest in CLOs which pay principal and interest from cash flows received from underlying corporate loans. These holdings were $5.1 billion, $4.8 billion and $3.9 billion as of September 30, 2016, December 31, 2015 and 2014, respectively. The increase as of December 31, 2015 from 2014 was primarily attributable to the reinvestment of the Aviva USA acquired portfolio as our asset managers continued to opportunistically invest in this asset class. As of September 30, 2016, December 31, 2015 and 2014, our CLO portfolio included approximately $4.2 billion (82% of the total), $4.1 billion (86% of the total) and $3.4 billion (87% of the total), respectively, of securities that are considered investment grade based on NAIC ratings while approximately $4.1 billion (80% of the total), $3.9 billion (81% of the total) and $2.8 billion (72% of the total), respectively, of securities were considered investment grade based on NRSRO ratings.
Commercial Mortgage-backed Securities - A portion of our fixed maturity AFS portfolio is invested in CMBS. CMBS are constructed from pools of commercial mortgages. These holdings were $2.0 billion, $1.7 billion and $2.9 billion as of September 30, 2016, December 31, 2015 and 2014, respectively. The decrease as of December 31, 2015 from 2014 was primarily due to routine sales, maturities and paydowns with new money reinvested in other asset classes. As of September 30, 2016, December 31, 2015 and 2014, our CMBS portfolio included approximately $2.0 billion (98% of the total), $1.7 billion (100% of the total) and $2.9 billion (100% of
116
Table of Contents
the total), respectively, of securities that are considered investment grade based on NAIC ratings while approximately $1.3 billion (63% of the total), $1.0 billion (60% of the total) and $2.6 billion (88% of the total), respectively, of securities were considered investment grade based on NRSRO ratings. Declines in the investment grade portion of CMBS as of December 31, 2015 from 2014, based on NRSRO ratings, were a result of scheduled maturities and opportunistic sales of investment grade bonds.
Residential Mortgage-backed Securities - As part of our core investment strategy, a portion of our fixed maturity AFS portfolio is invested in RMBS. RMBS are securities constructed from pools of residential mortgages and backed by payments from those pools. Excluding limitations on access to lending and other extraordinary economic conditions, prepayments of principal on the underlying loans can be expected to accelerate with decreases in market interest rates and diminish with increases in interest rates. Our investments in RMBS are primarily non-agency RMBS having a significant focus on assets with attractive entry prices, which in general results in investment grade ratings by the NAIC given the likelihood that we ultimately receive principal and interest distributions in an amount at least equal to our cost. These holdings were $8.9 billion, $8.0 billion and $6.2 billion as of September 30, 2016, December 31, 2015 and 2014, respectively. The increase as of September 30, 2016 from December 31, 2015 was primarily due to $1.1 billion of primarily non-agency RMBS purchased in the third quarter of 2016. The increase as of December 31, 2015 from 2014 was primarily due to the reinvestment of Aviva USA’s investments.
A summary of our AFS RMBS portfolio by NAIC and NRSRO quality ratings is as follows (dollars in millions):
| September 30, 2016 | December 31, 2015 | December 31, 2014 | ||||||||||||||||||||||
| NAIC designation | Fair Value | Percent of Total |
Fair Value | Percent of Total |
Fair Value | Percent of Total |
||||||||||||||||||
| 1 |
$ | 8,089 | 91.4% | $ | 7,351 | 91.9% | $ | 5,892 | 94.7% | |||||||||||||||
| 2 |
488 | 5.5% | 463 | 5.8% | 228 | 3.7% | ||||||||||||||||||
|
|
|
|
|
|
|
|
|
|
|
|
|
|||||||||||||
| Total investment grade |
8,577 | 96.9% | 7,814 | 97.7% | 6,120 | 98.4% | ||||||||||||||||||
|
|
|
|
|
|
|
|
|
|
|
|
|
|||||||||||||
| 3 |
160 | 1.8% | 157 | 2.0% | 50 | 0.8% | ||||||||||||||||||
| 4 |
41 | 0.5% | 20 | 0.3% | 44 | 0.7% | ||||||||||||||||||
| 5 |
22 | 0.2% | 1 | —% | 9 | 0.1% | ||||||||||||||||||
| 6 |
55 | 0.6% | 3 | —% | — | —% | ||||||||||||||||||
|
|
|
|
|
|
|
|
|
|
|
|
|
|||||||||||||
| Total below investment grade |
278 | 3.1% | 181 | 2.3% | 103 | 1.6% | ||||||||||||||||||
|
|
|
|
|
|
|
|
|
|
|
|
|
|||||||||||||
| Total RMBS |
$ | 8,855 | 100.0% | $ | 7,995 | 100.0% | $ | 6,223 | 100.0% | |||||||||||||||
|
|
|
|
|
|
|
|
|
|
|
|
|
|||||||||||||
| NRSRO rating agency designation |
||||||||||||||||||||||||
| AAA/AA/A |
$ | 235 | 2.7% | $ | 315 | 3.9% | $ | 377 | 6.1% | |||||||||||||||
| BBB |
334 | 3.8% | 227 | 2.8% | 180 | 2.9% | ||||||||||||||||||
| Non-rated (1) |
2,373 | 26.7% | 2,366 | 29.6% | 1,087 | 17.5% | ||||||||||||||||||
|
|
|
|
|
|
|
|
|
|
|
|
|
|||||||||||||
| Total investment grade |
2,942 | 33.2% | 2,908 | 36.3% | 1,644 | 26.5% | ||||||||||||||||||
|
|
|
|
|
|
|
|
|
|
|
|
|
|||||||||||||
| BB |
417 | 4.7% | 328 | 4.2% | 452 | 7.2% | ||||||||||||||||||
| B |
582 | 6.6% | 417 | 5.2% | 439 | 7.1% | ||||||||||||||||||
| CCC |
2,283 | 25.8% | 2,048 | 25.6% | 1,978 | 31.8% | ||||||||||||||||||
| CC and lower |
2,472 | 27.9% | 2,211 | 27.7% | 1,689 | 27.1% | ||||||||||||||||||
| Non-rated (1) |
159 | 1.8% | 83 | 1.0% | 21 | 0.3% | ||||||||||||||||||
|
|
|
|
|
|
|
|
|
|
|
|
|
|||||||||||||
| Total below investment grade |
5,913 | 66.8% | 5,087 | 63.7% | 4,579 | 73.5% | ||||||||||||||||||
|
|
|
|
|
|
|
|
|
|
|
|
|
|||||||||||||
| Total RMBS |
$ | 8,855 | 100.0% | $ | 7,995 | 100.0% | $ | 6,223 | 100.0% | |||||||||||||||
|
|
|
|
|
|
|
|
|
|
|
|
|
|||||||||||||
| (1) | Securities denoted as non-rated by the NRSRO were classified as investment or non-investment grade according to the security’s respective NAIC rating. |
As we focus on acquiring RMBS assets with attractive entry prices, some of these assets have experienced deterioration in credit quality since their issuance. Many of these securities were acquired at a discount to par
117
Table of Contents
value that resulted in a statutory book price that yields an investment grade NAIC rating. As a result of deterioration in credit quality since issuance, these securities are generally considered below investment grade based on NRSRO ratings methodologies. As a result, we have a significant difference in the number of securities considered below investment grade when evaluated under the NRSRO ratings methodologies when compared with the ratings evaluated under the NAIC ratings methodology.
The NRSRO non-rated investment grade securities were 26.7%, 29.6% and 17.5% as of September 30, 2016, December 31, 2015 and 2014, respectively. The increase as of December 31, 2015 from 2014 was primarily due to the reinvestment of the Aviva USA investments, which involved the acquisition of non-agency RMBS at significant discounts to par that are unrated by the NRSRO and rated investment grade by the NAIC. The increase in total RMBS holdings as of December 31, 2015 from 2014 was attributed to the reinvestment activity and was the primary driver of the decrease in the percentage of NRSRO below investment grade securities to 63.7% from 73.5%, respectively.
Unrealized Losses
Our investments in fixed maturity securities, including related parties, are reported at fair value with changes in fair value recorded in other comprehensive income. Certain of our fixed maturity securities, including related parties, have experienced declines in fair value that we consider temporary in nature. As of September 30, 2016, our fixed maturity securities, including related parties had a fair value of approximately $53.2 billion, which was approximately 4.4% above amortized cost of approximately $51.0 billion. As of December 31, 2015, our fixed maturity securities, including related parties had a fair value of approximately $48.1 billion, which was approximately 0.9% below amortized cost of approximately $48.6 billion. As of December 31, 2014 our fixed maturity securities, including related parties had a market value of approximately $45.0 billion, which was approximately 2.9% above amortized cost of approximately $43.7 billion in 2014. These investments are held to support our product liabilities and we currently have the intent and ability to hold these securities until sale or maturity, and believe the securities will recover the amortized cost basis prior to sale or maturity.
118
Table of Contents
The following tables reflect the unrealized losses on the AFS fixed maturity portfolio, including related parties, by NAIC quality ratings (dollars in millions):
| September 30, 2016 | ||||||||||||||||||||||||
| NAIC designation | Amortized Cost of Securities with Unrealized Loss |
Gross Unrealized Loss |
Fair Value of Securities with Unrealized Loss |
Fair Value to Amortized Cost Ratio |
Fair Value of Total AFS Fixed Maturity Securities |
Percent of Loss to Total AFS Fair Value NAIC Rating |
||||||||||||||||||
| 1 |
$ | 6,938 | $ | (223) | $ | 6,715 | 96.8% | $ | 30,500 | (0.7)% | ||||||||||||||
| 2 |
3,156 | (119) | 3,037 | 96.2% | 19,070 | (0.6)% | ||||||||||||||||||
|
|
|
|
|
|
|
|
|
|||||||||||||||||
| Total investment grade |
10,094 | (342) | 9,752 | 96.6% | 49,570 | (0.7)% | ||||||||||||||||||
|
|
|
|
|
|
|
|
|
|||||||||||||||||
| 3 |
1,774 | (141) | 1,633 | 92.1% | 2,958 | (4.8)% | ||||||||||||||||||
| 4 |
427 | (44) | 383 | 89.7% | 602 | (7.3)% | ||||||||||||||||||
| 5 |
14 | (3) | 11 | 78.6% | 37 | (8.1)% | ||||||||||||||||||
| 6 |
3 | — | 3 | 100.0% | 69 | —% | ||||||||||||||||||
|
|
|
|
|
|
|
|
|
|||||||||||||||||
| Total below investment grade |
2,218 | (188) | 2,030 | 91.5% | 3,666 | (5.1)% | ||||||||||||||||||
|
|
|
|
|
|
|
|
|
|||||||||||||||||
| Total |
$ | 12,312 | $ | (530) | $ | 11,782 | 95.7% | $ | 53,236 | (1.0)% | ||||||||||||||
|
|
|
|
|
|
|
|
|
|||||||||||||||||
| December 31, 2015 | ||||||||||||||||||||||||
| NAIC designation | Amortized Cost of Securities with Unrealized Loss |
Gross Unrealized Loss |
Fair Value of Securities with Unrealized Loss |
Fair Value to Amortized Cost Ratio |
Fair Value of Total AFS Fixed Maturity Securities |
Percent of Loss to Total AFS Fair Value NAIC Rating |
||||||||||||||||||
| 1 |
$ | 13,818 | $ | (496) | $ | 13,322 | 96.4% | $ | 29,022 | (1.7)% | ||||||||||||||
| 2 |
7,600 | (542) | 7,058 | 92.9% | 16,696 | (3.2)% | ||||||||||||||||||
|
|
|
|
|
|
|
|
|
|||||||||||||||||
| Total investment grade |
21,418 | (1,038) | 20,380 | 95.2% | 45,718 | (2.3)% | ||||||||||||||||||
|
|
|
|
|
|
|
|
|
|||||||||||||||||
| 3 |
1,772 | (196) | 1,576 | 88.9% | 2,182 | (9.0)% | ||||||||||||||||||
| 4 |
185 | (29) | 156 | 84.3% | 194 | (14.9)% | ||||||||||||||||||
| 5 |
23 | (9) | 14 | 60.9% | 14 | (64.3)% | ||||||||||||||||||
| 6 |
6 | (2) | 4 | 66.7% | 16 | (12.5)% | ||||||||||||||||||
|
|
|
|
|
|
|
|
|
|||||||||||||||||
| Total below investment grade |
1,986 | (236) | 1,750 | 88.1% | 2,406 | (9.8)% | ||||||||||||||||||
|
|
|
|
|
|
|
|
|
|||||||||||||||||
| Total |
$ | 23,404 | $ | (1,274) | $ | 22,130 | 94.6% | $ | 48,124 | (2.6)% | ||||||||||||||
|
|
|
|
|
|
|
|
|
|||||||||||||||||
| December 31, 2014 | ||||||||||||||||||||||||
| NAIC designation | Amortized Cost of Securities with Unrealized Loss |
Gross Unrealized Loss |
Fair Value of Securities with Unrealized Loss |
Fair Value to Amortized Cost Ratio |
Fair Value of Total AFS Fixed Maturity Securities |
Percent of Loss to Total AFS Fair Value NAIC Rating |
||||||||||||||||||
| 1 |
$ | 7,796 | $ | (149) | $ | 7,647 | 98.1% | $ | 27,072 | (0.6)% | ||||||||||||||
| 2 |
2,956 | (79) | 2,877 | 97.3% | 16,098 | (0.5)% | ||||||||||||||||||
|
|
|
|
|
|
|
|
|
|||||||||||||||||
| Total investment grade |
10,752 | (228) | 10,524 | 97.9% | 43,170 | (0.5)% | ||||||||||||||||||
|
|
|
|
|
|
|
|
|
|||||||||||||||||
| 3 |
878 | (45) | 833 | 94.9% | 1,562 | (2.9)% | ||||||||||||||||||
| 4 |
170 | (13) | 157 | 92.4% | 273 | (4.8)% | ||||||||||||||||||
| 5 |
2 | — | 2 | 100.0% | 10 | —% | ||||||||||||||||||
| 6 |
4 | — | 4 | 100.0% | 14 | —% | ||||||||||||||||||
|
|
|
|
|
|
|
|
|
|||||||||||||||||
| Total below investment grade |
1,054 | (58) | 996 | 94.5% | 1,859 | (3.1)% | ||||||||||||||||||
|
|
|
|
|
|
|
|
|
|||||||||||||||||
| Total |
$ | 11,806 | $ | (286) | $ | 11,520 | 97.6% | $ | 45,029 | (0.6)% | ||||||||||||||
|
|
|
|
|
|
|
|
|
|||||||||||||||||
As of September 30, 2016 and December 31, 2015, we held $3.5 billion and $3.1 billion, respectively, in energy sector fixed maturity securities, or 7% of the total fixed maturity securities including related parties for each period. The gross unrealized capital losses on these securities were $86 million and $300 million, or 16% and 24% of the total unrealized losses, respectively.
119
Table of Contents
Other-Than-Temporary Impairments
For our OTTI policy and the identification of securities that could potentially have impairments see “Note 2 – Investments” to our unaudited condensed consolidated financial statements and notes thereto, “Note 4 – Investments” to our audited consolidated financial statements and notes thereto and “—Critical Accounting Estimates and Judgments—Investments—Other–Than-Temporary Impairments.” During the nine months ended September 30, 2016, we recorded $27 million of OTTI losses comprised of $13 million related to state, municipal and political subdivisions, $6 million related to corporate fixed maturities, $5 million related to ABS, $2 million related to RMBS and $1 million related to other assets. Of the OTTI losses recognized, $4 million related to the energy sector. During the nine months ended September 30, 2015, we recorded $19 million of OTTI losses comprised of, $10 million related to corporate fixed maturities, $8 million related to state, municipal and political subdivisions and $1 million related to RMBS. Of the OTTI losses recognized, $9 million related to the energy sector. During the year ended December 31, 2015, we recorded $30 million of OTTI losses comprised of $20 million related to corporate fixed maturities, $8 million related to state, municipal, and other political subdivisions, $1 million related to RMBS and $1 million related to mortgage loans. Of the OTTI losses recognized, $17 million related to the energy sector. During the year ended December 31, 2014, we recorded $6 million of OTTI losses comprised of $4 million related to corporate fixed maturities and $2 million related to mortgage loans. There were no OTTI losses related to the energy sector for the year ended December 31, 2014. During the year ended December 31, 2013 we recorded $1 million of OTTI losses all of which related to the energy sector. The annualized OTTI losses we have experienced for the nine months ended September 30, 2016 and 2015 translate into 5 basis points and 4 basis points, respectively, of average invested assets. The OTTI losses we have experienced translate into 5 basis points, 1 basis point and 0 basis points of average invested assets for the years ended December 31, 2015, 2014 and 2013, respectively.
International Exposure
A portion of our fixed maturity securities are invested in securities with international exposure. As of September 30, 2016, December 31, 2015 and 2014, 32%, 31% and 24%, respectively, of the carrying value of our fixed maturity securities, including related parties was comprised of securities of issuers based outside of the United States and debt securities of foreign governments. These securities are either denominated in U.S. dollars or do not expose us to significant foreign currency risk as a result of foreign currency swap arrangements.
120
Table of Contents
The following table presents our international exposure in our fixed maturity securities portfolio, including related parties, by country or region (dollars in millions):
| September 30, 2016 | December 31, 2015 | December 31, 2014 | ||||||||||||||||||||||||||||||||||
| Country of risk | Amortized Cost |
Fair Value | Percent of Total |
Amortized Cost |
Fair Value | Percent of Total |
Amortized Cost |
Fair Value | Percent of Total |
|||||||||||||||||||||||||||
| Ireland |
$ | 489 | $ | 515 | 2.9% | $ | 553 | $ | 547 | 3.7% | $ | 282 | $ | 291 | 2.6% | |||||||||||||||||||||
| Italy |
154 | 161 | 0.9% | 244 | 250 | 1.7% | 9 | 10 | 0.1% | |||||||||||||||||||||||||||
| Spain |
186 | 201 | 1.2% | 197 | 201 | 1.3% | 37 | 39 | 0.4% | |||||||||||||||||||||||||||
|
|
|
|
|
|
|
|
|
|
|
|
|
|
|
|
|
|
|
|||||||||||||||||||
| Total Portugal, Ireland, Italy, Greece and Spain(1) |
829 | 877 | 5.0% | 994 | 998 | 6.7% | 328 | 340 | 3.1% | |||||||||||||||||||||||||||
| Other Europe |
6,380 | 6,798 | 39.6% | 6,417 | 6,442 | 43.1% | 3,979 | 4,100 | 37.3% | |||||||||||||||||||||||||||
|
|
|
|
|
|
|
|
|
|
|
|
|
|
|
|
|
|
|
|||||||||||||||||||
| Total Europe |
7,209 | 7,675 | 44.6% | 7,411 | 7,440 | 49.8% | 4,307 | 4,440 | 40.4% | |||||||||||||||||||||||||||
| Non-U.S. North America |
7,278 | 7,195 | 41.9% | 5,752 | 5,399 | 36.1% | 4,349 | 4,325 | 39.4% | |||||||||||||||||||||||||||
| Australia & New Zealand |
1,304 | 1,375 | 8.0% | 1,211 | 1,215 | 8.1% | 1,392 | 1,434 | 13.0% | |||||||||||||||||||||||||||
| Central & South America |
474 | 507 | 3.0% | 385 | 365 | 2.4% | 216 | 211 | 1.9% | |||||||||||||||||||||||||||
| Africa & Middle East |
156 | 167 | 1.0% | 133 | 134 | 0.9% | 86 | 88 | 0.8% | |||||||||||||||||||||||||||
| Asia/Pacific |
218 | 230 | 1.3% | 388 | 381 | 2.5% | 452 | 469 | 4.3% | |||||||||||||||||||||||||||
| Supranational |
28 | 31 | 0.2% | 28 | 27 | 0.2% | 21 | 21 | 0.2% | |||||||||||||||||||||||||||
|
|
|
|
|
|
|
|
|
|
|
|
|
|
|
|
|
|
|
|||||||||||||||||||
| Total |
$ | 16,667 | $ | 17,180 | 100.0% | $ | 15,308 | $ | 14,961 | 100.0% | $ | 10,823 | $ | 10,988 | 100.0% | |||||||||||||||||||||
|
|
|
|
|
|
|
|
|
|
|
|
|
|
|
|
|
|
|
|||||||||||||||||||
| (1) | As of each of September 30, 2016, December 31, 2015 and 2014, we had no holdings in Portugal or Greece. |
Approximately 89.8%, 92.0% and 94.5% of these securities are investment grade by NAIC designation as of September 30, 2016, December 31, 2015 and 2014, respectively. As of September 30, 2016, 7% of our fixed maturity securities, including related parties, were invested in securities of non-U.S. issuers by our German Group Companies, 8% were invested in CLOs of Cayman Islands issuers (for which underlying investments are largely loans to U.S. issuers) and 17% were invested in other non-U.S. issuers.
Portugal, Ireland, Italy, Greece and Spain continue to represent credit risk as economic conditions in these countries continue to be volatile, especially within the financial and banking sectors. We had $877 million, $998 million and $340 million as of September 30, 2016, December 31, 2015 and 2014, respectively, of exposure in these countries. The increase as of December 31, 2015 from 2014 was primarily due to an increase in our international portfolio as a result of the acquisition of DLD which added $668 million to our investments in these countries while increasing our total international exposure by $3.4 billion. As of September 30, 2016 and December 31, 2015 we had $328 million and $547 million, respectively, of exposure to sovereign issuers in Spain, Ireland and Italy as a result of investments acquired in the DLD acquisition, whereas we held no such investments as of December 31, 2014.
The effects on our investments in non-U.S. securities as a result of Brexit is unknown at this time, but the effects of Brexit are likely to lead to greater volatility in global financial markets in the near term. As of September 30, 2016, we held United Kingdom and Channel Islands fixed maturity securities of $1.6 billion, or 2.9% of the total fixed maturities including related parties. As of September 30, 2016, these securities were in an unrealized gain position of $60 million. Our investment managers analyze each holding for credit risk by economic and other factors of each country and industry.
Trading Securities
Trading securities, including related parties, were $2.9 billion, $2.7 billion and $3.1 billion as of September 30, 2016, December 31, 2015 and 2014, respectively. The decrease as of December 31, 2015 from
121
Table of Contents
2014 was driven by a change in investments held in our ceded funds withheld portfolios as a result of two reinsurance agreements that changed from funds withheld to coinsurance. The remaining trading securities are primarily comprised of AmerUs Closed Block securities for which we have elected the fair value option valuation, CLO equity tranche securities, structured securities with embedded derivatives, and investments which support various reinsurance arrangements.
Mortgage Loans
The following is a summary of our mortgage loan portfolio by collateral type (dollars in millions):
| September 30, 2016 | December 31, 2015 | December 31, 2014 | ||||||||||||||||||||||
| Property type | Net Carrying Value |
Percent of Total |
Net Carrying Value |
Percent of Total |
Net Carrying Value |
Percent of Total |
||||||||||||||||||
| Hotels |
$ | 937 | 17.0% | $ | 877 | 15.9% | $ | 705 | 12.9% | |||||||||||||||
| Retail |
1,257 | 22.8% | 1,230 | 22.4% | 1,338 | 24.5% | ||||||||||||||||||
| Office building |
1,229 | 22.2% | 1,274 | 23.2% | 1,301 | 23.8% | ||||||||||||||||||
| Industrial |
748 | 13.6% | 821 | 14.9% | 936 | 17.1% | ||||||||||||||||||
| Apartment |
728 | 13.2% | 907 | 16.5% | 809 | 14.8% | ||||||||||||||||||
| Other commercial (1) |
424 | 7.7% | 291 | 5.3% | 376 | 6.9% | ||||||||||||||||||
|
|
|
|
|
|
|
|
|
|
|
|
|
|||||||||||||
| Total net mortgage loans |
5,323 | 96.5% | 5,400 | 98.2% | 5,465 | 100.0% | ||||||||||||||||||
| Residential loans |
195 | 3.5% | 100 | 1.8% | — | — % | ||||||||||||||||||
|
|
|
|
|
|
|
|
|
|
|
|
|
|||||||||||||
| Total mortgage loans, net of allowances |
$ | 5,518 | 100.0% | $ | 5,500 | 100.0% | $ | 5,465 | 100.0% | |||||||||||||||
|
|
|
|
|
|
|
|
|
|
|
|
|
|||||||||||||
| (1) | Other commercial loans include investments in nursing homes, parking garages, restaurants, mobile home parks and other commercial properties. |
We invest a portion of our investment portfolio in mortgage loans, which are generally comprised of high quality commercial first lien and mezzanine real estate loans. Our mortgage loan holdings were $5.5 billion as of September 30, 2016 and $5.5 billion as of each of December 31, 2015 and 2014. This included $1.3 billion, $1.1 billion and $1.0 billion of mezzanine mortgage loans for the respective periods. We have acquired mortgage loans through acquisitions and reinsurance arrangements, as well as through an active program to invest in new mortgage loans. We invest in mortgage loans on income producing properties including hotels, apartments, retail and office buildings, and other commercial and industrial properties. Loan-to-value ratios at the time of loan approval are generally 75% or less.
Our mortgage loans are primarily stated at unpaid principal balance, adjusted for any unamortized premium or discount, and net of valuation allowances. Interest income is accrued on the principal amount of the loan based on the loan’s contractual interest rate. Amortization of premiums and discounts is recorded using the effective interest method. Interest income, amortization of premiums and discounts, and prepayment fees are reported in net investment income.
It is our policy to cease to accrue interest on loans that are over 90 days delinquent. For loans less than 90 days delinquent, interest is accrued unless it is determined that the accrued interest is not collectible. If a loan becomes over 90 days delinquent, it is our general policy to initiate foreclosure proceedings unless a workout arrangement to bring the loan current is in place. As of September 30, 2016, we had $22 million of mortgage loans that were 90 days past due and $14 million in the process of foreclosure. As of December 31, 2015, we had $39 million of mortgage loans that were 90 days past due and $18 million in the process of foreclosure. As of December 31, 2014, there were no mortgage loans that were 90 days past due or in the process of foreclosure.
See “Note 2 – Investments” to our unaudited condensed consolidated financial statements and notes thereto and “Note 4 – Investments” to our audited consolidated financial statements and notes thereto for information regarding valuation allowance for collection loss, impairments, loan-to-value, and debt service coverage.
122
Table of Contents
As of September 30, 2016 and September 30, 2015, we had not established any specific loan valuation allowances and we recorded no OTTI through net income. Additionally, we have established a collective loan loss allowance of $2 million as of September 30, 2016 and September 30, 2015 attributable to loans acquired in connection with the acquisition of Aviva USA.
As of December 31, 2015, 2014 and 2013 we had not established any specific loan valuation allowances; however, we recorded OTTI through net income of $1 million, $2 million and $0 million, respectively. Additionally, we established a collective loan loss allowance of $2 million as of December 31, 2015 and $1 million as of December 31, 2014 attributable to loans acquired in connection with the acquisition of Aviva USA. We did not record any OTTI in 2013.
Investment Funds and Variable Interest Entities
Our investment funds investment strategy primarily focuses on funds with core holdings of credit assets, real assets, real estate, preferred equity and income producing assets. Our investment strategy focuses on sourcing assets with the following characteristics: (i) investments that constitute a direct investment or an investment in a fund with a high degree of co-investment; (ii) investments with debt-like characteristics, or alternatively, investments with reduced volatility when compared to pure equity; and (iii) investments including some element of downside protection as compared to a pure directional investment. Our current investment funds and VIE holdings are significantly influenced by the contribution of certain investment funds from the AAA Investor (the “AAA Contribution”) as further described in “Note 19 – Related Parties” to our audited consolidated financial statements and notes thereto, and investment funds we acquired in the Aviva USA acquisition.
At the time of the AAA Contribution, the contributed assets largely consisted of co-investments with Apollo private equity funds. However, the attributes of the contributed assets have changed significantly since the initial transaction primarily due to the initial public offering of two underlying fund investment holdings. As of September 30, 2016, the assets consisted of $185 million of publicly-traded equity securities, a substantial portion of which is in the process of being liquidated.
Our investment funds generally meet the definition of a VIE, and in certain cases these investment funds are consolidated in our financial statements because we meet the criteria of the primary beneficiary. See “Note 4 – Variable Interest Entities” to our unaudited condensed consolidated financial statements and notes thereto and “Note 6 – Variable Interest Entities” to our audited consolidated financial statements and notes thereto for further discussion on our investment funds that meet the criteria for consolidation and the accounting treatment for them.
123
Table of Contents
The following table illustrates our consolidated VIE positions as of the dates indicated (dollars in millions):
| September 30, 2016 | December 31, 2015 | December 31, 2014 | ||||||||||||||||||||||
| Carrying Value |
Percent of Total |
Carrying Value |
Percent of Total |
Carrying Value |
Percent of Total |
|||||||||||||||||||
| Assets of consolidated VIEs |
||||||||||||||||||||||||
| Investments |
||||||||||||||||||||||||
| AFS securities |
||||||||||||||||||||||||
| Equity securities |
$ | 143 | 16.9% | $ | — | —% | $ | — | —% | |||||||||||||||
| Trading securities |
||||||||||||||||||||||||
| Fixed maturity securities |
51 | 6.0% | 722 | 45.4% | 763 | 20.3% | ||||||||||||||||||
| Equity securities |
90 | 10.6% | 309 | 19.4% | 510 | 13.6% | ||||||||||||||||||
| Loans held for investment |
— | —% | — | —% | 2,071 | 55.1% | ||||||||||||||||||
| Investment funds |
553 | 65.3% | 534 | 33.6% | 65 | 1.7% | ||||||||||||||||||
| Cash and cash equivalents |
4 | 0.5% | 6 | 0.4% | 10 | 0.3% | ||||||||||||||||||
| Restricted cash |
— | —% | — | —% | 43 | 1.1% | ||||||||||||||||||
| Goodwill |
— | —% | — | —% | 226 | 6.0% | ||||||||||||||||||
| Other assets |
6 | 0.7% | 20 | 1.2% | 72 | 1.9% | ||||||||||||||||||
|
|
|
|
|
|
|
|
|
|
|
|
|
|||||||||||||
| Total assets of consolidated VIEs |
$ | 847 | 100.0% | $ | 1,591 | 100.0% | $ | 3,760 | 100.0% | |||||||||||||||
|
|
|
|
|
|
|
|
|
|
|
|
|
|||||||||||||
| Liabilities of consolidated VIEs |
||||||||||||||||||||||||
| Borrowings |
$ | — | —% | $ | 500 | 96.7% | $ | 2,017 | 96.3% | |||||||||||||||
| Other liabilities |
9 | 100.0% | 17 | 3.3% | 77 | 3.7% | ||||||||||||||||||
|
|
|
|
|
|
|
|
|
|
|
|
|
|||||||||||||
| Total liabilities of consolidated VIEs |
$ | 9 | 100.0% | $ | 517 | 100.0% | $ | 2,094 | 100.0% | |||||||||||||||
|
|
|
|
|
|
|
|
|
|
|
|
|
|||||||||||||
The assets of consolidated VIEs were $847 million, $1.6 billion and $3.8 billion as of September 30, 2016, December 31, 2015 and 2014, respectively. The decrease as of September 30, 2016 from December 31, 2015 was primarily attributed to the sale of invested assets by CMBS funds to fully settle the borrowings under their respective repurchase agreements in the third quarter of 2016. The decrease as of December 31, 2015 from 2014 was primarily attributed to the deconsolidation of MidCap Financial at the beginning of 2015.
The liabilities of consolidated VIEs were $9 million, $517 million and $2.1 billion as of September 30, 2016, December 31, 2015 and 2014, respectively. The decrease as of September 30, 2016 from December 31, 2015 was primarily attributed to the CMBS funds fully settling the borrowings under their respective repurchase agreements in the third quarter of 2016. The decrease as of December 31, 2015 from 2014 was primarily attributed to the deconsolidation of MidCap Financial at the beginning of 2015.
124
Table of Contents
The following table illustrates our investment funds, including related party positions of our non-consolidated VIEs and investment funds owned by consolidated VIEs (dollars in millions):
| September 30, 2016 | December 31, 2015 | December 31, 2014 | ||||||||||||||||||||||
| Carrying Value |
Percent of Total |
Carrying Value |
Percent of Total |
Carrying Value |
Percent of Total |
|||||||||||||||||||
| Investment funds | ||||||||||||||||||||||||
| Private equity |
$ | 262 | 11.1% | $ | 263 | 11.6% | $ | 205 | 13.8% | |||||||||||||||
| Mortgage and real estate |
112 | 4.8% | 101 | 4.5% | 99 | 6.7% | ||||||||||||||||||
| Natural resources |
5 | 0.2% | 6 | 0.3% | 9 | 0.6% | ||||||||||||||||||
| Hedge funds |
72 | 3.1% | 86 | 3.8% | 239 | 16.1% | ||||||||||||||||||
| Credit funds |
274 | 11.7% | 277 | 12.3% | 280 | 18.9% | ||||||||||||||||||
|
|
|
|
|
|
|
|
|
|
|
|
|
|||||||||||||
| Total investment funds |
725 | 30.9% | 733 | 32.5% | 832 | 56.1% | ||||||||||||||||||
|
|
|
|
|
|
|
|
|
|
|
|
|
|||||||||||||
| Investment funds - related parties |
||||||||||||||||||||||||
| Private equity - A-A Mortgage |
316 | 13.4% | 225 | 9.9% | 52 | 3.5% | ||||||||||||||||||
| Private equity |
47 | 2.0% | 36 | 1.6% | 29 | 2.0% | ||||||||||||||||||
| Mortgage and real estate |
245 | 10.4% | 234 | 10.3% | 163 | 11.0% | ||||||||||||||||||
| Natural resources |
45 | 1.9% | 46 | 2.0% | 45 | 3.0% | ||||||||||||||||||
| Hedge funds |
186 | 7.9% | 256 | 11.3% | 186 | 12.6% | ||||||||||||||||||
| Credit funds |
234 | 10.0% | 200 | 8.8% | 110 | 7.4% | ||||||||||||||||||
|
|
|
|
|
|
|
|
|
|
|
|
|
|||||||||||||
| Total investment funds - related parties |
1,073 | 45.6% | 997 | 43.9% | 585 | 39.5% | ||||||||||||||||||
|
|
|
|
|
|
|
|
|
|
|
|
|
|||||||||||||
| Investment funds - assets of consolidated VIEs |
||||||||||||||||||||||||
| Private equity - MidCap(1) |
511 | 21.7% | 482 | 21.3% | — | —% | ||||||||||||||||||
| Credit funds |
30 | 1.3% | 34 | 1.5% | 40 | 2.7% | ||||||||||||||||||
| Mortgage and real assets |
12 | 0.5% | 18 | 0.8% | 25 | 1.7% | ||||||||||||||||||
|
|
|
|
|
|
|
|
|
|
|
|
|
|||||||||||||
| Total investment funds - assets of consolidated VIEs |
553 | 23.5% | 534 | 23.6% | 65 | 4.4% | ||||||||||||||||||
|
|
|
|
|
|
|
|
|
|
|
|
|
|||||||||||||
| Total investment funds, including related parties and VIEs |
$ | 2,351 | 100.0% | $ | 2,264 | 100.0% | $ | 1,482 | 100.0% | |||||||||||||||
|
|
|
|
|
|
|
|
|
|
|
|
|
|||||||||||||
| (1) | MidCap is an underlying investment of one of our consolidated VIE investment funds. |
Overall, the total investment funds, including related parties and consolidated VIEs, were $2.4 billion, $2.3 billion and $1.5 billion as of September 30, 2016, December 31, 2015 and 2014, respectively. See “Note 4 – Variable Interest Entities” to our unaudited condensed consolidated financial statements and notes thereto and “Note 6 – Variable Interest Entities” to our audited consolidated financial statements and notes thereto for further discussion regarding how we account for our investment funds. Our investment fund portfolio is subject to a number of market related risks including interest rates and equity market risk. Interest rate risk represents the potential for changes in the investment fund’s net asset values resulting from changes in the general level of interest rates. Equity market risk represents potential for changes in the investment fund’s net asset values resulting from changes in equity markets or from other external factors which influence equity markets. We actively monitor our exposure to the risks inherent in these investments which could materially and adversely affect our results of operations and financial condition. The interest and equity market risks expose us to potential volatility in our earnings year-over-year related to these investment funds.
Funds Withheld at Interest
Funds withheld at interest represents a receivable for amounts contractually withheld by ceding companies in accordance with modified coinsurance and funds withheld reinsurance agreements in which we act as the reinsurer. Generally, assets equal to statutory reserves are withheld and legally owned by the ceding company. As of September 30, 2016, the ceding companies holding the assets pursuant to such reinsurance agreements had a financial strength rating of A- or better.
125
Table of Contents
The funds withheld at interest is comprised of the host contract and an embedded derivative. We are subject to the investment performance on the withheld assets with the total return directly impacting the host contract and the embedded derivative. Interest accrues at a risk free rate on the host receivable and is recorded as net investment income in the consolidated statements of income. The change in the embedded derivative in our reinsurance agreements are similar to a total return swap on the income generated by the underlying assets held by the ceding companies and is recorded in investment related gains (losses). Although we do not directly control the underlying investments in the funds withheld at interest, in each instance the ceding company has hired AAM to manage the withheld assets in accordance with our investment guidelines.
The following summarizes the underlying investment composition of the funds withheld at interest as of the dates indicated (dollars in millions):
| September 30, 2016 | December 31, 2015 | December 31, 2014 | ||||||||||||||||||||||
| Carrying Value |
Percent of Total |
Carrying Value |
Percent of Total |
Carrying Value |
Percent of Total |
|||||||||||||||||||
| Fixed maturity securities: |
||||||||||||||||||||||||
| U.S. state, municipal, and political subdivisions |
$ | 123 | 1.9% | $ | 118 | 3.4% | $ | 180 | 6.5% | |||||||||||||||
| Corporate |
1,807 | 28.3% | 734 | 21.1% | 419 | 15.1% | ||||||||||||||||||
| CLOs |
620 | 9.7% | 432 | 12.4% | 565 | 20.4% | ||||||||||||||||||
| ABS |
768 | 12.0% | 402 | 11.5% | 178 | 6.4% | ||||||||||||||||||
| CMBS |
275 | 4.3% | 132 | 3.8% | 112 | 4.0% | ||||||||||||||||||
| RMBS |
1,534 | 24.1% | 672 | 19.3% | 491 | 17.7% | ||||||||||||||||||
| Equity securities |
29 | 0.5% | 28 | 0.8% | 25 | 0.9% | ||||||||||||||||||
| Mortgage loans |
626 | 9.8% | 469 | 13.5% | 414 | 14.9% | ||||||||||||||||||
| Investment funds |
359 | 5.7% | 273 | 7.8% | 276 | 9.9% | ||||||||||||||||||
| Derivative assets |
42 | 0.7% | 15 | 0.4% | 24 | 0.9% | ||||||||||||||||||
| Short-term investments |
86 | 1.3% | 51 | 1.5% | — | —% | ||||||||||||||||||
| Cash and cash equivalents |
106 | 1.7% | 162 | 4.7% | 80 | 2.9% | ||||||||||||||||||
| Other assets and liabilities |
— | —% | (6) | (0.2)% | 10 | 0.4% | ||||||||||||||||||
|
|
|
|
|
|
|
|
|
|
|
|
|
|||||||||||||
| Total funds withheld at interest |
$ | 6,375 | 100.0% | $ | 3,482 | 100.0% | $ | 2,774 | 100.0% | |||||||||||||||
|
|
|
|
|
|
|
|
|
|
|
|
|
|||||||||||||
As of September 30, 2016, December 31, 2015 and 2014, we held $6.4 billion, $3.5 billion and $2.8 billion of funds withheld at interest receivables, respectively. The increase as of September 30, 2016 from December 31, 2015 was primarily due to the strong growth in deposits attributed to significant flow reinsurance business for the nine months ended September 30, 2016. The increase as of December 31, 2015 from 2014 was primarily due to the growth in deposits attributed to higher flow reinsurance business in 2015 compared to 2014.
Approximately 93.3%, 90.3% and 86.0% of the fixed maturity securities within the funds withheld at interest are investment grade by NAIC designation as of September 30, 2016, December 31, 2015 and 2014, respectively.
Derivative Instruments
We hold derivative instruments for economic hedging purposes to reduce our exposure to cash flow variability of assets and liabilities, equity market risk, interest rate risk, credit risk and foreign exchange risk. The types of derivatives we may use include interest rate swaps, foreign currency swaps and forward contracts, total return swaps, credit default swaps, variance swaps, swaptions, warrants, futures and fixed indexed options.
A presentation of our derivative instruments along with a discussion of the business strategy involved with our derivatives is included in “Note 3 – Derivative Instruments” to our unaudited condensed consolidated
126
Table of Contents
financial statements and notes thereto and “Note 5 – Derivative Instruments” to our audited consolidated financial statements and notes thereto. This includes:
| • | a comprehensive description of the derivatives instruments as well as the strategies to manage risk; |
| • | the notional amounts and estimated fair value by derivative instruments; and |
| • | impacts on the consolidated statement of net income. |
As part of our risk management strategies, management continually evaluates our derivative instrument holdings and the effectiveness of such holdings in addressing risks identified in our operations.
Invested Assets
The following summarizes our invested assets as of the dates indicated (dollars in millions):
| September 30, 2016 | December 31, 2015 | December 31, 2014 | ||||||||||||||||||||||||||||||||||||||
| U.S. and Bermuda Invested Asset Value |
Germany Invested Asset Value |
Total Invested Asset Value(1) |
Percent of Total |
U.S. and Bermuda Invested Asset Value |
Germany Invested Asset Value |
Total Invested Asset Value(1) |
Percent of Total |
Invested Asset Value(1) |
Percent of Total |
|||||||||||||||||||||||||||||||
| Corporates |
$ | 30,219 | $ | 1,851 | $ | 32,070 | 44.8% | $ | 27,677 | $ | 1,614 | $ | 29,291 | 43.7% | $ | 29,108 | 49.3% | |||||||||||||||||||||||
| CLOs |
5,960 | — | 5,960 | 8.3% | 5,648 | — | 5,648 | 8.4% | 4,286 | 7.3% | ||||||||||||||||||||||||||||||
|
|
|
|
|
|
|
|
|
|
|
|
|
|
|
|
|
|
|
|
|
|||||||||||||||||||||
| Credit |
36,179 | 1,851 | 38,030 | 53.1% | 33,325 | 1,614 | 34,939 | 52.1% | 33,394 | 56.6% | ||||||||||||||||||||||||||||||
|
|
|
|
|
|
|
|
|
|
|
|
|
|
|
|
|
|
|
|
|
|||||||||||||||||||||
| RMBS |
10,503 | — | 10,503 | 14.7% | 8,870 | — | 8,870 | 13.2% | 6,491 | 11.0% | ||||||||||||||||||||||||||||||
| Mortgage loans |
6,031 | 108 | 6,139 | 8.6% | 5,826 | 140 | 5,966 | 8.9% | 5,861 | 9.9% | ||||||||||||||||||||||||||||||
| CMBS |
2,289 | — | 2,289 | 3.2% | 1,951 | — | 1,951 | 2.9% | 3,003 | 5.1% | ||||||||||||||||||||||||||||||
| Real estate held for investment |
— | 603 | 603 | 0.8% | — | 566 | 566 | 0.8% | — | —% | ||||||||||||||||||||||||||||||
|
|
|
|
|
|
|
|
|
|
|
|
|
|
|
|
|
|
|
|
|
|||||||||||||||||||||
| Real estate |
18,823 | 711 | 19,534 | 27.3% | 16,647 | 706 | 17,353 | 25.8% | 15,355 | 26.0% | ||||||||||||||||||||||||||||||
|
|
|
|
|
|
|
|
|
|
|
|
|
|
|
|
|
|
|
|
|
|||||||||||||||||||||
| State, municipal, political subdivisions and foreign |
1,381 | 2,130 | 3,511 | 4.9% | 1,401 | 2,343 | 3,744 | 5.6% | 1,599 | 2.7% | ||||||||||||||||||||||||||||||
| Alternative investments |
3,309 | 50 | 3,359 | 4.7% | 3,441 | 54 | 3,495 | 5.2% | 3,499 | 5.9% | ||||||||||||||||||||||||||||||
| ABS |
3,643 | — | 3,643 | 5.1% | 3,504 | — | 3,504 | 5.2% | 2,771 | 4.7% | ||||||||||||||||||||||||||||||
| Short-term investments |
238 | — | 238 | 0.3% | 186 | — | 186 | 0.3% | 116 | 0.2% | ||||||||||||||||||||||||||||||
| Unit linked assets |
— | 401 | 401 | 0.6% | — | 391 | 391 | 0.6% | — | —% | ||||||||||||||||||||||||||||||
| Equity securities |
200 | 175 | 375 | 0.5% | 179 | 217 | 396 | 0.6% | 142 | 0.2% | ||||||||||||||||||||||||||||||
| U.S. government and agencies |
35 | 36 | 71 | 0.1% | 44 | — | 44 | 0.1% | 83 | 0.1% | ||||||||||||||||||||||||||||||
|
|
|
|
|
|
|
|
|
|
|
|
|
|
|
|
|
|
|
|
|
|||||||||||||||||||||
| Other investments |
8,806 | 2,792 | 11,598 | 16.2% | 8,755 | 3,005 | 11,760 | 17.6% | 8,210 | 13.8% | ||||||||||||||||||||||||||||||
|
|
|
|
|
|
|
|
|
|
|
|
|
|
|
|
|
|
|
|
|
|||||||||||||||||||||
| Cash and equivalents |
1,436 | 163 | 1,599 | 2.2% | 2,009 | 114 | 2,123 | 3.2% | 1,312 | 2.3% | ||||||||||||||||||||||||||||||
| Policy loans and other |
608 | 226 | 834 | 1.2% | 577 | 207 | 784 | 1.3% | 768 | 1.3% | ||||||||||||||||||||||||||||||
|
|
|
|
|
|
|
|
|
|
|
|
|
|
|
|
|
|
|
|
|
|||||||||||||||||||||
| Total invested assets |
$ | 65,852 | $ | 5,743 | $ | 71,595 | 100.0% | $ | 61,313 | $ | 5,646 | $ | 66,959 | 100.0% | $ | 59,039 | 100.0% | |||||||||||||||||||||||
|
|
|
|
|
|
|
|
|
|
|
|
|
|
|
|
|
|
|
|
|
|||||||||||||||||||||
| (1) | Refer to “—Key Operating and Non-GAAP Measures—Invested Assets” for the definition of invested assets. |
Our total invested assets were $71.6 billion, $67.0 billion and $59.0 billion as of September 30, 2016, December 31, 2015 and 2014, respectively. As of September 30, 2016, our total invested assets were mainly comprised of 44.8% of corporate securities, 31.3% of structured securities, 8.6% of mortgage loans and 4.7% of alternative investments. Corporate securities within our U.S. and Bermuda portfolio included $7.8 billion of private placements, which represented approximately 12% of our total U.S. and Bermuda invested assets. The increase as of September 30, 2016 from December 31, 2015 was primarily due to the strong growth in deposits attributed to significant flow reinsurance business as well as growth in our retail sales for the nine months ended September 30, 2016. The increase as of December 31, 2015 from 2014 was primarily due to the acquisition of DLD, which as of December 31, 2015 represented $5.7 billion of invested assets, growth in deposits attributed to flow reinsurance business in 2015 and the April 2015 capital raise proceeds of $1.1 billion.
In managing our business we utilize invested assets as presented in the above table. Invested assets do not correspond to the total investments, including related parties, on our consolidated balance sheets, as discussed above
127
Table of Contents
in “—Key Operating and Non-GAAP Measures.” Invested assets represent the investments that directly back our policyholder liabilities and surplus assets. We believe this view of our portfolio provides a view of the assets for which we have economic exposure. We adjust the presentation for funds withheld and modified coinsurance transactions to include or exclude the underlying investments depending on if we have the economic exposure to those assets or if that exposure has been transferred to a third party. We also de-consolidate any VIEs in order to show the net investment in the funds, which therefore are included in the alternative investments line above.
The Germany investment portfolio composition differs from the U.S. and Bermuda portfolio primarily due to the geographic location, regulatory environment and participating nature of the German products and therefore the portfolio is managed separately from our U.S. and Bermuda portfolios. The German invested assets are predominantly invested in foreign government securities, corporate fixed income securities, real estate held for investment and assets backing our unit linked policies. The German invested assets are predominantly invested in Euro-denominated securities and investments.
Invested assets are utilized by management to evaluate our investment portfolio. Invested asset figures are used in the computation of net investment earned rate, which allows us to analyze the profitability of our investment portfolio. Invested assets are also used in our risk management processes for asset purchases, product design and underwriting, stress scenarios, liquidity, and ALM.
The following summarizes our alternative investments as of the dates indicated (dollars in millions):
| September 30, 2016 | December 31, 2015 | December 31, 2014 | ||||||||||||||||||||||
| Invested Asset Value |
Percent of Total |
Invested Asset Value |
Percent of Total |
Invested Asset Value |
Percent of Total |
|||||||||||||||||||
| Credit funds | $ | 946 | 28.2% | $ | 1,135 | 32.5% | $ | 1,245 | 35.6% | |||||||||||||||
| Private equity - MidCap | 511 | 15.2% | 482 | 13.8% | 454 | 13.0% | ||||||||||||||||||
| Private equity - A-A Mortgage | 379 | 11.3% | 252 | 7.2% | 52 | 1.5% | ||||||||||||||||||
| Private equity - other | 440 | 13.1% | 430 | 12.3% | 390 | 11.1% | ||||||||||||||||||
| Mortgage and real assets | 458 | 13.6% | 408 | 11.7% | 335 | 9.5% | ||||||||||||||||||
| Hedge funds | 306 | 9.1% | 383 | 10.9% | 465 | 13.3% | ||||||||||||||||||
| Public equities | 185 | 5.5% | 270 | 7.7% | 447 | 12.8% | ||||||||||||||||||
| Natural resources and other real assets | 134 | 4.0% | 135 | 3.9% | 111 | 3.2% | ||||||||||||||||||
|
|
|
|
|
|
|
|
|
|
|
|
|
|||||||||||||
| Alternative investments | $ | 3,359 | 100.0% | $ | 3,495 | 100.0% | $ | 3,499 | 100.0% | |||||||||||||||
|
|
|
|
|
|
|
|
|
|
|
|
|
|||||||||||||
Alternative investments were $3.4 billion, $3.5 billion and $3.5 billion as of September 30, 2016, December 31, 2015 and 2014, respectively, representing 4.7%, 5.2% and 5.9% of our total invested assets portfolio as of September 30, 2016, December 31, 2015 and 2014, respectively.
Alternative investments do not correspond to the total investment funds, including related parties and VIEs, on our consolidated balance sheets. As discussed above in the invested assets section, we adjust the GAAP presentation for funds withheld and modified coinsurance and de-consolidate VIEs. We also include CLO equity tranche securities in alternative investments due to their underlying characteristics and equity-like features.
Two of our largest alternative investments are in asset originators, MidCap and A-A Mortgage, both of which, from time to time, provide us with access to assets for our investment portfolio. As of September 30, 2016, we held equity positions in MidCap of $511 million. MidCap is a leading originator of senior debt capital in the middle-market with expertise in asset-backed loans, leveraged loans, real estate loans, discount loans and venture loans. MidCap represents a unique investment in an origination platform made available to us through our relationship with Apollo. As of September 30, 2016, we held an equity position in A-A Mortgage of $379 million. A-A Mortgage’s indirect investment in AmeriHome originates RMLs and mortgage servicing rights.
128
Table of Contents
Non-GAAP Measure Reconciliations
The reconciliations to the nearest GAAP measure for operating income, net of tax is included in the “—Consolidated Results of Operations” section.
The reconciliation of AHL shareholders’ equity to AHL shareholders’ equity excluding AOCI included in the ROE excluding AOCI and operating income ROE excluding AOCI is as follows for the periods presented below (dollars in millions):
| September 30, | December 31, | |||||||||||||||||||
| 2016 | 2015 | 2015 | 2014 | 2013 | ||||||||||||||||
| Retirement Services |
$ | 4,584 | $ | 3,738 | $ | 3,974 | $ | 2,807 | $ | 1,941 | ||||||||||
| Corporate and Other |
1,569 | 1,612 | 1,625 | 1,104 | 750 | |||||||||||||||
|
|
|
|
|
|
|
|
|
|
|
|||||||||||
| Total AHL shareholders’ equity excluding AOCI |
6,153 | 5,350 | 5,599 | 3,911 | 2,691 | |||||||||||||||
| AOCI |
920 | 161 | (237 | ) | 644 | 70 | ||||||||||||||
|
|
|
|
|
|
|
|
|
|
|
|||||||||||
| Total AHL shareholders’ equity |
$ | 7,073 | $ | 5,511 | $ | 5,362 | $ | 4,555 | $ | 2,761 | ||||||||||
|
|
|
|
|
|
|
|
|
|
|
|||||||||||
The reconciliation of net investment income to net investment earnings and earned rate is as follows for the periods presented below (dollars in millions):
| Nine months ended September 30, | Years ended December 31, | |||||||||||||||||||||||||||||||||||||||
| 2016 | 2015 | 2015 | 2014 | 2013 | ||||||||||||||||||||||||||||||||||||
| Dollar | Rate | Dollar | Rate | Dollar | Rate | Dollar | Rate | Dollar | Rate | |||||||||||||||||||||||||||||||
| Retirement Services |
$ | 2,162 | 4.65% | $ | 1,897 | 4.31% | $ | 2,572 | 4.37% | $ | 2,483 | 4.26% | $ | 1,363 | 5.40% | |||||||||||||||||||||||||
| Corporate and Other |
28 | 0.53% | 21 | 1.90% | 36 | 1.38% | 55 | 5.91% | 367 | 49.25% | ||||||||||||||||||||||||||||||
|
|
|
|
|
|
|
|
|
|
|
|
|
|
|
|
|
|
|
|
|
|||||||||||||||||||||
| Total net investment earnings/earned rate |
2,190 | 4.23% | 1,918 | 4.25% | 2,608 | 4.24% | 2,538 | 4.29% | 1,730 | 6.66% | ||||||||||||||||||||||||||||||
|
|
|
|
|
|
|
|
|
|
|
|
|
|
|
|
|
|
|
|
|
|||||||||||||||||||||
| Reinsurance embedded derivative impacts |
(144 | ) | (0.28)% | (58 | ) | (0.13)% | (84 | ) | (0.15)% | (67) | (0.10)% | (156) | (0.59)% | |||||||||||||||||||||||||||
| Net VIE earnings |
43 | 0.08% | (41 | ) | (0.09)% | (67 | ) | (0.11)% | (146) | (0.25)% | (535) | (2.06)% | ||||||||||||||||||||||||||||
| Alternative investment (gain) loss |
35 | 0.07% | 2 | —% | 42 | 0.07% | (4) | (0.01)% | 22 | 0.08% | ||||||||||||||||||||||||||||||
| Other |
19 | 0.04% | 9 | 0.02% | 9 | 0.01% | 12 | 0.02% | 13 | 0.05% | ||||||||||||||||||||||||||||||
|
|
|
|
|
|
|
|
|
|
|
|
|
|
|
|
|
|
|
|
|
|||||||||||||||||||||
| Total adjustments to arrive at net investment earnings/earned rate |
(47 | ) | (0.09)% | (88 | ) | (0.20)% | (100 | ) | (0.18)% | (205) | (0.34)% | (656) | (2.52)% | |||||||||||||||||||||||||||
|
|
|
|
|
|
|
|
|
|
|
|
|
|
|
|
|
|
|
|
|
|||||||||||||||||||||
| GAAP net investment income |
$ | 2,143 | 4.14% | $ | 1,830 | 4.05% | $ | 2,508 | 4.06% | $ | 2,333 | 3.95% | $ | 1,074 | 4.14% | |||||||||||||||||||||||||
|
|
|
|
|
|
|
|
|
|
|
|
|
|
|
|
|
|
|
|
|
|||||||||||||||||||||
| Retirement Services average invested assets |
$ | 61,948 | $ | 58,672 | $ | 58,917 | $ | 58,284 | $ | 25,220 | ||||||||||||||||||||||||||||||
| Corporate and Other average invested assets |
7,120 | 1,442 | 2,567 | 923 | 745 | |||||||||||||||||||||||||||||||||||
|
|
|
|
|
|
|
|
|
|
|
|||||||||||||||||||||||||||||||
| Consolidated average invested assets |
$ | 69,068 | $ | 60,114 | $ | 61,484 | $ | 59,207 | $ | 25,965 | ||||||||||||||||||||||||||||||
|
|
|
|
|
|
|
|
|
|
|
|||||||||||||||||||||||||||||||
129
Table of Contents
The reconciliation of Retirement Services’ cost of crediting on deferred annuities to the nearest GAAP measure, and the respective rates, is as follows for the periods presented below (dollars in millions):
| Nine months ended September 30, | Years ended December 31, | |||||||||||||||||||||||||||||||||||||||
| 2016 | 2015 | 2015 | 2014 | 2013 | ||||||||||||||||||||||||||||||||||||
| Dollar | Rate | Dollar | Rate | Dollar | Rate | Dollar | Rate | Dollar | Rate | |||||||||||||||||||||||||||||||
| Retirement Services cost of crediting on deferred annuities |
$ | 755 | 1.97% | $ | 702 | 1.92% | $ | 940 | 1.92% | $ | 936 | 1.94% | $ | 491 | 2.42% | |||||||||||||||||||||||||
|
|
|
|
|
|
|
|
|
|
|
|
|
|
|
|
|
|
|
|
|
|||||||||||||||||||||
| Interest credited other than deferred annuities |
89 | 0.23% | 64 | 0.17% | 94 | 0.19% | 107 | 0.22% | 41 | 0.20% | ||||||||||||||||||||||||||||||
| FIA option costs |
(416 | ) | (1.09)% | (377 | ) | (1.03)% | (510 | ) | (1.04)% | (442 | ) | (0.92)% | (131 | ) | (0.65)% | |||||||||||||||||||||||||
| Product charges (strategy fees) |
38 | 0.10% | 23 | 0.06% | 33 | 0.07% | 11 | 0.02% | 1 | —% | ||||||||||||||||||||||||||||||
| Reinsurance embedded derivative impacts |
(21 | ) | (0.05)% | (13 | ) | (0.04)% | (18 | ) | (0.04)% | (14 | ) | (0.03)% | (13 | ) | (0.06)% | |||||||||||||||||||||||||
| Change in fair value of embedded derivatives—FIAs |
658 | 1.72% | (95 | ) | (0.25)% | 174 | 0.36% | 1,294 | 2.68% | 699 | 3.44% | |||||||||||||||||||||||||||||
| Negative VOBA amortization |
(36 | ) | (0.09)% | (51 | ) | (0.14)% | (68 | ) | (0.14)% | (73 | ) | (0.15)% | (33 | ) | (0.16)% | |||||||||||||||||||||||||
| Unit linked change in reserves |
1 | —% | — | —% | 27 | 0.06% | — | —% | — | —% | ||||||||||||||||||||||||||||||
| Other changes in interest sensitive contract liabilities |
— | —% | 20 | 0.05% | 18 | 0.04% | 3 | 0.01% | 9 | 0.04% | ||||||||||||||||||||||||||||||
|
|
|
|
|
|
|
|
|
|
|
|
|
|
|
|
|
|
|
|
|
|||||||||||||||||||||
| Total adjustments to arrive at cost of crediting on deferred annuities |
313 | 0.82% | (429 | ) | (1.18)% | (250 | ) | (0.50)% | 886 | 1.83% | 573 | 2.81% | ||||||||||||||||||||||||||||
|
|
|
|
|
|
|
|
|
|
|
|
|
|
|
|
|
|
|
|
|
|||||||||||||||||||||
| GAAP interest sensitive contract benefits |
$ | 1,068 | 2.79% | $ | 273 | 0.74% | $ | 690 | 1.42% | $ | 1,822 | 3.77% | $ | 1,064 | 5.23% | |||||||||||||||||||||||||
|
|
|
|
|
|
|
|
|
|
|
|
|
|
|
|
|
|
|
|
|
|||||||||||||||||||||
| Average account value |
$ | 51,183 | $ | 48,881 | $ | 48,956 | $ | 48,353 | $ | 20,308 | ||||||||||||||||||||||||||||||
The reconciliation of invested assets to total investments, including related parties, is as follows as of the dates indicated (dollars in millions):
| September 30, 2016 | December 31, 2015 | December 31, 2014 | ||||||||||
| Total invested assets |
$ | 71,595 | $ | 66,959 | $ | 59,039 | ||||||
|
|
|
|
|
|
|
|||||||
| Derivative assets |
1,169 | 871 | 1,842 | |||||||||
| Cash and cash equivalents (including restricted cash) |
(2,619) | (2,830) | (2,705) | |||||||||
| Accrued investment income |
(543) | (520) | (505) | |||||||||
| Payables for collateral on derivatives |
1,121 | 867 | 1,402 | |||||||||
| Reinsurance funds withheld and modified coinsurance |
392 | 214 | 1,118 | |||||||||
| VIE assets, liabilities and noncontrolling interest |
(838) | (1,073) | (1,633) | |||||||||
| AFS unrealized gain (loss) |
2,451 | (362) | 1,577 | |||||||||
| Ceded policy loans |
349 | 399 | 496 | |||||||||
|
|
|
|
|
|
|
|||||||
| Total adjustments to arrive at invested assets |
(1,482) | (2,434) | 1,592 | |||||||||
|
|
|
|
|
|
|
|||||||
| Total investments, including related parties |
$ | 73,077 | $ | 64,525 | $ | 60,631 | ||||||
|
|
|
|
|
|
|
|||||||
130
Table of Contents
The reconciliation of alternative investments within invested assets to total investment funds, including related parties and VIEs, is as follows as of the dates indicated (dollars in millions):
| September 30, 2016 | December 31, 2015 | December 31, 2014 | ||||||||||
| Alternative investments |
$ | 3,359 | $ | 3,495 | $ | 3,499 | ||||||
|
|
|
|
|
|
|
|||||||
| CLO equities included in trading securities |
(281) | (337) | (414) | |||||||||
| Investment funds within funds withheld at interest |
(358) | (273) | (320) | |||||||||
| Other investments & other assets |
(84) | (83) | (56) | |||||||||
| Net assets of the VIE, excluding investment funds |
(285) | (538) | (1,227) | |||||||||
|
|
|
|
|
|
|
|||||||
| Total adjustments to arrive at investment funds, including related parties and VIEs |
(1,008) | (1,231) | (2,017) | |||||||||
|
|
|
|
|
|
|
|||||||
| Investment funds, including related parties and VIEs |
$ | 2,351 | $ | 2,264 | $ | 1,482 | ||||||
|
|
|
|
|
|
|
|||||||
The reconciliation of reserve liabilities to total liabilities is as follows as of the dates indicated (dollars in millions):
| September 30, 2016 | December 31, 2015 | December 31, 2014 | ||||||||||
| Total reserve liabilities |
$ | 70,892 | $ | 65,271 | $ | 60,024 | ||||||
|
|
|
|
|
|
|
|||||||
| Derivative liabilities |
29 | 17 | 143 | |||||||||
| Payables for collateral on derivatives |
1,121 | 867 | 1,402 | |||||||||
| Funds withheld liability |
394 | 388 | 1,595 | |||||||||
| Other liabilities |
963 | 776 | 785 | |||||||||
| Liabilities of consolidated VIEs |
9 | 517 | 2,094 | |||||||||
| Reinsurance ceded receivables |
6,174 | 7,257 | 11,584 | |||||||||
| Policy loans ceded |
349 | 399 | 496 | |||||||||
| Other |
(5) | (1) | (1) | |||||||||
|
|
|
|
|
|
|
|||||||
| Total adjustments to arrive at reserve liabilities |
9,034 | 10,220 | 18,098 | |||||||||
|
|
|
|
|
|
|
|||||||
| Total liabilities |
$ | 79,926 | $ | 75,491 | $ | 78,122 | ||||||
|
|
|
|
|
|
|
|||||||
Liquidity and Capital Resources
Liquidity is the ability to generate sufficient cash flows to meet the cash requirements of business operations or to rebalance our investment portfolio without incurring significant costs. Funding liquidity relates to the ability to fund operations. Balance sheet liquidity reflects the ability to liquidate or rebalance the company’s balance sheet without incurring significant costs from fees, bid-offer spreads, or market impact. We manage our liquidity position by matching projected cash demands with adequate sources of cash and other liquid assets. Our principal sources of liquidity are operating cash flows and holdings of cash, cash equivalents and other readily marketable assets.
Our investment portfolio is structured to ensure a strong liquidity position over time in order to permit timely payment of policy and contract benefits without requiring asset sales at inopportune times or at depressed prices. In general, liquid assets include cash and cash equivalents, highly rated corporate bonds, unaffiliated preferred stock and unaffiliated public common stock, all of which generally have liquid markets with a large number of buyers. The carrying value of these assets as of September 30, 2016 was approximately $44.3 billion. Although our investment portfolio does contain assets that are generally considered illiquid for liquidity monitoring purposes (primarily mortgage loans, policy loans, real estate, investment funds, and affiliated common stock), there is some ability to raise cash from these assets if needed. Along with these liquid assets, in periods of economic downturn we may maintain higher cash balances than required to manage our liquidity risk and to take advantage of market dislocations as they arise. We have an additional liquidity cushion through a $1.0 billion revolving credit facility, which is undrawn as of the date hereof. In addition, through our membership in the Federal Home Loan Bank of
131
Table of Contents
Des Moines (“FHLBDM”) and the Federal Home Loan Bank of Indianapolis (“FHLBI”), we are eligible to borrow under variable rate short-term federal funds arrangements to provide additional liquidity.
We proactively manage our liquidity position to meet cash needs while minimizing adverse impacts on investment returns. We analyze our cash-flow liquidity over the upcoming 12 months under a variety of scenarios modeling potential demands on liquidity, taking into account the provisions of our policies and contracts in force, our cash flow position, and the volume of cash and readily marketable securities in our portfolio. By policy, we maintain sufficient liquidity not only to meet our cash-flow requirements over the succeeding 12-month period in a moderately severe scenario (for example, a recessionary environment), but also to have excess liquidity available to invest into potential investment opportunities created from market dislocations. We also monitor our liquidity profile under more severe scenarios.
We perform a number of stress tests and analyses to assess our ability to meet our cash flow requirements as well as the ability of our reinsurance and insurance subsidiaries to meet their collateral obligations. Among these analyses, we manage to the following ALM limits:
| • | our projected net cumulative cash flows including both new business and target levels of new investments under a “plan scenario” and a “moderately severe scenario” event are non-negative over a rolling 12-month horizon; |
| • | we hold at least $250 million in cash and cash equivalents across the group; and at least $150 million in the aggregate in securities with the following characteristics: |
| • | public corporate bonds rated A- or above; |
| • | liquid ABS (defined as prime auto, auto floorplan, Tier 1 subprime auto, auto lease, prime credit cards, equipment lease or utility stranded assets) and RMBS with weighted average lives less than three years rated A- or above; or |
| • | CMBS with weighted average lives less than three years rated AAA- or above; |
| • | we maintain assets that can be liquidated in one quarter under normal market conditions equal to 25% of the policyholder obligations that are deemed to be most liquid, which is defined as policies with a cash surrender value, no income rider, no MVA, with lower than 5% surrender charge protection and lower than 3% minimum floor guarantee, if any; and |
| • | we maintain sufficient capital and surplus at ALRe to meet collateral calls from modified coinsurance and third-party reinsurance contracts under a substantial stress event, such as the failure of a major financial institution (a “Lehman” event). |
Insurance Subsidiaries’ Liquidity
The primary cash flow sources for our insurance subsidiaries include retirement services product inflows (premiums), investment income, principal repayments on our investments, and net transfers from separate accounts and financial product deposits. Uses of cash include investment purchases, payments to policyholders for surrenders and withdrawals, policy acquisition costs, and general operating costs.
Our policyholder obligations are generally long-term in nature. However, one liquidity risk is an extraordinary level of early policyholder withdrawals. We include provisions within our annuity policies, such as surrender charges and MVAs, which are intended to protect us from early withdrawals. As of September 30, 2016, December 31, 2015 and 2014, approximately 86%, 85% and 84%, respectively of our deferred annuity liabilities were subject to penalty upon surrender. In addition, as of September 30, 2016 approximately 73% and as of each of December 31, 2015 and 2014, approximately 71% of policies contained MVAs that also have the effect of limiting early withdrawals if interest rates increase.
132
Table of Contents
Cash Flows
Our cash flows were as follows for the periods presented below (dollars in millions):
| Nine months ended September 30, | Years ended December 31, | |||||||||||||||||||
| 2016 | 2015 | 2015 | 2014 | 2013 | ||||||||||||||||
| Net income |
$ | 437 | $ | 336 | $ | 578 | $ | 478 | $ | 997 | ||||||||||
| Non-cash revenues and expenses |
531 | 401 | 471 | 121 | (588) | |||||||||||||||
|
|
|
|
|
|
|
|
|
|
|
|||||||||||
| Net cash provided by operating activities |
968 | 737 | 1,049 | 599 | 409 | |||||||||||||||
|
|
|
|
|
|
|
|
|
|
|
|||||||||||
| Sales, maturities, and repayment of investments |
9,595 | 9,280 | 14,512 | 15,855 | 11,224 | |||||||||||||||
| Purchases and acquisitions of investments |
(11,391) | (10,295) | (14,991) | (14,376) | (9,443) | |||||||||||||||
| Other investing activities |
110 | 221 | 427 | (147) | 1,224 | |||||||||||||||
|
|
|
|
|
|
|
|
|
|
|
|||||||||||
| Net cash (used in) provided by investing activities |
(1,686) | (794) | (52) | 1,332 | 3,005 | |||||||||||||||
|
|
|
|
|
|
|
|
|
|
|
|||||||||||
| Capital contributions |
1 | 1,106 | 1,116 | 305 | 82 | |||||||||||||||
| Deposits on investment-type policies and contracts |
4,189 | 2,513 | 3,460 | 3,393 | 1,880 | |||||||||||||||
| Withdrawals on investment-type policies and contracts |
(3,516) | (3,601) | (4,783) | (5,551) | (2,849) | |||||||||||||||
| Net changes of cash collateral posted for derivative transactions |
254 | (924) | (535) | 661 | (76) | |||||||||||||||
| Net proceeds and repayment of debt |
— | — | (4) | (300) | 198 | |||||||||||||||
| Consolidated VIE net borrowings |
(500) | — | — | (404) | 148 | |||||||||||||||
| Other financing activities |
132 | (104) | (165) | (432) | (124) | |||||||||||||||
|
|
|
|
|
|
|
|
|
|
|
|||||||||||
| Net cash provided by (used in) financing activities |
560 | (1,010) | (911) | (2,328) | (741) | |||||||||||||||
|
|
|
|
|
|
|
|
|
|
|
|||||||||||
| Effect of exchange rate changes on cash and cash equivalents(1) |
(2) | — | (4) | — | — | |||||||||||||||
|
|
|
|
|
|
|
|
|
|
|
|||||||||||
| Net (decrease) increase in cash and cash equivalents |
$ | (160) | $ | (1,067) | $ | 82 | $ | (397) | $ | 2,673 | ||||||||||
|
|
|
|
|
|
|
|
|
|
|
|||||||||||
| (1) | Includes cash and cash equivalents of consolidated VIEs. |
Cash flows from operating activities
The primary cash inflows from operating activities include net investment income, annuity considerations and insurance premiums. The primary cash outflows from operating activities are comprised of benefit payments, interest credited to policyholders, operating expenses and tax expenses. Our operating activities generated cash flows totaling $968 million and $737 million for the nine months ended September 30, 2016 and 2015, respectively. The increase in cash provided by operating activities in 2016 was primarily driven by the increase in net investment income. Our operating activities generated cash flows totaling $1.0 billion, $599 million and $409 million for the years ended December 31, 2015, 2014 and 2013, respectively. The increase in cash provided by operating activities in 2015 was primarily driven by the increase in net investment income. The increase in 2014 compared to 2013 was primarily attributed to the net investment income, annuity considerations and premiums over the benefits and expenses paid from the Aviva USA acquisition.
Cash flows from investing activities
The primary cash inflows from investing activities are the sales, maturities and repayments of investments. The primary cash outflows from investing activities are the purchases and acquisitions of new investments. The cash flows from investing activities reflect the reinvestment of our Aviva USA acquired investments. Our investing activities used cash flows totaling $1.7 billion and $794 million for the nine months ended September 30, 2016 and 2015, respectively. The increase in cash used from investing activities for the nine months ended September 30, 2016 was primarily attributed to $1.1 billion of primarily non-agency RMBS purchased in the third quarter of 2016. Our investing activities used cash flows totaling $52 million for the year ended December 31, 2015 and provided cash flows of $1.3 billion and $3.0 billion for the years ended December 31, 2014 and 2013, respectively. The change in cash flows from investing activities in both 2015 and 2014 reflect the reinvestment of our Aviva USA and Presidential Life Corporation acquired investments and the
133
Table of Contents
investment of $1.1 billion of capital raise proceeds during 2015. Other investing activities in 2013 benefited from the acquisition of Aviva USA, net of cash received.
Cash flows from financing activities
The primary cash inflows from financing activities are deposits on our investment-type policies, changes of cash collateral posted for derivative transactions, capital contributions and proceeds from borrowing activities. The primary cash outflows from financing activities are withdrawals on our investment-type policies, changes of cash collateral posted for derivative transactions and repayments from borrowing activities. Our financing activities provided cash flows totaling $560 million for the nine months ended September 30, 2016 and used cash flows totaling $1.0 billion for the nine months ended September 30, 2015. The increase in cash provided from financing activities in 2016 was primarily attributed to the increase in deposits in 2016 and the favorable change in cash collateral posted for derivative transactions, partially offset by capital raise proceeds drawn and funded in April 2015 and the repayment of one of our CMBS VIE funds. Our financing activities used cash flows totaling $911 million, $2.3 billion and $741 million for the years ended December 31, 2015, 2014 and 2013, respectively. The decrease in cash used in 2015 compared to 2014 was driven by the capital raise proceeds of $1.1 billion, a decrease in withdrawals for the year and the deconsolidation of MidCap Financial at the beginning of 2015 partially offset by the unfavorable change in cash collateral posted for derivative transactions. The increase in cash used in 2014 compared to 2013 was driven by higher withdrawals over deposits due to the Aviva USA acquisition in October 2013, the repayment of debt and the repayment of one of our CMBS VIE funds partially offset by the favorable change in cash collateral posted for derivative transactions.
Holding Company Liquidity
AHL is a holding company whose primary liquidity needs include the cash-flow requirements of its insurance subsidiaries to support retail annuity sales, reinsurance transactions, acquisition opportunities and new investments, and interest payments. The primary source of AHL’s cash flow is dividends from its subsidiaries, which are expected to be adequate to fund cash flow requirements based on current estimates of future obligations. As of September 30, 2016, AHL had no financial leverage.
The ability of AHL’s insurance subsidiaries to pay dividends is limited by applicable laws and regulations of the jurisdictions where the subsidiaries are domiciled as well as agreements entered into with regulators. These laws and regulations require, among other things, the insurance subsidiaries to maintain minimum solvency requirements and limit the amount of dividends these subsidiaries can pay.
Subject to these limitations, the U.S. insurance subsidiaries are permitted to pay ordinary dividends based on calculations specified under insurance laws of the relevant state of domicile, subject to prior notification to the appropriate regulatory agency. Any distributions above the amount permitted by statute in any twelve month period are considered to be extraordinary dividends, and the approval of the appropriate regulator is required prior to payment. In addition, dividends from U.S. insurance subsidiaries to AHL would result in a 30% withholding tax. Given the capital needs of AHL’s U.S. insurance subsidiaries coupled with the withholding tax, AHL does not currently plan on having the U.S. subsidiaries pay any dividends to AHL. ALV and APK (the life insurance entities of our German Group Companies) are regulated by BaFin. ALV and APK are restricted as to the payment of dividends pursuant to calculations, which are based upon the analysis of current euro swap rates against existing policyholder guarantees. As of December 31, 2015, ALV and APK did not exceed this threshold and therefore no amounts are available for distribution to AHL. As a result, dividends from ALRe are projected to be the primary source of AHL’s liquidity.
Under the Bermuda Insurance Act, ALRe is prohibited from paying a dividend in an amount exceeding 25% of the prior year’s total statutory capital and surplus, unless at least two members of ALRe’s board of directors and its principal representative in Bermuda sign and submit to the BMA an affidavit attesting that a dividend in excess of this amount would not cause ALRe to fail to meet its relevant margins. In certain instances, ALRe would also be required
134
Table of Contents
to provide prior notice to the BMA in advance of the payment of dividends. In the event that such an affidavit is submitted to the BMA in accordance with the Bermuda Insurance Act, and further subject to ALRe meeting its relevant margins, ALRe is permitted to distribute up to the sum of 100% of statutory surplus and an amount less than 15% of its total statutory capital. Distributions in excess of this amount require the approval of the BMA.
The following table summarizes the dividends and other distributions our insurance subsidiaries were permitted to pay to AHL without the need for insurance regulatory approval and without regard to any withholding tax, subject to meeting solvency requirements when applicable, during the years specified (dollars in millions):
| Years ended December 31, | ||||||||||||
| Subsidiary name (jurisdiction of domicile) | 2015 | 2014 | 2013 | |||||||||
| Athene Life Re Ltd. (Bermuda) |
$ | 3,529 | $ | 3,068 | $ | 2,776 | ||||||
| Athene Annuity & Life Assurance Company (Delaware) |
125 | 115 | 105 | |||||||||
| Athene Annuity and Life Company (Iowa) |
— | — | — | |||||||||
| Athene Life Insurance Company (Delaware) |
1 | — | — | |||||||||
| Athene Lebensversicherung (Germany) |
— | — | — | |||||||||
| Athene Pensionskasse AG (Germany) |
— | — | — | |||||||||
As of December 31, 2015, the maximum dividend that AADE could pay absent regulatory approval from the Delaware Department of Insurance was $125 million. However, another regulation requiring AADE to hold surplus outside of surplus in subsidiaries effectively limits the amount that AADE can dividend while staying in compliance with such state regulations. Pursuant to such regulations and requirements, AADE could dividend up to $65 million as of December 31, 2015. Additionally, we have agreed with the IID not to cause AAIA to pay dividends until August 15, 2018 without prior approval, therefore, we report AAIA’s dividend capacity as zero.
The maximum distribution permitted by law or contract is not necessarily indicative of an insurer’s actual ability to pay such distributions, which may be constrained by business and other considerations, such as imposition of withholding tax, the impact of such distributions on surplus, which could affect the insurer’s ratings or competitive position, the amount of premiums that can be written and the ability to pay future dividends or make other distributions. Further, state insurance laws and regulations require that the statutory surplus of our insurance subsidiaries following any dividend or distribution must be reasonable in relation to their outstanding liabilities and adequate for the insurance subsidiaries’ financial needs. Along with solvency regulations, another primary consideration in determining the amount of capital used for dividends is the level of capital needed to maintain desired financial strength ratings from rating agencies, including S&P, A.M. Best and Fitch. Given recent economic events that have affected the insurance industry, both regulators and rating agencies could become more conservative in their methodology and criteria, including increasing capital requirements for insurance subsidiaries. AHL believes its insurance subsidiaries have sufficient statutory capital and surplus, combined with additional capital available to be provided by AHL, to meet this financial strength rating objective.
Other Sources of Funding
If needed, we may seek to secure additional funding at the holding company level by means other than dividends from subsidiaries such as:
| • | by drawing on our undrawn $1.0 billion revolving credit facility; and |
| • | by pursuing future issuances of debt or equity securities to third-party investors. |
However, such additional funding may not be available on terms favorable to us or at all, depending on our financial condition or results of operations or prevailing market conditions. See “Risk Factors—Risks Relating to Our Business—We may want or need additional capital in the future, and such capital may not be available to us on favorable terms or at all due to volatility in the equity or capital markets, adverse economic conditions or our creditworthiness.”
135
Table of Contents
Membership in Federal Home Loan Bank
We are a member of the FHLBDM and the FHLBI. Membership in a Federal Home Loan Bank (“FHLB”) requires the member to purchase FHLB common stock based on a percentage of the dollar amount of advances outstanding, subject to the investment being greater than or equal to a minimum level. We owned a total of $42 million, $56 million and $62 million of FHLB common stock as of September 30, 2016, December 31, 2015 and 2014, respectively.
Through our membership in the FHLBDM and FHLBI, we are eligible to borrow under variable rate short-term federal funds arrangements to provide additional liquidity. The borrowings must be secured by eligible collateral such as mortgage loans, eligible CMBS or RMBS, government or agency securities and guaranteed loans. There were no outstanding borrowings under these arrangements as of September 30, 2016, December 31, 2015 and 2014.
On August 11, 2016 we provided notice to the FHLBI that ALIC is withdrawing its membership thereto. The FHLBI confirmed receipt of our request on the following day. Pursuant to the FHLBI’s capital plan, ALIC’s membership will be withdrawn as of the fifth anniversary of the FHLBI’s receipt of our notice. Until such time that ALIC’s membership is withdrawn, ALIC continues to have all of the rights and obligations of being a member of the FHLBI, except that with respect to some or all of the FHLBI stock that ALIC owns, we will be entitled to a lower dividend amount, to the extent that the FHLBI declares a dividend. ALIC may continue to borrow from the FHLBI, provided that without the consent of the FHLBI, the transaction must mature or otherwise terminate prior to ALIC’s withdrawal of membership.
In addition, we have issued funding agreements to the FHLB in exchange for cash advances. These funding agreements were issued in an investment spread strategy, consistent with other investment spread operations. As of September 30, 2016, December 31, 2015 and 2014, we had an aggregate of $736 million, $1.1 billion and $1.3 billion, respectively, of outstanding FHLB funding agreements. Refer to “Note 14 – Commitments and Contingencies” to our unaudited consolidated financial statements and notes thereto and “Note 20 – Commitments and Contingencies” to our audited consolidated financial statements and notes thereto for details of issued funding agreements and related collateral.
The maximum FHLB indebtedness by a member is determined by the amount of collateral pledged, and cannot exceed a specified percentage of the member’s total statutory assets dependent on the internal credit rating assigned to the member by the FHLB. As of September 30, 2016, December 31, 2015 and 2014, the total maximum borrowings under the FHLBDM facility were limited to $13.5 billion, $13.1 billion and $13.0 billion, respectively. However, our ability to borrow under the facility is constrained by the availability of assets that qualify as eligible collateral under the facility and by the Iowa Code requirement that we maintain funds equivalent to our legal reserve in certain permitted investments, from which we exclude pledged assets. Considering these limitations, we estimate that as of September 30, 2016, December 31, 2015 and 2014, we had the ability to draw up to a total of approximately $4.7 billion, $4.5 billion and $5.0 billion, respectively, inclusive of borrowings then outstanding. Drawing such amounts would have an adverse impact on AAIA’s RBC ratio, which may further restrict our ability or willingness to draw up to our estimated capacity.
Use of Captives
As a result of the Aviva USA acquisition, we acquired a captive reinsurer that was formed in 2011 and domiciled in the state of Vermont and we ceded certain liabilities to this captive reinsurer, as further discussed in “Note 11 – Closed Block” to our audited consolidated financial statements and notes thereto. The statutory reserves of the affiliated captive reinsurer are supported by a combination of funds withheld receivable assets and letters of credit issued by an unaffiliated financial institution. The reinsurance activities within the captive reinsurer are eliminated in consolidation. As discussed in “Note 18 – Statutory Requirements” to our audited consolidated financial statements and notes thereto, a prescribed practice of the state of Vermont allows the
136
Table of Contents
captive to include the face amount of issued and outstanding letters of credit in the amount of $153 million as of each of September 30, 2016, December 31, 2015 and 2014, as admitted assets in its statutory financial statements.
Recently, the NAIC and certain state insurance departments have scrutinized insurance companies’ use of affiliated captive reinsurers. It is uncertain what, if any, regulatory changes will result from this heightened scrutiny. A potential outcome, although not considered likely, is the prohibition on the continued use of captive reinsurance subsidiaries. If the use of captive reinsurance subsidiaries were discontinued, we would likely incur early termination fees with respect to the financing structure and diminished statutory capital position. The effect of potential regulatory changes regarding the use of captives on our consolidated financial condition and results of operations, although believed unlikely to be material, is uncertain at this time.
Capital Resources
As of December 31, 2015 and 2014, our U.S. insurance companies’ total adjusted capital (“TAC”), as defined by the NAIC, was $1.7 billion and $1.6 billion, respectively, and our ALRe capital as defined by the BMA, was $5.7 billion and $4.0 billion, respectively. As of December 31, 2015 and 2014, our U.S. RBC ratio was 552% and 506%, respectively, and our BSCR was 323% and 237%, respectively, all above our internal targets. Each U.S. domestic insurance subsidiary’s state of domicile imposes minimum RBC requirements that were developed by the NAIC. The formulas for determining the amount of RBC specify various weighting factors that are applied to financial balances or various levels of activity based on the perceived degree of risk. Regulatory compliance is determined by a ratio of TAC, as defined by the NAIC, to authorized control level RBC (“ACL”). Our TAC was significantly in excess of all regulatory standards and above our internal targets as of September 30, 2016, December 31, 2015 and 2014, respectively. ALRe adheres to BMA regulatory capital requirements as defined by BSCR, which sets calculations for determining MCR and ECR. As of January 1, 2016, the BMA has embedded an EBS framework as part of the Capital and Solvency Return. Although the first EBS filing is not due to be filed with the BMA until 2017 for the year ended December 31, 2016, we believe that we will continue to exceed the regulatory requirements under EBS based on trial run submissions to the BMA. As of December 31, 2015 and 2014, ALRe held the appropriate capital to adhere to these regulatory standards. Our German Group Companies adhere to the regulatory capital requirements set forth by BaFin. Our German Group Companies held the appropriate capital to adhere to these regulatory standards as of September 30, 2016. Effective January 1, 2016, our German Group Companies became subject to Solvency II MCR requirements set forth by the European Insurance and Occupational Pensions Authority (“EIOPA”). We believe that we enjoy a strong capital position in light of our risks and that we are well positioned to meet policyholder and other obligations. We also believe that our strong capital position as well as operating with excess capital provides us the opportunity to take advantage of market dislocations as they arise.
Balance Sheet and Other Arrangements
Balance Sheet Arrangements
Contractual Obligations
The following table displays our contractual obligations as of September 30, 2016 (dollars in millions):
| Payments Due by Period | ||||||||||||||||||||
| Total | Less Than 1 Year |
1-3 Years | 3-5 Years | After 5 Years | ||||||||||||||||
| Interest sensitive contract liabilities |
$ | 60,901 | $ | 5,086 | $ | 10,976 | $ | 11,047 | $ | 33,792 | ||||||||||
| Future policy benefits |
15,087 | 210 | 420 | 458 | 13,999 | |||||||||||||||
| Other policy claims and benefits |
197 | 197 | — | — | — | |||||||||||||||
| Dividends payable to policyholders |
1,225 | 7 | 24 | 27 | 1,167 | |||||||||||||||
|
|
|
|
|
|
|
|
|
|
|
|||||||||||
| Total |
$ | 77,410 | $ | 5,500 | $ | 11,420 | $ | 11,532 | $ | 48,958 | ||||||||||
|
|
|
|
|
|
|
|
|
|
|
|||||||||||
137
Table of Contents
We also have other obligations related to collateral on derivatives and investment fund commitments which have not been included in the above table as the timing and amount of both the return on the collateral and the fulfillment of the commitments are uncertain. See “Note 14 – Commitments and Contingencies” to our unaudited condensed consolidated financial statements and notes thereto and “Note 20 – Commitments and Contingencies” to our audited consolidated financial statements and notes thereto for further discussion on the investment fund commitments.
Other
In the normal course of business, we invest in various investment funds which are considered VIEs, and we consolidate a VIE when we are considered the primary beneficiary of the entity. For further discussion of our involvement with VIEs, see “Note 4 – Variable Interest Entities” to our unaudited condensed consolidated financial statements and notes thereto and “Note 6 – Variable Interest Entities” to our audited consolidated financial statements and notes thereto.
Off Balance Sheet Arrangements
Collateral for Derivatives
We enter into derivatives for risk management purposes. We hold non-cash collateral from counterparties for our derivatives, which has not been recorded on our consolidated balance sheets. These amounts were $35 million, $57 million and $351 million as of September 30, 2016, December 31, 2015 and 2014, respectively.
Collateral for Reinsurance
We hold collateral for and provide collateral to counterparties for our reinsurance agreements. We held $53 million, $62 million and $76 million as of September 30, 2016, December 31, 2015 and 2014, respectively, of collateral on behalf of our reinsurers. As of September 30, 2016, December 31, 2015 and 2014, our reinsurers held collateral of $5 million, $6 million and $6 million, respectively, on our behalf.
Critical Accounting Estimates and Judgments
The preparation of consolidated financial statements in conformity with GAAP requires us to make estimates and assumptions that affect the reported amounts of assets and liabilities, disclosure of any contingent assets and liabilities at the date of the consolidated financial statements and the reported amounts of revenues and expenses during the reporting period. Amounts based on such estimates involve numerous assumptions subject to varying and potentially significant degrees of judgment and uncertainty, particularly related to the future performance of the underlying business, and will likely change in the future as additional information becomes available. Critical estimates and assumptions are evaluated on an ongoing basis based on historical developments, market conditions, industry trends and other information that is reasonable under the circumstances. There can be no assurance that actual results will conform to estimates and assumptions and that reported results of operations will not be materially affected by the need to make future accounting adjustments to reflect periodic changes in these estimates and assumptions. Critical accounting estimates are impacted significantly by our methods, judgments and assumptions used in the preparation of the consolidated financial statements and should be read in conjunction with our significant accounting policies described in “Note 3 – Summary of Significant Accounting Policies” to our audited consolidated financial statements and notes thereto. The following summary of our critical accounting estimates is intended to enhance the ability to assess our financial condition and results of operations and the potential volatility due to changes in estimates.
Investments
We are responsible for the fair value measurement of certain investments presented in our consolidated financial statements. We perform regular analysis and review of our valuation techniques, assumptions and
138
Table of Contents
inputs utilized in determining fair value to evaluate if the valuation approaches are appropriate and consistently applied, and the various assumptions are reasonable. We also perform quantitative and qualitative analysis and review of the information and prices received from commercial pricing services and broker-dealers, to verify it represents a reasonable estimate of the fair value of each investment. In addition, we utilize both internally-developed and commercially-available cash flow models to analyze the reasonableness of fair values utilizing credit spread and other market assumptions, where appropriate.
Valuation of Fixed-Maturity and Equity Investments
The following table presents the fair value of fixed-maturity and equity securities, including those with related parties, by pricing source and fair value hierarchy as of September 30, 2016 (dollars in millions):
| Total | Level 1 | Level 2 | Level 3 | |||||||||||||
| AFS securities: |
||||||||||||||||
| Priced via commercial pricing services |
$ | 35,073 | $ | 99 | $ | 34,974 | $ | — | ||||||||
| Priced via independent broker-dealer quotations |
18,212 | 20 | 16,699 | 1,493 | ||||||||||||
| Priced via other methods |
306 | — | 71 | 235 | ||||||||||||
|
|
|
|
|
|
|
|
|
|||||||||
| Total AFS securities, including related parties |
53,591 | 119 | 51,744 | 1,728 | ||||||||||||
|
|
|
|
|
|
|
|
|
|||||||||
| Trading securities: |
||||||||||||||||
| Priced via commercial pricing services |
2,209 | 3 | 2,206 | — | ||||||||||||
| Priced via independent broker-dealer quotations |
706 | — | 243 | 463 | ||||||||||||
| Priced via other methods |
17 | — | — | 17 | ||||||||||||
|
|
|
|
|
|
|
|
|
|||||||||
| Total trading securities, including related parties |
2,932 | 3 | 2,449 | 480 | ||||||||||||
|
|
|
|
|
|
|
|
|
|||||||||
| Total AFS and trading securities, including related parties |
$ | 56,523 | $ | 122 | $ | 54,193 | $ | 2,208 | ||||||||
|
|
|
|
|
|
|
|
|
|||||||||
| Percent of total, including related parties |
100.0 | % | 0.2 | % | 95.9 | % | 3.9 | % | ||||||||
|
|
|
|
|
|
|
|
|
|||||||||
In addition to the table above, our consolidated VIEs have fixed-maturity and equity securities. As of September 30, 2016, our consolidated VIEs had fixed-maturity and equity securities classified in the fair value hierarchy as Level 1 of $186 million, Level 2 of $0 million, and Level 3 of $98 million.
We measure the fair value of our investments based on assumptions used by market participants in pricing the assets, which may include inherent risk, restrictions on the sale or use of an asset, or nonperformance risk. The estimate of fair value is the price that would be received to sell an investment in an orderly transaction between market participants in the principal market, or the most advantageous market in the absence of a principal market, for that investment. Market participants are assumed to be independent, knowledgeable, able and willing to transact an exchange while not under duress. The valuation of investments involves considerable judgment, is subject to considerable variability and is revised as additional information becomes available. As such, changes in, or deviations from, the assumptions used in such valuations can significantly affect our consolidated financial statements. Financial markets are susceptible to severe events evidenced by rapid depreciation in investment values accompanied by a reduction in asset liquidity. Our ability to sell investments, or the price ultimately realized for investments, depends upon the demand and liquidity in the market and increases the use of judgment in determining the estimated fair value of certain investments. Accordingly, estimates of fair value are not necessarily indicative of the amounts that could be realized in a current or future market exchange.
As of September 30, 2016, fixed-maturity securities, including those with related parties, totaled $55.7 billion. For fixed-maturity securities, we obtain the fair values, when available, based on quoted prices in active markets that are regularly and readily obtainable. Generally, these are liquid investments and the valuation does not require significant management judgment. When quoted prices in active markets are not available, fair value is based on market standard
139
Table of Contents
valuation techniques, giving priority to observable inputs. We obtain the fair value for most marketable bonds without an active market from several commercial pricing services. The pricing services incorporate a variety of market observable information in their valuation techniques, including benchmark yields, broker-dealer quotes, credit quality, issuer spreads, bids, offers, and other reference data. For certain fixed-maturity securities without an active market, an internally-developed discounted cash flow or other approach is utilized to calculate the fair value. A discount rate is used, which adjusts a market comparable base rate for securities with similar characteristics for credit spread, market illiquidity or other adjustments. The fair value of privately placed fixed-maturity securities are based on the credit quality and duration of comparable marketable securities, which may be securities of another issuer with similar characteristics. In some instances, we use a matrix-based pricing model, which considers the current level of risk-free interest rates, corporate spreads, credit quality of the issuer, and cash flow characteristics of the security. We also consider additional factors, such as net worth of the borrower, value of collateral, capital structure of the borrower, presence of guarantees, and our evaluation of the borrower’s ability to compete in its relevant market.
As of September 30, 2016, equity securities, including those with related parties, totaled $802 million. For equity securities, we obtain the fair value, when available, based on quoted market prices. Other equity securities, typically private equities or equity securities not traded on an exchange, are valued based on other sources, such as analytics or broker-dealer quotes.
Valuation of Investment Funds
Investment funds, including those with related parties, for which we elect the fair value option, are valued based on net asset value information provided by the general partner or related asset manager. Investment funds of our consolidated VIEs for which we elect the fair value option are classified as level 3 in the fair value hierarchy due to limited market activity and price transparency inherent in the market for such investments. We may apply a discount to the values reported by the investment funds of our consolidated VIEs related to the lack of marketability of the underlying investment. As of September 30, 2016, we had investment funds, including those with related parties, of $135 million and our consolidated VIEs had investment funds of $541 million carried at fair value on the consolidated balance sheet. These partnership interests usually include multiple underlying investments for which either observable market prices or other valuation methods are used to determine the fair value. Investment funds include several private equity and debt funds that typically invest in a diverse pool of investments, using investment strategies including leveraged buyouts, energy, real estate, hedge funds, mezzanine debt, and senior debt.
The underlying investments may have significant unobservable inputs for comparable multiples and weighted average cost of capital rates applied in valuation models. These inputs in isolation can cause significant increases or decreases in fair value. Specifically, the comparable multiples are multiplied by the underlying investment’s earnings before interest, tax, depreciation, and amortization to establish the total enterprise value of the underlying investments. We use a comparable multiple consistent with the implied trading multiple of public industry peers. Similarly, for certain underlying investments we may use a discounted cash flow model. An increase in the discount rate can significantly lower the fair value; a decrease in the discount rate can significantly increase the fair value. We determine the discount rate by considering the weighted average cost of capital of companies in similar industries with comparable debt to equity ratios.
Other-Than-Temporary Impairments
The evaluation of investments for OTTIs is a quantitative and qualitative process done on a case-by-case basis, which is subject to risks and uncertainties and involves significant estimates and judgments by management. Changes in the estimates and judgments used in such analysis can have a significant impact on our consolidated results of operations.
We review and analyze all investments on an ongoing basis for changes in market interest rates, credit issues, changes in business climate, management changes, litigation, government actions, and other similar
140
Table of Contents
factors. Indicators of impairment may include changes in the issuers’ credit ratings, the frequency of late payments, pricing levels, key financial ratios, financial statements, revenue forecasts and cash flow projections. We consider relevant facts and circumstances in evaluating whether a credit or interest rate-related impairment of an investment is other-than-temporary. Relevant facts and circumstances include: (1) the extent and length of time the fair value has been below cost; (2) the reasons for the decline in fair value; (3) the issuer’s financial position and access to capital; and (4) for fixed-maturity securities, our ability and intent to sell a security or whether it is more-likely-than-not we will be required to sell the security before the recovery of its cost or amortized cost which, in some cases, may extend to maturity and for equity securities, our ability and intent to hold the security for a period of time that allows for the recovery in value. An extended and severe unrealized loss position on a fixed-maturity security may not have any impact on the ability of the issuer to service all scheduled principal and interest payments. Accordingly, such an unrealized loss position may not impact our evaluation of recoverability of all contractual cash flows or the ability to recover an amount at least equal to the investment’s cost or amortized cost based on the present value of the expected future cash flows to be collected. To the extent we determine a security is deemed to be other-than-temporarily impaired, an impairment loss is recognized.
The recognition of impairment losses on equity securities are recognized in investment related gains (losses) on the consolidated statements of income. The recognition of impairment losses on fixed-maturity securities in the consolidated financial statements is dependent on the facts and circumstances related to the specific security. If we intend to sell a security or it is more-likely-than-not that we would be required to sell a security before the recovery of its cost or amortized cost, less any recorded credit loss, we recognize an OTTI in investment related gains (losses) on the consolidated statements of income for the difference between cost or amortized cost and fair value. If neither of these two conditions exists, then the recognition of the OTTI is bifurcated and we recognize the credit portion in investment related gains (losses) on the consolidated statements of income and the non-credit loss portion in AOCI on the consolidated balance sheets.
We estimate the amount of the credit loss component of a fixed-maturity security impairment as the difference between amortized cost and the present value of the expected cash flows of the security. The present value is determined using estimated cash flows discounted at the effective interest rate implicit to the security at the date of purchase or the current yield to accrete an asset-backed or floating-rate security. The techniques and assumptions for establishing the estimated cash flows vary depending on the type of security. The ABS’ cash flow estimates are based on security-specific facts and circumstances that may include collateral characteristics, expectations of delinquency and default rates, loss severity and prepayment speeds and structural support, including subordination and guarantees. The corporate fixed-maturity security’s cash flow estimates are derived from scenario-based outcomes of expected corporate restructurings or the disposition of assets using security specific facts and circumstances including timing, security interests and loss severity.
For equity method investments, we consider financial and other information provided by the investee, other known information and inherent risks in the underlying investments, as well as future capital commitments, in determining whether an impairment has occurred. Declines in value of equity method investments not expected to be recovered are reflected through impairment in other investment related gains (losses) on the consolidated statements of income.
Future Policy Benefits
The future policy benefit liabilities associated with long duration contracts include endowment contracts, term and whole-life products, accident and health, disability, and deferred and immediate annuities with life contingencies. Liabilities for non-participating long duration contracts are established using accepted actuarial valuation methods which require us to make certain assumptions regarding expenses, investment yields, mortality, morbidity, and persistency, with a provision for adverse deviation, at the date of issue or acquisition. Liabilities for participating long duration contracts are established using acceptable actuarial valuation methods, which require the use of guaranteed interest and mortality assumptions. As of September 30, 2016, the reserve
141
Table of Contents
investment yield assumptions ranged from 1.25% to 5.44% and were specific to our expected earned rate on the asset portfolio supporting the reserves. We base other key assumptions, such as mortality and morbidity, on industry standard data adjusted to align with actual company experience, if necessary. Premium deficiency tests are performed periodically using current assumptions, without provisions for adverse deviation, in order to test the appropriateness of the established reserves. If the reserves using current assumptions are greater than the existing reserves, the excess is recorded and the initial assumptions are revised.
Liabilities for Guaranteed Living Withdrawal Benefits and Guaranteed Minimum Death Benefits
We issue and reinsure deferred annuity contracts which contain GLWB and GMDB riders. We establish future policy benefits for GLWB and GMDB by estimating the expected value of withdrawal and death benefits in excess of the projected account balance and recognizing the excess proportionally over the accumulation period based on total expected assessments. The methods we use to estimate the liabilities have assumptions about policyholder behavior, which includes lapses, withdrawals and utilization of the benefit riders; mortality; and market conditions affecting the account balance growth.
Policyholder lapses and withdrawal assumptions are set at the product level by grouping individual policies sharing similar features and guarantees and reviewed periodically against experience. Base lapse rates consider the level of surrender charges and are dynamically adjusted based on the level of current interest rates relative to the guaranteed rates and the amount by which any rider guarantees are in a net positive position. Rider utilization assumptions consider the number and timing of policyholders electing the riders. We track this assumption as experience emerges and update our assumption as experience deviates. Mortality assumptions are set at the product level and generally based on standard industry tables, adjusted for historical experience and a provision for mortality improvement. Projected guaranteed benefit amounts in excess of the underlying account balances are considered over a range of scenarios in order to capture our exposure to the guaranteed withdrawal and death benefits.
The assessments used to accrue liabilities are based on interest margins, rider charges, surrender charges and realized gains (losses). As such, future reserve changes are sensitive to changes in investment results and the impacts of shadow adjustments, which represent the impact of assuming unrealized gains (losses) are realized in future periods. As of September 30, 2016, the GLWB and GMDB liability balance, including the impacts of shadow adjustments, totaled $1.9 billion. The increase (decrease) to the GLWB and GMDB liability balance, including the impacts of shadow adjustments, as of September 30, 2016, from hypothetical changes in projected assessments, changes in the discount rate and annual equity growth is summarized in the following table (dollars in millions):
| +10% assessments |
$ | (77) | ||
| -10% assessments |
88 | |||
| +100 bps discount rate |
78 | |||
| -100 bps discount rate |
(89) | |||
| 1% lower annual equity growth |
36 |
Derivatives
Valuation of Embedded Derivatives on FIAs
We issue and reinsure products, primarily FIA products, or purchase investments that contain embedded derivatives. If we determine the embedded derivative has economic characteristics not clearly and closely related to the economic characteristics of the host contract, and a separate instrument with the same terms would qualify as a derivative instrument, the embedded derivative is bifurcated from the host contract and accounted for separately. Embedded derivatives are carried on the consolidated balance sheets at fair value in the same line item as the host contract. Changes in the fair value of embedded derivatives associated with FIAs are reflected in
142
Table of Contents
interest sensitive contract benefits on the consolidated statements of income. Embedded derivatives that are not clearly and closely related to the host contract within a financial asset are required to be bifurcated and recorded at fair value unless the fair value option is elected on the host contract. Under the fair value option, bifurcation of the embedded derivative is not necessary as all related gains (losses) on the host contract and derivative will be reflected within investment related gains (losses) on the consolidated statements of income.
FIA and indexed universal life insurance contracts allow the policyholder to elect a fixed interest rate return or an equity market component where interest credited is based on the performance of common stock market indices. The equity market option is an embedded derivative, similar to a call option. The benefit reserve is equal to the sum of the fair value of the embedded derivative and the host (or guaranteed) component of the contracts. The fair value of embedded derivatives is computed as the present value of benefits attributable to the excess of the projected policy contract values over the projected minimum guaranteed contract values. The projections of policy contract values are based on assumptions for future policy growth, which include assumptions for expected index credits on the next policy anniversary date, future equity option costs, volatility, interest rates, and policyholder behavior. The projections of minimum guaranteed contract values include the same assumptions for policyholder behavior as were used to project policy contract values. For contracts we issue to policyholders, the embedded derivative cash flows are discounted using a rate that reflects our own credit rating. For funds withheld reinsurance contracts, we do not use a credit spread as the funds are backed by the cedant’s collateral. The host contract is established at contract inception as the initial account value less the initial fair value of the embedded derivative and accreted over the policy’s life. The host contract accretion rate is updated each quarter so that the present value of actual and expected guaranteed cash flows is equal to the initial host value.
In general, the change in the fair value of the embedded derivatives will not directly correspond to the change in fair value of the hedging derivative assets. The derivatives are intended to hedge the index credits expected to be granted at the end of the current term, typically one year. The options valued in the embedded derivatives represent the rights of the policyholder to receive index credits over the entire period the FIAs are expected to be in-force, which are typically much longer than the current term of the options. From an economic basis we believe it is suitable to hedge with options that align with index terms of our FIA products because policyholder accounts are credited with index performance at the end of each index term. However, because the “value of an embedded derivative” in an FIA contract is longer-dated, there is a duration mismatch which may lead to mismatches for accounting purposes.
The most sensitive assumption in determining policy liabilities for FIAs is the vector of rates used to discount the excess projected contract values. The change in risk free rates is expected to drive most of the movement in the discount rates between periods. Changes to credit spreads for a given credit rating as well as any change to our credit rating requiring a revised level of non-performance risk would also be factors in the changes to the discount rate. If the discount rates used to discount the excess projected contract values were to fluctuate, there would be a resulting change in reserves for FIAs recorded through the consolidated statements of income.
As of September 30, 2016, we had embedded derivative liabilities classified as Level 3 in the fair value hierarchy of $5.3 billion. As of September 30, 2016, the increase (decrease) to the embedded derivatives on FIA products from hypothetical changes in discount rates is summarized in the following table (dollars in millions):
| +100 bps discount rate |
$ | (410 | ) | |
| -100 bps discount rate |
464 |
However, these estimated effects do not take into account potential changes in other variables, such as equity price levels and market volatility, which can also contribute significantly to changes in carrying values. Therefore, the table does not necessarily reflect the ultimate impact on the consolidated financial statements under the discount rate variance scenarios presented above. In determining the ranges, we have considered current market conditions, as well as the market level of discount rates that can reasonably be anticipated over
143
Table of Contents
the near-term. For additional information regarding sensitivities to the embedded derivative balance, see “—Quantitative and Qualitative Disclosures about Market Risks.”
Valuation of Embedded Derivatives in Modified Coinsurance or Funds Withheld
Reinsurance agreements written on a modified coinsurance or funds withheld basis contain embedded derivatives. Based on the terms of our modified coinsurance and funds withheld agreements, we have identified these embedded derivatives as total return swaps with a floating rate leg. The fair value of these embedded derivatives is equal to the unrealized gain or loss on the underlying asset portfolios plus the fair value of derivative assets, if any, included in the underlying portfolios.
Valuation of Derivative Contracts
Derivative contracts can be exchange-traded or OTC. Exchange-traded derivative contracts (for example, futures) typically fall within Level 1 of the fair value hierarchy depending on trading activity. OTC derivative contracts (for example, swaps) are valued using valuation models or an income approach using third-party broker-dealer valuations. Valuation models require a variety of inputs, including contractual terms, market prices, yield curves, credit curves, measures of volatility, prepayment rates, and correlation of the inputs. We consider and incorporate counterparty credit risk in the valuation process through counterparty credit rating requirements and monitoring of overall exposure. We also evaluate and include our own nonperformance risk in valuing derivative liabilities. The majority of our derivatives trade in liquid markets; therefore, we can verify model inputs and model selection does not involve significant judgment. As of September 30, 2016, we had derivative contract assets classified in the fair value hierarchy as Level 1 of $8 million, Level 2 of $1,161 million and Level 3 of $0 million. As of September 30, 2016, we had derivative contract liabilities classified in the fair value hierarchy as Level 1 of $0 million, Level 2 of $21 million and Level 3 of $8 million.
Deferred Acquisition Costs, Deferred Sales Inducements, and Value of Business Acquired
Costs relating to direct and successful efforts of acquiring new business are deferred to the extent they are recoverable from future premiums or gross profits. These costs consist of commissions and policy issuance costs, as well as sales inducements credited to policyholder account balances. We adjust the DAC, DSI and VOBA balances due to the other comprehensive income effects of net unrealized investment gains (losses) on AFS securities. We perform periodic tests to determine if the deferred costs remain recoverable, including at issue. If financial performance significantly deteriorates to the point where a premium deficiency exists, then we record a cumulative charge to the current period. Each reporting period, we update estimated gross profits with actual gross profits as part of the amortization process for the interest sensitive policies. We also periodically revise the key assumptions used in the calculation of the amortization of DAC, which results in revisions to the estimated future gross profits. The effects of changes in assumptions are recorded as unlocking in the period in which the changes are made.
Deferred costs related to interest sensitive life and investment-type policies, with significant revenue streams from sources other than investment of the policyholder funds, are amortized over the lives of the policies, in relation to the present value of gross profits including investment spread margins, surrender charge income, policy administration, changes in the GLWB and GMDB reserves, and realized gains (losses) on investments. Current period gross profits for FIAs also include the impact of amounts for the change in fair value of the derivatives and the change in fair value of the embedded derivatives. Estimates of the future gross profits are based on assumptions using accepted actuarial methods.
Current period amortization includes retrospective adjustments when actual gross profits and margins differ from prior estimates and may include further adjustments due to revisions of estimates of future gross profits and margins. Our estimates of future gross profits and margins are based on assumptions using accepted actuarial methods related to policyholder behavior and mortality, yields on investments supporting the liabilities, future
144
Table of Contents
interest credited amounts (including indexed related credited amounts on FIA products), surrender and other policy charges as applicable, and the level of expenses necessary to maintain the policies over their entire lives. Revisions to the gross profits are made each period based on historical results and also periodically through changing our assumptions to reflect our estimate of future experience.
We establish VOBA for insurance contract blocks assumed with the acquisition of insurance entities. The fair value of the liabilities purchased is determined using market participant assumptions at the time of acquisition and represents the amount an acquirer would expect to be compensated to assume the contracts. We record the fair value of the liabilities assumed in two components: reserves and VOBA. Reserves are established using our best estimate assumptions, as previously discussed in future policy benefits. VOBA is the difference between the fair value and the reserves. VOBA can be either positive or negative. For interest sensitive life and investment-type contracts, any negative VOBA is recorded in interest sensitive contract liabilities on the consolidated balance sheets. For long duration and insurance contracts, any negative VOBA is recorded as part of future policy benefits on the consolidated balance sheets. Positive VOBA is recorded in DAC, DSI and VOBA on the consolidated balance sheets. VOBA associated with funding agreements and immediate annuity contracts classified as investment contracts is amortized using the interest method. VOBA associated with immediate annuity contracts classified as long-duration contracts is amortized at a constant rate in relation to net policyholder liabilities. For accumulation products, which include interest-sensitive life and investment-type contracts with significant non-investment sources of revenue, VOBA is amortized in relation to the present value of estimated gross profits using methods consistent with those used to amortize DAC. Negative VOBA is amortized at a constant rate in relation to applicable net policyholder liabilities.
Estimated future gross profits vary based on a number of factors, but are typically most sensitive to changes in investment spread margins, which are the most significant component of gross profits. If estimated gross profits for all future years on business in-force were to change, including the impacts of shadow adjustments, there would be a resulting increase or decrease to the balances of DAC, DSI and VOBA recorded as an increase or decrease to amortization of DAC, DSI, and VOBA on the consolidated statements of income or AOCI.
Actual gross profits will depend on actual margins, including the changes in the value of embedded derivatives. The most sensitive assumption in determining the value of the embedded derivative is the vector of rates used to discount the excess projected contract values. If the discount rates used to discount the excess projected contract values were to change, there would be a resulting increase or decrease to the balances of DAC, DSI and VOBA recorded as an increase or decrease in amortization of DAC, DSI, and VOBA on the consolidated statements of income.
As of September 30, 2016, DAC, DSI and VOBA totaled $2.7 billion. As of September 30, 2016, the increases (decreases) to DAC, DSI and VOBA from hypothetical changes in estimated future gross profits and the embedded derivative discount rate are summarized in the following table (dollars in millions):
| DAC | DSI | VOBA | Total | |||||||||||||
| +10% estimated future gross profits |
$ | 20 | $ | 9 | $ | 50 | $ | 79 | ||||||||
| -10% estimated future gross profits |
(24 | ) | (11 | ) | (57 | ) | (92 | ) | ||||||||
| +100 bps discount rate |
(35 | ) | (18 | ) | (42 | ) | (95 | ) | ||||||||
| -100 bps discount rate |
41 | 21 | 47 | 109 | ||||||||||||
Stock-based Compensation
We have adopted various stock-based compensation plans in order to align incentive compensation to our employees and directors, and employees of AAM with the long term performance of our company. For more information regarding such stock-based compensation plans, refer to “Note 9– Common Stock” to our unaudited condensed consolidated financial statements and notes thereto and “Note 14 – Stock-based Compensation” to our audited consolidated financial statements and notes thereto, and for more information regarding our relationship
145
Table of Contents
with AAM, refer to “Note 13– Related Parties” to our unaudited condensed consolidated financial statements and notes thereto and “Note 19 – Related Parties” to our audited consolidated financial statements and notes thereto. Under these stock-based compensation plans, we may issue non-qualified share options, rights to purchase shares, restricted shares, restricted stock units (“RSUs”), and other awards which may be settled in, or based upon, our Class A common shares.
We have issued Class M common shares and RSUs, which will be settled in Class A common shares assuming that such RSUs are exchanged for Class A common shares upon payment of a conversion price, to employees in association with and following each of four capital raise transactions undertaken since our inception in order to align management and employee incentives with shareholder investments. Under the terms of the plans, a portion of the Class M common shares and RSUs is subject to time-based vesting conditions (Tranche 1), and the remainder is subject to vesting conditions based on the proceeds realized or deemed to be realized by certain holders of our Class A common shares, as defined in each incentive plan (the “Relevant Investors”) (Tranche 2), except for the Tranche 2 Class M-1, M-2, and M-3 common shares, which became fully vested upon modification. Both Tranche 1 and Tranche 2 RSUs require an initial public offering as an additional vesting condition.
We recognize the fair value of stock-based compensation over a participant’s requisite service period through a charge to compensation expense and a corresponding entry to equity or a liability based on the vesting criteria and other pertinent terms of the awards. The compensation expense for Tranche 1 Class M common shares is generally recognized ratably over the vesting period. The compensation expense for Tranche 2 Class M common shares, other than those vested upon modification, is recognized based on a combination of the probability of the Relevant Investors achieving certain performance hurdles and the assumed period to attain those performance hurdles. Additionally, certain Class M-4 common shares were issued with performance hurdles based on the price of our Class A common shares attaining certain targets following an initial public offering. For Tranche 2 of these Class M-4 common shares, for which performance hurdles are entirely contingent on the completion of our initial public offering, expense recognition will commence upon initial public offering completion. Changes in our estimates and assumptions, including the number of stock awards that ultimately vest, may cause us to realize material changes in stock-based compensation expense in the future.
Our stock-based compensation plans also allow for the purchase by certain of our employees and directors and our affiliates of Class A common shares at either fair market value or a discounted price as approved by our compensation committee. Additionally, we may issue restricted Class A common shares to management and our affiliates. Class A common shares are accounted for as equity awards and the related compensation expense is recognized ratably over the vesting period, if any. The compensation expense for Class A common shares is calculated based on the grant date fair value of the Class A common shares less the purchase price, multiplied by the number of shares awarded.
Valuation Methodology and Assumptions
We determine the fair value of the Class M common shares using the Black-Scholes option pricing model, with application of a Monte Carlo simulation to determine the value of the Tranche 2 Class M common shares. The Monte Carlo simulation uses a statistical formula underlying the Black-Scholes model and binomial formulas, and is further described under “—Tranche 2 Vesting Estimate” below.
To estimate an award’s fair value using the Black-Scholes option pricing model, it is necessary to develop assumptions of the fair value of the underlying common stock at the date of grant, expected term, expected volatility, expected dividend yield and the risk-free interest rate. The expected term and expected volatility assumptions are generally the most sensitive of the assumptions in the Black-Scholes model with variability in these assumptions having a more significant impact on the award’s fair value than the assumptions on the expected dividend yield or risk-free interest rate, if all other assumptions are held equal. We have assumed no dividends as we have not declared any common stock dividends to date and do not expect to declare common
146
Table of Contents
stock dividends in the near future. The risk-free interest rate is derived from the U.S. Constant Maturity Treasury yield at the valuation date, with maturity corresponding to the weighted-average expected term. In addition, we have made assumptions concerning forfeitures and the probability that certain vesting conditions will be met.
Common Stock Valuations
Due to the absence of an active market for our common stock, estimating the fair value of the underlying shares can be highly complex and subjective. We base the fair value of our common stock on recent or anticipated transactions. If no such transactions are available, we estimate the fair value using a market multiple of our book value, excluding AOCI, and take into account any expected dilution factors. The market multiple assumption is developed using market multiples of comparable publicly-traded companies. Additional valuation methodologies may be utilized to assess the reasonableness of the fair value. Once our common shares become publicly traded upon the consummation of this offering, estimating the fair value of our common shares will no longer be necessary.
Expected Term
The Black-Scholes model uses a single input for the award’s expected term (the weighted average expected term), the anticipated time period between the valuation date and the exercise date or post-vesting cancellation date, to estimate an employee award’s fair value. Developing the expected term assumption is highly subjective as employees may exercise options at widely varying times. A change in the expected term may have a significant effect on the fair value of the award.
We estimate the weighted-average expected term of the Tranche 2 Class M common shares based on the weighted-average time to an expected liquidity event, such as an initial public offering or other Relevant Investor sale, according to the terms of the Class M common shares and including an assumption as to expected employee exercise behavior after such liquidity event. As of September 30, 2016, we estimated the remaining weighted-average expected term to be 3.08 years.
Expected Volatility
Volatility is a statistical measurement of the magnitude of stock’s price variance over a given historical period and is used to determine the expected variability of the returns on a company’s stock. Volatility may have a significant impact on the fair value of a share-based event. Given that a more volatile stock has greater upside potential than a less volatile stock, an award tied to a high volatility stock has greater value than an award tied to a low-volatility stock, assuming all other assumptions are equal.
Absent a public market for our shares, we have historically estimated volatility of our share price based on the published historical volatilities of publicly-traded insurance company peers with adjustments to ensure comparability, primarily related to leverage. As of September 30, 2016, we estimated the expected volatility to be 28.0%.
Pre-Vesting Forfeitures
In determining our pre-vesting forfeiture assumption we considered employee classification, economic environment, and historical experience. Based on these considerations, we estimate that 5% of the granted Class M common shares will have been forfeited at the end of the vesting period. We expect the number of vesting shares, as a percent of total shares granted, to decrease each year, with the lowest vesting percentage to occur in year five. As such, an annual forfeiture rate of 1.7% was determined to result in the overall 5% forfeiture rate for the entire vesting life. Changes in assumptions used to estimate the forfeiture rate could have a significant impact of the amount and timing of the compensation expense recognized in each period.
Tranche 2 Vesting Estimate
The Tranche 2 Class M-4 common shares include vesting assumptions developed using a Monte-Carlo simulation. The Monte-Carlo simulation uses large samples of possible outcomes through a randomly generated
147
Table of Contents
process that reflects the proportional distribution of each outcome’s probability and formula-based rules regarding the expected exercise patterns to generate the possible future value of the shares at a liquidity event. The fair value of the Tranche 2 Class M-4 common shares is then estimated by averaging the value for all simulated paths and discounting the results at the risk-free interest rate to the valuation date. In developing this estimate using a Monte-Carlo simulation it is critical that an appropriately large sample of possible outcomes is used. We are currently running 100,000 scenarios of our equity value.
Consolidation
We consolidate all entities in which we hold a controlling financial interest as of the financial statement date whether through a majority voting interest or otherwise, including those investment funds that meet the definition of a VIE in which we are determined to be the primary beneficiary. If we are not the primary beneficiary, generally the general partner or another limited partner consolidates the investment fund, and we record the investment as an equity-method investment. Refer to “Note 4– Variable Interest Entities” to our unaudited condensed consolidated financial statements and notes thereto and “Note 6 – Variable Interest Entities” to our audited consolidated financial statements and notes thereto.
The determination as to whether an entity qualifies as a VIE depends on the underlying facts and circumstances surrounding each entity.
Our assessment of whether an entity is a VIE and the determination of whether we should consolidate such VIE may require significant judgment. Those judgments include, but are not limited to: (1) determining whether the total equity investment at risk is sufficient to permit the entity to finance its activities without additional subordinated financial support; (2) evaluating whether the holders of the equity investment at risk, as a group, can make decisions that have a significant effect on the success of the entity; (3) determining whether two or more parties’ equity interests should be aggregated; (4) determining whether the equity investors have proportionate voting rights to their obligations to absorb losses or rights to receive the expected residual returns from an entity; and (5) evaluating the nature of the relationship and activities of the parties involved in determining which party within a related-party group is most closely associated with the VIE in situations where related parties share power or are under common control. Judgments are also made in determining whether we, as a member in the equity group have a controlling financial interest, including power to direct activities that most significantly impact the VIE’s economic performance and rights to receive benefits or obligations to absorb losses that could be potentially significant to the VIE. This analysis includes any interests we may have through related parties.
In addition, whether fees paid to the decision maker in the VIE are customary and commensurate with the level of services provided impacts whether the decision maker holds a variable interest, after factoring in all other economic interests including proportionate interests through related parties. Since Apollo is an affiliate and often is the decision maker for VIEs in which we have invested, this determination can be significant to our consolidation conclusion.
Determining which party is more closely associated with an entity is only performed when the related party group that has a controlling financial interest, shares power or is under common control. When the related party group holding a controlling financial interest is not under common control, then we would only be deemed to be the primary beneficiary if substantially all the activities of the entity are performed on our behalf. There is also judgment involved in the determination of whether substantially all of the activities of a VIE investment are conducted on our behalf. This assessment is primarily qualitative and focused on relationships between us and the investment fund being evaluated, but also includes an analysis of the quantitative impacts of the investment fund on the economics we receive.
Additionally, determining whether a VIE meets the criteria of an investment company is qualitative in nature and may involve significant judgment. The significance of this distinction relates to whether the investment fund retains the specialized accounting afforded investment companies.
148
Table of Contents
To be deemed an investment company an entity must, at a minimum, meet the following fundamental criteria: (1) obtain funds from one or more investors and provides the investor(s) with defined investment management services, (2) commit to its investor(s) that its business purpose and only substantive activities are investing funds solely for returns from capital appreciation, investment income, or both, and (3) it or its affiliates do not obtain or have the objective of obtaining returns or benefits from an investee or its affiliates that are not normally attributable to ownership interests or that are other than capital appreciation or investment income.
If the three fundamental characteristics are met, we evaluate whether the entity possesses some or all of the following typical characteristics that are generally associated with an investment company: (1) has more than one investment, (2) has more than one investor, (3) has investors that are not related parties of the parent entity (if there is a parent) and the investment manager, (4) has ownership interests in the form of equity or partnership interests, and (5) manages substantially all of its investments on a fair value basis. Lacking one or more of these characteristics does not preclude an entity from being considered an investment company. All relevant facts and circumstances are taken into consideration in making a final determination.
Income Taxes
In determining our income taxes, management is required to interpret complex income tax laws and regulations. We are subject to examinations by federal, state, local and foreign income tax authorities that may give rise to different interpretations of these complex laws and regulations. Due to the nature of the examination process, it generally takes years before these examinations are completed and these matters are resolved. We recognize the tax benefit from an uncertain tax position only if it is more-likely-than-not that the tax position will be sustained on examination by the relevant taxing authorities based on the technical merits of our position. The aggregate amount of any additional income tax liabilities that may result from these examinations, if any, is not expected to have a material impact on our consolidated financial results. For more information regarding income taxes, refer to “Note 12 – Income Taxes” to our unaudited condensed consolidated financial statements and notes thereto and “Note 17 – Income Taxes” to our audited consolidated financial statements and notes thereto.
Accounting for income taxes represents our estimate of various events and transactions based on management’s judgment and interpretation of the laws and regulations enacted as of the reporting date. Deferred tax assets and liabilities resulting from temporary differences between the financial reporting and tax basis of assets and liabilities are measured at the balance sheet date using enacted tax rates expected to apply to taxable income in the years the temporary differences are expected to reverse. We routinely evaluate the likelihood of realizing the benefit of our deferred tax assets and may record a valuation allowance if, based on all available evidence, we determine that it is more-likely-than-not some portion of the tax benefit will not be realized. We have deferred tax assets primarily related to reserve valuation differences, net operating losses, DAC and employee benefit plans. On a quarterly basis, we test the value of deferred tax assets for impairment at the taxpaying-component level within each tax jurisdiction. Significant judgment and estimates are required in determining whether valuation allowances should be established as well as the amount of such allowances. When making such determination, consideration is given to, among other things, the following:
| • | sufficient taxable income within the allowed carryback or carryforward periods; |
| • | future reversals of existing taxable temporary differences, including any tax planning strategies that could be utilized; |
| • | nature or character (e.g., ordinary vs. capital) of the deferred tax assets and liabilities; and |
| • | future taxable income exclusive of reversing temporary differences and carryforwards. |
We may be required to change the provision for income taxes in certain circumstances. Examples of such circumstances include when the ultimate deductibility of certain items is challenged by taxing authorities, when it becomes clear that certain items will not be challenged, when forecasted results used in determining valuation allowances on deferred tax assets significantly change, or when receipt of new information indicates the need for
149
Table of Contents
adjustment in valuation allowances. Additionally, future events such as changes in tax legislation could have an impact on the provision for income tax and the effective tax rate. Any such changes could significantly affect the amounts reported in our consolidated financial statements in the period to which these changes apply.
We have not provided for withholding taxes on undistributed earnings of our U.S. and German subsidiaries on our consolidated financial statements as of September 30, 2016. Although withholding taxes may apply in the event a dividend is paid by our U.S. or German subsidiaries, we have not accrued withholding taxes as we do not intend to remit these earnings. The cumulative amount subject to withholding tax, if distributed, as well as the determination of the associated tax liability, is not practicable to compute; however, it may be material to our consolidated financial condition and results of operations. Any dividends remitted to AHL from ALRe are not subject to withholding tax.
Impact of Recent Accounting Pronouncements
For a discussion of new accounting pronouncements affecting us, refer to “Note 1 – Business, Basis of Presentation, and Significant Accounting Policies” to our unaudited condensed consolidated financial statements and notes thereto and “Note 3 – Summary of Significant Accounting Policies” to our audited consolidated financial statements and notes thereto.
Quantitative and Qualitative Disclosures About Market Risks
Risk Management Framework
The function of our risk management framework is to identify, assess and prioritize risks to ensure that both senior management and the board of directors understand our risk profile. The processes supporting risk management are designed to ensure that our risk profile is consistent with our stated risk appetite and that we maintain sufficient capital to support our corporate plan while meeting the requirements imposed by our policyholders, shareholders, and regulators. Risk management strives to enable us to maximize the value of our existing business platform to shareholders, preserve our ability to realize business and market opportunities under moderately stressful market conditions, and to withstand the impact of severely adverse events.
The risk management framework includes a governance committee structure that supports accountability in current risk-based decision making, and effective risk management. Governance committees are established at three levels: the board of directors, AHL management, and subsidiary management. We utilize a host of assessment tools to monitor and assess our risk profile, results of which are shared with senior management periodically at management level committees such as the management risk committee (“MRC”) and the asset-liability committee (“ALCO”) and with the board of directors quarterly. Business management retains the primary responsibility for day-to-day management of risk. See “Risk Factors—Risks Relating to Our Business—If our risk management policies and procedures, which include the use of derivatives and reinsurance, are not adequate to protect us, we may be exposed to unidentified, unanticipated or inadequately managed risks.”
Risk Management
Risk management strives to:
| • | maximize the value of our existing business platform to shareholders; |
| • | preserve the ability to realize business and market opportunities under moderately stressful market conditions; and |
| • | position our business to withstand the impact of severely adverse events. |
The risk management team structure consists of:
| • | ERM team; |
150
Table of Contents
| • | derivatives trading team; and |
| • | asset risk team. |
The risk management team is led by the Chief Risk Officer. The Chief Risk Officer reports functionally to the board of directors, and administratively (day-to-day operations), to the President of AHL. Our risk management team is comprised of 30 dedicated, full-time employees.
Asset and Liability Management
Asset and liability risk management is a joint effort that spans business management and the entire risk management team. Processes established to analyze and manage the risks of our assets and liabilities include but are not limited to:
| • | analyzing our liabilities to ascertain their sensitivity to behavioral variations and changes in market conditions and actuarial assumptions; |
| • | analyzing interest rate risk, cash flow mismatch, and liquidity risk management; |
| • | performing scenario and stress analyses to examine their impacts on capital and earnings; |
| • | performing cash flow testing and capital modeling; |
| • | modeling the values of the derivatives embedded in our policy liabilities so that they can be effectively hedged; |
| • | hedging unwanted risks, including from embedded derivatives, interest rate exposures and currency risks; |
| • | reviewing our corporate plan and strategic objectives, and identifying prospective risks to those objectives under normal and stressed economic, behavioral and actuarial conditions; and |
| • | providing appropriate risk reports that show consolidated risk exposures from assets and liabilities as well as the economic consequences of stress events and scenarios. |
Product Development
Risk management is involved in all stages of the product development process and each newly proposed product undergoes review by our risk management team before a product may be launched. In the idea generation stage, our product, sales, legal and risk management teams discuss and screen new product ideas. Our risk management team is involved early on in the process in order to understand the risk inherent in each new product. If a product advances to the initial design stage, it undergoes preliminary pricing and model development. At this stage, our risk management team ensures the product design incorporates management levers to the extent practicable and that any potential risks are those that we believe we can properly manage. In the detailed design stage, pricing and risk analysis must be completed. Our risk management team then reviews the product’s pricing assumptions and must approve the product before it can advance to the implementation phase. At the implementation stage, our risk management team evaluates the pricing analysis and underlying assumptions (particularly assumptions with respect to economic and policyholder behavior), performs stress testing to evaluate tail risk exposure and performs further analysis to identify additional information necessary to gain a detailed understanding of the product’s capital implications. Our risk management team must provide approval again before the product can advance to the final stage. Before a new product may be launched, a detailed pricing memorandum is developed and the risk management team must provide final approval.
Market Risk and Management of Market Risk Exposures
Market risk is the risk of incurring losses due to adverse changes in market rates and prices. Included in market risk are potential losses in value due to credit and counterparty risk, interest rate risk, currency risk, commodity price risk and equity price risk. We are primarily exposed to credit risk, interest rate risk and, to a lesser extent, equity price risk.
151
Table of Contents
Credit Risk and Counterparty Risk
In order to operate our business model, which is predicated on earning spread income, which is the difference between the return on our assets and the cost of our liabilities, we must bear credit risk. However, as we assume credit risk through our investment, reinsurance and hedging activities, we endeavor to ensure that risk exposures remain diversified, that we are adequately compensated for the risks we assume and that the level of risk is consistent with our risk appetite and objectives.
Credit risk is a key risk taken in the asset portfolio, as the credit spread on our investments is what drives our spread income. We manage credit risk by avoiding idiosyncratic risk concentrations, understanding and managing our systematic exposure to economic and market conditions through stress testing, monitoring investment activity daily and distinguishing between price and default risk from credit exposures. Concentration and portfolio limits are designed to ensure that exposure to default and impairment risk is sufficiently modest so as to not represent a solvency risk to us, even in severe economic conditions.
The investment teams within AAM, which manage substantially all of our fixed income assets, except those of our German operations, focus on in-depth, bottom-up portfolio construction, and disciplined risk management. Their approach to taking credit risk is formulated based on:
| • | a fundamental view on existing and potential opportunities at the security level; |
| • | an assessment of the current risk/reward proposition for each market segment; |
| • | identification of downside risks and assigning a probability for those risks; and |
| • | establishing a plan for best execution of the investment action. |
A dedicated set of AHL risk managers, who are on-site with AAM, monitor the asset risks to ensure that such risks are consistent with our risk appetite, standards for committing capital, and overall strategic objectives. Our risk management team is also a key contributor to the OTTI/credit impairment evaluation process.
In addition to credit-risk exposures from our investment portfolio, we are also exposed to credit risk from our counterparty exposures from our derivative hedging and reinsurance activities. Derivative counterparty risk is managed by trading on a collateralized basis with counterparties under International Swaps and Derivatives Association (“ISDA”) documents with a credit support annex having low or zero dollar collateral thresholds.
We utilize reinsurance to mitigate risks that are inconsistent with our strategy or objectives. For example, we have reinsured much of the mortality risk we would otherwise have accumulated through our various acquisitions, allowing us to focus on our core annuity business. These reinsurance agreements expose us to the credit risk of our counterparties. We manage this risk to avoid counterparty risk concentrations through various mechanisms: utilization of reinsurance structures such as funds withheld or modified coinsurance so as to retain ownership of the assets and limit counterparty risk to the cost of replacing the counterparty; diversification across counterparties; and when possible, novating policies to eliminate counterparty risk altogether.
Interest Rate Risk
Significant interest rate risk may arise from mismatches in the timing of cash flows from our assets and liabilities. Management of interest rate risk at the company-wide level, and at the various operating company levels, is one of the main risk management activities in which senior management engages.
Depending upon the materiality of the risk and our assessment of how we would perform across a spectrum of interest rate environments, we may seek to mitigate interest rate risk using on-balance-sheet strategies (portfolio management) and off-balance-sheet strategies (derivative hedges such as interest rate swaps and futures). We monitor ALM metrics (such as key-rate durations and convexity) and employ quarterly cash flow testing
152
Table of Contents
requirements across all of our insurance companies to assure the asset and liability portfolios are managed to maintain net interest rate exposures at levels that are consistent with our risk appetite. We have established a set of exposure and stress limits to communicate our risk tolerance and to ensure adherence to those risk tolerance levels. Risk management personnel and the MRC are notified in the event that risk tolerance levels are exceeded. The MRC then makes a decision as to what actions, if any, should be undertaken.
Active portfolio management is performed by our investment managers at AAM, with direction from the MRC. ALM risk is also managed by the MRC. The performance of our investment portfolio managed by AAM is reviewed periodically by the MRC and the board of directors. The MRC strives to improve returns to shareholders and protect policyholders, while dynamically managing the risk within our expectations.
Equity Price Risk
Our FIAs require us to make payments to policyholders that are dependent on the performance of equity market indices. In addition, our investment portfolio can be invested in strategies involving public and private equity positions. In general, we have limited appetite for passive, public equity investments. We seek to minimize the equity risk from our liabilities by economically defeasing this equity exposure with granular, policy-level-based hedging.
The equity index hedging framework implemented is one of static core hedges with dynamic overlays. Unique policy-level liability options are matched with static OTC options. Residual risk arising from policyholder behavior and other trading constraints (for example, minimum trade size) are managed dynamically by decomposing the risk of the portfolio (asset and liability positions) into market risk measures which are managed to pre-established risk limits. The portfolio risks are measured overnight and rebalanced daily to ensure that the risk profile remains within risk appetite. Valuation is done at the position level, and risks are aggregated and shown at the level of each underlying index. Risk measures that have term structure sensitivity, such as index volatility risk, and interest rate risk, are monitored and risk managed along the term structure.
We are also exposed to equity risk in our alternative investment portfolio. The form of those investments is typically a limited partnership interest in a fund. We currently target fund investments that have characteristics resembling fixed income investments versus those resembling pure equity investments, but as holders of partnership positions, our investments are generally held as equity positions. The alternative investments are decomposed into several sub-types, including at the most liquid end of the spectrum “liquid strategies,” (which is mostly exposure to publicly traded equities), followed by “hedge funds,” “credit funds,” “private equity,” and “real assets.” Direct public equity market exposure is concentrated mostly in the liquid strategies segment.
Our investment mandate in our alternative investment portfolio is inherently opportunistic. Each investment is examined and analyzed on its own merits to gain a full understanding of the risks present, and with a view toward determining likely return scenarios, including the ability to withstand stress in a downturn. We have a strong preference for alternative investments that have the following characteristics, among others: (i) investments that constitute a direct investment or an investment in a fund with a high degree of co-investment; (ii) investments with debt-like characteristics (for example, a stipulated maturity and par value), or alternatively, investments with reduced volatility when compared to pure equity; and (iii) investments that have less downside risk.
Alternative investments are monitored in real-time across the variety of markets that they span. The alternative investment portfolio is monitored to ensure diversification across asset classes and strategy, and the portfolio’s performance under stress scenarios is evaluated routinely as part of management and board of director reviews. Since alternative investments are marked-to-market on our balance sheet, risk analyses focus on potential changes in market value across a variety of market stresses. In cases where investment performance has not met expectations, or where the balance of risk and reward has shifted against it, we will seek to exit the investment as quickly as possible, and minimize its downside exposure in doing so.
153
Table of Contents
Currency Risk
We manage our currency risk so as to maintain minimal exposure to currency fluctuations. We attempt to hedge completely the currency risk arising in our investment portfolio or FIA products. In general, we match currency exposure of assets and liabilities. When the currency denominations of the assets and liabilities do not match, we generally undertake hedging activities to eliminate or mitigate currency mismatch risk.
Scenario Analysis
We evaluate our exposure to market risk through internally defined modeling of our portfolio performance during times of economic stress. We manage our business, capital and liquidity needs to withstand stress scenarios and target capital we believe will maintain our current ratings in a moderate “recession scenario” and will remain investment grade under a substantially severe “Lehman scenario.” In the recession scenario, we calibrate recessionary shocks to several key risk factors (S&P 500, BBB corporate spreads, high yield corporate spreads, 2 year and 10 year US Treasury yields) using data from the 1991, 2001, and 2008 recessions, and estimate mark to market impacts to the various sectors in our portfolio using regression analysis of their credit spreads to the key risk factors. To estimate OTTI impacts, we use historical default, stressed recovery, and ratings migration rates from the aforementioned recessionary periods. In the Lehman scenario, we use credit spread and interest rate movements between September 12, 2008 and December 15, 2008 to estimate mark to market changes, and we use one-year default probabilities from 2008, along with stressed recovery and ratings migration rates, to estimate OTTI impacts. We review the impacts of our stress test analyses quarterly with management.
Sensitivities
Interest Rate Risk
We assess interest rate exposures for financial assets, liabilities and derivatives using hypothetical stress tests and exposure analyses. If interest rates were to increase 25 basis points from levels as of September 30, 2016, the estimated point-in-time impact to our consolidated statements of income from changes in financial instruments carried at fair value would be a decrease of $7 million. The decrease would be driven by decreases in interest sensitive security values of $108 million, partially offset by a decrease in the FIA embedded derivative liability of $85 million and an increase in derivative values of $16 million. The net decrease in fair value for these financial instruments would directly impact the gross profits and assessments used in the calculations of DAC, DSI, and VOBA amortization and GLWB and GMDB reserves, resulting in a decrease to our consolidated statements of income from movements in these balances of $21 million. The estimated impact on AOCI from such an increase in interest rates as of September 30, 2016 would be a decrease of $671 million driven by changes in securities classified as AFS, but would be partially offset by an increase in the DAC, DSI and VOBA assets and a decrease in the GLWB and GMDB reserves of $208 million due to shadow adjustments.
If a 25 basis point increase in interest rates persists over a 12-month period, the estimated impact to operating income would be an increase of $25 million. This increase is driven by an increase to investment income from floating rate assets, offset by DAC, DSI and VOBA amortizations and GLWB and GMDB reserves.
If interest rates were to decrease 25 basis points from levels as of September 30, 2016, the estimated point-in-time impact to our consolidated statements of income from changes in financial instruments carried at fair value would be an increase of $8 million. The increase would be driven by increases in interest sensitive security values of $109 million, partially offset by an increase in the FIA embedded derivative liability of $85 million and a decrease in derivative values of $16 million. The net increase in fair value for these financial instruments would directly impact the gross profits and assessments used in the calculations of DAC, DSI, and VOBA amortization and GLWB and GMDB reserves, resulting in an increase to our consolidated statements of income from movements in these balances of $22 million. The estimated impact on AOCI from such a decrease in interest rates as of September 30, 2016 would be an increase of $692 million driven by changes in securities classified as AFS, but would be partially offset by a decrease in the DAC, DSI and VOBA assets and an increase in the GLWB and GMDB reserves of $214 million due to shadow adjustments.
154
Table of Contents
If a 25 basis point decline in interest rates persists over a 12-month period, the estimated impact to operating income would be a decrease of $25 million. This decrease is driven by a decrease to investment income from floating rate assets, offset by DAC, DSI and VOBA amortizations and GLWB and GMDB reserves.
The models used to estimate the impact of a 25 basis point change in market interest rates incorporate numerous assumptions, require significant estimates and assume an immediate change in interest rates without any discretionary management action to counteract such a change. Consequently, potential changes in our valuations indicated by these simulations will likely be different from the actual changes experienced under any given interest rate scenarios and these differences may be material. Because we actively manage our assets and liabilities, the net exposure to interest rates can vary over time. However, any such decreases in the fair value of fixed maturity securities, unless related to credit concerns of the issuer requiring recognition of an OTTI, would generally be realized only if we were required to sell such securities at losses to meet liquidity needs.
Public Equity Price Risk
Assuming all other factors are constant, we estimate that a decline in public equity market prices of 10% from levels as of September 30, 2016 would cause a decrease to our consolidated statements of income from changes in financial instruments carried at fair value of $126 million. The decrease would be driven by a decrease in the value of securities and derivatives of $680 million, partially offset by a decrease in the FIA embedded derivative liability of $554 million. The net decrease in fair value for these financial instruments would directly impact the gross profits and assessments used in the calculations of DAC, DSI and VOBA amortization and GLWB and GMDB reserves, resulting in a related increase to our consolidated statements of income from movements in these balances of $42 million. The estimated impact on AOCI from such a decrease in public equity markets as of September 30, 2016 would be a decrease of $14 million driven by changes in securities classified as AFS, but would be partially offset by an increase in the DAC, DSI and VOBA assets and a decrease in the GLWB and GMDB reserves of $1 million due to shadow adjustments.
155
Table of Contents
Overview
We are a leading retirement services company that issues, reinsures and acquires retirement savings products designed for the increasing number of individuals and institutions seeking to fund retirement needs. We generate attractive financial results for our policyholders and shareholders by combining our two core competencies of (1) sourcing long-term, generally illiquid liabilities and (2) investing in a high quality investment portfolio, which takes advantage of the illiquid nature of our liabilities. Our steady and significant base of earnings generates capital that we opportunistically invest across our business to source attractively-priced liabilities and capitalize on opportunities. Our differentiated investment strategy benefits from our strategic relationship with Apollo and its indirect subsidiary, AAM. AAM provides a full suite of services for our investment portfolio, including direct investment management, asset allocation, mergers and acquisition asset diligence, and certain operational support services, including investment compliance, tax, legal and risk management support. Our relationship with Apollo and AAM also provides us with access to Apollo’s investment professionals across the world as well as Apollo’s global asset management infrastructure that, as of September 30, 2016, supported more than $188 billion of AUM across a broad array of asset classes. We are led by a highly skilled management team with extensive industry experience. We are based in Bermuda with our U.S. subsidiaries’ headquarters located in Iowa.
We began operating in 2009 when the burdens of the financial crisis and resulting capital demands caused many companies to exit the retirement market, creating the need for a well-capitalized company with an experienced management team to fill the void. Taking advantage of this market dislocation, we have been able to acquire substantial blocks of long-duration liabilities and reinvest the related investments to produce profitable returns. We have been able to generate strong financial returns in a multi-year low rate environment. We believe we have fewer legacy liability issues than our peers given that all of our retail and flow reinsurance liabilities were underwritten after the financial crisis, and the majority of the liabilities we acquired through our acquisitions and block reinsurance were acquired at a discount to book value.
We have established a significant base of earnings and as of September 30, 2016 have an expected annual investment margin of 2-3% over the 8.4 year weighted-average life of our deferred annuities, which make up a substantial portion of our reserve liabilities. Even as we have grown to $73.1 billion in investments, including related parties, $71.6 billion in invested assets and $87.0 billion of total assets as of September 30, 2016, we have continued to approach both sides of the balance sheet with an opportunistic mindset because we believe quickly identifying and capitalizing on market dislocations allows us to generate attractive, risk-adjusted returns for our shareholders. Further, our multiple distribution channels support growing origination across market environments and better enable us to achieve continued balance sheet growth while maintaining attractive profitability. We believe that in a typical market environment, we will be able to profitably grow through our organic channels, including retail, flow reinsurance and institutional products. In more challenging market environments, we believe that we will see additional opportunities to grow through our inorganic channels, including acquisitions and block reinsurance, due to market stress during those periods. We are diligent in setting our return targets based on market conditions and risks inherent to our products offered and acquisitions or block reinsurance transactions. In general, we may accept lower returns on products which may provide more certain return characteristics, such as FABN, and we may require higher returns for products or transactions where there is more inherent risk in meeting our return targets, such as with acquisitions. Generally, we target mid-teen returns for sources of organic growth and higher returns for sources of inorganic growth. If we are unable to source liabilities with our desired return profile in one of our channels, we generally will not sacrifice profitability solely for the sake of increasing market share and instead we will typically focus on our other channels to identify growth opportunities that meet our preferred risk and return profile.
As a result of our focus on issuing, reinsuring and acquiring attractively-priced liabilities, our differentiated investment strategy and our significant scale, for the nine months ended September 30, 2016 and the year ended
156
Table of Contents
December 31, 2015, in our Retirement Services segment described below, we generated an annualized investment margin on deferred annuities of 2.68% and 2.45%, respectively, an annualized operating ROE excluding AOCI of 17.5% and 22.7%, respectively, and an operating ROE excluding AOCI for the trailing twelve month period ended September 30, 2016 of 20.1%. We currently maintain what we believe to be high capital ratios for our rating and hold more than $1 billion of capital in excess of the level we believe is needed to support our current operating strategy, and view this excess as strategic capital available to reinvest into organic and inorganic growth opportunities. Because we hold this strategic capital to implement our opportunistic strategy and to enable us to explore deployment opportunities as they arise, and because we are investing for future growth, our consolidated annualized ROE for the nine months ended September 30, 2016 and the year ended December 31, 2015 was 9.4% and 11.3%, respectively, and our consolidated annualized operating ROE excluding AOCI for the same period was 10.8% and 15.6%, respectively, in each case, without the benefit of any financial leverage or capital return through dividends or share buyback programs. On a consolidated basis, for the nine months ended September 30, 2016 and the year ended December 31, 2015, we generated net income available to AHL shareholders of $437 million and $562 million, respectively, and operating income, net of tax, of $476 million and $740 million, respectively. Investment margin, operating income, net of tax, and operating ROE excluding AOCI are not calculated in accordance with GAAP. See “Management’s Discussion and Analysis of Financial Condition and Results of Operations—Key Operating and Non-GAAP Measures” for additional discussions regarding non-GAAP measures.
As of September 30, 2016, we had $7.1 billion of total AHL shareholders’ equity and $6.2 billion of total AHL shareholders’ equity excluding AOCI. Our top-level U.S. insurance subsidiary, AADE, had a U.S. RBC ratio of 552% and ALRe had a BSCR of 323%, each as of December 31, 2015. As of September 30, 2016, our estimated U.S. RBC ratio remained strong at 469%. The change from our December 31, 2015 U.S. RBC ratio is primarily driven by our investment of capital to organically grow our retail channel, which increased significantly during 2016. Our main insurance subsidiaries are rated A- for financial strength by each of S&P and Fitch, each with a stable outlook, and by A.M. Best, with a positive outlook. AHL has a counterparty credit rating of BBB from S&P and an issuer default rating of BBB from Fitch, each with a stable outlook, and an issuer credit rating of bbb- from A.M. Best, with a positive outlook. See “—Financial Strength Ratings.” We currently have no financial leverage, and have an undrawn $1.0 billion credit facility in place to provide an additional liquidity cushion in challenging economic or business environments or to provide additional capital support.
We operate our core business strategies out of one reportable segment, Retirement Services. In addition to Retirement Services, we report certain other operations in Corporate and Other. Retirement Services is comprised of our U.S. and Bermuda operations which issue and reinsure retirement savings products and institutional products. Retirement Services has retail operations, which provide annuity retirement solutions to our policyholders. Retirement Services also has reinsurance operations, which reinsure MYGAs, FIAs, traditional one year guarantee fixed deferred annuities, immediate annuities and institutional products from our reinsurance partners. In addition, our FABN program is included in our Retirement Services segment. Corporate and Other includes certain other operations related to our corporate activities and our German operations, which is primarily comprised of participating long-duration savings products. In addition to our German operations, included in Corporate and Other are corporate allocated expenses, merger and acquisition costs, debt costs, certain integration and restructuring costs, certain stock-based compensation and intersegment eliminations. In Corporate and Other we also hold more than $1 billion of capital in excess of the level of capital we hold in Retirement Services to support our operating strategy.
We believe we hold a sufficient amount of capital in our Retirement Services segment to support our core operating strategies. This level of capital may fluctuate depending on the mix of both our assets and our liabilities, and also reflects the level of capital needed to support or improve our current ratings as well as our risk appetite based on our internal risk models. The level of capital the company currently allocates to our Corporate non-reportable segment is our U.S. subsidiaries’ statutory capital in excess of a U.S. RBC ratio of 400% as well as the Bermuda capital for ALRe in excess of 400% RBC when also applying NAIC RBC factors. We view this excess as strategic capital, which we expect to deploy for additional organic and inorganic growth opportunities as well as expect to contribute to ratings improvements over time. We manage our capital to levels
157
Table of Contents
which we believe would remain consistent with our current ratings in a recessionary environment. For additional information regarding our segments, refer to “Note 15 – Segment Information” to our unaudited condensed consolidated financial statements and notes thereto and “Note 21 – Segment Information” to our audited consolidated financial statements and notes thereto.
We have developed organic and inorganic channels to address the retirement services market and grow our assets and liabilities. By focusing on the retirement services market, we believe that we will benefit from several demographic and economic trends, including the increasing number of retirees in the United States, the lack of tax advantaged alternatives for people trying to save for retirement and expectations of a rising interest rate environment. To date, most of our products sold and acquired have been fixed annuities, which offer people saving for retirement a product that is tax advantaged, has a minimum guaranteed rate of return or minimum cash value and provides protection against investment loss. Our policies often include surrender charges (86% of our annuity products, as of September 30, 2016) or MVAs (73% of our annuity products, as of September 30, 2016), both of which increase persistency and protect our ability to meet our obligations to policyholders.
Our organic channels have provided deposits of $6.9 billion and $2.6 billion for the nine months ended September 30, 2016 and 2015, respectively, and $3.9 billion, $2.9 billion and $1.5 billion for the years ended December 31, 2015, 2014 and 2013, respectively. Withdrawals on our deferred annuities were $3.0 billion and $3.3 billion for the nine months ended September 30, 2016 and 2015, respectively, and $4.4 billion, $4.4 billion and $2.1 billion for the years ended December 31, 2015, 2014 and 2013, respectively. While there can be no assurance that we will meet our growth targets, we believe that our new deposits should continue to significantly surpass our withdrawals as we continue to grow our retail and flow reinsurance channels. Absent any significant unexpected market conditions or regulatory impacts and assuming we can meet our pricing targets, we believe that with our ratings and the strong growth in our organic channel in 2016, new deposits from our organic channels and withdrawal experience with respect to our deferred annuities should be similar in the near-to-mid-term to our 2016 production and withdrawal experience, respectively. Within these channels, we have focused on developing a diverse suite of products that allow us to meet our risk and return profiles, even in today’s low rate environment. As a result, not only have we been able to deliver strong organic growth in 2016, but we have also been able to do so without sacrificing profitability. Going forward, we believe the 2015 upgrade of our financial strength ratings to A- by each of S&P, Fitch and A.M. Best, as well as our 2016 outlook upgrade to positive by A.M. Best and our recent FIA and MYGA new product launches will continue to enable us to increase penetration in our existing organic channels and access new markets within our retail channel, such as through financial institutions. This increased penetration will allow us to source additional volumes of profitably underwritten liabilities. Our organic channels currently include:
| • | Retail, from which we provide retirement solutions to our policyholders primarily through approximately 60 IMOs. Within our retail channel we had fixed annuity sales of $3.8 billion and $1.9 billion for the nine months ended September 30, 2016 and 2015, respectively, and $2.5 billion, $2.5 billion and $1.3 billion for the years ended December 31, 2015, 2014 and 2013, respectively. For the trailing twelve month period ended September 30, 2016 we had fixed annuity sales of $4.4 billion. |
| • | Flow reinsurance, which provides an opportunistic channel for us to source long-term liabilities with attractive crediting rates. Within our flow reinsurance channel, we generated $3.1 billion and $660 million in deposits for the nine months ended September 30, 2016 and 2015, respectively, and $1.1 billion, $349 million and $167 million in deposits for the years ended December 31, 2015, 2014 and 2013, respectively. For the trailing twelve month period ended September 30, 2016 we generated new flow reinsurance deposits of $3.6 billion. |
| • | Institutional products, focused on the sale of funding agreements. Within our institutional products channel, in October 2015, we sold a $250 million funding agreement in our inaugural transaction under our FABN program. To date, we have not completed a pension risk transfer transaction, although we are in the process of developing our capabilities to undertake such transactions. |
158
Table of Contents
Our inorganic channels, including acquisitions and block reinsurance, have contributed significantly to our growth. We believe our internal acquisitions team, with support from Apollo, has an industry-leading ability to source, underwrite, and expeditiously close transactions, which makes us a competitive counterparty for acquisition or block reinsurance transactions. We are highly selective in the transactions that we pursue; ultimately closing only those that are well aligned with our core competencies and pricing discipline. Since our inception, we have evaluated a significant number of merger and acquisition opportunities and have closed on five acquisitions. In connection with our five acquisitions through September 30, 2016, we sourced reserve liabilities backed by approximately $65.9 billion in total assets (net of $9.3 billion in assets ceded through reinsurance). The aggregate purchase price of our acquisitions was less than the aggregate statutory book value of the businesses acquired.
We have sourced a high quality portfolio of invested assets. Because we have remained disciplined in underwriting attractively priced liabilities, we have the ability to invest in a broad range of high quality assets and generate attractive earnings. As of September 30, 2016, approximately 93.1% of our AFS fixed maturity securities, including related parties, were rated NAIC 1 or NAIC 2, the two highest credit rating designations under the NAIC’S criteria (with investments of our German operations rated by applying NRSRO equivalent ratings to map NAIC ratings). In addition to our core fixed income portfolio, we opportunistically allocate 5-10% of our portfolio to alternative investments where we primarily focus on fixed income-like, cash flow-based investments. For instance, our alternative investment positions include significant equity stakes in two asset platforms that originate high quality credit assets (such as RMLs, leveraged loans and mortgage servicing rights) that are well aligned with our investment strategy. Our relationship with AAM and Apollo allows us to take advantage of our generally illiquid liability profile and identify asset opportunities with an emphasis on earning incremental yield by taking liquidity risk and complexity risk, rather than assuming solely credit risk. While alternative investments are a relatively small portion of our overall portfolio, our alternative investments strategy has been an important driver of returns. In general, we target returns for alternative investments of 10% or higher on an IRR basis over the expected lives of such investments.
Through our efficient corporate structure and operations, we believe we have built a cost-effective platform to support our growth opportunities. We believe our fixed operating cost structure supports our ability to maintain an attractive financial profile across market environments. Additionally, we believe we have designed our platform to be highly scalable and support growth without significant incremental investment in infrastructure, which allows us to scale our business production up or down because of our cost-effective platform. As a result, we believe we will be able to convert a significant portion of our new business spread into operating income. For the nine months ending September 30, 2016 and year ended December 31, 2015, our operating income, net of tax was as follows (dollars in millions):
| Nine months ended September 30, 2016 |
Year ended December 31, 2015 |
|||||||
| Retirement Services |
||||||||
| Net investment earnings |
$ | 2,162 | $ | 2,572 | ||||
| Cost of crediting on deferred annuities |
(755) | (940) | ||||||
| Other liability costs (1) |
(750) | (656) | ||||||
| Operating expenses |
(150) | (166) | ||||||
|
|
|
|
|
|||||
| Operating income before tax |
507 | 810 | ||||||
| Income tax (expense) benefit – operating income |
56 | (41) | ||||||
|
|
|
|
|
|||||
| Operating income, net of tax* |
$ | 563 | $ | 769 | ||||
|
|
|
|
|
|||||
| * | Refer to “Management’s Discussion and Analysis of Financial Conditions and Results of Operations – Key Operating and Non-GAAP Measures” for discussion on operating income, net of taxes and “Management’s Discussion and Analysis of Financial Conditions and Results of Operations – Non-GAAP Measure Reconciliations”. |
| (1) | Other liability costs include DAC, DSI and VOBA amortization and change in GLWB and GMDB reserves for all products, the cost of liabilities on products other than deferred annuities including offsets for premiums, product charges and other revenues. |
Relationship with Apollo
We have a strategic relationship with Apollo which allows us to leverage the scale of its asset management platform. Apollo’s indirect subsidiary, AAM, serves as our investment manager. In addition to co-founding the
159
Table of Contents
company, Apollo assists us in identifying and capitalizing on acquisition opportunities that have been critical to our ability to significantly grow our business. Members of the Apollo Group are significant owners of our common shares and Apollo employees serve on our board of directors. We expect our strategic relationship with Apollo to continue for the foreseeable future. See “Certain Relationships and Related Party Transactions—Relationships and Related Party Transactions with Apollo or its Affiliates,” “Principal and Selling Shareholders” and “Shares Eligible for Future Sale—Lock-Up Agreements.”
The Apollo Group controls and is expected, subsequent to the completion of our initial public offering, to continue to control 45% of the total voting power of AHL and five of our 16 directors are employees of or consultants to Apollo and our Chairman, Chief Executive Officer and Chief Investment Officer is a dual employee of both AHL and AAM. Further, our bye-laws generally limit the voting power of our Class A common shares (and certain other of our voting securities) such that no person owns (or is treated as owning) more than 9.9% of the total voting power of our common shares (with certain exceptions). See “Description of Share Capital—Common Shares.”
Our Market Opportunity
The number of individuals reaching retirement age is growing rapidly while some traditional retirement funding sources have declined in the wake of the financial crisis and the ensuing prolonged low interest rate environment. Our tax-efficient savings products are well positioned to meet this increasing customer demand.
| • | Increasing Retirement-Age Population. Over the next three decades, the retirement-age population is expected to experience unprecedented growth. According to the U.S. Census Bureau, there were approximately 40 million Americans age 65 and older in 2010, representing 13% of the U.S. population. By 2030, this segment of the population is expected to increase by 34 million or 85% to approximately 74 million, which would represent approximately 21% of the U.S. population. Technological advances and improvements in healthcare are projected to continue to contribute to increasing average life expectancy, and aging individuals must be prepared to fund retirement periods that will last longer than ever before. Furthermore, many working households in the United States do not have adequate retirement savings. Demand for traditional fixed rate annuities and FIAs will likely be bolstered by this gap resulting from the growing need for guaranteed income streams and the expanding retirement population’s insufficient savings base. |
|
|
| Source: U.S. Census Bureau. |
160
Table of Contents
| • | Increasing Demand for Tax-efficient Savings Products. According to a 2015 report published by the Government Accountability Office, approximately 50% of individuals age 55 and older have no retirement savings. As a tool for addressing the unmet need for retirement planning, we believe that many Americans have begun to look to tax-efficient savings products with low-risk or guaranteed return features and potential equity market upside, particularly as federal, state and local marginal tax rates have increased. As a result, sales of FIAs increased by approximately 70% from 2010 to 2015 and FIAs as a percentage of total fixed annuities increased from 39% in 2010 to 53% in 2015 according to LIMRA. If interest rates rise, we expect to benefit from increased demand for our tax-efficient savings products as crediting and participation rates become more attractive on an absolute basis, and relative to alternative fixed income and savings vehicles such as CDs and corporate bonds. |
|
|
| Source: U.S. Individual Annuity Yearbook 2014 and 4Q 2015 LIMRA Secure Retirement Institute US Individual Annuity Sales Report. |
161
Table of Contents
| • | Shift in Industry Product Mix. In addition to prospects of overall market growth due to increases in demand for retirement products, the industry is also experiencing a shift in product mix as demand for variable annuities has been declining, while demand for fixed rate annuities and FIAs has been increasing. Between 2012 and 2015, variable annuities experienced a CAGR of (3.4%), while fixed rate annuities and FIAs experienced CAGRs of 8.4% and 17.1%, respectively. We believe this trend illustrates consumer preference for the relative predictability and safety of fixed rate annuities and FIAs over the volatility often experienced with variable annuities. Given that we focus on sourcing liabilities primarily comprised of fixed rate annuities and FIAs and do not actively source variable annuities, we believe that we stand to benefit from these shifts in industry product mix. |
|
|
|
Source: Estimated based on sales reported to LIMRA from 2012 through 2015. |
| • | Shift in the Competitive Environment. Products with guarantees require superior asset and risk management expertise to balance policyholder security, regulatory demands and shareholder returns on equity. Since the financial crisis, many companies have placed their fixed annuity businesses in run-off and have sold substantial blocks to third parties including us. The current market and regulatory environment, including the newly-issued DOL regulations regarding fiduciary obligations of distributors of products to retirement accounts could provide us additional sources of growth through reinsurance and/or acquisitions to the extent that competitors divest in-force blocks of business as a result of such environment. However, we have also seen and may in the future see additional competitors enter the market who could compete for such sources of growth. |
| • | Increasing Asset Opportunities. Regulatory changes in the wake of the financial crisis have made it less profitable for banks and other traditional lenders to hold certain illiquid and complex asset classes, notwithstanding the fact that these assets may have prudent credit characteristics. This market pullback has resulted in a supply-demand imbalance, which has created the opportunity for knowledgeable investors to acquire high-quality assets that offer attractive returns. As these institutions continue to comply with these new rules, we believe additional assets will become available which could be attractive for our business. |
| • | Large Market Opportunity. The distribution channels we have developed provide us access to large markets for our products. Increasing demand for tax-efficient retirement savings products suggests that these markets will remain robust while many companies are still hesitant to commit significant capital to these channels due to increasing regulation, capital requirements and the low interest rate environment. We believe these market dynamics will enable us to continue to profitably gain share in each of the markets on which we focus. For example, within the retail channel, according to LIMRA, for |
162
Table of Contents
| the six months ended June 30, 2016 (the most recent period that data is currently available), we were the 12th largest company in sales of fixed annuities with a 2.8% market share and the 5th largest company in sales of fixed indexed annuities with a 5.0% market share. We believe we will benefit from both the growth in the overall market as the market expands to meet the increased demand for tax-efficient retirement savings products and from gains in our market share as we continue to build our capabilities, strengthen our relationships and enter new markets within our existing channels. |
| Retail & Flow Reinsurance |
FABN | Total U.S. Pension Assets |
||||||||||
| Market Size |
$ | 125 billion | (1) | $ | 17 billion | (2) | $ | 3.3 trillion | (3) | |||
(1) Source: LIMRA – total annuity sales in 2015 via financial institution channels.
(2) Source: IFR Markets - trailing twelve months issuances as of September 30, 2016.
(3) Source: Federal Reserve Statistical Release, Q2 2016 – U.S. private defined benefit pension assets.
Competitive Strengths
We believe the following strengths will allow us to capitalize on the growth prospects for our business:
| • | Ideal Platform to Capitalize on Positive Demographic and Market Trends. We have designed our products to capitalize on the growing need for retirement savings solutions. Our products provide protection against market downturns and offer interest which compounds on a tax-deferred basis until funds are distributed. Many of our products also provide the potential to earn interest based on the performance of a market index. These features provide distinct advantages over traditional savings vehicles such as bank CDs and variable annuities. Despite a challenging interest rate environment, we have been able to profitably source $3.8 billion of fixed annuity products through our retail channel in the first nine months of 2016 by leveraging our product design capabilities, our investment acumen, which allows us to invest at appropriate investment margins, and our scalable operating platform. We offer prudent product features at attractive prices. If investment rates increase due to a rise in interest rates or widening credit spreads, we would be able to offer higher crediting rates, which we believe would generate additional demand for our products and therefore increased sales. Even in a long-term low rate environment, we believe our underwriting expertise and ability to find and compete in areas of the market that are rationally priced will allow us to maintain strong operating results. For example, in prior years, our retail operations have generally not competed aggressively in the guaranteed income rider segment as we historically believed that such riders were not priced within our pricing discipline. However, recently, competitors have been issuing annuities with what we believe are more rationally-priced lifetime income benefit features. In the current environment, we believe that we can grow our retail sales by offering competitive guaranteed income rates while earning an attractive return. |
| • | Multiple Distribution Channels. We have four dedicated distribution channels to capitalize on retirement services opportunities across market environments and grow our liabilities. Our key distribution channels are retail, reinsurance (including flow and block reinsurance), institutional products (focused on the sale of funding agreements) and acquisitions. We intend to maintain a presence within each of these distribution channels with the ability to underwrite liabilities. However, we do not have any market share targets across our organization, which we believe provides us flexibility to respond to changing market conditions in one or more channels and to opportunistically grow liabilities that generate our desired levels of profitability. In a rising interest rate environment, we believe we will be able to profitably increase the volume of our retail, flow reinsurance and institutional product sales and we believe we will see increased acquisition and block reinsurance opportunities in more challenging market environments. We are diligent in setting our return targets based on market conditions and risks inherent to our products offered and acquisitions or block reinsurance transactions. In general, we may accept lower returns on products which may provide more certain return characteristics, such as FABN, and we may require higher returns for products or transactions where there is more inherent risk in meeting our return targets, such as with acquisitions. If |
163
Table of Contents
| market conditions or risks inherent to a product or transaction create return profiles that are not acceptable to us, we generally will not sacrifice our profitability merely to facilitate growth. |
| • | Superior and Unique Investment Capabilities. We believe our relationships with AAM and Apollo provide access to superior and unique investment capabilities that allow us to invest a portion of our assets in securities that earn us incremental yield by taking liquidity risk and complexity risk, capitalizing on our long-dated and persistent liability profile to prudently achieve higher net investment earned rates, rather than assuming solely credit risk. Our investing capabilities support our ability to sell fixed annuities profitably and to price acquisitions competitively while meeting our return targets. Through AAM, we have access to more than 100 investment and operations professionals who are highly familiar with our business objectives and funding structure. This enables AAM to customize asset allocations and select investments for us that are most appropriate for our business. In addition, our strategic relationship with Apollo provides us with access to Apollo’s broad credit and alternative investment platforms and allows us to leverage the scale, sourcing and investing capabilities, and infrastructure of an asset manager with more than $188 billion of AUM, which includes approximately $71.5 billion of our invested assets, each as of September 30, 2016. Apollo’s global asset sourcing capabilities in a diverse array of asset classes provide AAM with the opportunity to capitalize on attractive investments for us. |
| • | In each of our U.S. acquisitions, we have successfully reinvested our acquired investment portfolio with the objective of achieving higher returns than were achieved on such investments prior to the acquisition. For example, we have reinvested a substantial portion of the investment portfolio acquired in our acquisition of Aviva USA, which contributed to the increase in fixed income and other net investment earned rates on this block of business to 4.12% for the year ended December 31, 2015 from 3.50% (on an annualized basis) for the fourth quarter of 2013. |
| • | Apollo and AAM work collaboratively to identify and quickly capitalize on opportunities in various asset classes. For example, we were an early investor in distressed non-agency RMBS during 2009 and 2010, prior to the strong recovery of that market in later years. By the end of 2010, we had acquired a portfolio of $448 million (approximately 24% of our total invested assets at such time) of non-agency RMBS at discounts to par, well in advance of the significant price improvements in these investments. Today, RMBS continues to represent an important asset class within our investment portfolio. As of September 30, 2016, 14.7% of our invested assets were invested in RMBS, with such securities having an amortized book price of 84% of aggregate par value. |
| • | AAM selects investments and develops investment strategies prior to our purchase in accordance with our investment limits, and works in concert with our risk management team to stress-test the underwritten assets and asset classes under various negative scenarios. For both the nine months ended September 30, 2016 and the year ended December 31, 2015, our annualized OTTI as a percentage of our average invested assets was 5 basis points. |
| • | We also have access to expertise and capabilities to directly originate a wide range of asset classes through AAM and Apollo. Direct origination allows the selection of assets that meet our liability profile and the sourcing of better quality investments. |
| • | Efficient Corporate Platform to Support Profitability. We believe we have designed an efficient corporate platform to support our portfolio of $70.9 billion of reserve liabilities as of September 30, 2016. Over the 8.4 year weighted average life of our deferred annuities, we expect to generate an annual investment margin of 2-3%. |
| In addition, our corporate platform enables us to be highly scalable and to allow us to onboard incremental business without significant additional investment in infrastructure and with low incremental fixed operating cost. As a result, we believe we should be able to convert a significant portion of incremental net investment income from additional invested assets and liabilities into operating income. |
164
Table of Contents
| • | Strength of Balance Sheet. We believe the strength of our balance sheet provides confidence to our policyholders and business partners and positions us for continued growth. We presently hold over $1 billion in excess capital and have no financial leverage. We maintain what we believe to be high capital ratios for our rating, with our top level insurance subsidiary, AADE, having a U.S. RBC ratio of 552% and ALRe having a BSCR of 323%, each as of December 31, 2015. To further reinforce our strong liquidity profile, we have access to a $1 billion dollar revolving credit facility that is currently undrawn. Our invested assets comprise what we believe to be a highly rated and well diversified portfolio. As of September 30, 2016, approximately 93.1% of our AFS fixed maturity securities, including related parties, were rated NAIC 1 or NAIC 2. These assets are managed against what we believe to be prudently underwritten liabilities, which were, in each case, priced by us after the financial crisis. |
| • | Robust Risk Management. We have established a comprehensive ERM framework and risk management controls throughout our organization, which are further supported by AAM’s and Apollo’s own risk management capabilities that are intended to help us maintain our continued financial strength. We manage our business, capital and liquidity profile with the objective of withstanding severe adverse shocks, such as the 2007-2008 financial crisis, while maintaining a meaningful buffer above regulatory minimums and above certain capital thresholds to meet our desired credit ratings. Risk management is embedded in all of our business decisions and processes, including acquisitions, asset purchases, product design and underwriting, liquidity and liability management. Certain of the key attributes of our risk management profile are: |
| • | We maintain a risk committee of the board of directors charged with the oversight of the development and implementation of systems and processes designed to identify, manage and mitigate reasonably foreseeable material risks and with the duty to assist our board of directors and our other board committees with fulfilling their oversight responsibilities for our risk management function. |
| • | We believe that we underwrite liabilities and manage new product development prudently. Further, we believe that our strong fixed annuity underwriting provides us with long-dated and persistent liabilities, which we believe are priced at desirable levels to enable us to achieve attractive, risk-adjusted returns. |
| • | We believe we have designed our ALM procedures to protect the company, within limits, against significant changes in interest rates. |
| • | As of September 30, 2016, approximately 86% of our annuity products had surrender charges and 73% had MVAs, each of which provide stability to our reserve liabilities. |
| • | As of September 30, 2016, 29% of our invested assets were floating rate investments which would allow us the flexibility to quickly increase our crediting rates in a rising interest rate environment, if desired. |
| • | We believe that we maintain an appropriate amount of assets that could be quickly liquidated, if needed, and have an additional liquidity cushion through a $1.0 billion revolving credit facility, which is undrawn as of the date hereof. |
| • | We believe we hold a high-quality portfolio, with approximately 93.1% of our AFS fixed maturity securities, including related parties, rated as NAIC 1 or NAIC 2 as of September 30, 2016 (with investments of our German operations rated by applying NRSRO equivalent ratings to map NAIC ratings). |
| • | AAM evaluates our structured securities at the time of acquisition using AAM’s proprietary credit models. |
| • | Even during periods of moderate economic stress, based on our modeled estimates, we maintain what we believe to be an appropriate amount of liquidity to invest in opportunities as they arise. |
165
Table of Contents
| • | Highly Experienced Management Team with Demonstrable Track Record. Our highly successful, entrepreneurial senior management team has extensive experience in building companies, insurance operations, and investment management. We have assembled a management team of individuals who bring strong capabilities and experience to each facet of running our company. We are led by three well known and well respected industry executives with an average of 30 years of experience. James R. Belardi, our Chairman and founder, spent the majority of his career as the President of SunAmerica Life Insurance Company and Chief Investment Officer of AIG Retirement Services, Inc. William J. Wheeler, our President, served as President of the Americas Group and Chief Financial Officer at MetLife Inc. prior to joining our company, and Martin P. Klein, our Chief Financial Officer, was previously Chief Financial Officer of Genworth Financial, Inc. Our management team oversees the company’s activities and its day-to-day management, including through various committees designed to manage our strategic initiatives, risk appetite and investment portfolio. See “Management—Corporate Governance—Management Committees.” |
Growth Strategy
The key components of our growth strategy are as follows:
| • | Continue Organic Growth by Expanding Our Distribution Channels. We plan to grow organically by expanding our retail, reinsurance and institutional product distribution channels. We believe that we have the right people, infrastructure and scale to position us for continued growth. We aim to grow our retail channel in the United States by deepening our relationships with our approximately 60 IMOs and approximately 30,000 independent agents. Our strong financial position and capital efficient products allow us to be a dependable partner with IMOs and consistently write new business. We work with our IMOs to develop customized, and at times exclusive, products that help drive sales. |
We expect our retail channel to continue to benefit from the ratings upgrade in 2015, our improving credit profile and recent product launches. We believe this should support growth in sales at our desired cost of crediting through increased volumes via current IMOs and access to new distribution channels, including small to mid-sized banks and regional broker-dealers. We are implementing the necessary technology platform, hiring and training a specialized sales force, and have created products to capture new potential distribution opportunities.
Our reinsurance channel also benefited from the 2015 ratings upgrade. We target reinsurance business consistent with our preferred liability characteristics, and as such, reinsurance provides another opportunistic channel for us to source long-term liabilities with attractive crediting rates. For the nine months ended September 30, 2016, we generated deposits through our flow reinsurance channel of $3.1 billion, while for the full year of 2015, we generated deposits of $1.1 billion, up from $167 million in 2013. We expect to grow this channel further as we continue to add new partners, some of which prefer to do business with higher rated counterparties such as us.
In addition, after having sold our first funding agreement under our FABN program in 2015, we expect to grow our institutional products channel over time. Lastly, we are in the process of developing our capabilities to undertake pension risk transfer transactions.
| • | Pursue Attractive Acquisitions. We plan to continue leveraging our expertise in sourcing and evaluating transactions to grow our business profitably. From our founding through September 30, 2016, we have grown to $71.6 billion in invested assets and $70.9 billion in reserve liabilities, primarily through acquisitions and block reinsurance transactions. We believe that our demonstrated ability to successfully consummate complex transactions, as well as our relationship with Apollo, provide us with distinct advantages relative to other acquirers and reinsurance companies. Furthermore, our business has achieved sufficient scale to provide meaningful operational synergies for the businesses and blocks of business that we acquire. Consequently, we believe we are often sought out by companies looking to transact in the acquisitions and block reinsurance markets. |
166
Table of Contents
| • | Expand Our Product Offering and International Presence. Our efforts to date have focused on developing and sourcing retirement savings products and we are continuing such efforts by expanding our retail product offerings. On April 11, 2016, we launched our largest new retail product initiative, whereby we: (1) enhanced our most popular accumulation product, “Performance Elite,” with two new indices, (2) announced a new MYGA product designed for the bank and broker-dealer channel and (3) introduced an income-focused product, “Ascent Pro.” With the introduction of our new MYGA product and Ascent Pro, our retail channel is now competing in a much broader segment of the overall retirement market. For the six months ended September 30, 2016, new MYGA sales in the IMO and financial institution channels were $456 million and Ascent Pro sales were $1.0 billion. See “Business—Products.” |
Additionally, while our organic growth initiatives and acquisitions have largely been focused on opportunities in the United States, our recent acquisition of DLD has demonstrated the geographic scalability of our strategy and our ability to capitalize quickly on international market environments as well. While we continue to believe that the European market provides a compelling growth opportunity to amass liabilities at one of the most favorable costs of funding in a number of years, we have come to realize that the opportunity over the next several years is larger than we initially anticipated. We have concluded that, in order to fully capitalize on this opportunity, we would need to commit capital to the European market at a level in excess of our targeted investment size, creating the need for third party capital to support growth. See “Business—Products—German Products—AGER Equity Offering.”
Recently, we have also been developing our capabilities to undertake pension risk transfer transactions. Pension risk transfer transactions usually involve the issuance of a group annuity contract, typically through a separate account, in exchange for the transfer of pension liabilities from a terminating defined benefit plan. U.S. pension liabilities are estimated to be $2 to $3 trillion with an estimated $1 trillion of liabilities that may become available for closeout, with approximately $15 to $20 billion of expected annual closeout activity over the next several years. Typically, each year, there are various small transactions in which a single insurer takes all of the pension liabilities of a company, and a few “jumbo” transactions in which the liabilities of one or more large plan or affiliated plans may be shared among multiple annuity writers to enable the plan fiduciaries to diversify their risk. We are focused on the latter category through which: (i) we believe we can achieve significant growth while engaging in fewer transactions; (ii) the risk is shared with the largest of the industry participants; and (iii) our marginal costs are lower. We believe that we can leverage our sourcing expertise to underwrite these transactions and maintain our focus on writing profitable new business.
| • | Leverage Our Unique Relationship with Apollo and AAM. We intend to continue leveraging our unique relationship with Apollo and AAM to source high-quality assets with attractive risk-adjusted returns. Apollo’s global scale and reach provide us with broad market access across environments and geographies and allow us to actively source assets that exhibit our preferred risk and return characteristics. For instance, through our relationship with Apollo and AAM, we have indirectly invested in companies including MidCap and AmeriHome. In 2013, Apollo presented us with an opportunity to fund the acquisition of MidCap, a middle-market lender focused on asset-backed loans, leveraged loans, real estate, rediscount loans and venture loans. Our equity investment in MidCap provides us with an alternative investment that meets the key characteristics we look for including an attractive risk-return profile. Our equity investment in MidCap is held indirectly through an investment fund, Co-Invest VII, of which MidCap constituted 99% of the investments of such fund. Co-Invest VII returned an annualized net investment earned rate of 10.93% and 15.98% for the nine months ended September 30, 2016 and for the year ended December 31, 2015, respectively. As of September 30, 2016, our equity investment and loans to Midcap were valued at $511 million and $237 million, respectively. |
Similarly, in 2013, AAM proposed that Athene and an Apollo co-investor fund and launch AmeriHome, a mortgage lender and servicer with expertise in mortgage industry fundamentals that we believe are key to operating a successful and sustainable mortgage lender/servicer. Like our investment in MidCap, our equity investment in AmeriHome meets the key characteristics we look for in an
167
Table of Contents
alternative investment. Our equity investment in AmeriHome is held indirectly through an investment fund, A-A Mortgage, and AmeriHome is currently A-A Mortgage’s only investment. Abiding by its core principles, AmeriHome has grown profitably, with A-A Mortgage returning an annualized net investment earned rate of 13.40% and 14.05% for the nine months ended September 30, 2016 and for the year ended December 31, 2015, respectively. As of September 30, 2016, our equity investment in A-A Mortgage was valued at $379 million.
| • | Dynamic Approach to Asset Allocation during Market Dislocations. As we have done successfully in the past, we plan to fully capitalize on future market dislocations to opportunistically reposition our portfolio to capture incremental yield. For example, during 2009-2010, we reinvested a significant portion of our portfolio into RMBS. Additionally, regulatory changes in the wake of the financial crisis have made it more expensive for banks and other traditional lenders to hold certain illiquid and complex assets, notwithstanding the fact that these assets may have prudent credit characteristics. This change in demand has provided opportunities for investors to acquire high-quality assets that offer attractive returns. For example, we see emerging opportunities as banks retreat from direct mortgage lending, structured and asset-backed products, and middle-market commercial loans. We intend to maintain a flexible approach to asset allocation, which will allow us to act quickly on similar opportunities that may arise in the future across a wide variety of asset types. |
| • | Maintain Risk Management Discipline. Our risk management strategy is to proactively manage our exposure to risks associated with interest rate duration, credit risk and structural complexity of our invested assets. We address interest rate duration and liquidity risks through managing the duration of the liabilities we source with the assets we acquire, and through ALM modeling. We assess credit risk by modeling our liquidity and capital under a range of stress scenarios. We manage the risks related to the structural complexity of our invested assets through AAM’s modeling efforts. The goal of our risk management discipline is to be able to continue growth and to achieve profitable results across various market environments. |
Products
We principally offer two product lines: annuities and funding agreements. Our primary product line is annuities and includes fixed deferred and immediate annuities. We sell funding agreements to institutional investors and investors in our FABN program. Descriptions of each of these product lines are below.
The following summarizes our total premiums and deposits comprised of all products deposits, which generally are not included in revenues on the consolidated statements of income, and premiums collected. Premiums and deposits by product, including those assumed through reinsurance and net of those ceded through reinsurance, are as follows for the periods presented below (dollars in millions):
| Nine months ended September 30, |
Years ended December 31, | |||||||||||||||||||
| 2016 | 2015 | 2015 | 2014 | 2013 | ||||||||||||||||
| Annuities |
||||||||||||||||||||
| Fixed indexed annuities |
$ | 3,824 | $ | 2,093 | $ | 2,808 | $ | 2,560 | $ | 1,148 | ||||||||||
| Fixed rate annuities |
3,185 | 529 | 883 | 323 | 362 | |||||||||||||||
| Payout annuities |
100 | 177 | 219 | 195 | 93 | |||||||||||||||
|
|
|
|
|
|
|
|
|
|
|
|||||||||||
| Total annuities products |
7,109 | 2,799 | 3,910 | 3,078 | 1,603 | |||||||||||||||
| Funding agreements |
— | — | 250 | — | — | |||||||||||||||
| Life and other (excluding German products) |
53 | 54 | 72 | 83 | (1,159) | |||||||||||||||
| German products |
155 | — | 81 | — | — | |||||||||||||||
|
|
|
|
|
|
|
|
|
|
|
|||||||||||
| Total premiums and deposits, net of ceded |
$ | 7,317 | $ | 2,853 | $ | 4,313 | $ | 3,161 | $ | 444 | ||||||||||
|
|
|
|
|
|
|
|
|
|
|
|||||||||||
Reserve liabilities represents our policyholder liability obligations, including liabilities assumed through reinsurance and net of liabilities ceded through reinsurance, and therefore does not correspond to interest
168
Table of Contents
sensitive contract liabilities, future policy benefits, dividends payable to policyholders and other policy claims and benefits as disclosed on our consolidated balance sheets. Reserve liabilities includes the reserves related to assumed modified coinsurance and funds withheld agreements in order to appropriately match the costs incurred in the consolidated statements of income with the liabilities. Reserve liabilities is net of the ceded liabilities to third-party reinsurers as the costs of the liabilities are passed to such reinsurers and therefore we have no net economic exposure to such liabilities, assuming our reinsurance counterparties perform under our agreements. The majority of our ceded reinsurance is a result of reinsuring large blocks of life business following acquisitions. The following summarizes our reserve liabilities by product for the periods presented below (dollars in millions):
| September 30, 2016 |
December 31, | |||||||||||||||||||||||
| 2015 | 2014 | |||||||||||||||||||||||
| Fixed indexed annuities |
$ | 42,669 | 60.2% | $ | 39,594 | 60.7% | $ | 39,470 | 65.8% | |||||||||||||||
| Fixed rate annuities |
13,406 | 18.9% | 10,882 | 16.7% | 11,330 | 18.9% | ||||||||||||||||||
| Payout annuities |
5,518 | 7.8% | 5,708 | 8.7% | 6,073 | 10.1% | ||||||||||||||||||
| Funding agreements |
1,010 | 1.4% | 1,451 | 2.2% | 1,381 | 2.3% | ||||||||||||||||||
| Life and other (excluding German products) |
2,307 | 3.3% | 2,094 | 3.2% | 1,770 | 2.9% | ||||||||||||||||||
| German products |
5,982 | 8.4% | 5,542 | 8.5% | — | — % | ||||||||||||||||||
|
|
|
|
|
|
|
|
|
|
|
|
|
|||||||||||||
| Total reserve liabilities |
$ | 70,892 | 100.0% | $ | 65,271 | 100.0% | $ | 60,024 | 100.0% | |||||||||||||||
|
|
|
|
|
|
|
|
|
|
|
|
|
|||||||||||||
Annuities
We offer deferred and immediate annuities, which are focused on meeting the needs and objectives of people preparing for, approaching or living in retirement. The combination of financial strength, innovative product design and an effective sales strategy enables us to compete successfully in the market and meet the evolving needs of the rapidly growing population of retirees.
Fixed Indexed Annuities
The majority of our reserve liabilities are FIAs. An FIA is a type of insurance contract in which the policyholder makes one or more premium deposits which earn interest at a crediting rate based on a specified market index on a tax deferred basis and is entitled to receive periodic or lump sum payments a specified number of years after the contract has been issued. FIAs allow policyholders the possibility of earning such interest without risk to principal, unless the contract is surrendered during a surrender charge period. A market index tracks the performance of a specific group of stocks or other assets representing a particular segment of the market, or in some cases, an entire market. Our FIAs include a provision for a minimum guaranteed surrender value calculated in accordance with applicable law, as well as death benefits as required by non-forfeiture regulations. We generally buy options on the indices to which the FIAs are tied to hedge the associated market risk. The cost of the option is priced into the overall economics of the product as an option budget.
The value to the policyholder of an FIA contract is equal to the sum of premiums paid, premium bonuses, if any, and index credits based on the change in the relevant market index, subject to a cap (a maximum rate that may be credited), spread (a credited rate determined by deducting a specific rate from the index return) and/or a participation rate (a credited rate equal to a percentage of the index return), less any fees for riders. Caps on our FIA products generally range from 2% to 5% when measured annually and 0.5% to 2% when measured monthly. Participation rates generally range from 25% to 100% of the performance of the applicable market index. Caps, spreads and participation rates can typically be reset no more frequently than annually, and in some instances no more frequently than every two to four years, at the relevant U.S. insurance subsidiary’s discretion, subject to stated policy minimums. Certain riders provide a variety of benefits, such as lifetime income or additional liquidity, for a set charge. As this charge is fixed, the policyholder may lose principal if the index credits received do not exceed the amount of such charge.
169
Table of Contents
Income from FIAs is generated from our investment margin, which is based on the difference between income earned on the investments supporting the liabilities and the interest credited to customers, and fees received for riders. For the nine months ended September 30, 2016, retail sales of FIA products were $3.2 billion and flow reinsurance of FIA products was $537 million. According to sales information from participating members of LIMRA, for the six months ended June 30, 2016 (the most recent period that data is currently available), we were the 5th largest FIA provider in the United States based on retail FIA sales. For the year ended December 31, 2015, retail sales of FIA products were $2.4 billion and flow reinsurance of FIA products was $298 million. According to sales information from participating members of LIMRA, for the year ended December 31, 2015, we were the 6th largest FIA provider in the United States based on retail FIA sales and according to information from participating members of LIMRA, as of December 31, 2015, we were the 3rd largest FIA provider based on fixed indexed deferred annuity assets (exclusive of reinsurance).
Fixed Rate Annuities
Fixed rate annuities include annual reset annuities and MYGAs. Unlike FIAs, fixed rate annuities earn interest at a set rate (or declared crediting rate), rather than a rate that may vary based on an index. Fixed rate annual reset annuities have a crediting rate that is guaranteed for one year. After such period, we have the ability to change the crediting rate once annually to any rate at or above a guaranteed minimum rate at our discretion. MYGAs are similar to annual reset annuities except that the initial crediting rate is guaranteed for a specified number of years, rather than just one year, before it may be changed at our discretion. On April 11, 2016, we introduced our first MYGA product designed for the financial institutions channel. For the nine months ended September 30, 2016, we had retail sales of $5 million of annual reset annuities and $597 million of MYGAs, as well as flow reinsurance of $2.6 billion of MYGAs. For the year ended December 31, 2015, we had retail sales of $14 million of annual reset annuities and $14 million of MYGAs as well as flow reinsurance of $830 million of MYGAs. As of September 30, 2016, crediting rates on outstanding annual reset annuities ranged from 1% to 6% and crediting rates on outstanding MYGAs ranged from 1% to 6%. As of September 30, 2016, 52% of our fixed rate annuities were set at the guaranteed minimum crediting rate.
Retirement Services cost of crediting on deferred annuities for the nine months ended September 30, 2016 and the year ended December 31, 2015 was 1.97% and 1.92%, respectively.
Payout Annuities
Payout annuities primarily consist of single premium immediate annuities (“SPIAs”), supplemental contracts and structured settlements. Payout annuities provide a series of periodic payments for a fixed period of time or for the life of the policyholder, based upon the policyholder’s election at the time of issuance. The amounts, frequency and length of time of the payments are fixed at the outset of the annuity contract. SPIAs are often purchased by persons at or near retirement age who desire a steady stream of payments over a future period of years. Supplemental contracts are typically created upon the conversion of a death claim or the annuitization of a deferred annuity. Structured settlements generally relate to legal settlements.
Income Riders to Fixed Annuity Products
Many of our in-force deferred annuities are issued with riders that provide GLWB. Riders providing GLWB features are sometimes referred to as income riders and permit policyholders to elect to receive guaranteed payments for life from their contract without having to annuitize their policies, which provides policyholders with greater flexibility in the future. Income riders, particularly on FIAs, have become very popular among policyholders. LIMRA estimates that 60% of FIA premium for the six months ended June 30, 2016 (the most recent period that data is currently available) included an income rider.
We broadly characterize the income riders on our deferred annuities as either guaranteed or participating. Guaranteed income riders provide policyholders with a guaranteed lifetime withdrawal amount that is determined
170
Table of Contents
based upon the age of the policyholder when the policy is purchased and the age of the policyholder when he or she elects lifetime income. Participating income riders tend to have lower levels of guaranteed income but policyholders have the opportunity to receive greater levels of income if the policies’ indexed crediting strategies perform well.
Our in-force block of deferred annuities contains policies with income riders that were sourced through both retail operations and acquisitions, such as the acquisition of a substantial block of policies having such riders in connection with the Aviva USA acquisition. With respect to our retail operations, we have generally not competed aggressively in the guaranteed income rider segment as we historically believed that such riders were not priced within our pricing discipline. However, recently competitors have been issuing annuities with what we believe are more rationally-priced lifetime income benefit features. In the current environment, we believe that we can grow our retail sales by offering competitive guaranteed income rates while earning an attractive spread, and on April 11, 2016, we introduced “Ascent Pro,” offering policyholders the option to select a guaranteed income rider. We continually monitor market rationality for opportunities to grow our business, including in the area of guaranteed income riders, taking into account what we believe to be optimal product and product feature mix.
Withdrawal Options for Deferred Annuities
After the first year following the issuance of a deferred annuity, the policyholder is typically permitted to make withdrawals up to 5% or 10% (depending on the contract) of the prior year’s value without a surrender charge or MVA, subject to certain limitations. Withdrawals in excess of the allowable amounts are assessed a surrender charge and MVA if such withdrawals are made during the surrender charge period of the policy. For the nine months ended September 30, 2016 and the full year ended December 31, 2015, withdrawals on our deferred annuities were $3.0 billion and $4.4 billion, respectively. The surrender charge of most of our products is typically between 8% and 15% of the contract value at contract inception and generally decreases by approximately one percentage point per year during the surrender charge period. The surrender charge period of our most popular products ranges from 3 to 15 years. The average surrender charge (excluding the impact of MVAs) is 7.6% for our deferred annuities as of September 30, 2016.
The following table summarizes our deferred annuity account values by level of surrender charge protection as of September 30, 2016 (dollars in millions):
| Years of Surrender Charges Remaining |
Account Value |
Percent of Total |
Average Surrender Charge Percent |
|||||||||
| No surrender charge |
$ | 7,704 | 14.3% | N/A | ||||||||
| >0 to less than 2 |
6,091 | 11.3% | 5.0% | |||||||||
| 2 to less than 4 |
11,998 | 22.3% | 7.2% | |||||||||
| 4 to less than 6 |
12,683 | 23.6% | 9.0% | |||||||||
| 6 to less than 8 |
6,793 | 12.6% | 10.2% | |||||||||
| 8 to less than 10 |
5,298 | 9.9% | 11.6% | |||||||||
| 10 to less than 12 |
2,389 | 4.4% | 14.1% | |||||||||
| 12 or greater |
881 | 1.6% | 14.6% | |||||||||
At maturity, the policyholder may elect to receive proceeds in the form of a single payment or an annuity. If the annuity option is selected, the policyholder will receive a series of payments either over his or her lifetime or over a fixed number of years, depending upon the terms of the contract. Some contracts permit annuitization prior to maturity. In addition to the foregoing rights, a policyholder may also elect to purchase a guaranteed minimum withdrawal benefit rider which provides the policyholder with a guaranteed minimum withdrawal benefit for the life of the contract.
171
Table of Contents
Funding Agreements
We focus on opportunistically issuing funding agreements to institutional investors at attractive prices. Funding agreements are negotiated privately between an investor and an insurance company. They are designed to provide an agreement holder with a guaranteed return of principal and periodic interest payments, while offering competitive yields and predictable returns. The interest rate can be fixed or floating. If the interest rate is a floating rate, it may be linked to LIBOR, the federal funds rate or other major index.
Life and Other (excluding German Products)
Life and other products include other retail products, including run-off or ceded business, statutory closed blocks and ceded life insurance.
German Products
Our German products include the annuity, life insurance and unit-linked products managed by the German Group Companies. Our primary German product type is endowment policies, which are traditional German life insurance policies that include legally guaranteed interest, the right of policyholders to participate in certain portions of ALV’s results and a death benefit. The legally guaranteed interest rate is reset annually and ranges from 1.75% to 4.00%. The policyholder makes one or more premium deposits and is entitled to receive periodic or lump sum payments. These policies include a provision for minimum guaranteed surrender value calculated in accordance with applicable law, as well as death benefits. In addition, AD manages unit-linked life insurance policies, in which premium deposits are invested in fund units specified by the policyholder, and which includes a death benefit the value of which is tied to the performance of the fund units in which the premium deposits are invested. AD also manages pension insurance and disability insurance.
AGER Equity Offering
While we continue to believe that the European market provides a compelling growth opportunity to amass liabilities at one of the most favorable costs of funding in a number of years, we have come to realize that the opportunity over the next several years is larger than we initially anticipated. We have concluded that, in order to fully capitalize on this opportunity, we would need to commit capital to the European market at a level in excess of our targeted investment size, creating the need for third party capital to support growth. We, together with Apollo, have begun a process whereby our subsidiary, AGER Bermuda Holding Ltd., a Bermuda domiciled holding company and the holding company of our German Group Companies (“AGER”) will seek to raise capital as part of a private offering of its equity securities (the “AGER Offering”) in order to pursue expansion opportunities in Europe. As a founding investor, we expect to retain a sizable equity stake in AGER. However, in the event the AGER Offering is successful, our stake in AGER will be reduced and ultimately held as an alternative investment rather than as a consolidated subsidiary. Additionally, as described in further detail below, we expect to have the opportunity to be AGER’s preferred reinsurer for spread liabilities, which will establish a new potential funding channel for our business.
Subject to the approval of our board of directors and our conflicts committee, it is currently being proposed that Apollo and Athene will collectively commit up to €500 million in the AGER Offering. Athene’s contribution will include the valuation of our German Group Companies at approximately €90 million (which is in line with our invested capital in our German Group Companies). We expect the AGER Offering, if successful, to raise up to an additional €1 billion from third parties.
The completion of the AGER Offering is conditioned upon obtaining (i) a sufficient amount of subscription commitments to allow AGER to take advantage of the opportunities in the European market over the next two to four years, (ii) any required regulatory approvals, and (iii) other customary terms and conditions. Prior to the successful completion of the AGER Offering and the initial material capital call in exchange for the issuance of new equity interests of AGER, AGER and our German Group Companies will continue to be consolidated subsidiaries of AHL.
172
Table of Contents
In order to align the interests of Athene and AGER, upon the completion of the AGER Offering, we expect to enter into a cooperation agreement with AGER (the “Cooperation Agreement”), pursuant to which, among other things, (i) we will agree not to compete with AGER in Europe, and (ii) AGER will agree not to compete with us in the United States and the United Kingdom. Under the Cooperation Agreement, we will also have the right to reinsure approximately 20% of the spread business written or reinsured by any insurance or reinsurance company owned or acquired by AGER. An affiliate of Apollo will act as investment adviser in regard to AGER’s investment portfolio and provide investment services and advice. Both the services Apollo provides for AGER, and the fee they receive for doing so, may differ from the existing services provided to our German Group Companies.
In the event the AGER Offering is not completed for any reason, AGER and the German Group Companies would continue to be consolidated subsidiaries of AHL.
Distribution Channels
We have developed four dedicated distribution channels – retail, reinsurance (including flow and block reinsurance), institutional products and acquisitions – which support opportunistic origination across differing market environments and which we believe enable us to achieve stable asset growth while maintaining attractive returns.
Retail
We have built a scalable platform that allows us to originate and rapidly grow our business in fixed annuity products directly from our customers in spite of today’s low-rate environment. We have developed a suite of retirement savings products, distributed through our network of approximately 30,000 independent agents in all 50 states. Sales of fixed annuities were $3.8 billion and $1.9 billion for the nine months ended September 30, 2016 and 2015, respectively, and $2.5 billion, $2.5 billion and $1.3 billion for the years ended December 31, 2015, 2014 and 2013, respectively. We expect that our upgrade to a financial strength rating of A- by each of S&P, Fitch and A.M. Best in 2015 will continue to allow us to increase our share with existing IMOs and enter into relationships with regional banks, broker-dealers and other financial institutions, resulting in a potential increase in annual sales at an attractive cost of crediting. We are focused in every aspect of our retail channel on providing high quality products and service to our policyholders and maintaining appropriate financial protection over the life of their policies.
Reinsurance
Reinsurance is an arrangement under which an insurance company, the “reinsurer,” agrees to indemnify another insurance company, the “ceding company” or “cedent,” for all or a portion of the insurance risks underwritten by the ceding company. Reinsurance is designed to (1) reduce the net amount at risk on individual risks, thereby enabling the ceding company to increase the volume of business it can underwrite, as well as increase the maximum risk it can underwrite on a single risk, (2) stabilize operating results by leveling fluctuations in the ceding company’s loss experience, (3) assist the ceding company in meeting applicable regulatory requirements and (4) enhance the ceding company’s financial strength and surplus position. As mentioned above, reinsurance can also be used to acquire or sell blocks of business. In general, annuity reinsurance is executed in the form of a flow transaction or a block transaction.
We conduct the majority of our reinsurance transactions through our subsidiary, ALRe. Founded on June 9, 2009, ALRe is licensed as a Class E insurer carrying on long-term business in Bermuda – one of the largest reinsurance markets in the world by reserves, with a regulatory regime deemed equivalent to the EU’s Solvency II for commercial insurers. As a fixed annuity reinsurer, ALRe partners with life and annuity insurance companies to develop solutions to their capital requirements, enhance their presence in the retirement market and improve their financial results. The specific liabilities ALRe targets to reinsure include MYGAs, FIAs, traditional one year guarantee fixed deferred annuities, immediate annuities and institutional products. ALRe
173
Table of Contents
only targets business consistent with our preferred liability characteristics, and as such, reinsurance provides another opportunistic channel for us to source long-term liabilities with attractive crediting rates. For various transaction-related reasons, from time to time, our U.S. insurance subsidiaries, in particular AADE, will reinsure business from third-party ceding companies and retrocede a portion of the reinsured business to ALRe. Our flow reinsurance channel generated deposits of approximately $3.1 billion and $660 million for the nine months ended September 30, 2016 and 2015, respectively, and approximately $1.1 billion, $349 million and $167 million for the years ended December 31, 2015, 2014 and 2013, respectively.
ALRe has been involved in reinsurance and retrocession transactions with 16 third-party cedents. Since inception through September 30, 2016, deposits from such transactions totaled approximately $10.4 billion, inclusive of third-party cedent business that flows through AADE, split between block transactions of $3.6 billion and flow business of $6.8 billion. As of September 30, 2016, ALRe had on-going flow reinsurance and retrocession treaties involving five third-party cedents rated A- or better for a quota share of such cedents’ new deposits, including both MYGAs and FIAs. Effective June 1, 2016, ALRe entered into a flow reinsurance agreement with a sixth third-party cedent. We expect to start reinsuring new deposits under this reinsurance agreement in the fourth quarter of 2016. ALRe was first rated by A.M. Best, Fitch and S&P in early 2015, which we believe is helpful in establishing reinsurance relationships with third-party cedents.
In our reinsurance transactions, as opposed to acquisitions, we acquire assets and liabilities associated with a certain book of business, as opposed to the assets or stock of a target company, which allows us to acquire only that portion of the target’s business that we wish to acquire without assuming additional liabilities.
Institutional Products—FABN
We participate in a FABN program, which is a medium term note program under which funding agreements are issued to a special-purpose trust that issues marketable notes. The proceeds of the issuance of a series of notes are used by the trust to acquire a funding agreement with matching interest and maturity payment terms from AADE. The notes are underwritten and marketed by major investment banks’ broker-dealer operations and are sold to institutional investors. On October 23, 2015, we issued our first funding agreement under the FABN program in the aggregate principal amount of $250 million. The funding agreement matures in October 2018.
AAIA is a member of FHLBDM and Athene Life Insurance Company (“ALIC”) is a member of FHLBI. Each issued funding agreements to the relevant FHLB in exchange for cash advances in an aggregate amount of $686 million outstanding, with respect to AAIA, and $50 million outstanding, with respect to ALIC, each as of September 30, 2016. We have decided to wind down the ALIC entity. In connection with that decision, we decided to withdraw our membership in the FHLBI. See “Description of Certain Indebtedness.”
Institutional Products—Pension Risk Transfer
We are in the process of developing our capabilities to undertake pension risk transfer transactions. Pension risk transfer transactions usually involve a single premium group annuity contract issued for the purpose of discharging certain pension plan liabilities. Our planned pension risk transfer annuities are nonparticipating contracts. The assets supporting the guaranteed benefits for each contract will typically be held in a separate account. We will fully guarantee all benefit payments as provided for in the group annuity contract. The group annuity benefits may be purchased for retired and terminated employees or employees covered under terminating or ongoing pension plans. Both immediate and deferred annuities may be purchased by a single premium at issue. There are generally no cash surrender rights, with some exceptions including certain contracts that include liabilities for cash balance pension plans. Under U.S. GAAP, these annuity contracts are treated as general account products. We are focused on bidding on large transactions where the pension risk of one or more large plan or affiliated plans is split with other large annuity writers. We believe this may allow us to achieve significant growth by engaging in fewer transactions with lower marginal costs. To date, we have not completed a pension risk transfer transaction.
174
Table of Contents
Acquisitions
Acquisitions are an important source of growth in our business. We have a proven ability to acquire businesses in complex transactions at terms favorable to us, manage the liabilities that we acquire and reinvest the associated assets. Through September 30, 2016, we have closed four acquisition transactions in the United States, Liberty Life, Investors Insurance Corporation, Presidential Life Corporation and Aviva USA, and one international acquisition, DLD, collectively representing reserve liabilities backed by approximately $65.9 billion in total assets (net of $9.3 billion in assets ceded through reinsurance).
The acquisition of Aviva USA marked a significant milestone in our history. As a result of the acquisition we grew to approximately four times our size immediately prior to the acquisition (as measured by total assets). The acquisition significantly enhanced our retail channel, increased our scale, improved our infrastructure and further demonstrated our integration abilities, in this case having successfully integrated a company with a significantly larger employee headcount and IT and operational footprint.
In October 2015, we acquired the German life insurance business of Delta Lloyd N.V., an Amsterdam-based financial services provider. The German life insurance businesses acquired have been in run-off since the beginning of 2010 by action of the predecessor owner. Accordingly, our German insurance subsidiaries do not write new life insurance business, except for a limited number of new co-insurance policies, and all distribution partner contracts have been terminated.
We plan to continue leveraging our expertise in sourcing and evaluating transactions to profitably grow our business. We believe that our demonstrated ability to source transactions, consummate complex transactions and reinvest assets into higher yielding investments as well as our relationship with Apollo provides us with distinct advantages relative to other acquirers.
In general, we seek to reinsure or otherwise dispose of those portions of the target company’s business that we do not wish to retain, if any. Our largest dispositions of such businesses are described below.
Global Atlantic
As part of our acquisition of Aviva USA, we effectuated a sale of substantially all of Aviva USA’s life insurance business by reinsuring such business to affiliates of Global Atlantic. A description of the transactions is as follows:
| • | We entered into a 100% coinsurance and assumption agreement with Accordia. The agreement covers all open block life insurance business issued by AAIA, with the exception of enhanced guarantee universal life insurance products. Under the terms of the agreement, Accordia is obligated to maintain a custody account with an agreed-upon required statutory balance. As of September 30, 2016, Accordia was obligated to maintain $2.9 billion in the custody account, and as of such date, assets in excess of such amount were maintained in the custody account. The agreement provides separate excess of loss coverage for policy liabilities of AAIA related to the former AmerUs Closed Block that are also subject to existing reinsurance through Athene Re IV, a captive reinsurer that is a subsidiary of AAIA. As of September 30, 2016, outstanding obligations ceded pursuant to this arrangement which remained unnovated amounted to $2.8 billion in statutory reserves. We have no continuing contractual obligations with respect to policies that have been novated. |
| • | We entered into a 100% coinsurance agreement with Accordia to cede all policy liabilities for the closed block established in connection with the demutualization of Indiana Life Insurance Company (“ILICO”), which had been previously acquired by Aviva USA. The ILICO closed block consists primarily of participating whole life insurance policies. Effective December 1, 2015, Accordia retroceded substantially all of the policy liabilities for the ILICO closed block to Ameritas Life Insurance Corp. (“Ameritas”). Under the terms of the retrocession agreement, Ameritas is required to maintain a trust account with a required statutory balance set forth in the retrocession agreement. As of September 30, 2016, Ameritas was obligated to maintain $710 million in the trust account, and as of such date, assets in excess of such amount were maintained in the trust account. AAIA is permitted to |
175
Table of Contents
| withdraw funds from the trust account under certain circumstances. As of September 30, 2016, outstanding obligations ceded pursuant to this arrangement amounted to $744 million in statutory reserves. |
| • | We entered into the following coinsurance and funds withheld agreements with FAFLIC to cede substantially all policy liabilities for the below described life insurance policies issued by Aviva USA’s New York entity, ALACNY. |
| • | ALICNY (formerly ALACNY) entered into a 100% funds withheld coinsurance agreement with FAFLIC covering certain term and universal life policies which have reserves that are subject to financing arrangements. Under the terms of the agreement, ALICNY is obligated to maintain a funds withheld account with an agreed-upon statutory balance that, as of September 30, 2016, approximated $229 million. |
| • | ALICNY entered into a 100% coinsurance agreement with FAFLIC covering certain term and universal life policies which have reserves that are not subject to financing arrangements. Under the terms of the agreement, FAFLIC is obligated to maintain a trust account with an agreed-upon required statutory balance that, as of September 30, 2016, approximated $334 million. As of such date, assets in excess of such amount were maintained in the trust account. |
| • | ALICNY entered into a 100% coinsurance and assumption agreement with FAFLIC covering substantially all of ALICNY’s in-force life business that is not ceded pursuant to the agreements described in the preceding two paragraphs. Under the terms of the agreement, FAFLIC is obligated to maintain a trust account with an agreed-upon required statutory balance that, as of September 30, 2016, approximated $267 million. As of such date, assets in excess of such amount were maintained in the trust account. |
| • | As of September 30, 2016, outstanding obligations ceded pursuant to the three FAFLIC reinsurance agreements discussed above approximated $1.0 billion in statutory reserves. |
We continue to have the primary legal obligation to satisfy claims and obligations relating to those policies not novated to Accordia or FAFLIC. As a consequence, if Accordia or FAFLIC were unable to satisfy its reinsurance obligations on such life policies, we would be responsible for satisfying those contractual obligations reinsured by Accordia or FAFLIC, respectively. We do not maintain a security interest in the custody account discussed above, and therefore in the event of an Accordia insolvency, the assets of the custody account may be available to satisfy the claims of Accordia’s general creditors. In addition, in the event of an Accordia insolvency, our claims against Accordia would be subordinated to those of its policyholders. As of September 30, 2016, each of Accordia and FAFLIC was rated A- by A.M. Best.
Protective
On April 29, 2011, AADE ceded substantially all of its life and health business to Protective under a coinsurance agreement. As part of this transaction, we transferred assets backing reserves and miscellaneous other liabilities on the life and health business. The reserve assets were placed in a trust account maintained by Protective for our benefit to secure the obligations of the reinsurer of the acquired business. As of September 30, 2016, the statutory book value of assets in this trust was approximately $1.5 billion and the outstanding obligations ceded pursuant to the arrangement amounted to $1.5 billion. In the event that Protective is unable to satisfy its reinsurance obligations with respect to the policies ceded and the trust assets prove insufficient to satisfy the resulting obligations, we would have the primary legal obligation to satisfy such deficiency. In the event of a Protective insolvency, our claim against Protective would be subordinated to those of its policyholders. As of September 30, 2016, Protective was rated A+ by A.M. Best.
176
Table of Contents
Investment Management
Investment activities are an integral part of our business and our net investment income is a significant component of our total revenues. Our investment philosophy in the United States is to invest a portion of our assets in securities that earn us incremental yield by taking liquidity risk and complexity risk and capitalizing on our long-dated and persistent liability profile to prudently achieve higher net investment earned rates, rather than assuming solely credit risk. We have established a significant base of earnings and as of September 30, 2016 have an expected annual investment margin of 2-3% over the 8.4 year weighted-average life of our deferred annuities, which make up a substantial portion of our reserve liabilities. Because we have remained disciplined in underwriting attractively priced liabilities, we have the ability to invest in a broad range of high quality assets to generate attractive earnings.
Our differentiated investment strategy benefits from our strategic relationship with Apollo and its indirect subsidiary, AAM. AAM provides a full suite of services for our investment portfolio, including direct investment management, asset allocation, mergers and acquisition asset diligence, and certain operational support services, including investment compliance, tax, legal and risk management support. AAM provides portfolio management services for substantially all of our invested assets (excluding our German invested assets) and currently provides direct asset selection for approximately 81% of our investment portfolio (excluding Germany). The remaining 19% is outsourced to Apollo and its affiliates to access additional sourcing and underwriting capabilities. Substantially all of the assets subject to a sub-advisory arrangement are sub-advised by Apollo affiliates. AAM allocates portions of our asset portfolio to sub-advisors to manage based on market opportunities. AAM also provides a slate of other asset and portfolio management services to us.
Through our relationship with Apollo, AAM has identified unique investment opportunities for us. AAM’s knowledge of our funding structure and regulatory requirements allows it to design bespoke strategies and investments for our portfolio. For example, we hold a significant investment in MidCap through a consolidated investment fund managed by Apollo, together with loans made directly to MidCap. When we originally invested in MidCap Financial in November 2013, MidCap Financial was a specialty finance company which primarily originated lending opportunities in the healthcare sector. With the assistance of Apollo, MidCap Financial entered new lending markets, raised substantial equity capital and restructured as MidCap in January 2015. MidCap represents a unique investment in an origination platform made available to us through our relationship with Apollo and, from time to time, provides us with access to assets for our investment portfolio. As of September 30, 2016, our exposure, including loaned amounts, to MidCap and its predecessor entities approximated $748 million, which represented approximately 1.0% of our total invested assets and 10.6% of total AHL shareholders’ equity. As of September 30, 2016, the value of our equity investment in MidCap had increased by 26.7% since our original investment in November 2013.
Since its inception, AAM has developed a track record for delivering sound investment returns. According to AAM, for the years ended December 31, 2015, 2014 and 2013, it generated total returns on the invested assets in our U.S. and Bermuda accounts owned by us or in accounts supporting reinsurance ceded to our subsidiaries by third-party insurers (the “North America Accounts”), net of management and sub-advisory fees, but gross of any other direct or indirect fees and expenses paid or payable directly or indirectly by us, of 3.30%, 6.82% and 4.42%, respectively. See “Certain Relationships and Related Party Transactions—Relationships and Related Party Transactions with Apollo or its Affiliates” for further discussion of fees paid or payable to Apollo and its affiliates, including AAM, and “Risks Relating to Our Investment Manager—The historical performance of AAM and AAME should not be considered as indicative of the future results of our investment portfolio, our future results or any returns expected on our common shares” for further discussion regarding the risks inherent in historical total return figures.
177
Table of Contents
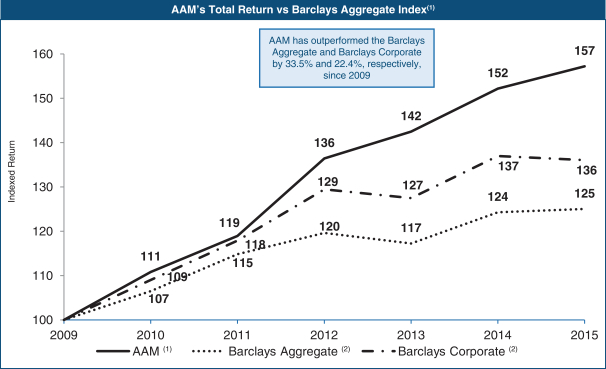
| (1) | This chart presents AAM’s total return relative to the performance of the Barclays Aggregate Index and the Barclays Corporate Index, with each index presented without any deduction for fees given that such indices are not actual portfolios managed by investment advisors. Such presentation is provided solely as an indication of the performance of fixed income strategies. No index, including the Barclays indices presented here, is directly comparable to AAM’s total return as the composition of the portfolio generating AAM’s total return inherently differs from the portfolio of securities represented by the respective index. In particular, with respect to the above presentation, the AAM total return figures reflect the performance of certain equity securities, structured securities and other asset classes not represented in either of the Barclays indices presented above. Athene’s historical results are not necessarily indicative of its future operating results. This chart is not intended to imply that AAM’s total return is correlated with the performance of either of the indices presented and AAM’s total return, and the volatility of such return, may be, and in many cases is likely to be, materially different from the performance of such indices. |
We are downside focused and our asset allocations reflect the results of stress testing. Additionally, we establish what we believe are conservative risk thresholds which in turn define risk tolerance across a wide range of factors, including credit risk, liquidity risk, concentration risk and caps on specific asset classes. We protect against rising interest rates, as our assets are generally slightly shorter in effective duration than our liabilities, resulting in a risk profile that we believe could sustain substantial increases in rates over and above what is implied by current futures markets without sustaining net losses. See “—Hedging Program and Derivatives.” As of September 30, 2016, 29% of our invested assets were floating rate investments which would allow us the flexibility to quickly increase our crediting rates in a rising interest rate environment, if desired.
As a result of our robust combination of underwriting and investment management capabilities, we are able to achieve investment margins that provide attractive risk-adjusted returns and that provide us with a base of future earnings. We generated net investment income of $2.1 billion and $1.8 billion for the nine months ended September 30, 2016 and 2015, respectively, and $2.5 billion, $2.3 billion and $1.1 billion for the years ended December 31, 2015, 2014 and 2013, respectively. We generated consolidated net investment earned rates of 4.23% and 4.25% for the nine months ended September 30, 2016 and 2015, respectively, and 4.24%, 4.29% and 6.66% for the years ended December 31, 2015, 2014 and 2013, respectively. We believe that achieving an investment margin of 2-3% would maintain our attractive financial profile and is achievable given our underwriting and asset management capabilities. Moreover, our investing capabilities support our ability to sell fixed annuities profitably and to competitively price acquisitions while meeting our earnings expectations.
178
Table of Contents
The deep experience of the AAM investment team and Apollo’s credit portfolio managers assists us in sourcing and underwriting complex asset classes. AAM has selected a diverse array of corporate bonds and more structured, but highly rated asset classes. We also maintain holdings in floating rate and less rate-sensitive investments, including CLOs, non-agency RMBS and various types of structured products. These asset classes permit us to earn incremental yield by assuming liquidity risk and complexity risk, rather than assuming solely credit risk. Our invested assets, net investment earned rate and NAIC designations by asset class were as follows for the periods presented below (dollars in millions):
| As of and for the nine months ended September 30, 2016 |
As of and for the year ended December 31, 2015 |
|||||||||||||||||||||||
| Invested Asset Value(1) |
Net Investment Earned Rate |
Percent NAIC 1 & 2 |
Invested Asset Value(1) |
Net Investment Earned Rate |
Percent NAIC 1 & 2 |
|||||||||||||||||||
| Corporates |
$ | 30,219 | 3.92% | 91.9% | $ | 27,677 | 3.79% | 93.8% | ||||||||||||||||
| RMBS |
10,503 | 5.11% | 97.2% | 8,870 | 5.10% | 97.9% | ||||||||||||||||||
| CLOs |
5,960 | 4.64% | 80.9% | 5,648 | 5.43% | 83.6% | ||||||||||||||||||
| ABS |
3,643 | 7.08% | 92.2% | 3,504 | 4.39% | 95.6% | ||||||||||||||||||
| CMBS |
2,289 | 3.77% | 98.5% | 1,951 | 3.12% | 99.3% | ||||||||||||||||||
|
|
|
|
|
|
|
|
|
|||||||||||||||||
| Total structured securities |
22,395 | 5.18% | 92.2% | 19,973 | 4.79% | 93.6% | ||||||||||||||||||
|
|
|
|
|
|
|
|
|
|||||||||||||||||
| State, municipal, political subdivisions and U.S. and foreign government |
1,416 | 4.49% | 96.4% | 1,445 | 4.59% | 97.3% | ||||||||||||||||||
| Mortgage loans |
6,031 | 5.86% | 5,826 | 5.42% | ||||||||||||||||||||
| Alternative investments |
3,309 | 5.34% | 3,441 | 5.89% | ||||||||||||||||||||
| Other U.S. and Bermuda invested assets |
2,482 | 1.02% | 2,951 | 1.00% | ||||||||||||||||||||
|
|
|
|
|
|
|
|
|
|||||||||||||||||
| U.S. and Bermuda |
65,852 | 4.46% | 61,313 | 4.28% | ||||||||||||||||||||
| Germany(2) |
5,743 | 1.71% | 96.0% | 5,646 | 2.00% | 96.8% | ||||||||||||||||||
|
|
|
|
|
|
|
|
|
|||||||||||||||||
| Consolidated total |
$ | 71,595 | 4.23% | $ | 66,959 | 4.24% | ||||||||||||||||||
|
|
|
|
|
|
|
|
|
|||||||||||||||||
| (1) | Refer to “Management’s Discussion and Analysis of Financial Condition and Results of Operations—Key Operating and Non-GAAP Measures—Invested Assets” for the definition of invested assets and “Management’s Discussion and Analysis of Financial Condition and Results of Operations—Non-GAAP Measure Reconciliations” for the reconciliations to the nearest GAAP measure. |
| (2) | NAIC 1 and 2 for Germany indicates the percentage of total AFS fixed maturities by applying NRSRO ratings to map to NAIC ratings. |
In addition to our core fixed income portfolio, we opportunistically allocate 5-10% of our portfolio to alternative investments where we primarily focus on fixed income-like, cash flow-based investments. Our alternative investment strategy is inherently opportunistic rather than being derived from allocating a fixed percentage of assets to the asset class and the strategy is subject to internal concentration limits. Individual alternative investments are selected based on the investment’s risk-reward profile, incremental effect on diversification and potential for attractive returns due to sector and/or market dislocations. We have a strong preference for alternative investments that have the following characteristics, among others: (i) investments that constitute a direct investment or an investment in a fund with a high degree of co-investment; (ii) investments with debt-like characteristics (for example, a stipulated maturity and par value), or alternatively, investments with reduced volatility when compared to pure equity; and (iii) investments that have less downside risk.
As of September 30, 2016, approximately 93.1% of our AFS fixed maturity securities, including related parties, were rated NAIC 1 or NAIC 2 (with investments of our German operations rated by applying NRSRO equivalent ratings to map NAIC ratings).
Our asset portfolio is managed within the limits and constraints set forth in our Investment and Credit Risk Policy. Under this policy, we set limits on investments in our portfolio by asset class, such as corporate bonds, emerging markets securities, municipal bonds, non-agency RMBS, CMBS, CLOs, commercial mortgage whole loans and mezzanine loans and alternative investments. We also set credit risk limits for exposure to a single issuer that vary based on ratings. In addition, our asset portfolio is constrained by its scenario-based capital ratio limit and its stressed liquidity limit.
As part of our reinvestment strategy for the investment portfolios of our acquired companies, we generally seek to reinvest assets at yields higher than the related assets being liquidated for reinvestment. We have
179
Table of Contents
reinvested a substantial portion of the investment portfolio acquired in our acquisition of Aviva USA, which contributed to the increase in fixed income and other net investment earned rates on this block of business to 4.12% for the year ended December 31, 2015 from 3.50% (on an annualized basis) for the fourth quarter of 2013.
In Germany, our wholly owned subsidiary, ADKG, provides investment management services to our other German Group Companies. ADKG entered into an investment advisory agreement with AAME pursuant to which AAME provides advisory services for a significant portion of our German investment portfolio.
Reserves
We establish and carry actuarially-determined reserves that are calculated to meet our future obligations, which require us to make certain assumptions regarding expenses, investment yields, mortality, morbidity and persistency, with a provision for adverse deviation as appropriate, each as of the date of issue or acquisition. The assumptions used require considerable judgment. We review overall policyholder experience at least annually and update these assumptions when deemed necessary based on additional information that becomes available. For immediate annuity products, assumptions used in the reserve calculation can only be changed if the reserve is deemed to be insufficient. For all other insurance products, current assumptions are used in the calculation of reserves. For FIAs, the aggregate initial liability is equal to the deposit received plus a bonus, if applicable, and is split into a host component and an embedded derivative component. Thereafter, the host contract accretion rate is updated each quarter so that the present value of actual and expected guaranteed cash flows is equal to the initial host value and the embedded derivative liability is recognized at fair value, with the change in fair value recorded in interest sensitive contract benefits in our consolidated statements of income. Changes in, or deviations from, the assumptions used to set our reserves can significantly affect our reserve levels and related results of operations. See “Risk Factors—Risks Relating to Our Business—Our business, financial condition, liquidity, results of operations and cash flows depend on the accuracy of our management’s assumptions and estimates, and we could face significant losses if these assumptions and estimates differ significantly from actual results.”
Persistency is the probability that a policy will remain in force from one period to the next. We make assumptions about persistency based on expected policyholder behavior in future periods, including full and partial contract surrenders. Policyholder behavior is influenced by a number of factors including, but not limited to, recent and current performance of the policy, contractual guarantees contained within the policy, availability of alternative products and general economic conditions.
A surrender rate is the percentage of account value surrendered by the policyholder. A lapse rate is the percentage of account value canceled by us due to nonpayment of premiums or surrender of the policy. Our surrender rate experience on our FIA products for the nine months ended September 30, 2016 and the year ended December 31, 2015 was within our assumed ranges. Our estimate of surrender behavior is based on assumptions reflecting actual experience and we believe that, over the duration of the policies, we may experience a wide range of policyholder behavior and market conditions.
Mortality is the incidence of death among policyholders triggering the payment of underlying insurance benefits by the insurer. In addition, mortality also refers to the ceasing of payments on life-contingent annuities due to the death of the annuitant. We utilize a combination of actual and industry experience when setting our mortality assumptions.
We also set reserves for the guaranteed minimum benefits for some of our products. The assumptions used to establish the liabilities for our product guarantees require considerable judgment. At issue, and at each subsequent valuation, we determine the present value of the cost of guaranteed minimum benefits contained in our policies in excess of benefits that are funded by the account value. We also calculate the expected value of the future cost of providing these benefits. In making these projections, a number of assumptions are made and we update these assumptions as experience emerges, when required. We have limited experience to date on policyholder behavior for our guaranteed minimum benefit products which our acquirees began issuing in 2006,
180
Table of Contents
and as a result, future experience could lead to significant changes in our assumptions. If emerging experience deviates from our assumptions on utilizations of these benefits, such deviations could have a significant effect on our reserve levels and related results of operations. We periodically review these assumptions and, if necessary, update them based on additional information that becomes available. Changes in or deviations from the assumptions used can significantly affect our reserve levels and related results of operations.
To the extent actual experience differs from assumptions and estimates used to establish reserves, we may be required to increase or decrease our reserves to reflect changes in our expectations. Any such increase could cause a material increase in our liabilities and a reduction in our profitability, including operating losses and a reduction of capital.
Outsourcing
With regard to our U.S. business, we outsource some portion or all of each of the following functions to third-party service providers:
| • | hosting of financial systems; |
| • | service of existing policies; |
| • | custody; |
| • | some information technology development and maintenance; and |
| • | call centers. |
We closely manage our outsourcing partners and integrate their services into our operations. We believe that outsourcing such functions allows us to focus capital and our employees on our core business operations and perform differentiating functions, such as actuarial, product development and risk management functions. In addition, we believe an outsourcing model provides predictable pricing, service levels and volume capabilities and allows us to benefit from technological developments that enhance our customer self-service and sales processes that we would not otherwise be able to take advantage of without reinvesting more of our own capital.
The majority of our new business and policy administration is handled in-house. For some closed in-force blocks of business we partner with Alliance – One Services, Inc., Concentrix Insurance Administrative Solutions Corporation and Infosys McCamish Systems, LLC to provide policy administration services. For information technology services, we utilize some providers for managed services or supplemental labor, including Tata Consulting Services Limited and UST Global Inc., and utilize Hewlett Packard Company for data center, infrastructure and related services. For investment management services, we utilize AAM, AAME and Apollo. See “—Investment Management” and “—Competitive Strengths—Superior and Unique Investment Capabilities.” We believe that we have a good relationship with our principal outsource service providers.
Affiliated Reinsurance
Our U.S. insurance subsidiaries participate in reinsurance arrangements pursuant to which each cedes certain insurance risks to ALRe. ALRe is a fully licensed, operational and fully equity capitalized reinsurance company with third-party clients. Our U.S. insurance subsidiaries have entered into modified coinsurance agreements with ALRe under which they cede to ALRe a 100% quota share of their respective obligations to repay the principal upon maturity or earlier termination and to make periodic interest payments under funding agreements issued by them. Our U.S. insurance subsidiaries have similar arrangements with ALRe with respect to substantially all of their other core business, under which generally 80% of all such business is ceded to ALRe on a modified coinsurance basis. To support these internal reinsurance arrangements, ALRe holds the substantial majority of our capital with $5.7 billion of statutory capital as of December 31, 2015. ALRe had a BSCR of 323% as of December 31, 2015.
181
Table of Contents
Hedging Program and Derivatives
We use, and may continue to use, derivatives, including swaps, options, futures and forward contracts and reinsurance contracts to hedge risks such as current or future changes in the fair value of our assets and liabilities, current or future changes in cash flows, changes in interest rates, equity markets, currency fluctuations and changes in longevity. In particular, we purchase options and equity futures to hedge the market risk exposure inherent in our FIA products, which have crediting rates tied to certain market indices. Our hedging program is focused on hedging our economic risk exposures and reducing the variation in our realized investment margin.
We use a combination of equity options, equity index futures, and variance, interest rate, and currency swaps to hedge the risks from the equity derivatives embedded in our FIAs. Through the use of our hedging strategy, we are able to minimize the net impact on capital and surplus of market variations affecting our embedded derivatives.
In addition to hedging the risks from embedded derivatives, we also use currency swaps and futures to hedge mismatches between the currency of our liability cash flows and our assets. Although cash-flow matching and ALM analyses are employed to manage our interest rate and funding exposures, we may also use interest rate derivatives to ensure that our net economic interest rate exposure is within our risk tolerances.
Despite utilizing sophisticated risk management tools and strategies in selecting assets as well as hedges, we remain subject to the risk that our hedging strategies may not have the desired impact on the results of operations or financial condition due to inaccuracy of management’s assumptions or estimates or to the transaction costs or execution risk associated with those strategies. See “Risk Factors—Risks Relating to Our Business—Our business, financial condition, liquidity, results of operations and cash flows depend on the accuracy of our management’s assumptions and estimates, and we could face significant losses if these assumptions and estimates differ significantly from actual results” and “Risk Factors—Risks Relating to Insurance and Other Regulatory Matters—Changes in the laws and regulations governing the insurance industry or otherwise applicable to our business, including the newly-issued DOL fiduciary regulation, may have a material adverse effect on our business, financial condition, liquidity, results of operations and prospects.”
Financial Strength Ratings
Our access to funding and our related cost of borrowing, the attractiveness of certain of our subsidiaries’ products to customers, our attractiveness as a reinsurer to potential ceding companies and requirements for derivatives collateral posting are affected by our credit ratings and insurance financial strength ratings, as well as those of our subsidiaries, which are periodically reviewed by the rating agencies. Financial strength ratings and credit ratings are important factors affecting consumer confidence in an insurer and its competitive position in marketing products as well as critical factors considered by ceding companies in selecting a reinsurer.
182
Table of Contents
As of September 30, 2016, Fitch, S&P and A.M. Best had issued credit ratings, financial strength ratings and/or outlook statements regarding us, as listed below. Credit ratings represent the opinions of rating agencies regarding an entity’s ability to repay its indebtedness. Financial strength ratings represent the opinions of rating agencies regarding the financial ability of an insurer or reinsurer to meet its obligations under an insurance policy or reinsurance arrangement and generally involve quantitative and qualitative evaluations by rating agencies of a company’s financial condition and operating performance. Generally, rating agencies base their financial strength ratings upon information furnished to them by the company and upon their own investigations, studies and assumptions. Financial strength ratings are based upon factors of concern to policyholders, agents, intermediaries and ceding companies and are not directed toward the protection of investors. Credit and financial strength ratings are not recommendations to buy, sell or hold securities and they may be revised or revoked at any time at the sole discretion of the rating organization.
| Company |
A.M. Best | S&P | Fitch | |||||||||
| Athene Holding Ltd. |
||||||||||||
| Issuer Credit Rating/Counterparty Credit Rating/Issuer Default Rating |
bbb- | BBB | BBB | |||||||||
| Outlook |
Positive | Stable | Stable | |||||||||
| Athene Life Re Ltd. |
||||||||||||
| Financial Strength Rating |
A- | A- | A- | |||||||||
| Outlook |
Positive | Stable | Stable | |||||||||
| Athene Annuity & Life Assurance Company |
||||||||||||
| Financial Strength Rating |
A- | A- | A- | |||||||||
| Outlook |
Positive | Stable | Stable | |||||||||
| Athene Annuity & Life Assurance Company of New York |
||||||||||||
| Financial Strength Rating |
A- | A- | A- | |||||||||
| Outlook |
Positive | Stable | Stable | |||||||||
| Athene Annuity and Life Company |
||||||||||||
| Financial Strength Rating |
A- | A- | A- | |||||||||
| Outlook |
Positive | Stable | Stable | |||||||||
| Athene Life Insurance Company of New York |
||||||||||||
| Financial Strength Rating |
A- | Not Rated | Not Rated | |||||||||
| Outlook |
Positive | Not Rated | Not Rated | |||||||||
| Rating Agency |
Financial Strength Rating Scale |
Senior Unsecured Notes Credit Rating Scale | ||
| A.M. Best(1) |
“A++” to “S” | “aaa” to “rs” | ||
| S&P(2) |
“AAA” to “R” | “AAA” to “D” | ||
| Fitch(3) |
“AAA” to “C” | “AAA” to “D” |
| (1) | A.M. Best’s financial strength rating is an independent opinion of an insurer’s or reinsurer’s financial strength and ability to meet its ongoing insurance policy and contract obligations. It is based on a comprehensive quantitative and qualitative evaluation of a company’s balance sheet strength, operating performance and business profile or, where appropriate, the specific nature and details of a security. The analysis may include comparisons to peers, industry standards and proprietary benchmarks as well as assessments of operating plans, philosophy, management, risk appetite and the implicit or explicit support of a parent or affiliate. A.M. Best’s long-term credit ratings reflect its assessment of the ability of an obligor to pay interest and principal in accordance with the terms of the obligation. Ratings from “aa” to “ccc” may be enhanced with a “+” (plus) or “-” (minus) to indicate whether credit quality is near the top or bottom of a category. A.M. Best’s short-term credit rating is an opinion as to the ability of the rated entity to meet its senior financial commitments on obligations maturing in generally less than one year. |
| (2) | S&P’s insurer financial strength rating is a forward-looking opinion about the financial security characteristics of an insurance organization with respect to its ability to pay under its insurance policies and contracts in accordance with their terms. Generic rating categories range from “AAA” to “D.” A “+” or “-” |
183
Table of Contents
| indicates relative strength within a generic category. An S&P credit rating is an assessment of default risk, but may incorporate an assessment of relative seniority or ultimate recovery in the event of default. Short-term issuer credit ratings reflect the obligor’s creditworthiness over a short-term time horizon. |
| (3) | Fitch’s financial strength ratings provide an assessment of the financial strength of an insurance organization. The National Insurer Financial Strength Rating is assigned to the insurance company’s policyholder obligations, including assumed reinsurance obligations and policyholder obligations, such as guaranteed investment contracts. Within long-term and short-term ratings, a “+” or a “-” may be appended to a rating to denote relative status within major rating categories. |
In addition to the financial strength ratings, rating agencies use an “outlook statement” to indicate a medium or long-term trend which, if continued, may lead to a rating change. A positive outlook indicates a rating may be raised and a negative outlook indicates a rating may be lowered. A stable outlook is assigned when ratings are not likely to be changed. Outlooks should not be confused with expected stability of the issuer’s financial or economic performance. A rating may have a “stable” outlook to indicate that the rating is not expected to change, but a “stable” outlook does not preclude a rating agency from changing a rating at any time without notice.
A.M. Best, Fitch and S&P review their ratings of insurance companies from time to time. There can be no assurance that any particular rating will continue for any given period of time or that it will not be changed or withdrawn entirely if, in their judgment, circumstances so warrant. While the degree to which ratings adjustments will affect sales and persistency is unknown, we believe if our ratings were to be negatively adjusted for any reason, we could experience a material decline in the sales of our products and the persistency of our existing business. See “Risk Factors—Risks Relating to Our Business—A financial strength rating downgrade, potential downgrade or any other negative action by a rating agency could make our product offerings less attractive, inhibit our ability to acquire future business through acquisitions or reinsurance and increase our cost of capital, which could have a material adverse effect on our business,” and “Risk Factors—Risks Relating to Our Business—The amount of statutory capital that our insurance and reinsurance subsidiaries have can vary significantly from time to time and is sensitive to a number of factors outside of our control.”
Competition
We operate in highly competitive markets. We face a variety of large and small industry participants, including diversified financial institutions and insurance and reinsurance companies. These companies compete in one form or another for the growing pool of retirement assets driven by a number of external factors such as the continued aging of the population and the reduction in safety nets provided by governments and private employers. In many segments, product differentiation is difficult as product development and life cycles have shortened. In addition, we have experienced pressure on fees as product unbundling and lower cost alternatives have emerged. As a result, scale and the ability to provide value-added services and build long-term relationships are important factors to compete effectively. See “Risk Factors—Risks Relating to Our Business—We operate in a highly competitive industry that includes a number of competitors, many of which are larger and more well-known than we are, which could limit our ability to achieve our growth strategies and could materially and adversely affect our business, financial condition, results of operations, cash flows and prospects.” We believe that our leading presence in the retirement market, diverse range of capabilities and broad distribution network uniquely position us to effectively serve consumers’ increasing demand for retirement solutions, particularly in the FIA market.
We face competition in the FIA market from traditional insurance carriers such as Allianz Life Insurance Company of North America (“Allianz”) and American Equity Investment Life Insurance Company (“AEL”). Principal competitive factors for FIAs are initial crediting rates, reputation for renewal crediting action, product features, brand recognition, customer service, cost, distribution capabilities and financial strength ratings of the provider. Competition may affect, among other matters, both business growth and the pricing of our products and services. According to LIMRA, for the six months ended June 30, 2016 (the most recent period that data is currently available), the leading two providers of FIAs were Allianz and AEL with market shares of 18.3% and
184
Table of Contents
10.1%, respectively. The aggregate market share of the top ten providers of FIAs for the same period was 65.8%. For the six months ended June 30, 2016 (the most recent period that data is currently available), we were the 5th largest FIA provider in the United States based on retail FIA sales, and our market share for the same period was 5.0%. According to LIMRA, for the year ended December 31, 2015, the leading two providers of FIAs were Allianz and AEL with market shares of 16.0% and 12.5%, respectively. The aggregate market share of the top ten providers of FIAs for the same period was 66.0%. For the year ended December 31, 2015, we were the 6th largest FIA provider in the United States based on retail FIA sales, and our market share for the same period was 4.5%.
Reinsurance markets are highly competitive, as well as cyclical by product and market. As a reinsurer, ALRe competes on the basis of many factors, including, among other things, financial strength, pricing and other terms and conditions of reinsurance agreements, reputation, service and experience in the types of business underwritten. The market impact of these and other factors related to reinsurance is generally not consistent across lines of business, domestic and international geographical areas and distribution channels. ALRe’s competition includes other insurance and reinsurance companies, such as Reinsurance Group of America, Incorporated, Global Atlantic, Resolution Life, Inc. and Protective.
We also face competition in the market for acquisition targets, such as profitable blocks of insurance and whole businesses. Such competition is likely to intensify as insurance businesses become more attractive acquisition targets for both other insurance companies and financial and other institutions and as the already substantial consolidation in the financial services industry continues. We believe that our demonstrated ability to source and consummate complex transactions is a competitive advantage over other similar acquirers. We also compete for potential acquisition opportunities based on a number of factors including perceived financial strength, brand recognition, reputation and the pricing we are able to offer, which, to the extent we determine to finance a transaction, is in turn dependent on our ability to do so on suitable terms.
Employees
As of September 30, 2016, we had approximately 1,360 employees located in Bermuda, Germany and the United States. We believe that our employee relations are good. Whereas none of our employees located in Bermuda or the United States are subject to collective bargaining agreements and we are not aware of any current efforts to implement such agreements, one of our German Group Companies, ALV, is a member of the employers’ association of insurance companies in Germany (Arbeitgeberverband der Versicherungsunternehmen in Deutschland e.V.). As such, ALV is required to apply the collective bargaining agreements entered into with the association and the relevant trade union to those employees that are members of the trade union. In addition, each of the German Group Companies applies these collective bargaining agreements based on individual agreements to most of the non-unionized staff as well. As of September 30, 2016, approximately 200 employees of our German Group Companies were directly or indirectly subject to such agreements. The collective bargaining agreements are for an indefinite term and apply as long as the relevant German Group Company is a member of the employers’ association. There are also joint local employee representative bodies for the German operations, such as works councils and an economics committee, which have statutory co-determination, information and participation rights in accordance with German laws. The German Group Companies are required to apply and comply with various collective agreements with these local employee representations, such as works agreements. Two employee representatives are members of the supervisory board of our principal German life insurance carrier, ALV.
Properties
We own our headquarters for U.S. operations, which is located in West Des Moines, IA. We lease our head office for Bermuda operations, which is located in Pembroke, Bermuda, and we lease our office for our German operations, which is located in Wiesbaden, Germany. We believe that for the foreseeable future our West Des Moines, Bermuda and German properties will be sufficient for us to conduct our current operations.
185
Table of Contents
Legal Proceedings
We are subject to litigation arising in the ordinary course of our business, including litigation principally relating to our FIA business. We cannot assure you that our insurance coverage will be adequate to cover all liabilities arising out of such claims. We are not engaged in any legal proceeding that we believe will be material to our business, financial condition, results of operations or cash flows. Certain significant legal proceedings to which we are currently a party are detailed below. In addition, from time to time, in the ordinary course of business and like others in the insurance and financial services industries, we receive requests for information from government agencies in connection with such agencies’ regulatory or investigatory authority. Such requests can include financial or market conduct examinations, subpoenas or demand letters for documents to assist the government in audits or investigations. We and each of our U.S. insurance subsidiaries review such requests and notices and take appropriate action. We have been subject to certain requests for information and investigations in the past and could be subject to them in the future.
Tax Treatment of FIA Hedges
The IRS has completed its examinations of the 2006 through 2010 Aviva USA tax years. Aviva USA agreed to all adjustments that were proposed with respect to those tax years with two exceptions: (1) AAIA’s treatment of call options used to hedge FIA liabilities for the tax years 2008–2010, and (2) the disallowance of offsetting tax deductions taken by AAIA and taxable income reported by the non-life subgroup with respect to unpaid IMO commissions. The first adjustment to which Aviva USA did not agree would disallow deductions of $191 million, $154 million and $76 million for 2008, 2009 and 2010, respectively. The second adjustment to which Aviva USA did not agree would increase non-life net operating losses and decrease AAIA net operating losses by $16 million in each of 2009 and 2010. Taxes, penalties and interest with respect to these two issues for the years under audit are potentially subject to indemnification by Aviva plc under the Stock Purchase Agreement (the “SPA”) between Aviva plc and AHL, dated December 21, 2012 assuming the SPA requirements are satisfied. Athene USA has been unable to negotiate a favorable settlement of this issue with the IRS, and has reserved its right to contest the adjustment in federal court. If the IRS position is upheld in federal court, Athene USA expects that it would owe tax of $120 million, plus interest, for tax years ending on or before the October 2, 2013 closing date of the SPA, which are subject to indemnification by Aviva plc as described above. The treatment of FIA hedges is a recurring issue as to the timing of the related deductions and could affect the current income tax incurred in periods after October 2, 2013, which are not subject to indemnification by Aviva plc. Given that the disallowance of a deduction in one period results in an increased deduction in a future period, AHL does not expect that there will be any material impact to its financial condition resulting from this issue.
Dispute Regarding COLI Investment
In 2000 and 2001, two insurance companies which were subsequently merged into AAIA purchased from American General Life Insurance Company (“American General”) broad based variable corporate-owned life insurance (“COLI”) policies that, as of September 30, 2016, had an asset value of approximately $324 million. In January 2012, the COLI policy administrator delivered to AAIA a supplement to the existing COLI policies and advised that American General and ZC Resource Investment Trust (“ZC Trust”) had unilaterally implemented changes set forth in the supplement that if effective, would: (i) potentially negatively impact the crediting rate for the policies and (ii) change the exit and surrender protocols set forth in the policies. In March 2013, AAIA filed suit against American General, ZC Trust and ZC Resource LLC in Chancery Court in Delaware, seeking, among other relief, a declaration that the changes set forth in the supplement were ineffectual and in breach of the parties’ agreement. The parties filed cross motions for judgment as a matter of law, and the court granted defendants’ motion and dismissed without prejudice on ripeness grounds. The issue that negatively impacts the crediting rate for one of the COLI policies has been triggered and we will pursue further adjudication. If the supplement is ultimately deemed to be effective, the purported changes to the policies could impair AAIA’s ability to access the value of guarantees associated with the policies. The value of the guarantees included within the asset value reflected above are $155 million as of September 30, 2016.
186
Table of Contents
Hudson Litigation
On June 12, 2015, a putative class action complaint was filed in the United States District Court, Northern District of California against us. The complaint, which is similar to complaints recently filed against other large insurance companies, primarily alleges that captive reinsurance and other transactions had the effect of misrepresenting the financial condition of AAIA. The complaint purports to be brought on behalf of a class of purchasers of annuity products issued by AAIA between 2007 and the present. There are also various allegations related to the purchase of Aviva USA and concerning entry into a modified coinsurance transaction with ALRe in October 2013. The suit asserts claims of violation of the Racketeer Influenced and Corrupt Organizations Act and seeks compensatory damages, trebled, in an amount to be determined, costs and attorneys’ fees. On March 25, 2016, the matter was transferred to the United States District Court, Southern District of Iowa. On May 25, 2016, the court granted plaintiff’s motion to file an amended complaint dropping plaintiff Silva and defendant Aviva plc. We moved to dismiss that complaint on June 30, 2016 and the motion was fully briefed as of September 8, 2016. By orders dated November 4 and November 14, 2016, the court stayed consideration of the motion to dismiss pending a ruling from the United States Court of Appeals for the Eighth Circuit in a similar case which will likely affect the disposition of our motion. See Ludwick v. Harbinger Grp., Inc., 161 F. Supp. 3d 769 (W.D. Mo. 2016), appeal docketed, No. 16-1561 (8th Cir.). We believe we have meritorious defenses to the claims set forth in the amended complaint and intend to vigorously defend the litigation and seek dismissal of the amended complaint.
Griffiths Litigation
On July 27, 2015, a putative class action complaint was filed in the United States District Court, District of Massachusetts against us. An amended complaint was filed on December 18, 2015. The complaint alleges a putative class action on behalf of all persons who are the beneficial owners of assets which were used to purchase structured settlement annuities that Aviva London Assignment Corporation, Aviva Life Insurance Company and CGU International Insurance, plc (the “Aviva Entities”) or their predecessors, as applicable, delivered to purchasers on or after April 1, 2003. The complaint alleges that the Aviva Entities sold structured settlement annuities to the public on the basis that such products were backed by a capital maintenance agreement by CGU International Insurance, plc, which was alleged as a source of great financial strength. The complaint further alleges that the Aviva Entities used this capital maintenance agreement to enhance the sales volume and raise the price of the annuities. The complaint claims that, as a result of Aviva USA’s sale to AHL, the capital maintenance agreement terminated. According to the complaint, no notice was provided to the owners of the structured settlement annuities and the termination of the capital maintenance agreement constituted a breach of contract and the plaintiff further asserts other causes of action. AHL is a named defendant due to its purchase of Aviva USA, and AAIA and Athene London Assignment are named as successors to Aviva Life Insurance Company and Aviva London Assignment Corporation, respectively. The defendants have answered and are engaged in the discovery process. We believe that we have meritorious defenses to the claims set forth in the complaint and intend to vigorously defend the litigation.
Regulation
Our U.S. insurance subsidiaries are licensed to transact insurance business in, and are subject to regulation and supervision by, all 50 states of the United States. Our German Group Companies licensed as insurers are subject to the relevant laws and regulations applicable to insurers in Germany, including but not limited to the Germany Insurance Supervisory Act (Versicherungsaufsichtsgesetz, “VAG”), and ALRe, a Bermuda domiciled insurer, is subject to regulation and supervision by the BMA and compliance with all applicable Bermuda law and Bermuda insurance statutes and regulations, including but not limited to the Bermuda Insurance Act. Our U.S. insurance subsidiaries are licensed, regulated and supervised in all jurisdictions where they conduct insurance business. The extent of such regulation varies, however, most jurisdictions have regulations and laws that require insurers and agents to be licensed and set standards of solvency and business conduct to be maintained by the insurer. Additionally, state statutes and regulations often require state approval of policy
187
Table of Contents
forms, policy language, rates and in some instances, marketing materials. Most states’ statutes and regulations prescribe permitted types and concentrations of investments. Our U.S. insurance subsidiaries are required to file detailed annual financial statements with supervisory agencies in each of the jurisdictions in which they transact an insurance business.
From time to time, in the ordinary course of business and like others in the insurance and financial services industries, our U.S. insurance subsidiaries receive requests for information from government agencies in connection with such agencies’ regulatory or investigatory authority. Such requests can include market conduct examinations, subpoenas or demand letters for documents to assist the government in audits or investigations. Each such subsidiary reviews such requests and notices and takes appropriate action. Our U.S. insurance subsidiaries have been subject to certain requests for information and investigations in the past and could be subject to them in the future.
United States
General
Each of our U.S. insurance subsidiaries is organized and domiciled in one of the Athene Domiciliary States and is also licensed in such state as an insurer. The insurance department of each Athene Domiciliary State regulates the applicable U.S. insurance subsidiary, and each U.S. insurance subsidiary is regulated by each of the insurance regulators in the other states where such company is authorized to transact insurance business. The primary purpose of such regulatory supervision is to protect policyholders rather than holders of any securities, such as the AHL common shares.
In addition, as part of our acquisition of Aviva USA, we acquired a special purpose insurance company, Athene Re IV, which is a subsidiary of AAIA. Athene Re IV is domiciled in Vermont and provides reinsurance to AAIA in order to facilitate the reserve financing associated with a closed block of policies resulting from the demutualization of a prior insurance company currently part of AAIA. As part of the acquisition of AAIA, the liabilities associated with such closed block of insurance policies, including any exposure to payments due from such special purpose insurance company subsidiary, were reinsured to Accordia. We do not write business that requires the use of captive reinsurers. The substantial majority of all policyholder obligations written or held by our insurance subsidiaries are reinsured to ALRe, a fully licensed, operational and fully equity capitalized reinsurance company with third-party clients. For more information on our reinsurance structures, see “—Affiliated Reinsurance” and “Management’s Discussion and Analysis of Financial Condition and Results of Operations—Liquidity and Capital Resources.”
Generally, insurance products underwritten by our U.S. insurance subsidiaries must be approved by the insurance regulators in each state in which they are sold. Those products are also substantially affected by federal and state tax laws. For example, changes in tax law could reduce or eliminate the tax-deferred accumulation of interest credited on the premiums paid by the holders of annuities and life insurance products, which could make such products less attractive to potential purchasers. A shift away from annuity products could reduce the investment income that our U.S. insurance subsidiaries earn on premiums or deposits received from the sale of such products, as well as the assets upon which our U.S. insurance subsidiaries earn income. In addition, certain insurance policies may also be subject to ERISA.
State insurance authorities have broad administrative powers over our U.S. insurance subsidiaries with respect to all aspects of their insurance business including: (1) licensing to transact business; (2) licensing of producers; (3) prescribing which assets and liabilities are to be considered in determining statutory surplus; (4) regulating premium rates for certain insurance products; (5) approving policy forms and certain related materials; (6) determining whether a reasonable basis exists as to the suitability of the annuity purchase recommendations producers make; (7) regulating unfair trade and claims practices; (8) establishing reserve requirements, solvency standards and MCR; (9) regulating the amount of dividends that may be paid in any year; (10) regulating the
188
Table of Contents
availability of reinsurance or other substitute financing solutions, the terms thereof and the ability of an insurer to take credit on its financial statements for insurance ceded to reinsurers or other substitute financing solutions; (11) fixing maximum interest rates on life insurance policy loans, minimum crediting rates on accumulation products and minimum allowable surrender values; (12) regulating the type, amounts and valuations of investments permitted; (13) setting parameters for transactions with affiliates; and (14) regulating other matters.
The rates, forms, terms and conditions of our U.S. insurance subsidiaries’ reinsurance agreements with unaffiliated third parties generally are not directly subject to regulation by any state insurance department in the United States. This contrasts with primary insurance where, as discussed above, the policy forms and premium rates are generally regulated by state insurance departments.
From time to time, increased scrutiny has been placed upon the U.S. insurance regulatory framework, and a number of state legislatures have considered or enacted legislative measures that alter, and in many cases increase, state authority to regulate insurance and reinsurance companies. In addition to legislative initiatives of this type, the NAIC and state insurance regulators are regularly involved in a process of reexamining existing laws and regulations and their application to insurance and reinsurance companies.
Furthermore, while the federal government in most contexts currently does not directly regulate the insurance business, federal legislation and administrative policies in a number of areas, such as employee benefits regulation, age, sex and disability-based discrimination, financial services regulation and federal taxation, can significantly affect the insurance business. It is not possible to predict the future impact of changing regulation on the operations of Athene. See “Risk Factors—Risks Relating to Insurance and Other Regulatory Matters.”
NAIC
The NAIC is an organization, the mandate of which is to benefit state insurance regulatory authorities and consumers by promulgating model insurance laws and regulations for adoption by the states. The NAIC also provides standardized insurance industry accounting and reporting guidance through the NAIC Accounting Manual. However, model insurance laws and regulations are only effective when adopted by the states, and statutory accounting and reporting principles continue to be established by individual state laws, regulations and permitted practices. Changes to the NAIC Accounting Manual or modifications by the various state insurance departments may affect the statutory capital and surplus of our U.S. insurance subsidiaries. AHL has entered into capital maintenance agreements with each of its material U.S. insurance subsidiaries, pursuant to which AHL agrees to provide capital to the subsidiary to the extent that the capital of the subsidiary falls below a specified threshold as set with the applicable subsidiary’s domestic regulator.
Some of the NAIC pronouncements, particularly as they affect accounting issues, take effect automatically in the various states without affirmative action by the states. Statutes, regulations and interpretations may be applied with retroactive impact, particularly in areas such as accounting and reserve requirements. Also, regulatory actions with prospective impact can potentially have a significant impact on currently sold products. The NAIC continues to work to reform state regulation in various areas, including comprehensive reforms relating to life insurance reserves.
Pursuant to its “Solvency Modernization Initiative,” the NAIC reviewed the U.S. financial regulatory system and all aspects of financial regulation affecting insurance companies. Though broad in scope, the Solvency Modernization Initiative focused on: (1) capital requirements; (2) corporate governance and risk management; (3) group supervision; (4) statutory accounting and financial reporting; and (5) reinsurance. This initiative has resulted in the recent adoption by the NAIC of the Own Risk and Solvency Assessment (“ORSA”) Model Act, which has been enacted by a number of states, including Delaware, Iowa and New York, and requires insurance companies to assess the adequacy of their and their group’s risk management and current and future solvency position. Under the ORSA Model Act, certain insurers must undertake an internal risk management
189
Table of Contents
review no less often than annually (but also at any time when there are significant changes to the risk profile of the insurer or its insurance group), in accordance with the NAIC’s ORSA Guidance Manual, and prepare an ORSA Report assessing the adequacy of the insurer’s risk management and capital in light of its current and future business plans. The ORSA Report is required to be filed with a company’s lead state regulator and made available to other domiciliary regulators within the holding company system. As of September 30, 2016, we were in compliance with all ORSA Report filing requirements.
In December 2012, the NAIC approved a new valuation manual containing a principle-based approach to life insurance company reserves. Principle-based reserving is designed to tailor the reserving process to specific products in an effort to create a principle-based modeling approach to reserving rather than the factor-based approach historically employed. Pursuant to the NAIC’s Standard Valuation Law (“SVL”), a minimum of 42 states representing at least 76% of total life insurance premiums written in the United States must pass legislation substantially similar to the SVL for the SVL to become operative as an NAIC model law. Currently, 46 states representing 85.7% of total life insurance premiums written in the United States have passed principle-based reserving legislation which has been deemed to be substantially similar to the SVL, meaning that the SVL is now operative, and principle-based reserving will become effective on January 1, 2017. Delaware and Iowa have each adopted a form of the SVL. New York is expected to adopt a form of the SVL in January 2018.
In November 2014, the NAIC adopted the Corporate Governance Annual Disclosure Model Act and Model Regulation (together, the “Corporate Governance Model Act”), which requires an insurer to provide an annual disclosure regarding its corporate governance practices to its lead state and/or domestic regulator. As adopted by the NAIC, the requirements of the Corporate Governance Model Act are intended to be effective January 1, 2016, with the first annual disclosure due by June 1, 2016. The Corporate Governance Model Act must be adopted by the individual states for the new requirements to apply, and specifically in Delaware, Iowa and New York for the changes to apply to our U.S. insurance subsidiaries. Iowa has adopted a form of the Corporate Governance Annual Disclosure Model Act, and the first corporate governance annual disclosure under that law was due on June 1, 2016. Neither Delaware nor New York has adopted the Corporate Governance Model Act, and it is not possible to predict whether Delaware and/or New York may adopt the Corporate Governance Model Act in the future; however, the NAIC is seeking to make the Corporate Governance Model Act part of its accreditation standards for state solvency regulation, which may motivate states to adopt the Corporate Governance Model Act.
Insurance Holding Company Regulation
Each direct and indirect parent of our U.S. insurance subsidiaries (including AHL) is subject to the insurance holding company laws of each of the Athene Domiciliary States. These laws generally require an insurance holding company and insurers that are members of such holding company system to register with their U.S. insurance regulators and to file certain reports with those authorities, including information concerning their capital structure, ownership, financial condition, certain intercompany transactions and general business operations. Generally, under these laws, transactions between our U.S. insurance subsidiaries and their affiliates, including any reinsurance transactions, must be fair and reasonable and, if material or of a specified category, require prior notice and approval or non-disapproval by the insurance department of each applicable Athene Domiciliary State.
Most states, including each of the Athene Domiciliary States, have insurance laws that require regulatory approval of a direct or indirect change of control of an insurer, which would include a change of control of its holding company. Laws such as these prevent any person from acquiring direct or indirect control of any of our U.S. insurance subsidiaries or their holding companies unless that person has filed a statement with specified information with the Commissioner of the applicable Athene Domiciliary State and has obtained the Commissioner’s prior approval. Under most states’ statutes, including those of each of the Athene Domiciliary States, acquiring 10% or more of a voting interest in an insurance company or its parent company is presumptively considered a change of control, although such presumption may be rebutted. Accordingly, any
190
Table of Contents
person who acquires 10% or more of a voting interest in a direct or indirect parent of any of our U.S. insurance subsidiaries (or AHL) without the prior approval of the Commissioner of the applicable Athene Domiciliary State will be in violation of the applicable Athene Domiciliary State’s law and may be subject to injunctive action requiring the disposition or seizure of those securities by the Commissioner or prohibiting the voting of those securities and to other actions determined by the Commissioner. Further, a willful violation of these laws is punishable in each Athene Domiciliary State as a criminal offense. In addition, the Model Insurance Holding Company System Regulatory Act (the “Amended Holding Company Model Act”) requires any controlling person of a U.S. insurer seeking to divest its controlling interest in the insurance company to file with the relevant insurance commissioner a confidential notice of the proposed divestiture at least thirty days prior to the cessation of control (unless a person acquiring control from the divesting party has filed notice of the proposed acquisition of control with the Commissioner). After receipt of the notice, the Commissioner must determine those instances in which the parties seeking to divest or to acquire a controlling interest will be required to file for or obtain approval of the transaction. These laws may discourage potential acquisition proposals and may delay, deter or prevent an acquisition of control of a direct or indirect parent of any of our U.S. insurance subsidiaries (including AHL) (in particular through an unsolicited transaction), even if the shareholders of such parent consider such transaction to be desirable. Our bye-laws include limitations on the voting power exercisable by shareholders of the company other than the Apollo Group so that certain persons or groups (“Control Groups”) are deemed not to hold more than 9.9% of the total voting power conferred by our shares. See “Description of Share Capital—Common Shares—Voting Rights.”
Recently, the NYSDFS adopted an amendment to its holding company system regulations which requires prospective acquirers of New York domiciled insurers to provide greater disclosure with respect to intended changes to the business operations of the insurer, and which expressly authorizes the NYSDFS to impose additional conditions on such an acquisition and limit changes that the acquirer may make to the insurer’s business operations for a specified period of time following the acquisition without the NYSDFS’ prior approval. In particular, the amendment provides the NYSDFS with the specific authority to require acquirers of New York domiciled life insurers to post assets in a trust account for the benefit of the target company’s policyholders. In making such determination, the NYSDFS may consider whether the acquirer is, or is controlled by or under common control with, an investment manager such as Apollo. The NAIC’s former Private Equity Issues Working Group, which was formed to develop best practice recommendations relating to acquisitions of control of insurance or reinsurance companies by private equity and hedge funds, recently adopted new narrative guidance for state insurance examiners to consider in reviewing applications for an acquisition of an insurer by a private equity firm. Such guidance has been adopted by the NAIC and is included in the 2015 Annual/2016 Quarterly edition of the NAIC’s Financial Analysis Handbook.
Although Athene Re IV is not subject to insurance holding company laws, the Vermont insurance regulator may use all or a part of the holding company law framework described above in determining whether to approve a proposed change of control.
In December 2010, the NAIC adopted the Amended Holding Company Model Act. The Amended Holding Company Model Act introduces the concept of “enterprise risk” within an insurance holding company system and imposes more extensive informational requirements on parents and other affiliates of licensed insurers or reinsurers, with the purpose of protecting the licensed companies from enterprise risk, including requiring an annual enterprise risk report by each ultimate controlling person identifying the material risks within the insurance holding company system that could pose enterprise risk to the licensed companies. An enterprise risk is an activity or event involving affiliates of an insurer that could have a material adverse effect on the insurer or the insurer’s holding company system. The Amended Holding Company Model Act must be adopted by the individual states for the new requirements to apply. Iowa, Delaware and New York have each adopted a form of the Amended Holding Company Model Act.
In December 2014, the NAIC adopted additional amendments to the Amended Holding Company Model Act for consideration by the various states that address the authority of an insurance commissioner to act as the group-wide supervisor for an internationally active insurance group or to acknowledge the authority of another
191
Table of Contents
regulatory official, from another jurisdiction, to so act. These changes to the Amended Holding Company Model Act must be enacted by the individual states before they will become effective, and specifically in Delaware, Iowa and New York for the changes to apply to our U.S. insurance subsidiaries. Delaware has adopted a form of these changes to the Amended Holding Company Model Act, and Iowa has adopted similar provisions under a predecessor statute. It is not possible to predict with any degree of certainty the additional capital requirements, compliance costs or other burdens these changes may impose in the future.
In addition, the NAIC has adopted a revised Suitability in Annuity Transactions Model Regulation (“SAT”), which places new responsibilities upon issuing insurance companies with respect to the suitability of annuity sales, including responsibilities for training agents. Many states, including Iowa, Delaware and New York, have already enacted laws and/or regulations based on SAT, thus imposing suitability standards with respect to sales of FIAs and variable annuities. Future changes in such laws and regulations could adversely impact the way we market and sell our annuity products.
Restrictions on Dividends and Other Distributions
Current law of the Athene Domiciliary States permits the payment of dividends or distributions which, together with dividends or distributions paid during (i) in the case of Delaware and Iowa, the preceding twelve months do not exceed the greater of (1) 10% of the insurer’s surplus as regards policyholders as of the immediately preceding year end or (2) the net gain from operations of the insurer for the preceding twelve-month period ending as of the immediately preceding year end or (ii) in the case of New York, any calendar year, do not exceed the lesser of (1) 10% of the insurer’s surplus as regards policyholders as of the end of the immediately preceding calendar year or (2) the net gain from operations of the insurer for the immediately preceding calendar year, not including realized capital gains. Any proposed dividend in excess of this amount is considered an “extraordinary dividend” or “extraordinary distribution” and may not be paid until it has been approved, or a 30-day waiting period has passed during which it has not been disapproved, by the Commissioner. Additionally, under current law of the Athene Domiciliary States, AAIA may only pay dividends from the insurer’s earned profits on its business, which shall not include contributed capital or contributed surplus, and AADE may only pay dividends from that part of its available and accumulated surplus funds which is derived from realized net operating profits on its business and realized capital gains. Further, as a condition to each of the NYSDFS’ and IID’s approval of Athene’s acquisition of ALACNY and AAIA, respectively, in connection with the broader Aviva USA acquisition, Athene agreed not to cause ALACNY or AAIA to declare, distribute or pay any dividend for five years from the date of acquisition of control of ALACNY or AAIA without the prior written consent of the NYSDFS or the IID, as applicable. The Athene Domiciliary States’ insurance laws and regulations also require that each of our U.S. insurance subsidiaries’ surplus as regards policyholders following any dividend or distribution be reasonable in relation to such U.S. insurance subsidiary’s outstanding liabilities and adequate to meet its financial needs.
Credit for Reinsurance Ceded
The ability of a primary insurer to take reserve and capital credit for the reinsurance purchased from reinsurance companies is a significant component of reinsurance regulation. Typically, a primary insurer will only enter into a reinsurance agreement if it can obtain credit on its statutory basis financial statements against its reserves (report lower net reserves) and/or toward its MCR (the denominator in its RBC calculation) for the reinsurance ceded to the reinsurer. With respect to U.S.-domiciled ceding companies, credit is usually granted when the reinsurer is licensed or accredited in the state where the ceding company is domiciled. States also generally permit primary insurers to take credit for reinsurance if the reinsurer: (1) is domiciled in a state with a credit for reinsurance law that is substantially similar to the credit for reinsurance law in the primary insurer’s state of domicile, and (2) meets certain financial requirements. Credit for reinsurance purchased from a reinsurer that does not meet the foregoing conditions is generally allowed to the extent that such reinsurer secures its obligations with qualified collateral.
ALRe has provided, and may in the future provide, reinsurance to our U.S. insurance subsidiaries in the normal course of business. Our U.S. insurance subsidiaries have entered into modified coinsurance agreements
192
Table of Contents
with ALRe under which they will cede to ALRe a 100% quota share of their respective obligations to repay the principal upon maturity or earlier termination and to make periodic interest payments under funding agreements issued by them. Our U.S. insurance subsidiaries have similar arrangements with ALRe with respect to substantially all of their other core business, under which between 80% and 100% of all such business is ceded to ALRe on a modified coinsurance business. ALRe is not licensed, accredited or approved in any state in the United States and, consequently, ALRe must collateralize its obligations to our U.S. insurance subsidiaries or any third-party cedent in order for any of our U.S. insurance subsidiaries or any third-party cedent to obtain credit against its reserves on its statutory basis financial statements. ALRe is domiciled in Bermuda, one of the largest reinsurance markets in the world by reserves with a regulatory regime deemed by the EC in November 2015 to be equivalent to the EU’s Solvency II. The delegated act granting Bermuda equivalency under Solvency II was approved by the European Parliament and Council in March 2016.
The Dodd-Frank Act provides that only the state in which a primary insurer is domiciled may regulate the financial statement credit for reinsurance taken by that primary insurer; other states are no longer able to require additional collateral from unauthorized reinsurers or otherwise impose their own credit for reinsurance laws on primary insurers that are licensed, but not domiciled, in such other states.
In November 2011, the NAIC adopted amendments to its Credit for Reinsurance Model Law and Regulation (“Credit for Reinsurance Model Law”) to implement reinsurance collateral reform. Under the amended Credit for Reinsurance Model Law, collateral requirements may be reduced from 100% for unauthorized or non-accredited reinsurers meeting certain criteria as to financial strength and reliability that are domiciled in jurisdictions that are found to have strong systems of U.S. insurance regulation (each, a “Qualified Jurisdiction”). Once a state legislature enacts the amendments to the Credit for Reinsurance Model Law and the standards become operative in that state, such reinsurers will be eligible to apply for “certified reinsurer” status and reinsurers that become so certified will be permitted to post collateral at reduced levels in that state. The new collateral levels will apply on a prospective basis only. In late 2015, the NAIC began the process of making the reinsurance collateral reform provisions of the amended Credit for Reinsurance Model Law an accreditation standard. Delaware and Iowa have adopted the reduced collateral requirements under the Credit for Reinsurance Model Law, and New York has adopted the reduced collateral requirements under a predecessor statute.
In December 2014, the NAIC approved Bermuda as a “Qualified Jurisdiction,” effective January 1, 2015, with respect to certain classes of insurers, including Class E insurers such as ALRe. The recognition of Bermuda as a Qualified Jurisdiction permits ALRe to apply for “certified reinsurer” status with the ability to post reduced collateral for coverage provided by ALRe to primary insurers in the United States (including our U.S. insurance subsidiaries). The amount of collateral required to be posted by insurers with this designation varies based upon the insurers’ credit rating. ALRe is not currently certified to post reduced collateral in any state.
Statutory Investment Valuation Reserves
Life insurance companies are required to establish an Asset Valuation Reserve (“AVR”) to stabilize statutory policyholder surplus from fluctuations in the market value of investments. The AVR consists of two components: (1) a “default component” for possible credit-related losses on fixed maturity investments and (2) an “equity component” for possible market-value losses on all types of equity investments, including real estate-related investments. Although future additions to the AVR will reduce the future statutory capital and surplus of our U.S. insurance subsidiaries, we do not believe that the impact under current regulations of such reserve requirements will materially affect our U.S. insurance subsidiaries. Insurers also are required to establish an interest maintenance reserve (“IMR”) for net realized capital gains and losses, net of tax, on fixed maturity investments where such gains and losses are attributable to changes in interest rates, as opposed to credit-related causes. The IMR is required to be amortized into statutory earnings on a basis reflecting the remaining period to maturity of the fixed maturity securities. These reserves are required by state insurance regulatory authorities to be established as liabilities on a life insurer’s statutory financial statements and may also be included in the liabilities assumed by our U.S. insurance subsidiaries pursuant to their reinsurance agreements with U.S.-based life insurer ceding companies.
193
Table of Contents
Policy and Contract Reserve Adequacy Analysis
The Athene Domiciliary States and other states have adopted laws and regulations with respect to policy and contract reserve sufficiency. Under applicable insurance laws, our U.S. insurance subsidiaries are each required to annually conduct an analysis of the adequacy of all life insurance and annuity statutory reserves. A qualified actuary appointed by each such subsidiary’s board must submit an opinion annually for each such subsidiary which states that the statutory reserves make adequate provision, according to accepted actuarial standards of practice, for the anticipated cash flows resulting from the contractual obligations and related expenses of such subsidiary. The adequacy of the statutory reserves is considered in light of the assets held by such U.S. insurance subsidiary with respect to such reserves and related actuarial items, including, but not limited to, the investment earnings on such assets and the consideration anticipated to be received and retained under the related policies and contracts. At a minimum, such testing is done over a number of economic scenarios prescribed by the states, with the scenarios designed to stress anticipated cash flows for higher and/or lower future levels of interest rates. Our U.S. insurance subsidiaries may find it necessary to increase reserves, which may decrease their statutory surplus, in order to pass additional cash flow testing requirements.
U.S. Statutory Reports and Regulatory Examinations
Our U.S. insurance subsidiaries are required to file detailed annual reports, including financial statements, in accordance with prescribed statutory accounting rules, with regulatory officials in the jurisdictions in which they conduct business. In addition, each U.S. insurance subsidiary is required to file quarterly reports prepared on the same basis, though with considerably less detail.
As part of their routine regulatory oversight process, state insurance departments conduct periodic detailed examinations, generally once every three to five years, of the books, records, accounts and operations of insurance companies that are domiciled in their states. Examinations are generally carried out in cooperation with the insurance departments of other, non-domiciliary states under guidelines promulgated by the NAIC. The Delaware Department of Insurance began an onsite exam on April 14, 2014 of AADE and ALIC for the period of January 1, 2010 through December 31, 2013. The exam was conducted in coordination with the joint exams in Iowa and New York and resulted in no material findings. Final exam reports were issued by the Delaware Department of Insurance and are publicly available on the department’s website. The exam has been closed. The IID began an onsite exam on May 12, 2014 of AAIA and Structured Annuity Reinsurance Company for the period of January 1, 2010 through December 31, 2013. The exam was conducted in coordination with the joint exams in Delaware and New York and resulted in no material findings. The final exam report was issued by the IID and is publicly available on the IID’s website. The exam has been closed. The NYSDFS began an onsite exam on May 12, 2014 of AANY for the period of January 1, 2010 through December 31, 2013 and ALICNY for the period of January 1, 2012 through December 31, 2013. The exam was conducted in coordination with the joint exams in Delaware and Iowa and resulted in no material findings. The final exam reports for AANY and ALICNY were issued by the NYSDFS and are publicly available on the NYSDFS website. The exams have been closed.
Vermont insurance laws and regulations applicable to Athene Re IV require it to file financial statements with the Commissioner of the Insurance Division of the Vermont Department of Financial Regulation. Additionally, Athene Re IV is subject to periodic financial examinations by the Insurance Division of the Vermont Department of Financial Regulation. The Vermont Department of Financial Regulation recently completed an examination of Athene Re IV for the period from January 1, 2011 through December 31, 2014. The final report was issued on September 21, 2016. There were no issues noted in the report.
Market Conduct Regulation
State insurance laws and regulations include numerous provisions governing the marketplace activities of insurers, including provisions governing claims settlement practices, the form and content of disclosure to
194
Table of Contents
consumers, illustrations, advertising, sales and complaint process practices. State regulatory authorities generally enforce these provisions through periodic market conduct examinations. In addition, our U.S. insurance subsidiaries must file, and in many jurisdictions and for some lines of business obtain regulatory approval for, rates and forms relating to the insurance written in the jurisdictions in which they operate. Our U.S. insurance subsidiaries are currently undergoing the following market conduct examinations, each in the ordinary course of business: (1) the California Department of Insurance is conducting a review of the rating and underwriting practices of AAIA, AADE and AANY, (2) the Missouri Department of Insurance, Financial Institutions & Professional Registration is conducting a market conduct examination of AAIA, (3) the NYSDFS is conducting a triennial examination of AANY, (4) the Wisconsin Department of Insurance is conducting a general market conduct examination of AAIA, (5) the New York Office of the State Comptroller is conducting an audit of AANY and ALICNY regarding abandoned property, and (6) the State of Connecticut Insurance Department is conducting an examination survey of the market conduct practices of AAIA.
State insurance regulators have been scrutinizing claims settlement practices of insurance companies with regard to payment of death benefits. Through their authority to regulate market conduct, including claims settlement practices, state insurance regulators have been examining the use by insurance companies of the Death Master File to identify deceased persons and the processes by which insurance companies search for beneficiaries of life and annuity contracts. In particular, these regulators have been looking at how insurance companies handle unreported deaths, maturity of life insurance and annuity contracts, and contracts that have exceeded limiting age to determine if the companies are appropriately identifying when death benefits or other payments under the contracts should be made. Several states have enacted new laws or adopted new regulations mandating the use by insurance companies of the Death Master File or other similar databases to identify deceased persons and more rigorous processes to find beneficiaries. The NAIC currently is developing a new model law to address the issue of unclaimed benefits.
In 2013, prior to our acquisition of Aviva USA, it entered into multi-state settlement agreements with the insurance regulators and treasurers for 48 states in connection with certain of its subsidiaries’ use of the Death Master File. As part of the settlement, AAIA and its subsidiary ALICNY agreed to pay a $4 million assessment for examination, compliance and monitoring costs without admitting any liability or wrongdoing, and further agreed to adopt policies and procedures reasonably designed to ensure timely payment of valid claims to beneficiaries in accordance with insurance laws and to timely report and remit unclaimed proceeds to the appropriate states in connection with unpaid property laws. Our U.S. insurance subsidiaries could continue to be subject to risks related to unpaid benefits, the Death Master File, and the procedures required by the prior multi-state settlement as they relate to our annuity business. Furthermore, administrative challenges associated with implementing the procedures described above may make compliance with the multi-state settlement and applicable law difficult and could have a material and adverse effect on our results of operations. AADE is currently undergoing a multi-state unclaimed property examination led by Verus Financial, on behalf of California, Florida, Georgia, Indiana, Louisiana, North Carolina, Ohio, Pennsylvania, Tennessee, and Texas. Further, Liberty Life is a defendant in a lawsuit filed by the West Virginia Treasurer, State of West Virginia ex rel. John D. Perdue v. Liberty Life Ins. Co., Case No. 12-C-419, pursuant to which the Treasurer alleges that Liberty Life failed to adopt reasonable procedures, such as using the Death Master File, to identify deceased insureds with unpaid death benefits and timely escheat those unclaimed benefits to the state. The Treasurer accordingly seeks to recover unpaid death benefits, statutory interest and penalties.
Capital Requirements
Regulators of each state have discretionary authority in connection with our U.S. insurance subsidiaries’ continued licensing to limit or prohibit sales to policyholders within their respective states if, in their judgment, the regulators determine that such entities have not maintained the required level of minimum surplus or capital or that the further transaction of business would be hazardous to policyholders.
In order to enhance the regulation of insurers’ solvency, the NAIC adopted a model law to implement RBC requirements for life, health and property and casualty insurance and reinsurance companies. All states have
195
Table of Contents
adopted the NAIC’s model law or a substantively similar law. The NAIC Risk-Based Capital for Insurers Model Act requires life insurance companies to submit an annual report (the “Risk-Based Capital Report”), which compares an insurer’s TAC to its ACL, each such term as defined pursuant to applicable state law. A company’s RBC is calculated by using a specified formula that applies factors to various risks inherent in the insurer’s operations, including risks attributable to its assets, underwriting experience, interest rates and other business expenses. The factors are higher for those items deemed to have greater underlying risk and lower for items deemed to have less underlying risk. Statutory RBC is measured on two bases, with ACL calculated as one half ( 1⁄2) company action level RBC (“CAL”). Regulators typically use ACL in assessing companies and reviewing solvency requirements. Companies themselves typically report and are compared using the CAL standard.
The Risk-Based Capital Report is used by regulators to set in motion appropriate regulatory actions relating to insurers that show indications of weak or deteriorating conditions. RBC is an additional standard for MCR that insurers must meet to avoid being placed in rehabilitation or liquidation by regulators. The annual Risk-Based Capital Report, and the information contained therein, is not intended by the NAIC as a means to rank insurers.
RBC is a method of measuring the level of capital appropriate for an insurance company to support its overall business operations, in light of its size and risk profile. It provides a means of assessing capital adequacy, where the degree of risk taken by the insurer is the primary determinant. The value of an insurer’s TAC in relation to its RBC, together with its trend in its TAC, is used as a basis for determining regulatory action that a state insurance regulator may be authorized or required to take with respect to an insurer. The four action levels include:
| (1) | CAL: The insurer is required to submit a plan for corrective action when its TAC is equal to or less than 200% of ACL; |
| (2) | Regulatory Action Level: The insurer is required to submit a plan for corrective action and is subject to examination, analysis and specific corrective action when its TAC is equal to or less than 150% of ACL; |
| (3) | ACL: Regulators may place the insurer under regulatory control when its TAC is equal to or less than 100% of ACL; and |
| (4) | Mandatory Control Level: Regulators are required to place the insurer under regulatory control when its TAC is equal to or less than 70% of ACL. |
TAC and RBC are calculated annually by insurers, as of December 31 of each year. As of December 31, 2015, each of our U.S. insurance subsidiaries’ TAC was significantly in excess of the levels that would prompt regulatory action under the laws of the Athene Domiciliary States. As of December 31, 2015, our U.S. RBC ratio was 552%. The calculation of RBC requires certain judgments to be made, and, accordingly, our U.S. insurance subsidiaries’ current RBC may be greater or less than the RBC calculated as of any date of determination.
Under U.S. SAP, our U.S. domiciled subsidiaries defer the portion of realized capital gains and losses on fixed maturity securities attributable to changes in the general level of interest rates into an IMR. The IMR amortizes into future year statutory operating results based on a formula prescribed by the NAIC. The IMR provides a buffer to our statutory capital and surplus in the event we have to sell securities in an unrealized loss position. As of September 30, 2016 and December 31, 2015, our aggregate IMR balance was $219 million and $238 million, respectively.
Insurance Regulatory Information System (“IRIS”) Ratios
The NAIC has established IRIS to assist state insurance departments in their oversight of the financial condition of insurance companies operating in their respective states. IRIS is a series of financial ratios calculated by the NAIC based on financial information submitted by insurers on an annual basis. Each ratio has an established “usual range” of results. The NAIC shares the IRIS ratios calculated for each insurer with the interested state insurance departments. Generally, an insurance company will be required to explain ratios that
196
Table of Contents
fall outside the usual range, and may be subject to regulatory scrutiny and action if one or more of its ratios fall outside the specified ranges. None of our U.S. insurance subsidiaries are currently subject to non-ordinary course regulatory scrutiny based on their IRIS ratios.
Regulation of Investments
Each of our U.S. insurance subsidiaries is subject to laws and regulations in each Athene Domiciliary State that require diversification of its investment portfolio and limit the amounts of investments in certain asset categories, such as below-investment grade fixed income securities, real estate-related equity, partnerships, other equity investments, derivatives and alternative investments. Failure to comply with these laws and regulations would cause investments exceeding regulatory limitations to be treated as non-admitted assets for purposes of measuring statutory surplus and, in some instances, could require the divestiture of such non-qualifying investments. Accordingly, the investment laws in the Athene Domiciliary States could prevent our U.S. insurance subsidiaries from pursuing investment opportunities which they believe are beneficial to their shareholders, which could in turn preclude Athene from realizing its investment objectives. We believe that the investments our U.S. insurance subsidiaries have made are in compliance, in all material respects, with such laws and regulations as of September 30, 2016.
Guaranty Associations
All 50 states and the District of Columbia have insurance guaranty fund laws requiring insurance companies doing business within those jurisdictions to participate in guaranty associations. Guaranty associations are organized to cover, subject to limits, contractual obligations under insurance policies issued by life insurance companies which later become impaired or insolvent. These associations levy assessments, up to prescribed limits, on each member insurer doing business in a particular state on the basis of their proportionate share of the premiums written by all member insurers in the lines of business in which the impaired or insolvent insurer previously engaged. Most states limit assessments in any year to 2% of the insurer’s average annual premium for the three years preceding the calendar year in which the impaired insurer became impaired or insolvent. Some states permit member insurers to recover assessments paid through full or partial premium tax offsets, usually over a period of years. Assessments levied against our U.S. insurance subsidiaries by guaranty associations during each of the past five years have not been material. While Athene cannot accurately predict the amount of future assessments or future insolvencies of competitors which would lead to such assessments, Athene believes that assessments with respect to pending insurance company impairments and insolvencies will not have a material effect on Athene’s financial condition or results of operations.
Federal Oversight
Although the insurance business in the United States is primarily regulated by the states, federal initiatives can affect the businesses of our U.S. insurance subsidiaries in a variety of ways. From time to time, federal measures are proposed which may significantly affect the insurance business. These areas include financial services regulation, securities regulation, derivatives regulation, pension regulation, money laundering, privacy regulation, taxation and the economic and trade sanctions implemented by the Office of Foreign Assets Control (“OFAC”). OFAC maintains and enforces economic sanctions against certain foreign countries and groups and prohibits U.S. persons from engaging in certain transactions with certain persons or entities. OFAC has imposed civil penalties on persons, including insurance and reinsurance companies, arising from violations of its economic sanctions program. In addition, various forms of direct and indirect federal regulation of insurance have been proposed from time to time, including proposals for the establishment of an optional federal charter for insurance companies.
Title I of the Dodd-Frank Act established the FSOC, which has authority to designate non-bank financial companies as SIFIs, thereby subjecting them to enhanced prudential standards and supervision by the Federal Reserve. The prudential standards for non-bank SIFIs include enhanced RBC requirements, leverage limits, liquidity requirements, single counterparty exposure limits, governance requirements for risk management, stress test requirements, special debt-to-equity limits for certain companies, early remediation procedures, and recovery and resolution planning. Athene USA and certain of our U.S. insurance subsidiaries may be above the initial quantitative threshold for treatment as a non-bank SIFI (total consolidated assets of $50 billion). If the FSOC
197
Table of Contents
were to determine that Athene USA or any of our U.S. subsidiaries is a non-bank SIFI, such entity would become subject to certain of these enhanced prudential standards.
The Dodd-Frank Act, which effected the most far-reaching overhaul of financial regulation in the United States in decades, also established the FIO within the U.S. Department of the Treasury. The FIO has the authority to preempt state laws if inconsistent with international agreements entered into by the Secretary of the Treasury or the U.S. Trade Representative if such state law treats a non-U.S. insurer less favorably than a U.S. insurer. Pursuant to this authority, in late 2015, the U.S. Department of the Treasury and the Office of the U.S. Trade Representative notified Congress of plans to initiate negotiations to enter into a covered agreement with the EU to address, among other things, reinsurance collateral requirements. A covered agreement is an agreement between the United States and one or more foreign governments, authorities or regulatory entities, regarding prudential measures with respect to insurance or reinsurance. While currently not having a general supervisory or regulatory authority over the business of insurance, the Director of the FIO performs various functions with respect to insurance, including serving as a non-voting member of the FSOC and making recommendations to the FSOC regarding non-bank financial companies to be designated as SIFIs. The FIO has been charged with providing reports to the U.S. Congress on (i) the global reinsurance market (provided in January 2015), (ii) modernization of U.S. insurance regulation and possible federal involvement in supervision of insurance group holding companies (provided in December 2013) and (iii) state regulators’ ability to access reinsurance information (provided in November 2013). Such reports could ultimately lead to changes in the regulation of insurers and reinsurers in the United States, including insurance group holding companies.
FIAs
In recent years, the SEC and state securities regulators have questioned whether FIAs, such as those sold by our U.S. insurance subsidiaries, should be treated as securities under the federal and state securities laws rather than as insurance products exempted from such laws. Under the Dodd-Frank Act, annuities that meet specific requirements, including requirements relating to certain state suitability rules, are specifically exempted from being treated as securities by the SEC. Treatment of these products as securities would require additional registration and licensing of these products and the agents selling them, as well as cause our U.S. insurance subsidiaries to seek new or additional marketing relationships for these products, any of which may impose significant restrictions on their ability to conduct business as currently operated. On December 17, 2008, the SEC voted to approve Rule 151A, and apply federal securities oversight to FIAs issued on or after January 12, 2011. On July 12, 2010, however, the District of Columbia Circuit Court of Appeals vacated Rule 151A. We expect that the types of FIAs our U.S. insurance subsidiaries sell will meet these requirements and therefore will remain exempt from being treated as securities by the SEC and state securities regulators. However, there can be no assurance that federal or state securities laws or state insurance laws and regulations will not be amended or interpreted to impose further requirements on FIAs.
Unclaimed Property Laws
Each of our U.S. insurance subsidiaries is subject to the laws and regulations of states and other jurisdictions concerning the identification, reporting and escheatment of abandoned or unclaimed money or property. State treasurers, controllers and revenue departments have been scrutinizing escheatment practices of life insurance companies with regard to unclaimed life insurance and annuity death benefits. As with state insurance regulators, state revenue authorities have been looking at how life insurance companies handle unreported deaths, maturity of life insurance and annuity contracts, and contracts that have exceeded limiting age to determine if the companies are appropriately determining when death benefits or other payments under the contracts should be treated as unclaimed property. State treasurers, controllers and revenue departments have audited life insurance companies, required escheatments and imposed interest penalties on amounts escheated for failure to escheat death benefits or other contract benefits when beneficiaries could not be found at the expiration of statutory dormancy periods. See also “—Market Conduct Regulation.”
Regulation of OTC Derivatives
Athene uses derivatives to mitigate a wide range of risks in connection with its businesses, including options purchased to hedge the derivatives embedded in the FIAs that our subsidiaries have issued, and swaps, futures and/
198
Table of Contents
or options used to manage the impact of increased benefit exposures from our annuity products that offer guaranteed benefits. Title VII of the Dodd-Frank Act creates a comprehensive framework for the federal oversight and regulation of the OTC derivatives market and entities, such as Athene, that participate in the market and requires the CFTC and the SEC to promulgate rules and regulations implementing its provisions. Regulations have been finalized and implemented in many areas and are being finalized for implementation in others.
The Dodd-Frank Act divides the regulatory responsibility for swaps in the United States between the SEC and CFTC. The CFTC regulates swaps and swap entities, and the SEC regulates security-based swaps and security based swap entities. The CFTC and SEC have jointly finalized certain regulations under the Dodd-Frank Act, including critical rulemakings on the definitions of “swap,” “security-based swap,” “swap dealer,” “security-based swap dealer,” “major swap participant” and “major security-based swap participant.” In addition, the CFTC has substantially finalized its required rulemaking under the Dodd-Frank Act, including regulations relating to the registration and regulation of swap dealers, major swap participants and swap execution facilities, reporting, recordkeeping, mandatory clearing and mandatory on-facility trade execution. The SEC has yet to finalize most of its similar regulations which would apply to the security-based swaps and market participants transacting in security-based swaps, including security-based swap dealers and major security-based swap participants subject to the SEC’s oversight. As a result of this bifurcation and the different pace at which the agencies have promulgated regulations, different transactions are subject to different levels of regulation. In addition, because the CFTC has not yet finalized all of its regulations with respect to swaps, the SEC has yet to finalize most of its regulations with respect to security-based swaps and because regulations that have been finalized may change or be subject to relief with respect to certain market participants, it is not possible to predict with certainty the full effect of the Dodd-Frank Act on Athene or the timing of such effects.
The Dodd-Frank Act and the CFTC rules thereunder currently require us, in connection with certain swap transactions, to comply with mandatory clearing and on-facility trade execution requirements, and it is anticipated that the types of swaps subject to these requirements will be expanded over time. In addition, new regulations will require us to comply with mandatory minimum margin requirements for uncleared swaps. The derivative clearing requirements and mandatory margin requirements of the Dodd-Frank Act could increase the cost of our risk mitigation and could have other implications. For example, increased margin requirements, combined with restrictions on securities that qualify as eligible collateral, could reduce our liquidity and require increased holdings of cash and highly liquid securities with lower yields causing a reduction in income. In addition, the requirement that certain trades be centrally cleared through clearinghouses concentrates counterparty risk in both clearinghouses and clearing members. The failure of a clearinghouse could have a significant impact on the financial system. Even if a clearinghouse does not fail, large losses could force significant capital calls on clearinghouse members during a financial crisis, which could lead clearinghouse members to default. Because clearinghouses are still developing and the related bankruptcy process is untested, it is difficult to speculate as to the actual risks related to the default of a clearinghouse.
The Dodd-Frank Act and new regulations thereunder could significantly increase the cost of derivative contracts, reduce the availability of derivatives to protect against risks we encounter, reduce our ability to monetize or restructure our existing derivative contracts, and increase our credit risk exposure. If we reduce our use of derivatives as a result of the Dodd-Frank Act and the regulations thereunder, our results of operations may become more volatile and our cash flows may be less predictable which could adversely affect our financial performance. Additionally, we have always been subject to the risk that hedging and other management procedures might prove ineffective in reducing the risks to which insurance policies expose us or that unanticipated policyholder behavior or mortality, combined with adverse market events, could produce economic losses beyond the scope of the risk management techniques employed. Any such losses could be increased by the increased cost of entering into derivatives and the reduced availability of customized derivatives that might result from the enactment and implementation of the Dodd-Frank Act.
199
Table of Contents
Consumer Protection Laws and Privacy and Data Security Regulation
Numerous other federal and state laws also affect Athene’s earnings and activities, including federal and state consumer protection laws. As part of the Dodd-Frank Act, Congress established the CFPB to supervise and regulate institutions that provide certain financial products and services to consumers. Although the consumer financial services subject to the CFPB’s jurisdiction generally exclude insurance business of the kind in which our U.S. insurance subsidiaries engage, the CFPB does have authority to regulate non-insurance consumer services which are offered by issuers of securities in our U.S. insurance subsidiaries’ investment portfolio.
Federal and state laws and regulations require financial institutions, including insurers, to protect the security and confidentiality of nonpublic personal information, including certain health-related and customer information, and to notify customers and other individuals about their policies and practices relating to their collection and disclosure of health-related and customer information and their practices relating to protecting the security and confidentiality of that information. State laws regulate use and disclosure of Social Security numbers and federal and state laws require notice to affected individuals, law enforcement, regulators and others if there is a breach of the security of certain nonpublic personal information, including Social Security numbers. In addition, state laws and regulations restrict the disclosure of the medical record and health status information obtained by insurers.
Federal and state lawmakers and regulatory bodies may be expected to consider additional or more detailed regulation regarding these subjects and the privacy and security of nonpublic personal information. Furthermore, the issues surrounding data security and the safeguarding of consumers’ protected information are under increasing regulatory scrutiny by state and federal regulators, particularly in light of the number and severity of recent U.S. companies’ data breaches. The Federal Trade Commission, the Federal Bureau of Investigation, the Federal Communications Commission, the NYSDFS, and the NAIC have undertaken various studies, reports, and actions regarding data security for entities under their respective supervision. Some states have recently enacted new insurance laws that require certain regulated entities to implement and maintain comprehensive information security programs to safeguard the personal information of insureds and enrollees. The NAIC recently instituted a 50-state market conduct examination of a health insurer that was the subject of a data breach. The NAIC also has created a Cybersecurity Task Force to look into various issues. In June 2015, the NAIC adopted a guidance document that sets forth twelve principles for effective insurance regulation of cybersecurity risks based on similar regulatory guidance adopted by the Securities Industry and Financial Markets Association. In December 2015, the NAIC adopted the “Roadmap for Cybersecurity Consumer Protections,” which describes the protections to which the NAIC believes consumers should be entitled from their insurance companies, agents and other businesses concerning the collection and maintenance of consumers’ personal information, as well as what consumers should expect when such information has been involved in a data breach. In March 2016, the NAIC’s Cybersecurity Task Force exposed for public comment a draft of a new model law addressing cybersecurity, which is intended to establish the exclusive standards for data security and breaches applicable to insurance licensees in states adopting such law. After receiving input from industry groups and regulators, a second draft of the model law was published with comments due September 16, 2016. If adopted in its current form, upon the occurrence of a data breach, the model law could subject us to two separate and different data breach legal frameworks, depending on the state in which the breach is deemed to have occurred, as many states have pre-existing and broadly applicable privacy laws and regulations presently in effect. We cannot predict the effect or the compliance costs if state and federal regulators pursue investigations and increase the regulatory requirements for the security of protected information.
In addition to the NAIC’s proposed model law, state lawmakers and regulatory bodies may be expected to consider additional or more detailed regulation regarding these subjects and the privacy and security of nonpublic personal information. On September 13, 2016, the NYSDFS published its proposed rule entitled Cybersecurity Requirements for Financial Services Companies (23 NYCRR 500). The proposed rule is open to public comment for 45 days and is currently drafted with an effective date of January 1, 2017. If the rule is adopted in its current form, we will update processes and procedures to comply with the new requirements. We cannot predict the
200
Table of Contents
effect or the amount of compliance costs that will be incurred if state and federal regulators pursue investigations and increase the regulatory requirements for the security of protected information.
Further, the Gramm-Leach-Bliley Act of 1999, which implemented fundamental changes in the regulation of the financial services industry in the United States, includes privacy requirements for financial institutions, including obligations to protect and safeguard consumers’ nonpublic personal information and records, and limitations on the re-disclosure and re-use of such information.
Finally, our investment in a limited partnership which is in the business of originating RMLs, as well as our direct investment in any residential or other mortgage loans, may expose us to various environmental and other regulation. For example, to the extent that we hold whole mortgage loans as part of our investment portfolio, we may be responsible for certain tax payments or subject to liabilities under CERCLA. Additionally, we may be subject to regulation by the CFPB as a mortgage holder or property owner. We are currently unable to predict the impact of such regulation on our business.
Broker-dealers
Our securities operations, principally conducted by our limited purpose SEC-registered broker-dealer, Athene Securities, LLC, are subject to federal and state securities and related laws, and are regulated principally by the SEC, state securities authorities and FINRA. Athene Securities, LLC does not hold customer funds or safekeep customer securities or otherwise engage in any securities transactions. Athene Securities, LLC was the principal underwriter of a block of variable annuity contracts which has been closed to new investors since 2002. The closed block of variable annuity contracts was issued by a predecessor of AAIA. Athene Securities, LLC continues to receive concessions on those variable annuity contracts. Athene Securities, LLC also provides supervisory oversight to Athene employees who are registered representatives.
Employees or personnel registered with Athene Securities, LLC are subject to the Exchange Act and to regulation and examination by the SEC, FINRA and state securities commissioners. The SEC and other governmental agencies and self-regulatory organizations, as well as state securities commissions in the United States, have the power to conduct administrative proceedings that can result in censure, fines, cease-and-desist orders or suspension, termination or limitation of the activities of the regulated entity or its employees.
Pursuant to the Dodd-Frank Act, the SEC is authorized to establish a standard of conduct applicable to brokers and dealers whereby they could be required to act in the best interest of the customer without regard to the financial or other interest of the broker or dealer when providing personalized investment advice to retail and other customers. A January 2011 SEC study acknowledged that the offering of proprietary products could not be a per se violation of any such standard of care and that broker-dealers selling proprietary or a limited range of products could be permitted to make certain disclosures about their limited product offerings and obtain customer consents or acknowledgements with respect to their offer and sale of such products.
As a registered broker-dealer and member of various self-regulatory organizations, Athene Securities, LLC is subject to the SEC’s net capital rule, which specifies the minimum level of net capital a broker-dealer is required to maintain and requires a minimum part of its assets to be kept in relatively liquid form. These net capital requirements are designed to measure the financial soundness and liquidity of broker-dealers. The net capital rule imposes certain requirements that may have the effect of preventing a broker-dealer from distributing or withdrawing capital and may require that prior notice to the regulators be provided prior to making capital withdrawals. Compliance with net capital requirements could limit operations that require the intensive use of capital, such as trading activities and underwriting, and may limit the ability of our broker-dealer subsidiaries to pay dividends to us.
ERISA
We also may be subject to regulation by the DOL when providing a variety of products and services to employee benefit plans governed by ERISA. ERISA is a comprehensive federal statute that applies to U.S.
201
Table of Contents
employee benefit plans sponsored by private employers and labor unions. Plans subject to ERISA include pension and profit sharing plans and welfare plans, including health, life and disability plans. Among other things, ERISA imposes reporting and disclosure obligations, prescribes standards of conduct that apply to plan fiduciaries and prohibits transactions known as “prohibited transactions,” such as conflict-of-interest transactions, self-dealing and certain transactions between a benefit plan and a “party in interest.” ERISA also provides for a scheme of civil and criminal penalties and enforcement. Our insurance businesses provide services to employee benefit plans subject to ERISA. We are also subject to ERISA’s prohibited transaction rules for transactions with ERISA plans, which may affect our ability to, or the terms upon which we may, enter into transactions with those plans, even in businesses unrelated to those giving rise to “party in interest” status. The applicable provisions of ERISA and the Code are subject to enforcement by the DOL, the IRS and the U.S. Pension Benefit Guaranty Corporation. Severe penalties are imposed for breach of duties under ERISA.
On April 6, 2016, the DOL issued a new regulation more broadly defining the circumstances under which a person is considered to be a fiduciary by reason of giving investment advice or recommendations to an employee benefit plan or a plan’s participants or to IRA holders. In addition to releasing the investment advice regulation, the DOL: (1) issued a new prohibited transaction class exemption, referred to as the BICE, to be used in connection with the sale of FIAs or variable annuities, and (2) updated the previous prohibited transaction class exemption 84-24, to be used in connection with the sale of traditional fixed rate annuities.
To satisfy the requirements under the BICE, a “Financial Institution” (defined under the rule as a registered investment adviser (“RIA”), bank, registered broker-dealer, or insurance company) must enter into a contract with the retirement investor and accept fiduciary responsibility for the recommendations of the producer, among other things. To assist in understanding the regulation, the DOL, on October 27, 2016, issued its first in a series of frequently asked questions (“FAQs”) responding to questions submitted by various retirement market participants impacted by the regulation. The FAQs, among other things, clarified that an insurance-only licensed producer can meet the best interest requirements even though he or she is limited to selling insurance products. In addition, the DOL clarified that an insurance carrier that acts as the Financial Institution will only act as such with respect to the sale of that insurance carrier’s products. The FAQs referenced that several IMOs applied to the DOL to be granted the status of a Financial Institution and also suggested there may be an amendment to the list of approved Financial Institutions to include IMOs that meet certain requirements.
While there remains significant uncertainty regarding our distributors’ response to the DOL’s regulation and our distributors’ ability to meet the requirement of the BICE, we believe many of our producers have a path to an entity capable of being a Financial Institution because the IMOs with which they are affiliated have a broker-dealer or RIA or because such producers are otherwise a registered representative of a broker-dealer that could sign the contract required by the BICE. We estimate that approximately 84% of our retail sales of FIAs are through producers with a path to a Financial Institution under the regulation. While we cannot confirm this figure with certainty, we have used this assumption in preparing for implementation of the regulation. The following table summarizes the percentages of our new deposits for the nine months ended September 30, 2016, by various categories we believe are relevant to understanding the impact of the DOL regulation on our business.
|
Reinsured Qualified Deposits |
Reinsured Non- Qualified Deposits |
Retail Non- Qualified Deposits |
Retail MYGA Deposits (84-24) |
Retail FIA Qualified Deposits | ||||
| 17%
|
28%
|
19%
|
3%
|
33%
| ||||
| Rule does not apply to reinsurers directly but may affect cedents’ volumes and risks | Rule does not apply to non-qualified sales | Rule does not apply to non-qualified sales | Sales must satisfy 84-24 exemption | Sales must satisfy BICE exemption; estimated that 84% of such sales (or 28% of total deposits) have a path to a Financial Institution
|
Given the uncertainty surrounding our distributors’ response to the DOL regulation, we are preparing to act as the Financial Institution for sales of our FIAs, subject to various conditions and qualifications, for a
202
Table of Contents
transitionary period, during which our current distributors do not have access or the ability to be a Financial Institution with respect to sales of FIAs. In the event that we must serve as the Financial Institution, we expect to adjust the compensation paid to producers on the sales of our FIAs to compensate us for various compliance costs incurred in acting as the Financial Institution, as well as for the additional risk associated with such fiduciary sales.
We cannot predict with any certainty the impact of the regulation and exemptions, but the regulation and exemptions will alter the way our products and services are marketed and sold, particularly to purchasers of IRAs and individual retirement annuities. If implemented in its current form, the DOL regulation could have an adverse effect on our ability to write new business.
The SEC also has indicated that it may propose rules creating a uniform standard of conduct applicable to broker-dealers and investment advisers, which, if adopted, may affect the distribution of our products. Should the SEC rules, if adopted, not align with the finalized DOL regulations related to conflicts of interest in the provision of investment advice, the distribution of our products could be further complicated. The DOL has also issued a number of regulations recently, and may issue similar additional regulations, that increase the level of disclosure that must be provided to plan sponsors and participants. These ERISA disclosure requirements will likely increase the regulatory and compliance burden on us, resulting in increased costs.
Bermuda
General
The Bermuda Insurance Act regulates the insurance business of ALRe, and provides that no person may carry on any insurance business in or from within Bermuda unless registered as an insurer under the Bermuda Insurance Act by the BMA. The BMA is required by the Bermuda Insurance Act to determine whether the applicant is a fit and proper body to be engaged in the insurance business and, in particular, whether it has, or has available to it, adequate knowledge and expertise to operate an insurance business. See “—Fit and Proper Controllers.”
The continued registration of an insurer is subject to the insurer complying with the terms of its registration and such other conditions as the BMA may impose from time to time. The Bermuda Insurance Act also grants to the BMA powers to supervise, investigate and intervene in the affairs of insurance companies.
The Bermuda Insurance Act imposes on Bermuda insurance companies solvency standards as well as auditing and reporting requirements. Certain significant aspects of the Bermuda insurance regulatory framework are set forth below.
Classification of Insurers
The Bermuda Insurance Act distinguishes between insurers carrying on long-term business, insurers carrying on special purpose business and insurers carrying on general business. Long-term business is generally defined as life, annuity and accident and health insurance, while general business broadly includes all types of insurance that are not long-term business (property and casualty business). Special purpose business is fully funded insurance business approved by the BMA to be written by a company registered as a Special Purpose Insurer. There are five classifications of insurers carrying on long-term business, ranging from Class A insurers (pure captives) to Class E insurers (larger commercial carriers). Class A insurers are subject to the lightest regulation and Class E insurers are subject to the strictest regulation.
ALRe, which is incorporated to carry on long-term business, is registered as a Class E insurer which is the license class for long-term insurers and reinsurers with total assets of more than $500 million that are not registrable as a single-parent or multi-owner long-term captive insurer or reinsurer. ALRe is not licensed to carry
203
Table of Contents
on general business and has not sought authorization as a reinsurer or approval as an accredited reinsurer in any state or jurisdiction of the United States. Consequently, in order for its ceding companies to receive statutory reserve or RBC credit for the reinsurance provided by ALRe, ALRe typically structures its reinsurance transactions in one of three ways: (i) coinsurance, where ALRe’s liabilities to ceding companies in connection with reinsurance transactions are secured by assets held in trust for the benefit of the applicable ceding company, (ii) funds withheld, where, although ALRe recognizes an insurance reserve liability, the assets to secure such liabilities are held and maintained by the applicable ceding company, or (iii) modified coinsurance, where both the insurance reserves and assets supporting the reserves are retained by the applicable ceding company.
Cancellation of Insurer’s Registration
The BMA could revoke or suspend ALRe’s license in circumstances in which (1) it is shown that false, misleading or inaccurate information has been supplied to the BMA by ALRe or on its behalf for the purposes of any provision of the Bermuda Insurance Act, (2) ALRe has ceased to carry on business, (3) ALRe has persistently failed to pay fees due under the Bermuda Insurance Act, (4) ALRe has been shown to have not complied with a condition attached to its registration or with a requirement made of it under the Bermuda Insurance Act, (5) ALRe is convicted of an offense against a provision of the Bermuda Insurance Act or (6) ALRe is, in the opinion of the BMA, found not to have been carrying on business in accordance with sound insurance principles.
Head Office and Principal Representative
An insurer is required to establish and maintain its head and principal office in Bermuda, which requires certain officers and a director to reside in Bermuda, and to appoint and maintain a principal representative in Bermuda. For the purpose of the Bermuda Insurance Act, the ALRe principal representative is Zachary Jones and his principal office for these purposes is AHL’s Bermuda office. It is the duty of the principal representative to forthwith notify the BMA where the principal representative believes there is a likelihood of the insurer becoming insolvent or that a reportable “event” has, to the principal representative’s knowledge, occurred or is believed to have occurred. Examples of such a reportable “event” include failure by the insurer to comply substantially with a condition imposed upon the insurer by the BMA relating to a solvency margin or other ratio or a significant loss which is likely to cause the insurer to fail to comply with its ECR, as discussed below.
Public Disclosure
The Bermuda Insurance Act provides the BMA with powers to set standards on public disclosure. Using this power, the BMA requires all commercial insurers and insurance groups to prepare and publish a Financial Condition Report on their website. According to the BMA’s guiding principles on public disclosure, an obligation to disclose exists only if it would not compromise competitive advantage and confidentiality. The BMA has discretion in granting exemptions.
Independent Approved Auditor
Insurers must appoint an independent auditor who will annually audit and report on the insurer’s financial statements prepared under GAAP or IFRS (“Bermuda Financial Statements”) and statutory financial returns, each of which are required to be filed annually with the BMA. The auditor must be approved by the BMA as the independent auditor of the insurer.
Approved Actuary
Long-term insurers must appoint an actuary approved by the BMA. In order to be approved, the actuary must be a member in good standing of either the Canadian Institute of Actuaries, the Casualty Actuarial Society, the Institute of Actuaries of Australia, the Institute and Faculty of Actuaries (for the United Kingdom (“UK”)),
204
Table of Contents
the Society of Actuaries, the American Academy of Actuaries or a member of an actuarial body recognized by the BMA. Additionally, the actuary must be qualified to provide an opinion in accordance with the requirements of the Bermuda Insurance Act.
A Class E insurer is required to submit annually an opinion of its approved actuary with its capital and solvency return. The approved actuary’s opinion must state, among other things, whether or not the aggregate amount of technical provisions shown in the statutory economic balance sheet as of the end of the relevant financial year (i) meets the requirements of the Bermuda Insurance Act and (ii) makes reasonable provision for the total technical provisions of the insurer under the terms of its insurance contracts and agreements.
Non-insurance Business
Pursuant to an amendment to the Bermuda Insurance Act, after a grandfathered period ending on December 31, 2016, as a Class E insurer, ALRe will not be permitted to engage in non-insurance business unless that non-insurance business is ancillary to its core business. Non-insurance business means any business other than insurance business and includes carrying on investment business, managing an investment fund as operator, carrying on business as a fund administrator, carrying on banking business, underwriting debt or securities or otherwise engaging in investment banking, engaging in commercial or industrial activities and carrying on the business of management, sales or leasing of real property.
Annual Financial Statements and Annual Statutory Financial Return
Class E insurers must file annual Bermuda Financial Statements and statutory financial returns within four months of the end of each fiscal year. The Bermuda Insurance Act prescribes rules for the preparation and substance of statutory financial returns (which include, in statutory form, a balance sheet, income statement, a statement of capital and surplus and notes thereto). The statutory financial returns include detailed information and analysis regarding premiums, claims, reinsurance and investments of the insurer.
A Class E insurer is required to file with the BMA its Bermuda Financial Statements and a statutory financial return no later than four months after its financial year end (unless specifically extended). The statutory financial return includes, among other matters, a report of the approved independent auditor on the statutory financial returns of the insurer.
MMS, ECR and Restrictions on Dividends and Distributions
Class E insurers must at all times maintain an MMS and an ECR in accordance with the provisions of the Bermuda Insurance Act. Each year the insurer is required to file with the BMA a capital and solvency return within four months of its relevant financial year end (unless specifically extended). The Bermuda Insurance Act mandates certain actions and filings with the BMA if an insurer fails to meet and/or maintain its ECR or MMS including the filing of a written report detailing the circumstances giving rise to the failure and the manner and time within which the insurer intends to rectify the failure. An insurer is prohibited from declaring or paying a dividend if in breach of its ECR or MMS or if the declaration or payment of such dividend would cause such a breach. Where an insurer fails to meet its MMS on the last day of any financial year, it is prohibited from declaring or paying any dividends during the next financial year without the approval of the BMA. Under the Bermuda Insurance Act, ALRe is prohibited from paying a dividend in an amount exceeding 25% of the prior year’s total statutory capital and surplus, unless at least two members of ALRe’s board of directors and its principal representative sign and submit to the BMA an affidavit attesting that a dividend in excess of this amount would not cause ALRe to fail to meet its relevant margins. In certain instances, ALRe would also be required to provide prior notice to the BMA in advance of the payment of dividends. In the event that such an affidavit is submitted to the BMA in accordance with the Bermuda Insurance Act, and further subject to ALRe meeting its MMS and ECR, ALRe is permitted to distribute up to the sum of 100% of statutory surplus and an
205
Table of Contents
amount less than 15% of its total statutory capital. Distributions in excess of this amount require the approval of the BMA. Further, ALRe must obtain the BMA’s prior approval before reducing its total statutory capital as shown in its previous financial year statutory balance sheet by 15% or more. ALRe is also required to obtain a certification from its approved actuary prior to declaring or paying any dividends and such certificate will not be given unless the value of its long-term business assets exceeds its long-term business liabilities, as certified by its approved actuary, by the amount of the dividend and at least the MMS. These restrictions on declaring or paying dividends and distributions under the Bermuda Insurance Act are in addition to those under the Companies Act which apply to all Bermuda companies. See “Comparison of Shareholder Rights—Differences in Corporate Law—Dividends and Other Distributions.”
At the time of filing its statutory financial statements, a Class E insurer is also required to deliver to the BMA a declaration of compliance, in such form and with such content as may be prescribed by the BMA, declaring whether or not the Class E insurer has, with respect to the preceding financial year (i) complied with all requirements of the minimum criteria applicable to it; (ii) complied with the MMS as at its financial year end; (iii) complied with the applicable enhanced capital requirements as at its financial year end; and (iv) observed any limitations, restrictions or conditions imposed upon issuance of its license, if applicable. The declaration of compliance is required to be signed by two directors of the Class E insurer and if the Class E insurer has failed to comply with any of the requirements referenced in (i) through (iii) above or observe any limitations, restrictions or conditions imposed upon the issuance of its license, if applicable, the Class E insurer will be required to provide the BMA with particulars of such failure in writing. A Class E insurer shall be liable to civil penalty by way of a fine for failure to comply with a duty imposed on it in connection with the delivery of the declaration of compliance.
The MMS that a Class E insurer is required to maintain with respect to its long-term business is the greater of (i) $8 million, (ii) 2% of the first $500 million of assets plus 1.5% of assets above $500 million (assets for this purpose are defined as the total assets reported in the insurer’s statutory balance sheet on Line 15, Column C in the relevant year less the aggregate of the amounts held in a segregated account reported on Lines 13(b) and (c) Column C) or (iii) 25% of the ECR as reported at the end of the relevant year. We are well above each of these MMS requirements.
The BMA has embedded an EBS framework as part of the Capital and Solvency Return that will form the basis for an insurer’s ECR. The premise underlying the EBS framework is the idea that assets and liabilities should be valued on a consistent economic basis. Under the Bermuda Regulatory Framework there are two solvency calculations: (i) a Class E Insurer must have total statutory capital and surplus as reported on the insurer’s statutory balance sheet greater than the MMS calculated pursuant to the Insurance Account Rules 2016; and (ii) under the Insurance (Prudential Standards) (Class C, Class D and Class E Solvency Requirement) Rules 2011 an insurer is required to maintain available statutory economic capital and surplus to an amount that is equal to or exceeds the value of its ECR. Effective January 1, 2016, the method for preparing these statutory financial statements was amended, and in addition, the requirements and rules for preparing the Class E statutory EBS became effective. Prior to January 1, 2016, a Class E insurer’s ECR and its total statutory capital and surplus were calculated using the company’s statutory balance sheet. Following January 1, 2016, a Class E insurer’s ECR and total statutory economic capital and surplus will be calculated using the Class E statutory EBS. The first filing due under this revised regulatory regime will be in 2017 for the year ended December 31, 2016.
A Class E insurer is required to maintain available statutory capital and surplus at a level equal to or in excess of its ECR which is established by reference to the Class E BSCR model. The BSCR model provides a method for determining an insurer’s capital requirements (statutory capital and surplus) by taking into account the risk characteristics of different aspects of the insurer’s business. The BSCR formula establishes capital requirements for fourteen categories of risk: fixed income investment risk, equity investment risk, long-term interest rate/liquidity risk, currency risk, concentration risk, credit risk, operational risk and seven categories of long-term insurance risk. For each category, the capital requirement is determined by applying factors to asset, premium, reserve, creditor, probable maximum loss and operation items, with higher factors applied to items with greater underlying risk and lower factors for less risky items.
206
Table of Contents
ALRe’s total statutory capital and surplus as of December 31, 2015 and December 31, 2014 measured under the regime prior to January 1, 2016 was 323% and 237%, respectively, of its ECR. As the first filing following the January 1, 2016 amendments is not due to be filed with the BMA until 2017 for the year ended December 31, 2016, ALRe does not have available its ECR under the new EBS framework; however, ALRe believes it will continue to exceed the regulatory requirements under the new EBS framework based on trial run submissions to the BMA.
While not specifically referred to in the Bermuda Insurance Act, TCL is also an important threshold for statutory capital and surplus. TCL is equal to 120% of ECR as calculated pursuant to the BSCR formula. TCL serves as an early warning tool for the BMA. If an insurer fails to maintain statutory capital at least equal to its TCL, such failure will likely result in increased regulatory oversight by the BMA.
A Class E insurer which at any time fails to meet its applicable ECR shall, upon becoming aware of such failure or upon having reason to believe that such a failure has occurred, immediately notify the BMA in writing. Within 14 days of such notification, such Class E insurer shall file with the BMA a written report containing particulars of the circumstances leading to the failure and a plan detailing the manner in which, and specific actions to be taken to, rectify the failure, and the time within which the Class E insurer intends to rectify the failure. Within 45 days of becoming aware of such failure, or of having reason to believe that such a failure has occurred, such Class E insurer shall furnish the BMA with (i) unaudited statutory economic balance sheets and unaudited interim statutory financial statements prepared in accordance with GAAP covering such period as the BMA may require; (ii) an opinion of the approved actuary in relation to total long-term business insurance technical provisions as set out in the statutory economic balance sheet, where applicable; (iii) a long-term business solvency certificate in respect of the financial statements; and (iv) a capital and solvency return reflecting an ECR prepared using post-failure data where applicable.
All Bermuda companies must comply with the provisions of the Companies Act regulating the payment of dividends and making distributions from contributed surplus. A company may not declare or pay a dividend, or make a distribution out of contributed surplus, if there are reasonable grounds for believing that: (1) the company is, or would after the payment be, unable to pay its liabilities as they become due, or (2) the realizable value of the company’s assets would thereby be less than its liabilities.
Eligible Capital
To enable the BMA to better assess the quality of the insurer’s capital resources, a Class E insurer is required to disclose the makeup of its capital in accordance with the recently introduced ‘3-tiered capital system.’ Under this system, all of the insurer’s capital instruments will be classified as either basic or ancillary capital which in turn will be classified into one of three tiers based on their “loss absorbency” characteristics. Highest quality capital will be classified as Tier 1 Capital, lesser quality capital will be classified as either Tier 2 Capital or Tier 3 Capital. Under this regime, up to certain specified percentages of Tier 1, Tier 2 and Tier 3 Capital may be used to support the insurer’s MMS, ECR and TCL. The Bermuda Insurance Act requires that Class E insurers have Tier 1 Capital equal to or greater than 50% of the value of its ECR and Tier 3 Capital of not more than 17.65% of the aggregate of its Tier 1 Capital and Tier 2 Capital.
The characteristics of the capital instruments that must be satisfied to qualify as Tier 1, Tier 2 and Tier 3 Capital are set out in the Insurance (Eligible Capital) Rules 2012, and any amendments thereto. Under these rules, Tier 1, Tier 2 and Tier 3 Capital may, until January 1, 2024, include capital instruments that do not satisfy the requirement that the instrument be non-redeemable or settled only with the issuance of an instrument of equal or higher quality upon a breach, or that the coupon payment on the instrument be cancellable or deferrable indefinitely, upon breach, or if it would cause a breach, of the ECR.
Where the BMA has previously approved the use of certain instruments for capital purposes, the BMA’s consent will need to be obtained if such instruments are to remain eligible for use in satisfying the MMS and the ECR. We do not currently use any such instruments.
207
Table of Contents
Code of Conduct
Every Bermuda registered insurer must comply with the Insurance Code of Conduct (the “Code of Conduct”) which prescribes the duties and standards that must be complied with to ensure sound corporate governance, risk management and internal controls are implemented. The BMA will assess an insurer’s compliance with the Code of Conduct in a proportionate manner relative to the nature, scale and complexity of its business. Failure to comply with the requirements of the Code of Conduct will be taken into account by the BMA in determining whether an insurer is conducting its business in a sound and prudent manner as prescribed by the Bermuda Insurance Act and may result in the BMA exercising its powers of intervention and investigation (see below) and, in the case of ALRe, as a Class E insurer, will be a factor in calculating the operational risk charge under the insurer’s BSCR or approved internal model.
Fit and Proper Controllers
The BMA maintains supervision over the “controllers” of all registered insurers in Bermuda. For these purposes, a “controller” includes (1) the managing director of the registered insurer or its parent company, (2) the chief executive of the registered insurer or of its parent company, (3) a shareholder controller, and (4) any person in accordance with whose directions or instructions the directors of the registered insurer or its parent company are accustomed to act.
The definition of shareholder controller is set out in the Bermuda Insurance Act but generally refers to (1) a person who holds 10% or more of the shares carrying rights to vote at a shareholders’ meeting of the registered insurer or its parent company, (2) a person who is entitled to exercise 10% or more of the voting power at any shareholders’ meeting of such registered insurer or its parent company or (3) a person who is able to exercise significant influence over the management of the registered insurer or its parent company by virtue of its shareholding or its entitlement to exercise, or control the exercise of, the voting power at any shareholders’ meeting.
A shareholder controller that owns 10% or more but less than 20% of the shares as described above is defined as a 10% shareholder controller; a shareholder controller that owns 20% or more but less than 33% of the shares as described above is defined as a 20% shareholder controller; a shareholder controller that owns 33% or more but less than 50% of the shares as described above is defined as a 33% shareholder controller; and a shareholder controller that owns 50% or more of the shares as described above is defined as a 50% shareholder controller.
Where the shares of a registered insurer, or the shares of its parent company, are traded on a recognized stock exchange, and such shareholder becomes a 10%, 20%, 33% or 50% shareholder controller of the insurer, that shareholder shall, within 45 days, notify the BMA in writing that such shareholder has become, or as a result of a disposition ceased to be, a controller of any such category.
Under our bye-laws, we have imposed restrictions on the ownership by holders of our Class A common shares (other than the Apollo Group) controlling more than 9.9% of the voting power associated with our common shares. The voting rights exercisable by shareholders of the company other than the Apollo Group will be limited so that Control Groups are not deemed to hold more than 9.9% of the total voting power conferred by our shares. In addition, our board of directors retains certain discretion to make adjustments to the aggregate number of votes attaching to the shares of any person or group that they consider fair and reasonable in all the circumstances to ensure that such person or group will not hold more than 9.9% of the total voting power represented by our then outstanding shares. As such, other than the Apollo Group (at the 33% to 50% shareholder controller level), no shareholder will be a shareholder controller of us.
Where the shares of a shareholder or prospective shareholder of an insurer, or the shares of its parent company, are not traded on a recognized stock exchange, the Bermuda Insurance Act prohibits such shareholder from becoming a shareholder controller unless such shareholder has first served on the BMA notice in writing stating that such shareholder intends to become such a controller and the BMA has either, before the end of 45
208
Table of Contents
days following the date of notification, provided notice to the proposed controller that it does not object to such shareholder becoming such a controller or the full 45 days has elapsed without the BMA filing an objection. If a shareholder controller intends to reduce or dispose of shares and as a result will cease to be a shareholder controller of any such category, such shareholder controller must notify the BMA in writing of its intent to reduce or dispose of such holding.
Any person or entity who contravenes the Bermuda Insurance Act by failing to give notice or knowingly becoming a controller of any description before the required 45 days has elapsed is guilty of an offense under Bermuda law and liable to a fine of $25,000 on summary conviction.
The BMA may file a notice of objection to any person or entity who has become a controller of any description where it appears that such person or entity is not, or is no longer, fit and proper to be a controller of the registered insurer. Before issuing a notice of objection, the BMA is required to serve upon the person or entity concerned a preliminary written notice stating the BMA’s intention to issue formal notice of objection. Upon receipt of the preliminary written notice, the person or entity served may, within 28 days, file written representations with the BMA which shall be taken into account by the BMA in making its final determination. Any person or entity who continues to be a controller of any description after having received a notice of objection is guilty of an offense and liable on summary conviction to a fine of $25,000 (and a continuing fine of $500 per day for each day that the offense is continuing) or, if convicted on indictment, to a fine of $100,000 and/or 2 years in prison.
Notice of Change of Controllers and Officers
All registered insurers are required to give written notice to the BMA of the fact that a person has become, or ceased to be, a controller or officer of the registered insurer within 45 days of becoming aware of such fact. An officer in relation to a registered insurer means a director, chief executive or senior executive performing duties of underwriting, actuarial, risk management, compliance, internal audit, finance or investment matters.
Notification of Material Changes
All registered insurers are required to give notice to the BMA of their intention to effect a material change within the meaning of the Bermuda Insurance Act. For the purposes of the Bermuda Insurance Act, the following changes are material: (1) the transfer or acquisition of insurance business, including portfolio transfers or corporate restructurings, pursuant to a court-approved scheme of arrangement under Section 25 of the Bermuda Insurance Act or Section 99 of the Companies Act, (2) the amalgamation with or acquisition of another firm, (3) engaging in unaffiliated, third-party business that is retail business, (4) the acquisition of a controlling interest in an undertaking that is engaged in non-insurance business which offers services and products to persons who are not affiliates of the insurer, (5) outsourcing all or substantially all of the company’s actuarial, risk management and compliance or internal audit functions, (6) outsourcing all or a material part of an insurer’s underwriting activity, (7) the transfer other than by way of reinsurance of all or substantially all of a line of business, (8) the expansion into a material new line of business, (9) the sale of an insurer and (10) outsourcing of an “officer” role, as such term is defined by the Bermuda Insurance Act.
As a registered insurer, ALRe may not take any steps to give effect to such a material change unless it has first served notice on the BMA that it intends to effect such material change and before the end of 30 days, either the BMA has notified ALRe in writing that it has no objection to such change or that period has lapsed without the BMA having issued a notice of objection.
Before issuing a notice of objection, the BMA would be required to serve upon ALRe a preliminary written notice stating the BMA’s intention to issue formal notice of objection. Upon receipt of the preliminary written notice, ALRe could, within 28 days, file written representations with the BMA which the BMA would be required to take into account in making its final determination.
209
Table of Contents
Supervision, Investigation and Intervention
The BMA may appoint an inspector with powers to investigate the affairs of an insurer if the BMA believes that an investigation is required in the interests of the insurer’s policyholders or potential policyholders. In order to verify or supplement information otherwise provided to the inspector, the BMA may direct an insurer to produce documents or information relating to matters connected with its business.
If it appears to the BMA that there is a risk of an insurer becoming insolvent, or that it is in breach of the Bermuda Insurance Act or any conditions imposed upon its registration, the BMA may, among other things, direct the insurer (1) not to take on any new insurance business, (2) not to vary any insurance contract if the effect would be to increase its liabilities, (3) not to make certain investments, (4) to realize certain investments, (5) to maintain or transfer to the custody of a specified bank, certain assets, (6) not to declare or pay any dividends or other distributions or to restrict the making of such payments, (7) to limit its premium income, (8) not to enter into any specified transaction with any specified persons or persons of a specified class, (9) to provide such written particulars relating to the financial circumstances of the insurer as the BMA thinks fit, (10) to obtain the opinion of an actuary loss reserve specialist and to submit it to the BMA, and (11) to remove a controller or officer.
Group Supervision
The BMA may, in respect of an insurance group, determine whether it is appropriate for it to act as its group supervisor. An insurance group is defined as a group of companies that conducts exclusively, or mainly, insurance business. The BMA may make such determination where it ascertains that (1) the group is headed by a “specified insurer” (that is to say, it is headed by either a Class 3A, Class 3B or Class 4 general business insurer or a Class C, Class D or Class E long-term insurer or another class of insurer designated by order of the BMA); or (2) where the insurance group is not headed by a “specified insurer,” where it is headed by a parent company which is incorporated in Bermuda or (3) where the parent company of the group is not a Bermuda company, in circumstances where the BMA is satisfied that the insurance group is directed and managed from Bermuda or the insurer with the largest balance sheet total is a specified insurer.
Where the BMA determines that it should act as the group supervisor, it shall designate a specified insurer that is a member of the insurance group to be the designated insurer (the “Designated Insurer”) and it shall give to the Designated Insurer and other competent authorities written notice of its intention to act as group supervisor. Once the BMA has been designated as group supervisor, the Designated Insurer must ensure that an approved group actuary is appointed to provide an opinion as to the adequacy of the insurance group’s insurance reserves as reported in its group statutory financial returns.
Pursuant to its powers under the Bermuda Insurance Act, the BMA will maintain a register of particulars for every insurance group for which it acts as the group supervisor detailing, among other things, the names and addresses of the Designated Insurer, each member company of the insurance group falling within the scope of group supervision, the principal representative of the insurance group in Bermuda, other competent authorities supervising other member companies of the insurance group, and the insurance group auditors. The Designated Insurer must notify the BMA of any changes to the above details entered on the register of an insurance group.
As group supervisor, the BMA will perform a number of supervisory functions including (1) coordinating the gathering and dissemination of information which is of importance for the supervisory task of other competent authorities, (2) carrying out a supervisory review and assessment of the insurance group, (3) carrying out an assessment of the insurance group’s compliance with the rules on solvency, risk concentration, intra-group transactions and good governance procedures, (4) planning and coordinating, with other competent authorities, supervisory activities in respect of the insurance group, both as a going concern and in emergency situations, (5) coordinating any enforcement action that may need to be taken against the insurance group or any of its members and (6) planning and coordinating meetings of colleges of supervisors (consisting of insurance regulators) in order to facilitate the carrying out of the functions described above.
210
Table of Contents
In carrying out its functions, the BMA may make rules for (1) assessing the financial situation and the solvency position of the insurance group and/or its members and (2) regulating intra-group transactions, risk concentration, governance procedures, risk management and regulatory reporting and disclosure.
The BMA has not yet designated any long-term life reinsurers, such as ALRe, for group supervision, accordingly, we are not currently subject to group supervision. The BMA may, however, exercise its authority to act as our group supervisor in the future.
Disclosure of Information
In addition to powers under the Bermuda Insurance Act to investigate the affairs of an insurer, the BMA may require certain information from an insurer (or certain other persons) to be produced to the BMA. Further, the BMA has been given powers to assist other regulatory authorities, including foreign insurance regulatory authorities, with their investigations involving insurance and reinsurance companies in Bermuda but subject to restrictions. For example, the BMA must be satisfied that the assistance being requested is in connection with the discharge of regulatory responsibilities of the foreign regulatory authority. Further, the BMA must consider whether cooperation is in the public interest. The grounds for disclosure are limited and the Bermuda Insurance Act provides for sanctions for breach of the statutory duty of confidentiality.
Certain Other Bermuda Law Considerations
All Bermuda “exempted companies” are exempt from certain Bermuda laws restricting the percentage of share capital that may be held by non-Bermudians. However, exempted companies may not participate in certain business transactions, including (1) the acquisition or holding of land in Bermuda except that which is required for their business and held by way of lease or tenancy for terms of not more than 50 years or, with the consent of the Minister, land which is used to provide accommodation or recreational facilities for officers and employees for a term not exceeding 21 years, (2) the taking of mortgages on land in Bermuda to secure an amount in excess of $50,000 without the consent of the Minister, (3) the acquisition of any bonds or debentures secured by any land in Bermuda, other than certain types of Bermuda government securities or securities issued by Bermuda public authorities or (4) the carrying on of business of any kind in Bermuda, except in furtherance of the business carried on outside Bermuda or under license granted by the Minister. Generally it is not permitted without a special license granted by the Minister to insure Bermuda domestic risks or risks of persons of, in or based in Bermuda.
Exchange Control
The permission of the BMA is required, pursuant to the provisions of the Exchange Control Act 1972 and related regulations, for all issuances and transfers of shares (which includes the Class A common shares) of Bermuda companies to or from a non-resident of Bermuda for exchange control purposes, other than in cases where the BMA has granted a general permission. The BMA, in its notice to the public dated June 1, 2005, has granted a general permission for the issue and subsequent transfer of any securities of a Bermuda company from and/or to a non-resident of Bermuda for exchange control purposes for so long as any “Equity Securities” of the company (which would include the Class A common shares) are listed on an “Appointed Stock Exchange” (which would include the NYSE). The BMA accepts no responsibility for our financial soundness or the correctness of any of the statements made or opinions expressed in this prospectus.
Germany
The following paragraphs outline the most relevant legal provisions applicable to our German business and our Luxembourg subsidiary.
Basic Legal Framework
Our German Group Companies licensed as insurers are subject to the relevant laws and regulation applicable to insurers in Germany. Our German Group Companies acting as insurance holding companies are
211
Table of Contents
subject to the relevant laws and regulations applicable to insurance holding companies in Germany. The relevant laws include the VAG, which constitutes the basic regulatory framework for operating an insurance business in Germany and which also includes a limited set of provisions that apply to insurance holding companies. The VAG is supplemented by various ordinances implemented by the German Ministry of Finance (Bundesministerium der Finanzen) and/or BaFin which regulate and mandate, among other things, eligibility criteria for investments, policyholder participation in income, accounting principles, corporate governance requirements, regulatory capital and reporting of insurance undertakings. The relevant insurance contracts are governed by the Insurance Contracts Act (Versicherungsvertragsgesetz) and the German Civil Code (Bürgerliches Gesetzbuch) and further specific consumer protection laws, data protection requirements and anti-money-laundering requirements.
Profit Sharing and Dividend Restriction
German insurance law provides that policyholders participate in the income of the insurance undertaking unless explicitly excluded in the contracts (which is not the case for the portfolio of our German Group Companies). In particular, the minimum transfer ordinance (“MindZV”) provides for a minimum profit participation in the amount of 90% of the investment result, 90% of the insurance result and 50% of the other results of the insurance undertaking. Additionally, on maturity policyholders are entitled to 50% of the unrealized capital gains (Bewertungsreserven), which are hidden reserves which have not yet materialized from an accounting perspective. Unrealized gains on fixed-interest investments and interest-rate hedges only participate in excess of a certain safety requirement (Sicherungsbedarf) necessary to ensure payment of the guaranteed interest.
Distribution of dividends by insurance undertakings is only permitted in excess of a safety requirement, which is an amount that is necessary in order to secure the payment of the insurer’s liabilities in case the guaranteed interest is above a certain reference rate (based on a zero-coupon euro swap with a maturity of ten years).
BaFin and EIOPA
Our German Group Companies are subject to supervision by BaFin, which is the central financial regulatory authority for Germany. As part of an enhanced system of financial markets regulation in Europe, EIOPA has been set up as a regulatory authority on the European level. EIOPA has certain powers in relation to the Solvency II regime, including issuing guidelines interpreting Solvency II which are addressed to the national supervisory authorities. It cannot be predicted how EIOPA intends to apply its powers in practice and whether the new authority will result in more intrusive and intensive regulation, adding additional burdens to our resources.
Solvency II
The EC has implemented a new prudential framework for insurance companies, known as Solvency II, that replaced the previous life, non-life, reinsurance and insurance group’s directives in Europe from 2016 onwards. Solvency II uses a more principle- and risk-based approach.
Solvency II is set up based on a four-level legislative process. The “Level 1” directive, dated November 25, 2009, as amended by the proposed Omnibus II Directive, sets out a framework which is supplemented by the more detailed Commission Delegated Regulation (EU) 2015/35 (“Solvency II Delegated Regulation”) and implementing measures as issued by the EC at “Level 2” and technical standards, which are directly applicable in Germany. “Level 3” consists of standards and guidance developed by EIOPA and at “Level 4,” the EC monitors uniform implementation of the rules.
Insurance undertakings to which Solvency II applies, including ALV, have become subject to changes with regard to solvency capital and own funds requirements, the valuation of assets and liabilities, provisions concerning business organization (governance) and reporting and disclosure requirements.
212
Table of Contents
Solvency II further provides for the supervision of insurance groups and imposes a group-level capital requirement in relation to certain insurance groups.
In Germany, the relevant regulatory changes triggered by Solvency II are implemented via a restatement of the VAG, which was enacted in April 2015 and became effective on January 1, 2016.
Credit for Reinsurance Ceded
Whereas under the previous regime, the reduction for ceded reinsurance was a fixed function based on the primary insurer’s liabilities, Solvency II implements a risk-based approach pursuant to which insurance undertakings have to take into account their own risk profile in determining their solvency requirements. Under Solvency II, capital charges for ceded reinsurance thus depends on a variety of factors, including in particular the financial strength of the reinsurer, spread, rating and the number of reinsurers employed by the primary insurer.
Capital Requirements
Under the Solvency II regime, MCR, as well as SCR, are imposed. As of 2016, our German Group Companies licensed as insurance undertakings are obliged to meet these requirements in order to be able to fulfill, subject to a certain confidence level of 99.5%, in case of the SCR, or 85%, in case of the MCR, over a one-year period, all obligations arising from existing business as well as the new business expected to be written over the following 12 months. Failure to maintain adequate capital levels may result in regulatory action by BaFin.
Regulation of Investments
Our German Group Companies are subject to certain regulatory provisions on eligible investments, including the prudent person principle under Solvency II.
Consumer Protection Laws
The German insurance law is strongly focused on protection of policyholders. Various specific rights, including cancellation rights, are granted to policyholders, aimed in particular at protecting their right of due information and transparency. As a general tendency, courts (the European Court of Justice as well as national German courts) tend to strengthen the policyholders’ position vis-à-vis insurance undertakings.
Privacy Regulation
As to our German Group Companies, personal data of customers is collected, processed and used in Germany. As a consequence, German data protection laws apply which are considered to be rather strict in comparison to U.S. data protection laws. In general, the Federal German Data Protection Act (Bundesdatenschutzgesetz) requires either consent of the respective customer or statutory permission in order to collect, process and/or use personal data of customers (further requirements apply to the processing of health data). Furthermore, under the German Criminal Act (Strafgesetzbuch), employees of private health, accident or life insurance companies are subject to statutory confidentiality obligations. A transfer to a reinsurer or other third party of customer data falling under such insurance categories generally requires consent of the respective customer.
Luxembourg Regulation
Our Luxembourg subsidiary is subject to supervision by the CSSF and Luxembourg regulation for management companies of investment funds. We do not believe that our Luxembourg subsidiary is governed by the directive 2011/61/EU of the European Parliament and of the Council of June 8, 2011 on Alternative Investment Fund Managers and it is currently registered accordingly with the CSSF on the basis of a self-assessment. In the
213
Table of Contents
absence of a final decision by the relevant Luxembourg authorities, and subject to any policy changes and changes in circumstances on which the self-assessment is based, namely regarding the holding and investment structure, we cannot exclude the risk of our Luxembourg subsidiary qualifying as an Alternative Investment Fund Manager. Such a determination would require an enhanced administration, organization and financing of our Luxembourg subsidiary. The Luxembourg investment fund managed by our Luxembourg subsidiary is regulated as a specialized investment fund under Luxembourg law and thus is also subject to legislative and/or regulatory developments, which may impact the position and performance of our Luxembourg subsidiary.
214
Table of Contents
Below is a list of the names and ages, as of October 31, 2016, of our directors and executive officers and a description of the business experience of each of them.
| Name |
Age | Position | ||
| James R. Belardi |
59 | Chairman, Chief Executive Officer and Chief Investment Officer | ||
| William J. Wheeler |
55 | President | ||
| Grant Kvalheim |
60 | Chief Executive Officer – Athene USA | ||
| Martin P. Klein |
57 | Executive Vice President and Chief Financial Officer | ||
| Frank L. Gillis |
65 | Executive Vice President – Athene, Chief Executive Officer – ALRe | ||
| John Rhodes |
44 | Executive Vice President and Chief Risk Officer | ||
| Marc Beilinson |
58 | Director* | ||
| Robert Borden |
53 | Director* | ||
| Mark Cutis |
63 | Director* | ||
| Ahmed Ghubash |
47 | Director* | ||
| Brian Leach† |
57 | Director* | ||
| Gernot Lohr |
47 | Director | ||
| H. Carl McCall† |
81 | Director* | ||
| Matthew R. Michelini |
35 | Director | ||
| Jerome Mourgue d’Algue |
46 | Director* | ||
| Dr. Manfred Puffer |
53 | Director | ||
| Marc Rowan |
54 | Director | ||
| Lawrence J. Ruisi |
68 | Director* | ||
| Imran Siddiqui |
42 | Director | ||
| Hope Schefler Taitz |
52 | Director* | ||
| Arthur Wrubel† |
51 | Director* |
*Independent director for purposes of the NYSE corporate governance listing requirements.
| † | These directors have been appointed subject to being nominated and elected by shareholders at the next annual general meeting to take place in 2017. |
Executive Officers
James R. Belardi has served as our Chairman and Chief Executive Officer and Chief Investment Officer since May 2009. In addition, Mr. Belardi is the Chairman, Chief Executive Officer and Chief Investment Officer of AAM, our investment manager. He is a member of our executive committee. Mr. Belardi is responsible for our overall strategic direction and management in his capacity as Chief Executive Officer and is responsible for the day-to-day management of our investment portfolio in his capacity as Chief Investment Officer. Prior to founding our company and AAM, Mr. Belardi was President of SunAmerica Life Insurance Company and was also Executive Vice President and Chief Investment Officer of AIG Retirement Services, Inc., where he had responsibility for an invested-asset portfolio of $250 billion. Mr. Belardi has a Bachelor of Arts degree in economics from Stanford University and a Master of Business Administration from the University of California, Los Angeles. He currently serves on the board of directors of Paulist Productions, where he chairs the investment committee, Aris Mortgage Holding Company LLC (“Aris Holdco”) and Southern California Aquatics. Mr. Belardi was selected to serve on our board of directors as a result of his demonstrated track record in and deep knowledge of the financial services business, including having founded both our company and AAM, and his extensive experience in the insurance industry.
William J. Wheeler has served as our President since September 2015. Together with Mr. Belardi, Mr. Wheeler is responsible for our overall strategic direction. In particular, Mr. Wheeler oversees all of our business units, which includes our retail, reinsurance and German operations, and also our corporate development and risk activities. Prior to joining our company, Mr. Wheeler was President of the Americas group for MetLife Inc. (“MetLife”) where he oversaw the insurance and retirement business in the United States and Latin America. During his seventeen-year tenure at MetLife, Mr. Wheeler assumed various executive positions, including
215
Table of Contents
Executive Vice President and Chief Financial Officer. In addition, Mr. Wheeler served as Treasurer for MetLife, playing a key role in preparing MetLife to become a public company. Prior to joining MetLife, Mr. Wheeler was an investment banker at Donaldson, Lufkin & Jenrette. Mr. Wheeler has a Bachelor of Arts degree in English from Wabash College and a Master of Business Administration from Harvard Business School. He currently serves on the board of Evercore Partners Inc.
Grant Kvalheim has served as the Chief Executive Officer of Athene USA since June 2015 and served as our President from January 2011 until September 2015, served as the Chief Financial Officer from January 2011 until April 2013 and served as a director from January 2012 until February 2014. Mr. Kvalheim is responsible for the oversight of our U.S. operating companies with a focus on our retail annuity channel, including growth initiatives and new product development. Prior to joining our company, Mr. Kvalheim was a senior executive of Barclays Capital (“Barclays”) from early 2001 to the end of 2007, becoming Co-President in September 2005. During his time at Barclays he converted a European cash investment grade business into a leading global cash and derivatives business across both securitized and non-securitized credit products, and significantly expanded Barclays’ investment banking platform. Prior to joining Barclays, Mr. Kvalheim held senior executive positions in the investment banks of Deutsche Bank and Merrill Lynch. Mr. Kvalheim has a Bachelor of Arts degree in economics from Claremont McKenna College and a Master of Business Administration in finance from the University of Chicago. He served on the board of directors of the Permal Silk Road Fund from June 2008 to November 2012. He currently serves on the advisory board of Independence Equity.
Martin P. Klein has served as our Executive Vice President and Chief Financial Officer since November 2015. Mr. Klein also serves as a director of AADE. Mr. Klein is responsible for overseeing our financial management, including our enterprise finance, tax, actuarial and internal audit functions. He also helps to develop and execute strategic operating decisions across our company. Prior to joining our company, Mr. Klein served as Executive Vice President and Chief Financial Officer of Genworth Financial, Inc. (“Genworth”) from February 2013 to October 2015. Prior to that, he was Senior Vice President—Chief Financial Officer of Genworth from May 2011 to February 2013, and from May 2012 through December 2012, he also served as Genworth’s Acting President and Acting Chief Executive Officer. Prior to joining Genworth, Mr. Klein served as a Managing Director and Senior Relationship Manager of Barclays, after its acquisition of the U.S. operations of Lehman Brothers Holdings, Inc. (“Lehman Brothers”) in 2008. At Lehman Brothers, Mr. Klein served as a Managing Director and from 1998 to 2008 was the head of the Insurance Solutions Groups, and also founded and ran the Pension Solutions Group. Prior to Lehman Brothers, Mr. Klein had been with Zurich Insurance Group from 1994 to 1998 and was a Managing Director of Zurich Investment Management. Prior to Zurich, Mr. Klein served in finance and actuarial roles in other insurance organizations. Mr. Klein is a Fellow of the Society of Actuaries and a Chartered Financial Analyst. He received his Bachelor of Arts in mathematics and business administration from Hope College and a Master of Science in statistical and actuarial sciences from University of Iowa.
Frank L. Gillis is a founder of our company and served on our board of directors from May 2009 to February 2014. Mr. Gillis has served as Chief Executive Officer of ALRe since June 2009 and serves as a director of ALRe. Mr. Gillis is responsible for our growth through our reinsurance channel and is responsible for the oversight of ALRe. Prior to founding our company, Mr. Gillis was a Senior Managing Director at Bear Stearns & Co. Inc. (“Bear Stearns”) and was the head of the Bear Stearns Insurance Solutions Group. In this position, he led Bear Stearns’ entry into the funding agreement-backed note business and created the turn-key Premium Asset Trust Series. Prior to Bear Stearns, Mr. Gillis spent over three years at GenRe Financial Products providing ALM hedging solutions to U.S. life insurance companies. Mr. Gillis serves on the boards of Bermuda International Long Term Insurers and Reinsurers and the Association of Bermuda International Companies. Mr. Gillis has a Bachelor of Arts in English from the University of Richmond.
John Rhodes has served as our Executive Vice President and Chief Risk Officer since August 2016. Mr. Rhodes is responsible for overseeing our enterprise risk management functions, as well as providing key support in connection with strategic operating decisions across our company. Prior to joining our company, Mr. Rhodes was the Chief Risk Officer of Allstate from 2015 to 2016. Prior to joining Allstate, Mr. Rhodes was the
216
Table of Contents
Chief Risk Officer of Lincoln Financial Group from 2012 to 2015. Prior to that he served as the Head of Equity Risk Management at Lincoln Financial Group from 2009 to 2012. Prior to joining Lincoln Financial Group, Mr. Rhodes was the Head of Hedging Operations and Performance Management at ING US Financial Services from 2006 to 2009. From 1999 to 2006, Mr. Rhodes served in a variety of roles at JPMorgan Chase and GE Capital focusing primarily on market risk and valuation. Mr. Rhodes also served in the U.S. Navy as a commissioned officer. Mr. Rhodes received a Bachelor of Science degree in oceanography from the United States Naval Academy and a Master of Business Administration from New York University, Leonard Stern School of Business.
Directors
We believe our board of directors should be composed of a diverse group of individuals with sophistication and experience in many substantive areas that impact our business. We believe experience, qualifications and skills in the following areas are most important: insurance industry; accounting, finance, and capital structure; strategic planning and leadership of complex organizations; legal/regulatory and government affairs; personnel management; and board practices of other major corporations. We believe that all of our current board members possess the professional and personal qualifications necessary for service on our board, and have highlighted particularly noteworthy attributes for each board member in the individual biographies below, or above in the case of our Chairman and Chief Executive Officer.
Marc Beilinson has served as a director of our company since 2013, and is a member of our compensation and conflicts committees. Since August 2011, Mr. Beilinson has been the Managing Partner of Beilinson Advisory Group, a financial restructuring and hospitality advisory group that specializes in assisting distressed companies. Mr. Beilinson previously served as Chief Restructuring Officer of Fisker Automotive and as Chief Restructuring Officer and Chief Executive Officer of Eagle Hospitality Properties Trust, Inc. and Innkeepers USA Trust. Mr. Beilinson currently serves on the boards of directors and audit committees of MFG Assurance Company Limited and Caesars Acquisition Company. Mr. Beilinson has previously served on the boards of directors and audit committees of a number of public and privately held companies, including Wyndham International, Inc., Apollo Commercial Real Estate Finance, Inc. (“ARI”), Innkeepers USA Trust and JER/Jameson Properties LLC. Mr. Beilinson has a Bachelor of Arts in political science from the University of California, Los Angeles and a Juris Doctor from the University of California Davis Law School. Mr. Beilinson was selected to serve on our board of directors as a result of having over thirty years of service to the boards of both public and private companies, and his extensive knowledge of legal and compliance issues, including the Sarbanes-Oxley Act of 2002.
Robert Borden has served as a director of our company and our company’s subsidiary, ALRe, since 2010, and is a member of our risk and conflicts committees. Mr. Borden is Managing Partner and Chief Investment Officer of Delegate Advisors, LLC. From April 2006 to January 2012, Mr. Borden served as the Chief Executive Officer and Chief Investment Officer of the South Carolina Retirement System Investment Commission (“SCRSIC”), which is responsible for investing and managing all assets of the South Carolina Retirement Systems. Prior to his role at SCRSIC, Mr. Borden served as the Executive Director and Chief Investment Officer of the Louisiana State Employees Retirement System, where he was responsible for investment management, benefits administration, finance and operations. Mr. Borden has also served as Vice Chairman and Chairman of the Fund Evaluation Committee for the Louisiana Deferred Compensation Commission and as a member of the South Carolina Deferred Compensation Committee. Prior to that, Mr. Borden served as Treasurer and Senior Manager for Financial Services at the Texas Workers’ Compensation Insurance Fund after serving as VP of Treasury and Interest Rate Risk Manager at Franklin Federal Bancorp. Mr. Borden has a Bachelor of Business Administration with a major in finance from the University of Texas at Austin and received a Master of Science degree in finance from Louisiana State University. Mr. Borden holds both the Chartered Financial Analyst and Chartered Alternative Investment Analyst professional designations. Mr. Borden was selected to serve on our board of directors as a result of his extensive experience in leadership positions, and in particular, his experiences as Chief Executive Officer and Chief Investment Officer at several companies.
217
Table of Contents
Mark Cutis has served as a director of our company since 2011, and is a member of our risk and conflicts committees. Since March 2008, Mr. Cutis has been the Chief Investment Officer for the Global Special Solutions group at Abu Dhabi Investment Council (“ADIC”), a sovereign wealth fund. Prior to ADIC, Mr. Cutis held a number of executive positions with prominent financial institutions including Shinsei Bank in Tokyo, European Bank for Reconstruction and Development in London and Merrill Lynch in New York. Mr. Cutis currently serves on the boards of directors of New Age, an African oil and gas group, Maybrooke Holdings, a property and catastrophe reinsurance company, MidCap FinCo Holdings Limited (“MidCap Holdings”), OilServ, an Iraqi oil service group, Altico Capital India, an Indian non-bank lending company to the residential construction sector and Shiba Daimon Holding, a Japanese commercial real estate operation company. Mr. Cutis has a Bachelor of Arts in economics from Emory University, where he was elected to Phi Beta Kappa and a Master of Business Administration from the Wharton School of Business. Mr. Cutis was selected to serve on our board of directors because of his experience in a broad array of investment activities across a variety of financial institutions ranging from investment banks to commercial banks as well as fund managers and multilateral institutions.
Ahmed Ghubash has served as a director of our company since 2013, and is a member of our compensation and conflicts committees. Mr. Ghubash is Head of European Fund Investments at the Abu Dhabi Investment Authority (“ADIA”), where he has worked since May 1995. He also represents ADIA on the advisory boards of certain funds in Europe. Mr. Ghubash has a Bachelor’s degree from Central State University and a Master of Business Administration from the University of Dayton. Mr. Ghubash was selected to serve on our board of directors as a result of his broad investment experience.
Brian Leach was appointed as a director of our company in August 2016, and is a member of our risk and audit committees. From 2013 to 2015, Mr. Leach served as Head of Franchise Risk & Strategy at Citigroup with responsibility for managing all of Citibank’s global risk, audit, compliance and strategy. From 2008 to 2012, Mr. Leach served as the Chief Risk Officer of Citibank. In 2005, Mr. Leach, together with several former colleagues from Morgan Stanley, formed Old Lane and from 2005 to 2008, Mr. Leach served as Old Lane’s co-Chief Operating Officer and Chief Risk Officer. Prior to that, Mr. Leach worked his entire post-graduate career at Morgan Stanley encompassing running a successful proprietary trading business and culminating as the Risk Manager of the Institutional Securities Business reporting directly to its President. During his time with Morgan Stanley, Mr. Leach was seconded to Long-Term Capital Management (“LTCM”) for approximately one year. During that time, he was one of six managers selected by a consortium of 14 global financial institutions to manage the liquidation of LTCM. Mr. Leach has a Bachelor of Arts degree in economics from Brown University and a Master of Business Administration from Harvard Business School. Mr. Leach has been awarded Risk Manager of the Year on two separate occasions: the first by Risk Magazine for his work in restructuring the hedge fund LTCM and the second by the Global Association of Risk Professionals for his work in restructuring Citigroup after the global financial crisis. Mr. Leach was selected to serve on our board of directors as a result of his extensive experience in risk management.
Gernot Lohr has served as a director of our company and our subsidiary, ALRe, since 2009. Mr. Lohr has served as a director of AAM, our investment manager, since 2009. Mr. Lohr is a Senior Partner at Apollo, which he joined in May 2007. Prior to joining Apollo, Mr. Lohr was a founding partner at Infinity Point LLC, Apollo’s joint venture partner for the financial services industry since 2005. Before that time, Mr. Lohr spent eight years in financial services investment banking at Goldman, Sachs & Co. in New York and also worked at McKinsey & Company and B. Metzler Corporate Finance in Frankfurt. Currently, Mr. Lohr serves on the board of directors of the general partner of AAA, AAA MIP Limited, Amissima Assicurazioni (formerly Carige Assicurazioni), Bremer Kreditbank Aktiengesellschaft, Catalina Holdings, Nova Kreditna Banka Maribor, KBS Banka and Tranquilidade. Mr. Lohr has a joint Master’s Degree in economics and engineering from the University of Karlsruhe, Germany, and received a Master of Business Administration from the MIT Sloan School of Management. Mr. Lohr was selected to serve on our board of directors as a result of his extensive experience in the financial services sector.
H. Carl McCall was appointed as a director of our company in August 2016, and is a member of our nominating and corporate governance and compensation committees. Since October 2011, Mr. McCall has
218
Table of Contents
served as the Chairman of the Board of Trustees of the State University of New York. From 2002 to 2015, Mr. McCall served as a board member or trustee of several organizations, including Ariel Investment, Tyco International, New Plan Realty Corporation and the New York Stock Exchange. From 2004, Mr. McCall served as a principal of Covenant Capital, LLC. From 1993 to 2002, Mr. McCall served as the Comptroller of the State of New York. From 1991 to 1993, Mr. McCall served as the President of the New York City Board of Education. From 1986 to 1991, Mr. McCall served as Commissioner of the Port Authority of New York and New Jersey. From 1985 to 1993, Mr. McCall served as a Vice President of Citicorp, Inc. From 1975 to 1980, Mr. McCall served as a state senator of New York. From 1973 to 1975, Mr. McCall served as executive director of the Florence and John Schuman Foundation. Mr. McCall received a Bachelor of Arts degree in government from Dartmouth College and a Masters of Arts from Andover Newton Theological Seminary. Mr. McCall was selected to serve on our board of directors as a result of his extensive leadership experience in various sectors, and his experience serving on the boards of a number public and private companies.
Matthew R. Michelini has served as a director of our company and certain of our subsidiaries since 2010, and is a member of our executive, nominating and corporate governance and risk committees. Mr. Michelini serves as a director of AAM, our investment manager. Mr. Michelini is a Partner at Apollo. He joined Apollo in 2006. Mr. Michelini serves on the board of directors of Aleris Corporation and Warrior Met Coal and previously served on the boards of Metals USA Holdings (formerly NYSE listed under “MUSA”) and Noranda Aluminum Holding Corporation (formerly NYSE listed under “NOR”). At Apollo, Mr. Michelini has executed deals across the world including in North America, Europe, and Asia. Prior to joining Apollo, Mr. Michelini was a member of the Mergers & Acquisitions group at Lazard Frères & Co., from 2004 to 2006. Mr. Michelini is actively involved in various charities dedicated to helping underprivileged children in New York City. Mr. Michelini graduated from Princeton University with a Bachelor of Science degree in mathematics and a Certificate in Finance and received his Master of Business Administration from Columbia University. Mr. Michelini was selected to serve on our board of directors as a result of his extensive experience in the financial services sector.
Jerome Mourgue d’Algue has served as a director of our company since 2013, and is a member of our risk committee. Mr. Mourgue d’Algue is a senior portfolio manager in the principal investment group of ADIA’s Private Equities Department, which he joined in June 2012. Prior to joining ADIA, he was a partner at Englefield Capital LLP, a London-based private equity firm, for nine years, a Vice President at Morgan Stanley Capital Partners, and also worked at McKinsey & Co. and in the insurance business of AXA Group. Mr. Mourgue d’Algue has a Bachelor of Arts in business and administration from ESSEC (France) and a Master of Business Administration from the Wharton School of Business. Mr. Mourgue d’Algue was selected to serve on our board of directors as a result of his extensive experience in the financial services sector.
Dr. Manfred Puffer has served as a director of our company since 2012, and is the chair of our risk committee. Dr. Puffer has served as a Senior Advisor to Apollo since October 2008. From 2006 to 2008, Dr. Puffer was a senior managing director in the Financial Institutions Group of Bear Stearns International, Head of Germany, Austria and Eastern Europe and a Member of the European Executive Committee. From 2002 to 2005, Dr. Puffer was a member of the managing board of WestLB AG and Head of the Investment Bank, Fixed Income, Equities and Structured Finance. Currently, Dr. Puffer is a member of the supervisory board of Infineon Technologies AG. Dr. Puffer holds a Ph.D. and a Master of Business Administration from the University of Vienna. Dr. Puffer was selected to serve on our board of directors as a result of his extensive experience in the financial services sector.
Marc Rowan has served as a director of our company since 2009, and is a member of our executive and compensation committees. Mr. Rowan has served as a director of AAM, our investment manager, since 2009. Mr. Rowan is a co-founder and Senior Managing Director of Apollo, a leading alternative asset manager focused on contrarian and value oriented investments across private equity, credit-oriented capital markets and real estate. Mr. Rowan currently serves on the boards of directors of, among others, Apollo, CEC and Caesars Acquisition Company. He has previously served on the boards of directors of, among others, the general partner of AAA, AMC Entertainment, Inc., Beats Music, CableCom Gmbh., Caesars Entertainment Operating Co., Countrywide
219
Table of Contents
PLC, Culligan Water Technologies, Inc., Furniture Brands International, Mobile Satellite Ventures, National Cinemedia, Inc., National Financial Partners, Inc., New World Communications, Inc., Norwegian Cruise Lines, Quality Distribution, Inc., Samsonite Corporation, SkyTerra Communications, Inc., Unity Media SCA, Vail Resorts, Inc., Wyndham International, Inc. and RCS Capital Corporation. Mr. Rowan is a founding member and Chairman of YRF-Darca, Vice Chair of the Board of Overseers of The Wharton School at the University of Pennsylvania and a member of the University of Pennsylvania’s Board of Trustees. He serves on the boards of directors of Jerusalem Online and the New York City Police Foundation. Mr. Rowan graduated summa cum laude from the University of Pennsylvania’s Wharton School of Business with a Bachelor of Science and a Master of Business Administration in finance. Mr. Rowan was selected to serve on our board of directors as a result of his service on the boards of numerous public and private companies and his demonstrated track record of success and extensive experience in the financial services sector.
Lawrence J. Ruisi has served as a director of our company since 2013, and is the chair of our audit committee and is a member of our risk committee. As an operating executive, Mr. Ruisi has held various senior level positions in the entertainment business, including President & Chief Executive Officer of Loews Cineplex Entertainment Corporation, a movie theatre operator with 400 locations worldwide, and as Executive Vice President and Chief Financial Officer of Columbia Pictures Entertainment. As a non-executive, Mr. Ruisi has served on numerous boards including Hughes Communications Inc., UST Inc., InnKeepers USA Trust, Wyndham International, Inc. and Adaptec, Inc. During his tenure on these boards, Mr. Ruisi has been Chairman of various audit committees, named designated financial expert and served on both compensation and nominating and corporate governance committees. Mr. Ruisi was Chairman of the Independent Committee of the board of InnKeepers, which oversaw its restructuring, and was Chairman of Special Committees at both Wyndham and Adaptec. Mr. Ruisi began his career at Price Waterhouse & Co., where he was a Senior Manager. He is a Certified Public Accountant and received a Bachelor of Science degree in accounting and a Master of Business Administration in finance from St. John’s University. Mr. Ruisi is currently an adjunct professor of accounting at St. John’s University. Mr. Ruisi was selected to serve on our board of directors as a result of his extensive leadership experience in various sectors, his expertise in accounting and financial reporting matters and his experience serving on the boards of numerous public and private companies.
Imran Siddiqui has served as a director of our company and certain of our subsidiaries since 2009, is the chair of our compensation committee and is a member of our executive, audit and risk committees. Mr. Siddiqui serves as a director of AAM, our investment manager. Mr. Siddiqui is a Senior Partner at Apollo, which he joined in 2008. Prior to that time, Mr. Siddiqui was a principal in Oak Hill Capital’s Business and Financial Services Group. Prior to Oak Hill, Mr. Siddiqui spent six years in the Financial Institutions Group of Goldman, Sachs & Co., and worked as a consultant at McKinsey & Company from 1997 to 1999. Mr. Siddiqui currently serves on the boards of the general partner of AAA, Aris Holdco and MidCap Holdings. In addition, Mr. Siddiqui is on the College Visiting Committee at the University of Chicago. Mr. Siddiqui has a Bachelor of Arts degree in political science and a Master of Arts in international relations from the University of Chicago and a Juris Doctor from Harvard Law School. Mr. Siddiqui was selected to serve on our board of directors as a result of his extensive experience in the financial services sector.
Hope Schefler Taitz has served as a director of our company and our subsidiary, ALRe, since 2011, is the chair of our nominating and corporate governance committee and is a member of our audit and conflicts committees. Ms. Taitz also serves as an independent director of AADE. Ms. Taitz is also a director of Athene USA, AAIA, ALICNY and AANY, and also serves on the audit committee for AANY. Since 2004, Ms. Taitz has acted as a consultant focused on analyzing and investing in the consumer industry in both early and late stage. Ms. Taitz currently serves on the board of MidCap Holdings. From 1995 to 2003, Ms. Taitz was Managing Partner of Catalyst Partners, L.P., a money management firm. From 1990 to 1992, Ms. Taitz was a Vice President at The Argosy Group (now part of the Canadian Imperial Bank of Commerce (NYSE: CM)) specializing in financial restructuring before becoming a Managing Director at Crystal Asset Management, from 1992 to 1995. From 1986 to 1990, Ms. Taitz was at Drexel Burnham Lambert, first as a mergers and acquisitions analyst and then as an associate in the leveraged buyout group. She is a founding executive member of Youth
220
Table of Contents
Renewal Fund, a current executive board member of Pencils of Promise and a member of the undergraduate executive board of The Wharton School at the University of Pennsylvania. Ms. Taitz is a former board member of Girls Who Code and is now a board member of the New York City Foundation for Computer Science and also sits on the board of The Wharton School of the University of Pennsylvania. Ms. Taitz graduated with honors from the University of Pennsylvania with a Bachelor of Arts degree in economics. Ms. Taitz was selected to serve on our board of directors as a result of her extensive experience in the financial services sector as well as her experience serving on the governance committees of other public companies.
Arthur Wrubel was appointed as a director of our company in August 2016, and is a member of our nominating and corporate governance and compensation committees. In 2001, Mr. Wrubel formed Wesley Capital Management, a long/short investment fund focused on real estate securities. Since its inception, Wesley Capital has been among the largest investment funds in the real estate securities sector. In 1993, Mr. Wrubel joined Dickstein & Co., a bankruptcy and event-driven investment fund as a partner. His focus was on real estate and asset backed securities. At Dickstein, Mr. Wrubel was involved in many high profile real estate corporate restructurings including Olympia & York, Cadillac Fairview, Rockefeller Center Properties, Bramalea, and Trizec. Mr. Wrubel began his career in 1987 at JMB Realty Corporation, where he was an associate in the acquisitions group. Mr. Wrubel currently serves as a member of the Wharton Undergraduate Board at the University of Pennsylvania. Mr. Wrubel received a Bachelor of Science in economics from The Wharton School at the University of Pennsylvania. Mr. Wrubel was selected to serve on our board of directors as a result of his extensive experience in the financial services sector.
Corporate Governance
Our business and affairs are managed under the direction of our board of directors. Our board of directors currently consists of 16 members. Six of our directors are employees of or consultants to Apollo or its affiliates (including Mr. Belardi, our Chairman, Chief Executive Officer and Chief Investment Officer, who is also Chairman, Chief Executive Officer and Chief Investment Officer of AAM).
Under our bye-laws, our board of directors will consist of not less than two and not more than 17 directors. If there is a vacancy on our board of directors due to death, disability, disqualification, removal or resignation, or there is an increase in the number of our directors or a failure to elect a director at a shareholder meeting, the board of directors may appoint any person as a member of the board of directors on an interim basis until the next annual general meeting provided that such person has been approved by a majority of the nominating and corporate governance committee. At the next annual general meeting, the vacancy will be put to a shareholder vote. Persons appointed by the board of directors to fill vacancies must be approved by a majority of the board of directors.
Classified Board of Directors
Our bye-laws provide for our board of directors to be divided into three classes with members of each class serving staggered three-year terms. Only one class of directors will be elected at each annual general meeting of shareholders, with directors in other classes continuing for the remainder of their respective three-year terms. Our current directors are divided among the three classes as follows:
| • | our Class I directors are Messrs. Belardi, Michelini, Leach, Lohr, Rowan and Cutis and, except as provided below with respect to Mr. Leach, their terms will expire at our annual general meeting to be held in 2019; |
| • | our Class II directors are Messrs. Siddiqui, Ghubash, Wrubel, Ruisi and Ms. Taitz and, except as provided below with respect to Mr. Wrubel, their terms will expire at our annual general meeting to be held in 2017; and |
| • | our Class III directors are Messrs. Borden, McCall, Mourgue d’Algue and Beilinson and Dr. Puffer and, except as provided below with respect to Mr. McCall, their terms will expire at our annual general meeting to be held in 2018. |
221
Table of Contents
Messrs. Wrubel, Leach and McCall have been appointed to the board of directors subject to being nominated and elected by shareholders at the next annual general meeting to take place in 2017. If elected at that meeting, Mr. Wrubel will be a Class II director whose term will expire at our annual general meeting to be held in 2020, Mr. Leach will be a Class I director whose term will expire at our annual general meeting to be held in 2019 and Mr. McCall will be a Class III director whose term will expire at our annual general meeting to be held in 2018.
Our directors hold office until their successors have been elected and qualified or until the earlier of their death, resignation or removal. Any additional directorships resulting from an increase in the number of directors will be distributed among the three classes so that, as nearly as possible, each class will consist of one-third of the directors.
The classification of our board of directors may have the effect of delaying or preventing changes of control of our company.
Director Independence
Our board of directors has undertaken a review of the independence of each director. Based on information provided by each director concerning his or her background, employment and affiliations, our board of directors has determined that Messrs. Beilinson, Borden, Cutis, Ghubash, McCall, Mourgue d’Algue, Ruisi, Wrubel, Leach and Ms. Taitz do not have a relationship that would interfere with the exercise of independent judgment in carrying out the responsibilities of a director and that each of these directors meet the independence requirements of the NYSE listing rules. In making these determinations, our board of directors considered the current and prior relationships that each non-employee director and non-Apollo director has with our company and all other facts and circumstances our board of directors deemed relevant in determining their independence, including the beneficial ownership of our common shares by such director and any transactions involving them described under “Certain Relationships and Related Party Transactions.”
Lead Independent Director
On October 26, 2016, the board of directors elected Ms. Taitz to the newly-created position of Lead Independent Director, effective immediately. In this new role, Ms. Taitz will, among other things, preside at executive sessions of the independent directors, serve as liaison between the chairman and the independent directors, approve board meetings schedules and agendas, approve information sent to the board and be authorized to call meetings of the independent directors.
Committees of the Board of Directors
Our board of directors has the authority to appoint committees to perform certain management and administration functions. Our board of directors has six standing committees: Audit, Compensation, Nominating and Corporate Governance, Conflicts, Executive and Risk. The table below shows the membership for each of the board of directors’ standing committees.
| Audit Committee |
Compensation |
Conflicts Committee | ||
| Lawrence J. Ruisi (Chair)* | Imran Siddiqui (Chair) | Marc Beilinson* | ||
| Hope Taitz* | Marc Beilinson* | Robert Borden* | ||
| Imran Siddiqui | Ahmed Ghubash* | Mark Cutis* | ||
| Brian Leach* | Marc Rowan |
Hope Taitz* | ||
| H. Carl McCall* |
Ahmed Ghubash* | |||
| Arthur Wrubel* |
222
Table of Contents
| Executive Committee |
Nominating and Corporate Governance Committee |
Risk Committee | ||
| James R. Belardi | Hope Taitz (Chair)* | Manfred Puffer (Chair) | ||
| Marc Rowan | Matthew Michelini | Imran Siddiqui | ||
| Imran Siddiqui | Arthur Wrubel* | Mark Cutis* | ||
| Matthew Michelini | H. Carl McCall* | Robert Borden* | ||
| Jerome Mourgue D’Algue* | ||||
| Matthew Michelini | ||||
| Lawrence J. Ruisi* | ||||
| Brian Leach* |
| * | Independent director for purposes of the NYSE corporate governance listing requirements. |
Audit Committee
The audit committee’s duties include, but are not limited to, assisting the board of directors with its oversight and monitoring responsibilities regarding:
| • | the integrity of the company’s consolidated financial statements and financial and accounting processes; |
| • | compliance with the audit, internal accounting and internal controls requirements by AHL and its subsidiaries; |
| • | the independent auditor’s qualifications, independence and performance; |
| • | related party transactions other than transactions between AHL and its subsidiaries and Apollo and its affiliates (other than AHL and its subsidiaries) and other related party transactions ancillary thereto that are required to be reviewed by the conflicts committee or by the disinterested directors on our board of directors as described under “—Conflicts Committee” below, or are expressly exempt from such review under our internal policies; |
| • | the performance of the internal accounting and financial controls of the company and its subsidiaries (including monitoring and reporting by subsidiaries) and the function of the internal audit departments of the company and its subsidiaries; |
| • | the company’s legal and regulatory compliance and ethical standards; and |
| • | procedures to receive, retain and treat complaints regarding accounts, internal accounting controls or auditing matters and to receive confidential and anonymous submission by employees of concerns regarding questionable accounting or auditing matters. |
Members of our audit committee also review the company’s financial disclosure and public filings.
Our audit committee is currently comprised of Messrs. Leach, Ruisi and Siddiqui and Ms. Taitz. Mr. Ruisi is the chair of the audit committee. Messrs. Ruisi, Leach and Ms. Taitz each meet the independence requirements of the NYSE rules. We will rely on the phase-in rules of the SEC with respect to the independence of our audit committee under Rule 10A-3(b)(1) of the Exchange Act and the rules of the NYSE. These rules require that at least a majority of the members of our audit committee be independent within 90 days of the effectiveness of the registration statement of which this prospectus forms a part and all members be independent within one year. Each member of our audit committee meets the requirements for financial literacy under the applicable rules and regulations of the SEC and the NYSE. The chair of our audit committee, Mr. Ruisi, is an independent director and an “audit committee financial expert” as that term is defined in the rules and regulations of the SEC. Our board of directors has approved a written charter under which the audit committee will operate. Upon the effectiveness of the registration statement of which this prospectus forms a part, a copy of the charter of our audit committee will be available on our principal corporate website at www.athene.com. Information contained on our website or connected thereto does not constitute a part of, and is not incorporated by reference into, this prospectus or the registration statement of which it forms a part.
223
Table of Contents
Nominating and Corporate Governance Committee
The purposes of the nominating and corporate governance committee are to:
| • | identify, evaluate and recommend individuals qualified to become members of our board of directors or the boards of directors of material operating subsidiaries of the company (each, a “Subsidiary Board”), consistent with criteria approved by our board of directors or Subsidiary Boards, as applicable; |
| • | select, or recommend that our board of directors or any Subsidiary Board select, the director nominees to stand for election at each annual general meeting of shareholders of the company or any subsidiary or to fill vacancies on our board of directors or any Subsidiary Board, as applicable; |
| • | develop and recommend to our board of directors a set of corporate governance guidelines applicable to the company and its subsidiaries; and |
| • | oversee the annual performance evaluation of our board of directors and the Subsidiary Boards and each of their respective committees and management. |
The nominating and corporate governance committee also recommends directors eligible to serve on all committees of our board of directors and committees of the Subsidiary Boards, as applicable. The nominating and corporate governance committee also reviews and evaluates, in accordance with our bye-laws, all shareholder director nominees.
Our nominating and corporate governance committee is comprised of Messrs. McCall, Michelini and Wrubel and Ms. Taitz. Ms. Taitz is the chair of the nominating and governance committee. Currently, Messrs. McCall and Wrubel and Ms. Taitz meet the independence requirements of the NYSE rules. Not later than the first anniversary of the effectiveness of the registration statement of which this prospectus forms a part, all members of our nominating and corporate governance committee will be independent directors. Upon the effectiveness of the registration statement of which this prospectus forms a part, a copy of the charter of our nominating and corporate governance committee will be available on our principal corporate website at www.athene.com. Information contained on our website or connected thereto does not constitute a part of, and is not incorporated by reference into, this prospectus or the registration statement of which it forms a part.
Compensation Committee
The purposes of the compensation committee are generally to:
| • | review and approve annually corporate goals and objectives, including financial and other performance targets, relevant to Chief Executive Officer and executive officer compensation; |
| • | review and approve annually corporate goals and objectives, including financial and other performance targets, relevant to compensation paid to the other executive officers and key employees of the company and its subsidiaries; |
| • | review, approve and, when necessary, make recommendations to the board of directors regarding the company’s compensation plans, including with respect to incentive compensation plans and share-based plans, policies and programs; |
| • | review and administer the company’s share incentive plans and any other share-based plan and any incentive-based plan of the company and its subsidiaries, including approving grants and/or awards of restricted stock, stock options and other forms of equity-based compensation under any such plans to executive officers; |
| • | review and approve, for the Chief Executive Officer and other executive officers of the company, when and if appropriate, employment agreements, severance agreements, consulting agreements and change in control or termination agreements; |
224
Table of Contents
| • | prepare the compensation committee report required to be included in an annual report or proxy statement, as required by applicable SEC and NYSE rules; |
| • | review periodically the company’s compensation plans, policies and programs to assess whether such policies encourage excessive or inappropriate risk-taking or earnings manipulation; |
| • | review the results of any advisory stockholder votes on executive compensation and consider whether to recommend adjustments to the company’s executive compensation policies and practices as a result of such vote; and |
| • | monitor compliance with stock ownership guidelines for the Chief Executive Officer and other executive officers of the company. |
Our compensation committee is comprised of Messrs. Beilinson, Ghubash, McCall, Rowan, Siddiqui and Wrubel. Mr. Siddiqui is the chair of the compensation committee. Currently, Messrs. Beilinson, Ghubash, McCall and Wrubel meet the independence requirements of the NYSE rules. Not later than the first anniversary of the effectiveness of the registration statement, all members of the compensation committee will be independent. Our board of directors has approved a written charter under which the compensation committee will operate. Upon the effectiveness of the registration statement of which this prospectus forms a part, a copy of the charter of our compensation committee will be available on our principal corporate website at www.athene.com. Information contained on our website or connected thereto does not constitute a part of, and is not incorporated by reference into, this prospectus or the registration statement of which it forms a part.
Conflicts Committee
Because the Apollo Group has a significant voting interest in AHL, and because AHL and its subsidiaries have entered into, and will continue in the future to enter into, transactions with Apollo and its affiliates, our bye-laws require us to maintain a conflicts committee, currently consisting of five directors of the company that are not officers or employees of any member of the Apollo Group and are designated by our board of directors. The conflicts committee meets quarterly and consists of Messrs. Beilinson, Borden, Cutis and Ghubash and Ms. Taitz. The conflicts committee reviews and must approve of certain material transactions by and between AHL and its subsidiaries, on the one hand, and members of the Apollo Group, on the other hand, including any modification or waiver of the IMAs with AAM, subject to certain exceptions. The conflicts committee is also responsible for the review and approval of related party transactions that are incidental or ancillary to the foregoing transactions. For a description of the functions of the conflicts committee and such exceptions, see “Certain Relationships and Related Party Transactions—Related Party Transaction Policy.”
Executive Committee
The executive committee is responsible for facilitating the approval of certain actions that do not require consideration by the full board of directors or that are specifically delegated by the board of directors to the executive committee. The executive committee possesses and may exercise all powers of the board of directors in the management and direction of the company’s business consistent with our bye-laws, applicable law (including any applicable rule of any stock exchange or quotation system on which the company’s common shares are then listed) and the operating guidelines of the company, except that the executive committee shall not perform such functions that are expressly delegated to other committees of the board of directors. The executive committee does not have the power to:
| • | declare dividends on or distributions of or in respect of shares of the company; |
| • | issue shares or authorize or approve the issuance or sale, or contract for sale, of shares or determine the designation and relative rights, preferences and limitations of a series or class of shares unless specifically delegated by action of the board of directors to the executive committee or a subcommittee of the executive committee; |
225
Table of Contents
| • | recommend to shareholders any action that requires shareholder approval; |
| • | recommend to shareholders a dissolution or winding up of the company or a revocation of a dissolution or winding up of the company; |
| • | amend or repeal any provision of the memorandum of association or bye-laws; |
| • | agree to the settlement of any litigation, dispute, investigation or other similar matter with respect to the company that is not within the scope of authority previously delegated to the executive committee by the board of directors; |
| • | approve the sale or lease of real or personal property assets with a fair value greater than a threshold amount specifically delegated to the executive committee by the board of directors; |
| • | authorize mergers (other than a merger of any wholly-owned subsidiary with the company), acquisitions, joint ventures, consolidations or dispositions of assets or any business of the company or any investment in any business or company by the company with a fair value in excess of a threshold amount specifically delegated to the committee by the board of directors; or approve the sale, lease, exchange or encumbrance of any material asset of the company that, in each case, is not within the scope of authority previously delegated to the executive committee by action of the board of directors; or |
| • | amend, alter or repeal, or take any action inconsistent with any resolution or action of the board of directors. |
Our executive committee is comprised of Messrs. Belardi, Michelini, Rowan and Siddiqui.
Risk Committee
The risk committee’s duties are to oversee the development and implementation of systems and processes designed to identify, manage and mitigate reasonably foreseeable material risks to the company; assist our board of directors and our board committees in fulfilling their oversight responsibilities for the risk management function of the company; approve the stress test assumption and limits utilized in our stress test scenario analyses and engage in such activities as it deems necessary or appropriate in connection with the foregoing. In assessing risk, the risk committee must assess the risk of the company and its subsidiaries as a whole. The risk committee’s role is one of oversight. Management of the company is responsible for developing and implementing the systems and processes designed to identify, manage and mitigate risk. Members of the risk committee are selected for their experience in managing risks in financial and/or insurance enterprises. Our risk committee meets quarterly and is comprised of Messrs. Borden, Cutis, Leach, Michelini, Mourgue d’Algue, Ruisi and Siddiqui and Dr. Puffer. Dr. Puffer is the chair of the risk committee.
Director Compensation
Neither our employee director nor our Apollo directors, other than Dr. Puffer who is not an employee of Apollo but acts as a consultant to Apollo and its affiliates, receive any additional compensation for serving as directors. Additionally, none of Messrs. Cutis, Ghubash or Mourgue D’Algue accept any compensation for serving as directors.
A summary of compensation for our non-employee directors for 2015 is set forth under “Compensation of Executive Officers and Directors—Non-Employee Director Compensation.”
Management Committees
An integral component of our corporate governance structure is our management committees. Management committees report to our senior officers, including our Chief Executive Officer, President, Chief Financial Officer, and Chief Risk Officer and to committees of our board of directors. Management committees are
226
Table of Contents
comprised of members of senior management and are designed to oversee business initiatives and to manage business risk and processes, with each committee focused on a discrete area of our business. The following is a description of certain of our management committees:
| • | Management Executive Committee: oversees all of our strategic initiatives and our overall financial condition. |
| • | Management Risk Committee: oversees overall corporate risk, including credit risk, interest rate risk, equity risk, business risk, operational risk and other risks we confront. The committee reports to the Board of Directors risk committee. |
| • | Operational Risk Committee: a subcommittee of the Management Risk Committee which oversees operational risk, including information security, disaster recovery, trading activities and operational management of our annuity portfolio. |
| • | Asset Liability Committee: focuses on management of our assets and liabilities and monitors material liquidity risks and cash flow testing. The committee reports to the Board of Directors risk committee. |
| • | Management Investment Committee: focuses on strategic decisions involving our investment portfolio, such as approving investment limits, new asset classes and our allocation strategy, reviewing large asset transactions as well as monitoring our credit risk and the management of our assets and liabilities. The committee reports to the Board of Directors risk committee. |
Compensation Committee Interlocks and Insider Participation
For the fiscal year ended December 31, 2015, our compensation committee consisted of Mr. Siddiqui and Mr. Rowan as well as two independent members, Messrs. Beilinson and Ghubash.
None of our executive officers currently serves, or has served during the last completed fiscal year, as a member of the board of directors or compensation committee of any entity that has an executive officer serving as a member of our compensation committee or as a director on our board of directors.
Code of Ethics
We have adopted a code of business conduct and ethics applicable to our principal executive, financial and accounting officers and all persons performing similar functions. Upon the effectiveness of the registration statement of which this prospectus forms a part, our code of ethics will be available on our principal corporate website at www.athene.com. Information contained on our website or connected thereto does not constitute a part of, and is not incorporated by reference into, this prospectus or the registration statement of which it forms a part.
227
Table of Contents
COMPENSATION OF EXECUTIVE OFFICERS AND DIRECTORS
Compensation Discussion and Analysis
Introduction
Our named executive officers (“NEOs”), comprised of our principal executive and financial officers (including former principal financial officers) and the next three highest paid executive officers, are James R. Belardi, Chairman, Chief Executive Officer and Chief Investment Officer; William J. Wheeler, President; Grant Kvalheim, Chief Executive Officer, Athene USA; Martin P. Klein, Executive Vice President and Chief Financial Officer; Stephen E. Cernich, former Executive Vice President, Corporate Development; Guy H. (“Chip”) Smith, III, President, Athene USA, and former interim Chief Financial Officer; and Brenda Cushing, former Chief Financial Officer.
Compensation Framework
Goals, Principles and Process
Our compensation committee believes that our executive compensation program should reward actions and behaviors that ensure policyholder protection, drive long-term, profitable revenue growth, and create sustainable shareholder value. The compensation committee has sought to foster these objectives through a compensation system that focuses on increasing our executives’ personal interest in our growth and success through performance-based annual incentive awards and ownership of our Class A common shares and our Class M-1, Class M-2, Class M-3 and Class M-4 common shares (collectively, “Class M common shares”). We believe that these awards create a balanced focus on our short-term and long-term strategic and financial goals. The following principles provide a framework for the company’s executive compensation program:
| • | attract, retain and motivate high-performing talent; |
| • | reward outstanding performance; |
| • | directly align executive compensation elements with both short-term and long-term company performance; and |
| • | align the interests of our executives with those of our stakeholders. |
Our compensation committee has the responsibility for overseeing and approving the compensation of all of our executive officers. Our compensation committee uses industry data to assess the competitiveness of our compensation elements for our NEOs and other executive officers, and they also receive recommendations from Mr. Belardi regarding the compensation arrangements for executive officers other than himself. None of our NEOs participated in the determination of their own compensation.
2015 Compensation Elements
2015 was a year of transition for Athene. In addition to growing our retail, flow reinsurance and institutional products businesses, our senior executives were required to expend a great amount of their time and efforts on continuing to integrate the Aviva USA acquisition; remediating material weaknesses in our internal control over financial reporting and returning Athene to timely reporting; and continuing the reinvestment of assets from the Aviva USA acquisition. We also recruited two new senior executives to the management team: William J. Wheeler and Martin P. Klein.
The following summarizes the compensation elements used in 2015 to attract, reward and retain our NEOs.
Base Salary
Base salaries for our NEOs are determined annually, based on a number of factors, including the size, scope and impact of their role, the market value associated with their role, leadership skills and values, length of service, and individual performance and contributions.
228
Table of Contents
Annual Incentive Awards
As further discussed below in “—2015 Compensation Decisions,” we grant annual incentive awards to our NEOs based on the achievement of financial, operational and personal objectives. In general, these objectives are communicated to our NEOs at the beginning of the year, and the compensation committee determines the amount of the awards after the completion of the performance period. As 2015 was the first year in which the compensation committee adopted an incentive framework for our NEOs, 2015’s objectives were communicated to our NEOs in the middle of 2015, and the committee determined the amounts of the incentive awards in December 2015, based on projections for full-year 2015 financial and other results and, in the case of Mr. Belardi, on performance through September 30, 2015 with respect to the two additional performance objectives specific to him.
Employees earning more than $250,000 in base salary and annual incentive awards, which include all of our NEOs, received a portion of their 2015 annual incentive awards in restricted Class A common shares, with the amount of equity granted based on a percentage of each NEO’s total base salary and annual incentive award. Specifically, for 2015 awards, the percentage of total compensation (base salary plus annual incentive award) to be taken in equity generally was based on the following tiers: 10% in equity from $0 to $500K of total compensation; 20% in equity for the next $500K to $1M of total compensation; 25% in equity for the next $1M to $2M of total compensation; and 30% in equity for total compensation in excess of $2M. For Mr. Belardi, however, the compensation committee determined that 100% of his annual incentive award would be granted in the form of restricted Class A common shares. One-third of these shares vested on January 1, 2016, with the remainder scheduled to vest ratably on January 1, 2017 and January 1, 2018.
In general, unvested Class A common shares will not continue to vest following termination, but in any particular case, the compensation committee may determine that unvested shares should vest immediately upon termination or continue to vest following resignation with good reason, termination without cause, death, disability or retirement. Following the initial public offering, the company will have the right to repurchase certain of such NEO’s vested Class A common shares that remain subject to a lock-up at a price equal to the volume weighted average closing trading price of a Class A common share during the 60-business day trading period preceding the date of notice of repurchase.
Athene Equity Awards
In general, Athene’s equity compensation program is designed to recognize scope of responsibilities, reward demonstrated performance and leadership, align the interests of award recipients with those of Athene’s shareholders and retain award recipients. Important factors in determining the amount of equity grants awarded to each NEO include the size of past grant amounts, individual performance and expected future contributions to Athene.
In association with and following each of the four rounds of capital raise transactions undertaken since our inception, we have granted restricted Class M common shares to our officers and certain other employees to align their incentives with shareholders. Class M common shares are non-voting incentive compensation shares, convertible into Class A common shares upon vesting and the payment of the conversion price. In the tables that follow, we report these equity share awards as options, rather than shares, because they economically represent a call option on Class A common shares with a strike price equal to the conversion price embedded in the Class M common shares. Unlike options, however, in general, once the Class M common shares vest, they can remain outstanding in perpetuity, are not required to be converted into Class A common shares and are entitled to dividends.
There are four outstanding classes of Class M common shares. Because these shares historically have been issued in association with rounds of equity raising, the conversion price for each class of Class M common shares
229
Table of Contents
is the fair value of a Class A common share at the time of the round with which the class of Class M common shares is associated.
| Equity Round |
Date of Equity Round |
Amount of Equity Raised |
Value of Class A Common Share at Offering |
Associated Class M Common Shares |
Conversion (Strike) Price | |||||||||
| Round 1 |
2009 | ~$400 million | $10.00 | Class M-1 | $10.00 | |||||||||
| Round 2 |
2011 | ~$325 million | $10.78 | Class M-2 | $10.78 | |||||||||
| Round 3 |
2012 | ~$600 million | $13.46 | Class M-3 | $13.46 | |||||||||
| Round 4 |
2014 | ~$1,300 million | $26.00 | Class M-4 | $26.00 | |||||||||
Grants of restricted Class M common shares are comprised of two tranches, one involving time-based vesting criteria and the other involving performance-based vesting criteria.
In the time-based vesting tranche, the restricted shares generally vest ratably on each of the first five anniversaries of the date of grant and automatically in full upon our sale or a change in control. In some instances, the vesting inception date is tied to other events, such as the recipient’s date of hire or the closing of the equity round with which the Class M common shares are associated, which are earlier than the actual grant date for the award. In such instances, the grant date fair value of the share award takes into account the extent to which time had accrued toward the award’s time-based vesting period when it was granted.
In the performance-based vesting tranche, the restricted shares generally vest based on the achievement by our pre-initial public offering investors of specified IRR and on multiples of invested capital (“MOIC”) on their Class A common shares and Class B common shares purchased in the pre-initial public offering rounds of equity-raising. IRR measures the profitability of an investment over time, whereas MOIC measures capital returned to a shareholder as a multiple of such shareholder’s initial investment, irrespective of when the investment is returned. Class M performance-based shares generally vest based on achieving a combination of both the IRR and MOIC hurdles. Specifically, with the exception of the Class M-4 and Class M-4 Prime performance-based shares (as defined below), 25% of Class M performance-based shares will vest based on the achievement of both a 15% IRR and a 2.0x MOIC (the “Vesting Floor”), and all Class M performance-based shares will vest based on the achievement of both a 20% IRR and a 2.25x MOIC (the “Vesting Ceiling”). For each class of Class M common shares, the calculation of IRR and MOIC hurdles will be based on the conversion price for each such class, which is the fair market value of a Class A common share in the equity round with which the particular class of Class M common shares is associated. The achievement of hurdles between the Vesting Floor and the Vesting Ceiling will result in vesting on an interpolated basis. If shareholder returns result in IRR being less than 15% or MOIC being less than 2.0x, then none of the Class M performance-based shares vest. Notwithstanding the above, with respect to the Class M-4 performance-based shares (other than Class M-4 Prime performance-based shares), until the Final Lock-Up End Date (as defined below), only the IRR hurdle applies. In other words, Class M-4 performance-based shares (other than Class M-4 Prime performance-based shares) may vest prior to the Final Lock-Up End Date if the IRR hurdle is achieved even if the MOIC hurdle has not been achieved. Following such Lock-Up End Date both the IRR and MOIC hurdles must be achieved.
Prior to the initial public offering, Class M performance-based shares have been able to vest only by virtue of realized sales by Class A investors or through an action by the Compensation Committee of our Board of Directors. A portion of the Class M-1 performance-based shares were fully vested in connection with a sale by a Round 1 investor. The remainder of the Class M-1 performance-based shares and all of the Class M-2 and Class M-3 performance-based shares were fully vested by the Compensation Committee as described below.
From and after the initial public offering, Class M performance-based shares may vest based on the trading price of the Class A common shares achieving the applicable IRR and MOIC hurdles on a “mark-to-market” basis (whether the trading price on defined dates relative to the purchase prices paid by the investors in the equity
230
Table of Contents
rounds result in the achievement of the IRR and MOIC hurdles for pre-initial public offering investors). The tests for vesting will initially occur based on the rolling off of the lock-up periods and on a monthly basis thereafter. Specifically, at the end of 7.5 months following the date of the initial public offering (the “First Lock-Up End Date”), one-third of the unvested Class M performance-based shares will be eligible for vesting and tested; at the end of 12 months following the date of the initial public offering (the “Second Lock-Up End Date”), two-thirds of the unvested Class M performance-based shares will be eligible for vesting and tested; and at the end of 15 months following the date of the initial public offering (the “Final Lock-Up End Date,” and together with the First Lock-Up End Date and the Second Lock-Up Date, each a “Lock-Up End Date”), and on a monthly basis thereafter, all of the unvested Class M performance-based shares will be eligible for vesting and tested. Class M-1 and M-2 performance-based shares have ten years from the date of grant to vest; Class M-3 performance-based shares have three years from the Lock-Up End Date to vest; and Class M-4 performance-based shares have four years from the Lock-Up End Date to vest.
When we recruited Messrs. Wheeler and Klein in the second half of 2015, recognizing the proximity of their hires to our initial public offering, we granted them Class M-4 common shares that are more heavily weighted in the performance-based tranche and have performance-based vesting conditions based on stock price targets, as opposed to IRR and MOIC hurdles (the “Class M-4 Prime” common shares). Specifically, two-thirds of the Class M-4 Prime common shares are performance based (rather than one-half of the regular Class M-4 common shares), with the remaining one-third Class M-4 Prime common shares being time-based (rather than one-half of the regular Class M-4 common shares). The Class M-4 Prime time-based shares will vest ratably in equal installments on the first, second, third, fourth and fifth anniversaries of the grant date. One-half of the Class M-4 Prime performance-based shares will vest when Class A common shares have attained a per share volume weighted average closing trading price of $50 or more during any 120-day period, or upon a sale or change in control in which Class A common shares are valued at $50 or more; and the other half will vest when Class A common shares have attained a per share volume weighted average closing trading price of $70 or more during any 120-day period, or upon a sale or change in control in which Class A common shares are valued at $70 or more. Any unvested Class M-4 Prime performance-based shares that have not vested within ten years from the date of grant will be forfeited to the company.
We do not anticipate issuing any Class M common shares after our initial public offering.
In September 2016, as approved by the compensation committee, we modified the outstanding Class M-1, M-2 and M-3 share agreements to vest all performance-based Class M-1, M-2 and M-3 shares, given that the vesting of the shares in the near future was probable in view of the potential consummation of this offering. We also amended the conversion option for these classes, which previously allowed conversion of vested shares only subsequent to an initial public offering (an “IPO”). Under the modified conversion terms, individuals can elect one of three options, including conversion at a specified date prior to an IPO, on the date of an IPO, or ratably each month for six months after an IPO. The modifications affected 27 individuals, including some of our NEOs.
For a discussion of the terms of the classes of common shares, see “Description of Share Capital” and “—Share Incentive Plans.”
Other Compensation Practices
Employment Agreements
In 2015, we had employment agreements with Messrs. Belardi, Wheeler and Klein. In 2016, we entered into an employment agreement with Mr. Kvalheim.
Belardi Agreement
As Mr. Belardi also serves as AAM’s Chairman, Chief Executive Officer and Chief Investment Officer, he has separate employment agreements with both the company and with AAM. Under these agreements,
231
Table of Contents
Mr. Belardi is entitled to receive a base salary and is eligible to receive an incentive award each fiscal year during the term of employment. For 2015, AAM and the compensation committee of AHL consulted with each other to determine Mr. Belardi’s total base salary, incentive award targets and actual incentive awards. Pursuant to an understanding between AHL and AAM, AHL has agreed that AHL is responsible for paying half of his total base salary and half of his total incentive award, and AAM agreed to be responsible for paying the remaining amount. Either party, at its sole discretion, may pay its portion of the incentive award in the form of cash or equity. The target incentive award is 100% of Mr. Belardi’s base salary, but the actual incentive award was determined by our compensation committee and AAM’s compensation committee, based on three performance objectives: non-alternative investment performance relative to the Barclays US Aggregate Bond Index; aggregate alternative investment net performance relative to the company’s underwriting target; and corporate performance targets. We report our portion of Mr. Belardi’s total annual salary and incentive award in our Summary Compensation Table.
Mr. Belardi’s employment agreement with us has a three year initial term expiring on November 3, 2016 and automatically extends for subsequent one year terms unless one party gives notice of non-renewal prior to expiration of the then current term. Pursuant to his employment agreement, severance is payable to Mr. Belardi in the event of a termination of employment by the company without cause, by the company by reason of non-renewal, by Mr. Belardi for good reason, or due to Mr. Belardi’s death or disability. Mr. Belardi is entitled to receive severance payments in an amount equal to the sum of his then-annual base salary and a pro rata incentive award for the year of termination based on the incentive award paid to him in the year preceding his termination. In the event of involuntary termination other than due to death or disability, Mr. Belardi is entitled to receive an additional severance payment equal to the incentive award paid to him in the year preceding the year in which his termination occurs. In the event of involuntary termination other than due to non-renewal by the company, any outstanding and unvested time-based restricted shares that were scheduled to vest during the one-year period following the termination date will immediately vest, and a portion of each tranche of outstanding and unvested Class M performance-based restricted shares shall remain outstanding and eligible to vest pursuant to their terms for a period of 18 months following the termination date. As a condition to his receipt of the severance payments and benefits described above, Mr. Belardi must timely execute (and not revoke) a general release of claims against the company and its affiliates. Mr. Belardi’s employment agreement with the company also contains customary restrictive covenants, including confidentiality and nondisclosure covenants, a covenant not to compete with, or solicit customers of, the company or AAM for 12 months following termination, and a covenant not to solicit employees of the company or AAM for 24 months following termination.
Wheeler Agreement
Pursuant to his employment agreement, Mr. Wheeler is entitled to receive a minimum base salary of $1,250,000 and is eligible to receive an annual incentive award each fiscal year he is employed. His employment is at will and may be terminated by him or by the company at any time by giving two months’ notice. The target incentive award is 200% of Mr. Wheeler’s base salary, but the actual incentive award will be determined by the compensation committee in its sole discretion, based on performance objectives (which may include corporate, financial, strategic, individual or other objectives) established with respect to that particular fiscal year by the compensation committee.
In addition to termination by Mr. Wheeler or the company at any time by giving two months’ notice, the company has the right, in its discretion, to terminate the agreement with a payment in lieu of notice. The company may also terminate the agreement without notice or payment in lieu of notice if Mr. Wheeler is guilty of any gross default or misconduct, or any repeated misconduct after due warning, in connection with the company or in the event of any serious or repeated breach or non-observance with any of the provisions in the agreement. The employment agreement contains customary restrictive covenants, including confidentiality and nondisclosure covenants and covenants not to solicit customers or employees of the company or any affiliate of the company for 12 months following termination.
232
Table of Contents
Klein Agreement
Pursuant to his employment agreement, Mr. Klein is entitled to receive a minimum base salary of $550,000 and is eligible to receive an annual incentive award each fiscal year he is employed. His employment is at will and may be terminated by him or by the company at any time by giving two months’ notice. The target incentive award is 150% of Mr. Klein’s base salary, but the actual incentive award will be determined by the compensation committee in its sole discretion, based on performance objectives (which may include corporate, financial, strategic, individual or other objectives) established with respect to that particular fiscal year by the compensation committee.
In addition to termination by Mr. Klein or the company at any time by giving two months’ notice, the company has the right, in its discretion, to terminate the agreement with a payment in lieu of notice. The company may also terminate the agreement without notice or payment in lieu of notice if Mr. Klein is guilty of any gross default or misconduct, or any repeated misconduct after due warning, in connection with the company or in the event of any serious or repeated breach or non-observance with any of the provisions in the agreement. The employment agreement contains customary restrictive covenants, including confidentiality and nondisclosure covenants and covenants not to solicit customers or employees of the company or any affiliate of the company for 12 months following termination.
Kvalheim Agreement
Pursuant to his employment agreement, for 2016, Mr. Kvalheim is entitled to receive a minimum base salary of $750,000 and is eligible to receive an incentive award each fiscal year he is employed. The target incentive award is 250% of Mr. Kvalheim’s base salary, but the actual incentive award will be determined by the compensation committee in its sole discretion, based on performance objectives (which may include corporate, financial, strategic, individual or other objectives) established with respect to that particular fiscal year by the compensation committee. The agreement terminates following the Final Lock-Up End Date.
Mr. Kvalheim may terminate the agreement at any time by giving 90 days’ notice; provided, however, that if he elects to terminate the agreement for “good reason,” as defined in the 2014 Share Incentive Plan, but including if there are material adverse changes to his incentive award agreements that do not generally and similarly apply to other senior employees, then he must so notify the company within 45 days of the occurrence of the events constituting good reason, and the company has 60 days to cure such events after receipt of such written notice. The company may terminate the agreement at any time for “cause” or in the event of “disability,” as such terms are defined in the 2014 Share Incentive Plan. If the company terminates Mr. Kvalheim’s employment without cause, then the company will pay him a pro rata portion of his target annual incentive award in effect for the year in which the termination occurs.
Stock Ownership Guidelines
We require management at the Senior Vice President level (with certain exceptions) and above, including our Chief Executive Officer, to own significant amounts of our shares. The amount of shares that must be held will be set at a multiple of the individual’s base salary. Covered executives will have five years to satisfy our share ownership requirement.
| Position |
Multiple | |
| Chief Executive Officer/President | 6X | |
| Executive Vice President | 3X | |
| Senior Vice President | 2X |
Purchased and restricted Class A common shares, vested Class A restricted stock units, vested Class M common shares and vested stock options will count toward this requirement, although certain shares may be excluded from the restrictions in the policy. Covered executives must retain at least 75% of all Athene equity holdings until they meet their respective stock ownership requirements.
233
Table of Contents
Anti-Hedging and Anti-Pledging Policies
Covered executives, including all of our executive officers, are not permitted to engage in any transactions that are designed to offset a decrease in the market value of our Class A common shares. In addition, covered executives may not pledge their equity holdings in AHL as collateral if they are counting those holdings towards their respective stock ownership requirements.
Retirement and Other Deferred Compensation Plans
Our NEOs also are currently eligible to participate in the company’s broad-based, tax-qualified savings plan on the same terms and conditions as those made available to employees of the company generally. In addition, NEOs are eligible to participate in our Supplemental Executive Retirement Plan. See “—Athene Supplemental Executive Retirement Plan (“SERP”).”
Review of Compensation Policies and Practices Related to Risk Management
Effective risk management is central to our success, and compensation is carefully designed to be consistent with our risk management framework and controls. If the company’s performance is obtained in a manner inconsistent with this framework or these controls, then the compensation committee has the discretion, with input from the risk committee, if necessary, to decrease or not award any bonuses to our NEOs and other executive officers. In addition, the performance objectives for our Chief Risk Officer and the other employees in our risk management function are based on the effectiveness of our risk management policies and procedures. In 2015, the compensation committee engaged an independent compensation consultant, Towers Watson & Company (“Towers Watson”), to assess our executive compensation program. In its assessment, Towers Watson confirmed that our program is aligned with, and is sensitive to, company performance; and balances risk and reward in a manner that does not encourage imprudent risk-taking.
2015 Compensation Decisions
Our NEOs’ incentive awards in 2015 were based on a combination of five overall financial, operational and personal objectives. The targets were designed to be reasonably achievable, and did not reflect unrealistic stretch targets that may encourage excessive risk-taking, but required the coordinated, cross-functional focus and effort of the executive officers. The payout opportunity for the accomplishment of the performance targets ranged from 0% to 150% of each participant’s target award opportunity.
The first objective, weighted at 25% of the overall award, focused on delivering financial results in line with an A credit rating. The second objective, also weighted at 25% of the overall award, focused on achieving operating model efficiencies. The third objective, also weighted at 25% of the overall award, focused on profitably growing the company’s core business and continuing to support mergers and acquisitions activity. The fourth objective, weighted at 15% of the overall award, focused on completing the preparation necessary to become a public company; and the fifth objective, weighted at 10% of the overall award, focused on continuing to build a cohesive management team.
234
Table of Contents
As noted above, the compensation committee met in December 2015 to evaluate performance and determine the amounts of the 2015 annual incentive awards with respect to these objectives. Their decisions were based on projections of full-year 2015 results. The performance measurements, their respective weightings, projected 2015 achievement with respect to these measurements at the time of determination, and payout level were as follows:
| Metrics Derived from Financial Statements |
||||||||||||||||||||||||
| Objectives | Weight | Measurement | Threshold |
Target (100%) |
Maximum (120%) |
2015 Achievement |
Payout Level |
|||||||||||||||||
| Grow core business and continue to support M&A activities | 25% | Retail sales | $ | 1.92-2.03B | $ | 2.17-2.52B | $ | 2.65-2.76B | $2.85B | 26.3% | ||||||||||||||
| Retail net spread | – | – | – | Exceeded | ||||||||||||||||||||
| Funding agreement backed notes program | – | $ | 500M-1B | – | $500M | |||||||||||||||||||
| Reinsurance flow from existing 3rd party treaties | – | $ | 400-600M | $ | 801M-1B | $700M | ||||||||||||||||||
| Achieve operating model efficiencies | 25% | Expenses | – | – | – | Achieved | 25% | |||||||||||||||||
| Integration and transition expenses | – | – | – | Not Achieved |
||||||||||||||||||||
| Total direct expense | – | – | – | Achieved | ||||||||||||||||||||
| Deliver financial results in line with A rating | 25% | Operating Income, as adjusted(1) | $ | 770-814M | $ | 862-952M | $ |
999M- 1.044B |
|
$633M | 0% | |||||||||||||
| Return on Equity, as adjusted(2) | <15.8% | 17.8-21.8% | >23.8% | 13.4% | ||||||||||||||||||||
| Risk-Based Capital | <400% | 400-499% | >500% | 527% | ||||||||||||||||||||
| A.M. Best rating of A- | – | – | – | Achieved | ||||||||||||||||||||
| Complete preparation to become a public company | 15% | File Form S-1 | – | – | – | Achieved | 15% | |||||||||||||||||
| Remediate control deficiencies | – | – | – | Achieved | ||||||||||||||||||||
| Own Risk and Solvency Assessment complete | – | – | – | Achieved | ||||||||||||||||||||
| Continue to build one cohesive team | 10% | Improve engagement and leadership scores | – | – | – | Achieved | 10% | |||||||||||||||||
| (1) | Operating Income, as adjusted, is calculated before tax and excludes public equities holding income, excess M&A operating expenses, and unbudgeted expenses related to organizational resiliency and financial institution expenses, and includes stock compensation expenses. |
| (2) | Return on Equity, as adjusted, is calculated before tax and excludes accumulated other comprehensive income, public equities holding income, excess M&A operating expenses, and unbudgeted expenses related to organizational resiliency and financial institution expenses, and includes stock compensation expenses. |
Based on the company’s projected 2015 performance with respect to these five objectives, the payout level was 76.3% of the target opportunity. Exercising its discretion, the compensation committee determined to award annual incentive awards to our NEOs at 90% of the target opportunity. Total amounts of awards were also based on their assessment of individual performance factors, as discussed below.
Mr. Belardi
In addition to the five objectives above, which collectively comprised 50% of his award, Mr. Belardi’s annual incentive plan award in 2015 was based on two additional performance objectives: the first objective,
235
Table of Contents
weighted at 25%, compared the company’s non-alternative investment performance to the Barclays US Aggregate Bond Index over a three-year period. The second objective, also weighted at 25%, compared the company’s alternative investment net performance relative to the company’s underwriting target of 10-15% over a three-year period.
Because of the Aviva USA acquisition in late 2013, the compensation committee determined not to include 2013 results in evaluating the company’s performance against these objectives over a three-year period; in addition, as the committee decided Mr. Belardi’s award in December 2015, it evaluated results for only 2014 and the nine months ended September 30, 2015. For the objective based on the company’s non-alternative investment performance, the committee compared the company’s results of 6.67% for 2014 and 1.00% for the nine months ended September 30, 2015 (each as calculated by AAM, based on information provided by the company, and reviewed by the committee) to 5.96% and 1.13% for the Barclays US Aggregate Bond Index for the same periods, respectively, and determined to pay out 100% of the award for this objective. As 25% of his overall award was tied to this objective, Mr. Belardi earned $218,750 for this performance. For the objective based on the company’s alternative investment performance, the committee compared the company’s results of 9.30% and 7.15% for 2014 and the nine months ended September 30, 2015, respectively (each as calculated by AAM, based on information provided by the company, and reviewed by the committee) to its 10-15% underwriting target and determined to pay out 0% of the award for this objective.
In total, our compensation committee awarded Mr. Belardi an annual incentive award that paid out at 70% of his base salary, or $612,500, which our compensation committee determined to pay in the form of restricted Class A common shares. Mr. Belardi was not granted any Class M-4 common shares in 2015 due to his already significant levels of company equity ownership.
Mr. Wheeler
Mr. Wheeler joined the company on September 28, 2015. The compensation committee recognized Mr. Wheeler for improving the effectiveness and cohesion of the senior management team; reorganizing and strengthening our reinsurance capabilities; supporting our acquisition and block reinsurance efforts generally, including identifying opportunities and successfully integrating acquisitions; and strengthening our risk management efforts.
Mr. Kvalheim
The compensation committee recognized Mr. Kvalheim for his operational leadership, including his focus on the company’s retail business; materially decreasing turnover; identifying where broader talent needs exist; building a strong senior management team, including a new Chief Actuary; and driving the consolidation of offices and sales platforms. Mr. Kvalheim was not granted any Class M-4 common shares in 2015 due to his already significant levels of company equity ownership.
Mr. Klein
Because Mr. Klein joined the company on November 9, 2015, he was not granted an incentive award for 2015. Nevertheless, the compensation committee recognized Mr. Klein for strengthening our finance function and our internal control over financial reporting; and driving the company’s public company readiness.
Mr. Cernich
The compensation committee recognized Mr. Cernich for implementing a more rigorous and consistent transaction review and diligence process; successfully and timely closing the DLD acquisition; and building capabilities in the pension close-out business.
236
Table of Contents
Mr. Cernich resigned from the company effective as of June 30, 2016. The company entered into a separation agreement with Mr. Cernich as of June 21, 2016 under which the company agreed to pay to Mr. Cernich an amount equal to $512,500 representing a pro rata portion of the 2016 bonus had Mr. Cernich been employed through the date on which 2016 bonuses were paid to executives. Additionally, the company agreed to repurchase all of Mr. Cernich’s vested equity shares in the company for cash.
Mr. Smith
The compensation committee recognized Mr. Smith for effectively serving in multiple senior finance roles to supplement temporary gaps in the senior leadership team, including acting as interim Chief Financial Officer and leading the operational transition of the acquired Aviva USA’s life insurance business to affiliates of Global Atlantic.
Mr. Smith resigned from the company effective January 1, 2017. The company and Mr. Smith have not finalized a separation agreement as of the date of this prospectus.
2015 Summary Compensation
The following table contains 2015 compensation information for our NEOs.
2015 Summary Compensation Table
| Name and Position |
Year | Salary | Stock Awards(1) |
Option Awards(2) |
Non-Equity Incentive Plan Compensation |
All Other Compensation |
Total | |||||||||||||||||||||
| James R. Belardi Chairman, Chief Executive |
|
2015
|
|
$
|
875,000(3)
|
|
$
|
612,500(3)
|
|
|
—
|
|
$
|
—
|
|
$
|
13,250(4)
|
|
$
|
1,500,750
|
| |||||||
| William J. Wheeler President |
|
2015
|
|
$
|
326,708(5)
|
|
$
|
135,445
|
|
$
|
12,741,667
|
|
$
|
466,439
|
|
$
|
479,873(6)
|
|
$
|
14,150,132
|
| |||||||
| Grant Kvalheim Chief Executive Officer, |
|
2015
|
|
$
|
650,000
|
|
$
|
363,125
|
|
|
—
|
|
$
|
839,375
|
|
$
|
129,930(7)
|
|
$
|
1,982,430
|
| |||||||
| Martin P. Klein Executive Vice President and |
|
2015 |
|
$ |
80,208(8) |
|
|
— |
|
$ |
1,325,133 |
|
|
— |
|
$ |
97,548(6) |
|
$ |
1,502,889 |
| |||||||
| Stephen E. Cernich(9) Former Executive Vice President, |
|
2015 |
|
$ |
410,000 |
|
$ |
233,125 |
|
$ |
434,000 |
|
$ |
689,375 |
|
$ |
13,250(4) |
|
$ |
1,779,750 |
| |||||||
| Guy H. (“Chip”) Smith, III President, Athene USA, |
|
2015 |
|
$ |
330,000 |
|
$ |
91,240 |
|
$ |
347,200 |
|
$ |
284,960 |
|
$ |
44,468(11) |
|
$ |
1,097,868 |
| |||||||
| Brenda Cushing(12) Former Chief Financial |
|
2015
|
|
$
|
284,375
|
|
|
—
|
|
$
|
347,200(13)
|
|
|
—
|
|
$
|
830,683(14)
|
|
$
|
1,462,258
|
| |||||||
| (1) | The annual equity incentive plan awards are denominated in dollars, but paid out in restricted Class A common shares. These amounts represent the dollar value of the awards. See note 1 to the 2015 Grants of Athene Plan-Based Awards Table for information about the number of shares and their issuance date fair value. |
| (2) | This column represents the grant date fair value of the Class M-4 common shares granted to Messrs. Cernich and Smith and Ms. Cushing, and the grant date fair value of the Class M-4 Prime common shares granted to Messrs. Wheeler and Klein. For information on the valuation assumptions, refer to “Note 14 – Stock-based Compensation” to our audited consolidated financial statements and notes thereto. |
| (3) | Pursuant to an understanding between the company and AAM, the company and AAM have each agreed to pay 50% of Mr. Belardi’s total annual salary and incentive plan award. The amounts reported in these two columns reflect only those amounts for which the company is responsible. The company’s portion of Mr. Belardi’s incentive plan award was paid in the form of restricted Class A common shares. |
| (4) | This represents the company’s 401(k) matching payment of $13,250. |
237
Table of Contents
| (5) | Mr. Wheeler joined the company on September 28, 2015. On an annualized basis, his salary would be $1,250,000. |
| (6) | For Messrs. Wheeler and Klein, this column includes $474,309 and $85,800, respectively, in taxable income realized as a result of their purchases of Class A common shares at a discount to their fair market value. This discount is solely the result of the change in fair market value from the time Messrs. Wheeler and Klein agreed to purchase Class A common shares at the then fair market value to the time of the actual closing of the purchase transactions. For both NEOs, these amounts also include travel expenses from their principal residences to the company’s office in Iowa. For Mr. Wheeler only, his amount also includes reimbursement of relocation expenses. |
| (7) | This amount includes $83,680 for travel expenses from Mr. Kvalheim’s principal residence to the company’s office in Iowa, a housing allowance of $33,000 for his part-time residence in Iowa and the company’s 401(k) matching payment of $13,250. |
| (8) | Mr. Klein joined the company on November 9, 2015. On an annualized basis, his salary would be $550,000. |
| (9) | Mr. Cernich resigned from the company effective as of June 30, 2016. |
| (10) | Mr. Smith resigned from the company effective January 1, 2017. |
| (11) | This amount includes $31,218 for travel expenses from Mr. Smith’s principal residence to the company’s office in Iowa, and the company’s 401(k) matching payment of $13,250. |
| (12) | Ms. Cushing resigned from the company effective as of August 14, 2015. |
| (13) | We repurchased these restricted Class M-4 common shares from Ms. Cushing at the time of her resignation, for an aggregate purchase price of $29,280. |
| (14) | This amount includes the company’s 401(k) matching payment of $13,250 as well as the following items stemming from Ms. Cushing’s resignation in August 2015: $454,650 in Aviva USA Long Term Incentive Plan award, $25,813 in paid time off payout and $336,970 in severance. |
2015 Grants of Athene Plan-Based Awards
The following table provides information about awards granted to the NEOs in 2015: (1) the grant date; (2) the number of Class A and Class M-4 common shares granted to the NEOs under the Athene 2014 Share Incentive Plan; (3) the conversion price of the Class M-4 common shares; and (4) the grant date fair value of the share and option awards, computed in accordance with applicable SEC rules.
2015 Grants of Athene Plan-Based Awards Table
| Name of Executive |
Grant Date |
Estimated Future Payouts Under Incentive Plan Awards(1) |
All Other Share Awards: Number of Class A Common Shares |
All Other Option Awards: Number of Class M-4 Common Shares |
Exercise or Conversion Price of Option Awards |
Grant Date Fair Value of Share and Option Awards | ||||||||||||||||||||||||||||||||||
| Threshold | Target | Maximum | ||||||||||||||||||||||||||||||||||||||
| James R. Belardi |
12/10/15 | $ | 700,000 | $ | 875,000 | $ | 1,312,500 | — | — | — | — | (1) | ||||||||||||||||||||||||||||
| William J. Wheeler |
9/28/15 | — | — | — | 359,325 | (2) | — | — | $ | 10,474,324 | (3) | |||||||||||||||||||||||||||||
| 10/1/15 | — | — | — | — | 2,500,000 | (4) | $ | 27.83 | $ | 12,741,667 | ||||||||||||||||||||||||||||||
| 12/10/15 | $ | 520,548 | $ | 650,685 | $ | 976,028 | — | — | — | — | (1) | |||||||||||||||||||||||||||||
| Grant Kvalheim |
12/10/15 | $ | 1,040,000 | $ | 1,300,000 | $ | 1,950,000 | — | — | — | — | (1) | ||||||||||||||||||||||||||||
|
Martin P. Klein |
11/9/15 | — | — | — | 65,000 | (2) | — | — | $ | 1,894,750 | (5) | |||||||||||||||||||||||||||||
| 11/9/15 | — | — | — | — | 260,000 | (4) | $ | 27.83 | $ | 1,325,133 | ||||||||||||||||||||||||||||||
| Stephen E. Cernich |
2/23/15 | — | — | — | — | 200,000 | $ | 26.00 | $ | 434,000 | ||||||||||||||||||||||||||||||
| 12/10/15 | $ | 820,000 | $ | 1,025,000 | $ | 1,537,500 | — | — | — | — | (1) | |||||||||||||||||||||||||||||
| Guy H. (“Chip”) Smith, III(6) |
2/23/15 | — | — | — | — | 160,000 | $ | 26.00 | $ | 347,200 | ||||||||||||||||||||||||||||||
| 12/10/15 | $ | 316,800 | $ | 396,000 | $ | 594,000 | — | — | — | — | (1) | |||||||||||||||||||||||||||||
| Brenda Cushing |
2/23/15 | — | — | — | — | 160,000 | (7) | $ | 26.00 | $ | 347,200 | |||||||||||||||||||||||||||||
| (1) | These annual incentive plan awards are comprised of both cash-settled and share-settled awards. With respect to the share-settled awards: these awards were not actually paid out and converted into restricted Class A common shares until February 10, 2016 (the “issuance date”). The fair market value of Class A common stock as of that date, which was $28.26 per share, was used to convert the dollar amounts of the equity incentive awards into restricted Class A common shares. Mr. Belardi received 21,674 shares of Class A common stock with an issuance date fair value of $612,507; Mr. Wheeler received 4,793 shares with an issuance date fair value of $135,450; Mr. Kvalheim received 12,850 shares with an issuance date fair value of $363,141; Mr. Cernich received 8,250 shares with an issuance date fair value of $233,145; and Mr. Smith received 3,229 shares with an issuance date fair value of $91,252. |
| (2) | In connection with their joining the company, Messrs. Wheeler and Klein were granted the opportunity to purchase Class A common shares at their fair market value pursuant to the 2014 Share Incentive Plan. Messrs. Wheeler and Klein purchased 359,325 and 65,000 Class A common shares, respectively, at a price of $27.83 per share. |
| (3) | Of this amount, Mr. Wheeler paid $10,000,015. The difference between the purchase price and the grant date fair value of the shares is attributable solely to the change in fair market value from the time Mr. Wheeler agreed to purchase Class A common shares at the then fair market value to the time of the actual closing of the purchase transaction. |
238
Table of Contents
| (4) | Messrs. Wheeler and Klein were granted Class M-4 Prime common shares. |
| (5) | Of this amount, Mr. Klein paid $1,808,950. The difference between the purchase price and the grant date fair value of the shares is attributable solely to the change in fair market value from the time Mr. Klein agreed to purchase Class A common shares at the then-fair market value to the time of the actual closing of the purchase transaction. |
| (6) | We repurchased these restricted Class M-4 common shares from Ms. Cushing at the time of her resignation, for an aggregate purchase price of $29,280. |
| (7) | Mr. Smith resigned from the company effective January 1, 2017. |
2015 Outstanding Athene Equity Awards at Fiscal Year-End
The following table provides information on the holdings of Athene equity awards by the NEOs as of December 31, 2015. This table includes vested Class M common shares, which are the economic equivalent of vested, unexercised options; unvested Class A common shares; and unvested Class M time-based and performance-based common shares with vesting conditions that were not satisfied as of December 31, 2015. Each equity grant is shown separately for each NEO. The vesting schedule for each outstanding award is shown following this table.
2015 Outstanding Equity Awards at Fiscal Year-End Table
| Option Awards | Stock Awards | |||||||||||||||||||||||||||||||
| Name of Executive |
Option Class | Number of Securities Underlying Unexercised Options (Exercisable)(4) |
Number of Securities Underlying Unexercised Options (Unexercisable) |
Option Conversion Price |
Option Vesting Expiration Date(2) |
Stock Class | Number of Shares or Units of Stock That Have Not Vested |
Market Value of Shares or Units of Stock That Have Not Vested(3) |
||||||||||||||||||||||||
| James R. Belardi |
M-1(1) | 1,308,373 | 1,037,782 | $ | 10.00 | - | ||||||||||||||||||||||||||
| M-2 | 336,404 | 504,606 | $ | 10.78 | 11/3/21 | |||||||||||||||||||||||||||
| M-3 | 300,000 | 700,000 | $ | 13.46 | - | |||||||||||||||||||||||||||
| A | 32,929 | $ | 1,127,160 | |||||||||||||||||||||||||||||
| William J. Wheeler |
M-4 Prime | - | 2,500,000 | $ | 27.83 | 10/1/25 | ||||||||||||||||||||||||||
| Grant Kvalheim |
M-2 | 188,386 | 282,580 | $ | 10.78 | 1/10/21 | ||||||||||||||||||||||||||
| M-3 | 132,000 | 308,000 | $ | 13.46 | - | |||||||||||||||||||||||||||
| A | 57,648 | $ | 1,973,291 | |||||||||||||||||||||||||||||
| Martin P. Klein |
M-4 Prime | - | 260,000 | $ | 27.83 | 11/9/25 | ||||||||||||||||||||||||||
| Stephen E. Cernich(5) |
M-1(1) | 237,886 | 188,688 | $ | 10.00 | - | ||||||||||||||||||||||||||
| M-1 | 60,336 | 81,855 | $ | 10.00 | 10/15/22 | |||||||||||||||||||||||||||
| M-2 | 155,497 | 113,627 | $ | 10.78 | 11/3/21 | |||||||||||||||||||||||||||
| M-3 | 96,000 | 224,000 | $ | 13.46 | - | |||||||||||||||||||||||||||
| M-4 | 20,000 | 180,000 | $ | 26.00 | - | |||||||||||||||||||||||||||
| A | 36,510 | $ | 1,249,737 | |||||||||||||||||||||||||||||
| Guy H. (“Chip”) Smith, III(6) |
M-2 | 67,281 | 100,921 | $ | 10.78 | 4/29/21 | ||||||||||||||||||||||||||
| M-3 | 42,000 | 98,000 | $ | 13.46 | - | |||||||||||||||||||||||||||
| M-4 | 16,000 | 144,000 | $ | 26.00 | - | |||||||||||||||||||||||||||
| A | 9,608 | $ | 328,882 | |||||||||||||||||||||||||||||
| (1) | This grant of Class M time-based shares has vested in full and does not appear in the Outstanding Equity Awards Vesting Schedule below. |
| (2) | This column reports the vesting expiration date for the Class M performance-based common shares. Once vested, these shares can remain outstanding indefinitely. Class M-3 performance-based common shares have until three years after the Final Lock-Up End Date to vest; Class M-4 performance-based common shares have until four years after the Final Lock-Up End Date to vest. The Class M time-based common shares vest ratably over a five-year period. |
| (3) | As of December 31, 2015, the fair market value of a Class A common share was $34.23. |
| (4) | The amounts listed in this column represent the amounts that have vested as of December 31, 2015. |
| (5) | Mr. Cernich resigned from the company effective as of June 30, 2016. |
| (6) | Mr. Smith resigned from the company effective January 1, 2017. |
239
Table of Contents
Outstanding Equity Awards Vesting Schedule
The following schedule is for the restricted Class A common shares and the Class M time-based common shares. The Class M-4 performance-based common shares will vest only when the performance hurdles have been satisfied; the Class M-1, M-2 and M-3 performance-based common shares vested in September 2016. See “—Athene Equity Awards.”.
| Name of Executive |
Class of Security |
Share Award Grant Date |
Vesting Schedule for Time-Based Shares |
|||||||||
| James R. Belardi |
M-2 | 10/15/12 | Pro rata over 5 years(1) | |||||||||
| M-3 | 4/28/14 | Pro rata over 5 years(2) | ||||||||||
| A | 4/29/15 | Pro rata over 3 years(3) | ||||||||||
| William J. Wheeler |
M-4 Prime | 10/1/15 | Pro rata over 5 years | |||||||||
| Grant Kvalheim |
M-2 | 10/15/12 | Pro rata over 5 years(4) | |||||||||
| M-3 | 4/28/14 | Pro rata over 5 years(2) | ||||||||||
| A | 4/29/15 | Pro rata over 3 years(3) | ||||||||||
| Martin P. Klein |
M-4 Prime | 11/9/15 | Pro rata over 5 years(5) | |||||||||
| Stephen E. Cernich(8) |
M-1 | 10/15/12 | Pro rata over 5 years | |||||||||
| M-2 | 10/15/12 | Pro rata over 5 years(1) | ||||||||||
| M-3 | 4/28/14 | Pro rata over 5 years(2) | ||||||||||
| M-4 | 2/23/15 | Pro rata over 5 years(6) | ||||||||||
| A | 4/28/15 | Pro rata over 3 years(3) | ||||||||||
| Guy H. (“Chip”) Smith, III(9) |
M-2 | 10/15/12 | Pro rata over 5 years(7) | |||||||||
| M-3 | 4/28/14 | Pro rata over 5 years(2) | ||||||||||
| M-4 | 2/23/15 | Pro rata over 5 years(6) | ||||||||||
| A | 4/28/15 | Pro rata over 3 years(3) | ||||||||||
| (1) | Vesting schedule start date is 11/3/11. |
| (2) | Vesting schedule start date is 10/30/12. |
| (3) | Vesting schedule start date is 1/1/15. |
| (4) | Vesting schedule start date is 1/10/11. |
| (5) | Vesting schedule start date is 11/15/15. |
| (6) | Vesting schedule start date is 4/4/14. |
| (7) | Vesting schedule start date is 4/29/11. |
| (8) | Mr. Cernich resigned from the company effective June 30, 2016. |
| (9) | Mr. Smith resigned from the company effective January 1, 2017. |
2015 Athene Stock Vested Table
The following table provides information for the NEOs on the number of shares of Class A common stock acquired upon vesting in 2015 and the value realized at such time.
2015 Athene Stock Vested Table
| Stock Awards | ||||||||
| Name |
Number of Class A Common Shares Acquired on Vesting (#) |
Value Realized on Vesting ($) |
||||||
| James R. Belardi |
23,665 | $ | 810,053(1) | |||||
| William J. Wheeler |
— | — | ||||||
| Grant Kvalheim |
— | — | ||||||
| Martin P. Klein |
— | — | ||||||
|
Stephen E. Cernich(2) |
— | — | ||||||
| Guy H. (“Chip”) Smith, III |
— | — | ||||||
| Brenda Cushing(3) |
— | — | ||||||
| (1) | These shares vested on 12/31/15, and the fair market value of a Class A common share on such date was $34.23. |
| (2) | Mr. Cernich resigned from the company effective June 30, 2016. |
| (3) | Ms. Cushing resigned from the company in 2015. |
240
Table of Contents
Athene Supplemental Executive Retirement Plan (“SERP”)
Athene offers the SERP to a select group of management and highly compensated employees, including our NEOs. This plan is an unfunded, non-qualified deferred compensation plan. U.S. tax laws limit the amount of pay that employees can defer for retirement into qualified 401(k) plans, such as the Athene Savings and Retirement Plan (the “Athene Savings Plan”). The SERP gives selected employees the ability to defer compensation in excess of the amount permitted by U.S. tax laws under the Athene Savings Plan. Amounts deferred under the SERP are credited with earnings based on elections made by participants from a menu of investment options offered. Benefits payable under this plan are generally payable upon separation from service at the company and may be paid as a single lump sum payment or in quarterly, semiannual or annual installments over a period up to 20 years, as irrevocably elected by the participant at the time of entry into the SERP.
2015 Athene SERP
| Name |
Executive Contributions in Last Fiscal Year |
Athene Contributions in Last Fiscal Year |
Aggregate Earnings in Last Fiscal Year |
Aggregate Balance at Last Fiscal Year-End |
||||||||||||
| James R. Belardi |
— | — | — | — | ||||||||||||
| William J. Wheeler |
— | — | — | — | ||||||||||||
| Grant Kvalheim |
— | — | — | — | ||||||||||||
| Martin P. Klein |
— | — | — | — | ||||||||||||
| Stephen E. Cernich(1) |
— | — | $ | (2,191) | $ | 77,614 | ||||||||||
| Guy H. (“Chip”) Smith, III(2) |
$ | 216,500 | — | $ | (2,320) | $ | 223,346 | |||||||||
| Brenda Cushing(3) |
— | — | $ | (20,984) | $ | 1,070,131 | ||||||||||
| (1) | Mr. Cernich resigned from the company effective June 30, 2016. |
| (2) | Mr. Smith resigned from the company effective January 1, 2017. |
| (3) | Ms. Cushing resigned from the company in 2015. |
2015 Potential Payments Upon Termination or Change-in-Control At Fiscal Year-End
The information below describes and quantifies certain compensation that would have become payable under existing plans and arrangements if the NEO’s employment had terminated on December 31, 2015. These benefits are in addition to benefits available generally to salaried employees, such as distributions under our 401(k) Plan, disability benefits and accrued vacation pay. Due to the number of factors that affect the nature and amount of any benefits provided upon the events discussed below, any amounts actually paid or distributed may be different. Factors that could affect these amounts include the time during the year of any such event and the executive’s age.
Athene Equity Awards
Time-based restricted shares issued under the 2009, 2012 and 2014 Share Incentive Plans will vest in full upon a sale of the company or a change-in-control that occurs either prior to a participant’s termination of service and, in the case of time-based restricted Class M common shares, within six months following a participant’s termination of service without cause, by the participant for good reason or due to death or disability. Separate and apart from a sale or change-in-control, following a participant’s termination of service without cause, by the participant for good reason or due to death or disability, the performance-based restricted shares that are outstanding and unvested shall remain outstanding and eligible to vest pursuant to their terms for a period of 18 months. If such performance-based restricted shares fail to vest during this 18-month period, they will be forfeited.
Pursuant to Mr. Belardi’s employment agreement, in the event of involuntary termination of service other than due to non-renewal by the company, all outstanding restricted shares that are held by Mr. Belardi that are subject to time-vesting and scheduled to vest during the one-year period following his termination shall
241
Table of Contents
immediately vest, and a portion of each tranche of outstanding and unvested performance-vested restricted shares, depending on when they were granted, shall remain outstanding and eligible to vest pursuant to their terms for a period of 18 months following the termination date.
The following table provides the intrinsic value (that is, the value based upon the fair market value of our share price as of December 31, 2015 which was $34.23, less the conversion price of the award) of equity awards that would vest if there was a sale of the company or change-of-control as of December 31, 2015 (which includes if the NEO was terminated without cause as of December 31, 2015 and there was a sale of the company or a change-of-control within six months thereafter) or if there was a termination without cause as of December 31, 2015.
2015 Potential Equity Benefits upon Change in Control and Termination Table
| Upon Change in Control | Upon Termination without Cause | |||||||||||||||
| Name |
Time-Based Restricted Shares |
Performance-Based Restricted Shares |
Time-Based Restricted Shares |
Performance-Based Restricted Shares(1) |
||||||||||||
|
James R. Belardi |
$ |
42,752,223 |
|
|
— |
|
$ |
37,117,971 |
|
$ |
19,381,350 |
| ||||
|
William J. Wheeler |
$ |
5,546,667 |
|
|
— |
|
|
— |
|
$ |
3,484,444 |
| ||||
|
Grant Kvalheim |
$ |
12,486,867 |
|
|
— |
|
|
— |
|
$ |
3,504,524 |
| ||||
|
Martin P. Klein |
$ |
533,335 |
|
|
— |
|
|
— |
|
$ |
369,778 |
| ||||
|
Stephen E. Cernich(2) |
$ |
13,145,146 |
|
|
— |
|
|
— |
|
$ |
5,496,377 |
| ||||
|
Guy H. (“Chip”) Smith, III(3) |
$ |
4,413,352 |
|
|
— |
|
|
— |
|
$ |
1,361,490 |
| ||||
| (1) | As noted above, Class M performance-based restricted shares that are outstanding and unvested shall remain outstanding and eligible to vest pursuant to their terms for a period of 18 months. Unless Mr. Belardi’s Class M performance-based restricted shares were granted more than five years before the termination date, only a portion of his restricted shares will be eligible for vesting, depending on when they were granted. For purposes of this table only, the amounts reported in this column assume that one-third of each class of NEO’s Class M performance-based restricted shares that are eligible to vest do, in fact, vest over the 18 months following December 31, 2015. |
| (2) | Mr. Cernich resigned from the company effective June 30, 2016. |
| (3) | Mr. Smith resigned from the company effective January 1, 2017. |
Severance Benefits
Our NEOs would be eligible for benefits under the Athene USA Corporation Severance Pay Plan, which covers our U.S. full-time employees, if they are involuntarily terminated without cause, and provided they release Athene from any and all claims and, in some instances, agree to non-compete/non-solicit covenants. In general, eligible employees receive two weeks of their annual base salary for each completed year of service. The minimum benefits payable under this plan are four weeks of annual base salary; and the maximum benefits payable under this plan are 26 weeks of annual base salary. In the event that an NEO is notified by us that he or she is required to comply with a post-separation non-compete covenant for a period longer than the number of weeks of annual base salary to which the NEO is entitled based on his or her years of service, then the amount of the NEO’s severance benefit will be increased to an amount equal to annual base salary for the same number of weeks as the duration of the non-compete covenant. However, except for Mr. Belardi, in accordance with his employment agreement, in no event will an NEO receive more than two times his or her annual base salary received during the year immediately preceding the year of termination. In its sole discretion, the company may determine to pay a pro-rated bonus to the involuntarily terminated employee, as approved by the compensation committee.
242
Table of Contents
Our employees based in Bermuda are eligible for benefits under the Athene Bermuda Severance Pay Plan, which are substantially similar to the benefits provided by the Athene USA Corporation Severance Pay Plan.
2015 Potential Pay Upon Termination Table(1)
| Name of Executive |
Termination Scenario(1) |
Athene Severance Pay | ||||
| James R. Belardi(2) |
Voluntary Separation | — | ||||
| Involuntary Separation | $ | 2,380,000(3) | ||||
| Termination For Cause | — | |||||
| William J. Wheeler |
Voluntary Separation | — | ||||
| Involuntary Separation | $ | 1,250,000 | ||||
| Termination For Cause | — | |||||
| Grant Kvalheim |
Voluntary Separation | — | ||||
| Involuntary Separation | $ | 750,000 | ||||
| Termination For Cause | — | |||||
| Martin P. Klein |
Voluntary Separation | — | ||||
| Involuntary Separation | $ | 550,000 | ||||
| Termination For Cause | — | |||||
|
Stephen E. Cernich(4) |
Voluntary Separation | — | ||||
| Involuntary Separation | $ | 410,000 | ||||
| Termination For Cause | — | |||||
| Guy H. (“Chip”) Smith, III(5) |
Voluntary Separation | — | ||||
| Involuntary Separation | $ | 330,000 | ||||
| Termination For Cause | — | |||||
| (1) | For NEOs other than Mr. Belardi, voluntary separation triggers a severance payment only if the company decides to enforce any non-compete provision, in which case severance would be paid for the time period concurrent with the period of the effectiveness of the non-compete provision. Involuntary separation provides for severance to coincide with a 12-month non-compete clause. Severance is not payable where an employee is terminated for cause. |
| (2) | Pursuant to his employment agreement, severance is payable to Mr. Belardi in the event of a termination of employment by the company without cause, by the company by reason of non-renewal, by Mr. Belardi for good reason, or due to Mr. Belardi’s death or disability. Mr. Belardi is entitled to receive severance payments in an amount equal to the sum of his then-annual base salary and a pro rata bonus for the year of termination based on the bonus paid to him in the year preceding his termination. In the event of an involuntary termination other than due to death or disability, Mr. Belardi is entitled to receive an additional bonus equal to the bonus paid to him in the year preceding the year in which his termination occurs. |
| (3) | This amount represents the company’s portion of the severance payable to Mr. Belardi in the event of a termination of employment by the company without cause, by the company by reason of non-renewal, by Mr. Belardi for good reason, or due to Mr. Belardi’s death or disability. Mr. Belardi is eligible to receive a separate involuntary severance payment from AAM. |
| (4) | Mr. Cernich resigned from the company effective June 30, 2016. |
| (5) | Mr. Smith resigned from the company effective January 1, 2017. |
Non-Employee Director Compensation
Neither our employee director nor our Apollo directors, other than Dr. Puffer who is not an employee of Apollo but acts as a consultant to Apollo and its affiliates, receive any additional compensation for serving as directors. Additionally, none of Messrs. Cutis, Ghubash or Mourgue D’Algue accept any compensation for serving as directors. Each of our other directors receives annual compensation of $140,000, of which 50% is paid in cash and 50% is paid in restricted Class A common shares that vest ratably over a three-year period. In light of the workload and broad responsibilities of their positions, the independent chairs of board committees receive an additional $25,000 in annual compensation, payable 50% in cash and 50% in restricted Class A common shares. Independent members of the board committees, other than the chairs, receive an additional $10,000 in annual compensation, also payable 50% in cash and 50% in restricted Class A common shares. Directors eligible to
243
Table of Contents
receive compensation also receive $2,500 for each board meeting attended. In addition, Ms. Taitz serves as a director on the boards of several of our subsidiaries, for which she receives separate compensation. Dr. Puffer serves on the supervisory board of one of our German subsidiaries, for which he receives separate compensation.
The table below indicates the elements and total value of cash compensation and of equity awards granted to each eligible director for services performed in 2015.
2015 Director Summary Compensation Table
| Name |
Fees Earned or Paid in Cash |
Share Awards | All Other Compensation |
Total | ||||||||||||
| Marc Beilinson |
$ | 94,998 | $ | 85,000 | — | $ | 179,998 | |||||||||
| Robert Borden |
$ | 87,499 | $ | 80,000 | — | $ | 167,499 | |||||||||
| Manfred Puffer |
$ | 92,498 | $ | 82,500 | —(1) | $ | 174,998 | |||||||||
| Lawrence J. Ruisi |
$ | 97,498 | $ | 87,500 | — | $ | 184,998 | |||||||||
| Hope Taitz |
$ | 104,998 | $ | 97,500 | $ | 25,000(2) | $ | 227,498 | ||||||||
| (1) | Dr. Puffer received EUR 6,250 as compensation for serving as a director of Athene Lebensversicherung AG. This amount is not reflected in the total. |
| (2) | This amount is for service on the boards of directors of certain of the company’s subsidiaries. |
Share Incentive Plans
This summary of the Share Incentive Plans is qualified in its entirety by the actual Share Incentive Plans, which are filed as exhibits to the registration statement of which this prospectus forms a part.
Introduction
We adopted Share Incentive Plans in 2009, 2012 and 2014. The 2009 and 2012 Share Incentive Plans were amended and restated in 2014. We also adopted a Share Incentive Plan in 2016, which was approved by our shareholders in November 2016.
Purpose
The purpose of each Share Incentive Plan is to further the growth and success of the company and its subsidiaries by enabling directors and employees of, or consultants to, the company, its subsidiaries and AAM to acquire our common shares, thereby increasing their personal interest in such growth and success, and to provide a means of rewarding outstanding performance by such persons to the growth and success of the company and its subsidiaries.
Administration
Each Share Incentive Plan is currently administered by the compensation committee. Under the terms of each Share Incentive Plan, the plan may be administered by our board of directors or, if the board so chooses, by the compensation committee or such other committee of our board of directors as the board of directors may from time to time designate (the “Committee”). Among other things, the Committee will have the authority to determine eligibility and the particular persons or classes of persons who will receive awards; grant awards to eligible persons or eligible classes of persons, determine the price and number of securities to be offered or awarded to any of such persons, determine the other specific terms and conditions of awards consistent with the express limits of each plan, establish the installments (if any) in which such awards will become exercisable or will vest and the respective consequences thereof; construe and interpret the provisions of each plan and any award agreement; accelerate or extend the exercisability or extend the term of any or all outstanding awards; and make all other determinations and take such other action as contemplated by each plan or as may be necessary or advisable for the administration of each plan and the effectuation of its purposes.
244
Table of Contents
Eligibility
Directors and employees of, and consultants to, the company, its subsidiaries and AAM are eligible to participate in the Share Incentive Plans.
Shares Subject to Each Share Incentive Plan
3,500,000 Class A common shares are reserved for issuance under the 2016 Share Incentive Plan, and upon adoption of the 2016 Share Incentive Plan, the 2009, 2012 and 2014 Share Incentive Plans have been frozen, which means that no additional awards may be granted under those plans. In the event of certain extraordinary corporate transactions or events affecting us, the compensation committee or our board of directors shall make such substitutions or adjustments as it deems appropriate and equitable to (i) the aggregate number and kind of shares or other securities reserved for issuance and delivery under the applicable plan, (ii) the number and kind of shares or other securities subject to outstanding awards and (iii) the exercise price and or purchase price of awards. In the case of corporate transactions such as a merger or consolidation, such adjustments may include the cancellation of outstanding awards in exchange for cash or other property or the substitution of other property for the shares subject to outstanding awards.
Types of Awards
Awards granted under the Share Incentive Plans may be nonqualified share options, rights to purchase shares, restricted shares, restricted share units and other awards settleable in, or based upon, common shares. In addition, awards granted under the 2016 Share Incentive Plan may include incentive stock options and performance awards settleable in cash.
Share Options
Share options granted under the Share Incentive Plans other than the 2016 Share Incentive Plan will be nonqualified options. Share options granted under the 2016 Share Incentive Plan may be either nonqualified options or incentive share options. Each grant of share options will be evidenced by an award agreement that specifies the exercise price, the duration of the award, the number of shares to which the award pertains and such additional limitations, terms and conditions as the Committee may determine. The exercise price of share options will be determined by the Committee, but may not be less than 100% of the fair market value of the share underlying the share options on the date of grant. Award holders generally may pay the exercise price in cash or, if approved by the Committee, in common shares (valued at fair market value on the date of exercise) or a combination thereof, or by “cashless exercise” through a broker or by withholding shares otherwise receivable on exercise. The term of share options will be determined by the Committee. The Committee will determine the vesting and exercise schedule of share options and the extent to which the share options will be exercisable after the award holder’s services with us terminate.
Restricted Shares
Restricted common shares may be granted under the Share Incentive Plans with such restrictions as the Committee may designate. The Committee may provide at the time of grant that the vesting of restricted shares will be contingent upon the achievement of applicable performance goals and/or continued service. The terms and conditions of restricted share awards (including any applicable performance goals) do not need to be the same with respect to each participant. During the restriction period, the Committee may require that the share certificates evidencing restricted shares be held by us. Except for these restrictions and any others imposed by the Committee, the recipient will have rights of a shareholder with respect to the relevant class of restricted shares granted under the Share Incentive Plans, including the right, if any, to vote the restricted shares upon the vesting of such restricted shares; however, whether and to what extent the recipient will be entitled to receive cash or share dividends paid or made with respect to the shares or to convert such shares into Class A common shares
245
Table of Contents
will be set forth in the particular participant’s award agreement. The restricted shares currently outstanding under the Share Incentive Plans were granted in both time-based vesting and performance-based vesting tranches. For a description of our classes of common shares, see “Description of Share Capital.”
Under the current award agreements, other than the Class M-1, M-2 and M-3 agreements, option agreements and certain restricted stock unit agreements issued in 2016, following the initial public offering, with respect to those shares whose Lock-Up End Dates have not occurred, within 270 days following the termination of service of a participant (or, with respect to any restricted shares that vest following a participant’s termination of service, 270 days following the vesting date of such restricted shares), the company has the right (but not the obligation) to repurchase all or any portion of the vested shares held by such participant on the date of such termination. The company also has the right (but not the obligation) to repurchase all or any portion of the fully paid award shares (as defined in the plans) held by such participant on the date of such termination. Assuming the termination is not for cause, the repurchase price for Class A common shares will be equal to the volume weighted average closing trading price of a Class A common share during the 60-day trading period preceding the date of notice of repurchase, and the purchase price of vested shares that have not yet been converted to Class A common shares will be the same, minus their conversion price.
Restricted Share Units
The Committee may grant restricted share units payable in cash or our common shares, conditioned upon continued service and/or the attainment of performance goals determined by the Committee. The terms and conditions of restricted share unit awards granted under the Share Incentive Plans (including any applicable performance goals) do not need to be the same with respect to each participant.
Rights to Purchase Shares and Other Share-Based Awards
The Committee may grant rights to purchase shares and other awards settleable in, or based upon, common shares under each of the Share Incentive Plans. Each such award will be evidenced by an award agreement that specifies any applicable purchase or exercise price, the duration of the award, the number of shares to which the award pertains, any applicable vesting requirements and such additional limitations, terms and conditions as the Committee may determine.
Performance Awards Settleable in Cash
Under the 2016 Share Incentive Plan, the Committee may grant performance awards settleable in cash. Each such award will be evidenced by an award agreement that specifies any applicable performance measure and performance period, any applicable vesting requirements and such additional limitations, terms and conditions as the Committee may determine.
Award Limits
The awards that may be granted under the 2016 Share Incentive Plan are generally subject to the following limits. The maximum number of Class A common shares with respect to which share options may be granted during any fiscal year to any person is 3,500,000 shares. The maximum number of Class A common shares with respect to which awards denominated in shares and subject to performance measures may be granted during any fiscal year to any person is 3,500,000 shares. The maximum amount that may be earned by any person with respect to performance awards settleable in cash during any fiscal year is $15,000,000. These provisions are designed so that compensation resulting from such awards can qualify as tax deductible performance-based compensation under Section 162(m) of the Code, assuming other applicable regulatory requirements are satisfied.
246
Table of Contents
Termination of Service
The impact of a termination of employment or service on an outstanding award granted under the Share Incentive Plans, if any, is set forth in the applicable award agreement.
Treatment of Outstanding Equity Awards following a Sale of the Company or a Change in Control
The outstanding award agreements under the plans provide that, in the event of a sale of the company or a change in control (A) prior to a participant’s termination of service or (B) in the case of the Class M award agreements, within six months following the participant’s termination of service by the company or AAM without cause, by the participant for good reason (as defined therein) or as a result of the participant’s death or disability (each, a “qualifying termination”), the participant’s time-based vesting restricted shares will vest in full. For this purpose, a change in control means any event or series of events by which (i) the Apollo Group ceases to own, directly or indirectly, equity interests in the company (“equity interests”) representing 40% or more on a fully-diluted basis of the aggregate ordinary voting power represented by the issued and outstanding equity interests of the company, and (ii) any “person” or “group” (as such terms are used in Sections 13(d) and 14(d) of the Exchange Act) becomes the “beneficial owner” (as defined in Rules 13d-3 and 13d-5 under the Exchange Act), directly or indirectly, of a greater percentage on a fully-diluted basis of the aggregate ordinary voting power represented by the issued and outstanding equity interests of the company than such percentage owned by the Apollo Group.
Transferability
Unvested awards under the Share Incentive Plans generally are not transferable except by will or the laws of descent and distribution or as otherwise expressly permitted by the Committee including, if so permitted, pursuant to a transfer to the participant’s family members or to a charitable organization, whether directly or indirectly or by means of a trust or partnership or otherwise. Certain vested awards may be pledged by the participant holding such award as security for loans or transferred to the company to pay conversion prices or to satisfy tax withholding liabilities of such participants.
Amendment and Discontinuance
The Share Incentive Plans generally may be amended, altered, suspended, discontinued or terminated by our board of directors, but no amendment, alteration, suspension, discontinuation or termination may be made (i) if it would materially impair the rights of a participant (or his or her beneficiary) without the participant’s (or beneficiary’s) consent, except for any such amendment made to comply with applicable law, or (ii) without the approval of our shareholders to the extent such approval is required by applicable law.
Federal Income Tax Consequences
The following discussion is intended only as a brief summary of the federal income tax rules that are generally relevant to nonqualified share options and restricted shares that may be granted under the Share Incentive Plans, based upon the U.S. federal tax laws currently in effect. The laws governing the tax aspects of awards are highly technical and such laws are subject to change. The discussion is general in nature and does not take into account a number of considerations which may apply in light of the circumstances of a particular participant under the Share Incentive Plans. The income tax consequences under applicable foreign, state or local tax laws may not be the same as under U.S. federal income tax laws.
Share Options
Upon the grant of a share option, the award holder will not recognize any taxable income and we will not be entitled to a deduction. An award holder will recognize compensation taxable as ordinary income (and subject to
247
Table of Contents
income tax withholding with respect to an employee) upon exercise of a nonqualified share option equal to the excess of the fair market value of the shares purchased over their purchase price, and we will be entitled to a corresponding deduction. With respect to the exercise of an incentive share option, if an award holder holds the shares for one year from the date of exercise and two years from the date of grant, then the holder’s profit, if any, made on the sale of the shares will be taxed as long-term capital gain, and we will not be entitled to a corresponding deduction, unless the holder does not meet the holding period requirements.
Share Awards
An award holder will recognize compensation taxable as ordinary income (and subject to income tax withholding with respect to an employee) at the time of grant of unrestricted shares in an amount equal to the excess of the fair market value of the shares at such time over the amount, if any, paid for such shares, and we will be entitled to a corresponding deduction, except to the extent the deduction limits of Section 162(m) of the Code apply.
Restricted Shares
A participant who receives any restricted shares may be permitted (but not required) to file an election under Section 83(b) of the Code (a “Section 83(b) Election”) with respect to such shares. If the participant timely files the Section 83(b) Election, (a) the participant will recognize ordinary income on any such restricted shares as of the grant date equal to the excess of the fair market value of the shares (determined without regard to vesting conditions) over the amount paid for the shares, and (b) upon sale or disposition of any such restricted shares any additional gain will be treated as capital gains. (Note that if a participant files a Section 83(b) Election and the restricted shares ultimately are forfeited, the participant generally will not be entitled to a deduction for the income recognized in connection with the election.) If a participant does not file a Section 83(b) Election, at the time the substantial risk of forfeiture with respect to such restricted shares lapses, the participant will recognize ordinary income equal to the excess of the fair market value of the shares at such time over the amount paid for the shares. The amount of ordinary income recognized by making a Section 83(b) Election or upon the lapse of such restrictions is deductible by us as compensation expense, except to the extent the deduction limits of Section 162(m) of the Code apply. In addition, a participant receiving dividends with respect to restricted shares for which a Section 83(b) Election has not been made and prior to the time such restrictions lapse will recognize compensation taxable as ordinary income (and subject to income tax withholding with respect to an employee), rather than dividend income, in an amount equal to the dividends paid and we will be entitled to a corresponding deduction, except to the extent the deduction limits of Section 162(m) of the Code apply.
Restricted Share Units
A participant will not recognize compensation taxable as ordinary income at the time an RSU is granted and we will not be entitled to a tax deduction at that time. Upon settlement of RSUs, the participant will recognize compensation taxable as ordinary income (and subject to income tax withholding with respect to an employee) in an amount equal to the excess of the fair market value of any shares delivered over the amount, if any, paid for the shares plus any cash paid by us. We generally will be entitled to a business expense deduction in the same amount and at the same time as the participant recognizes ordinary income, except to the extent the deduction limits of Section 162(m) of the Code apply.
Performance Awards and Other Share-Based Awards
The taxation of performance awards and other share-based awards will depend on the specific terms of the award. Generally, the grant of performance awards and share-settled awards will have no federal income tax consequences for us or for the participant at the time of grant and the participant recognizes compensation taxable as ordinary income (and subject to income tax withholding with respect to an employee) at the time such awards are settled equal to excess of the fair market value of any unrestricted shares received over the amount, if
248
Table of Contents
any, paid for such shares plus any cash paid by us. Subject to the restrictions of Section 162(m) of the Code, we generally will be entitled to a business expense deduction in the same amount and at the same time as the participant recognizes ordinary income.
Section 162(m) of the Code
Section 162(m) of the Code generally limits to $1 million the amount that a publicly held corporation is allowed each year to deduct for the compensation paid to the corporation’s NEOs. However, “qualified performance-based compensation” is not subject to the $1 million deduction limit. Additionally, provided certain conditions are satisfied, newly public companies may be exempt from Section 162(m) of the Code for a transition period of up to three years following the date of the initial public offering.
To constitute qualified performance-based compensation, the following requirements must be satisfied: (i) the performance goals are determined by a committee consisting solely of two or more “outside directors,” (ii) the material terms under which the compensation is to be paid, including the performance goals, are approved by the corporation’s stockholders, and (iii) the committee certifies that the applicable performance goals are satisfied before payment of any qualified performance-based compensation is made. Certain compensation under the Share Incentive Plans, such as that payable with respect to options and stock appreciation rights, is not expected to be subject to the $1 million deduction limit, but other non-performance-based compensation payable under the Share Incentive Plan, such as share awards and other share-based awards may be subject to such limit in the future.
249
Table of Contents
PRINCIPAL AND SELLING SHAREHOLDERS
Principal Shareholders
The following table sets forth information as of October 31, 2016 regarding the beneficial ownership of our Class A common shares and our Class B common shares by (1) each person or group who is known by us to own beneficially more than 5% of our outstanding Class A common shares or our Class B common shares (including any securities convertible or exchangeable within 60 days into Class A common shares or Class B common shares, as applicable), (2) each of our NEOs, (3) each of our directors and (4) all of our current executive officers and directors as a group.
Beneficial ownership for the purposes of the following table is determined in accordance with the rules and regulations of the SEC. These rules generally provide that a person is the beneficial owner of securities if such person has or shares the power to vote or direct the voting thereof, or to dispose or direct the disposition thereof or has the right to acquire such powers within 60 days. Our Class B common shares are convertible into Class A common shares at any time at the option of the holder, with prior notice to the company, on a one-for-one basis. Accordingly, for the purposes of this table each holder of Class B common shares is deemed to be the beneficial owner of an equal number of Class A common shares (in addition to any other Class A common shares beneficially owned by such holder), which is reflected in the table entitled “Amount and Nature of Beneficial Ownership” under the columns “Number of Shares” and “Percent” for the Class A common shares. Certain Class A common shares may be deemed non-voting when owned by a shareholder if such shareholder (or certain of its affiliates) (1) owns, directly or indirectly, Class B common shares, (2) holds an equity interest in Apollo or AAA or (3) is a member of the Apollo Group at which time any member of the Apollo Group holds Class B common shares, subject to certain exceptions. As such, certain of our Class A common shareholders hold voting shares, but such shares are non-voting when being held by such holder due to these restrictions. If such holder sold any such shares to another holder that would not be subject to these restrictions, such Class A common shares would be voting shares. In addition, the voting power of our shareholders may be restricted or adjusted as described in “Description of Share Capital—Common Shares—Voting Rights.” See “—Voting Power” for an illustration of the voting power of certain shareholders who beneficially own more than 5% of our Class A common shares and Class B common shares. Such illustration includes shareholders who may own non-voting Class A common shares who, to our knowledge, beneficially own more than 5% of our outstanding Class A common shares and Class B common shares.
To our knowledge, each person named in the table below has sole voting and investment power with respect to all of the Class A common shares, Class B common shares and Class M common shares convertible into Class A common shares within 60 days shown as beneficially owned by such person, except as otherwise set forth in the notes to the table and pursuant to applicable community property laws. Additionally, to our knowledge, certain of these shareholders also own equity interests in AAA, which holds a significant number of our Class B common shares. As of October 31, 2016, such equity interests of AAA do not entitle the holders thereof to exchange such interests for common shares of Athene, but after the consummation of this offering, AAA may elect to distribute the common shares of Athene that it holds to such holders, whether by its liquidation or otherwise. On November 8, 2016, AAA announced the declaration of a conditional distribution of common shares of Athene held by AAA to its unitholders. On November 7, 2016, the board of directors of the general partner of AAA approved a conditional distribution of 10,766,297 Athene Class B common shares in the aggregate, constituting 12.5% of the total 86,130,377 of Class B common shares beneficially owned by AAA. The distribution is conditional upon the pricing of this offering. The Class B common shares distributed by AAA will automatically become Class A common shares upon distribution to unitholders unless a unitholder is a member of the Apollo Group. The table below does not give effect to this conditional distribution. The notes to the table below reflect the pro forma ownership of certain shareholders who, to our knowledge, also own interests in AAA assuming their respective interests in AAA were exchanged for Class B common shares of Athene and that such Class B common shares were exchanged on a one-for-one basis into Class A common shares of Athene as of October 31, 2016. Unless otherwise indicated in the table or footnotes below, the address for each officer and
250
Table of Contents
director listed in the table is c/o Athene Holding Ltd., Chesney House, First Floor, 96 Pitts Bay Road, Pembroke, HM08, Bermuda.
| Amount and Nature of Beneficial Ownership
|
||||||||||||||||||||||||||||
| Class A Common Shares Beneficially Owned(1) | Class B Common Shares Beneficially Owned |
|||||||||||||||||||||||||||
| Prior to the initial public offering |
After giving effect to the initial public offering(1) |
|
||||||||||||||||||||||||||
| Number of Shares |
Percent(2) | Number of Shares |
Percent(2) | Number of Shares |
Percent | |||||||||||||||||||||||
| Entities managed by or affiliated with Apollo(3)(4) |
133,963,973 | 72.0% | 133,963,973 | 100 | % | |||||||||||||||||||||||
| 2403304 Ontario Limited(5) |
5,769,231 | 10.9% | ||||||||||||||||||||||||||
| Stanhope Investments(6) |
4,615,385 | 8.7% | ||||||||||||||||||||||||||
| Teacher Retirement System of Texas(7) |
3,653,846 | 6.9% | ||||||||||||||||||||||||||
| Normanton Investments Pte. Ltd.(8) |
2,884,615 | 5.5% | ||||||||||||||||||||||||||
| Executive Officers and Directors |
||||||||||||||||||||||||||||
| James R. Belardi(9) |
4,973,190 | 8.7% | ||||||||||||||||||||||||||
| William J. Wheeler(10) |
527,590 | 1.0% | ||||||||||||||||||||||||||
| Grant Kvalheim(11) |
2,104,312 | 4.0% | ||||||||||||||||||||||||||
| Martin P. Klein(12) |
76,596 | * | ||||||||||||||||||||||||||
| Guy H. (“Chip”) Smith, III(13) |
269,004 | * | ||||||||||||||||||||||||||
| Marc Rowan(14) |
— | — | ||||||||||||||||||||||||||
| Marc Beilinson(15) |
48,053 | * | ||||||||||||||||||||||||||
| Imran Siddiqui(16) |
1,961,539 | 3.7% | ||||||||||||||||||||||||||
| Ahmed Ghubash(17) |
— | — | ||||||||||||||||||||||||||
| Gernot Lohr(18) |
1,103,589 | 2.1% | ||||||||||||||||||||||||||
| Jerome Mourgue d’Algue(19) |
— | — | ||||||||||||||||||||||||||
| Matthew R. Michelini(20) |
125,000 | * | ||||||||||||||||||||||||||
| Robert Borden(21) |
40,171 | * | ||||||||||||||||||||||||||
| Mark Cutis(22) |
— | — | ||||||||||||||||||||||||||
| Hope Taitz(23) |
52,330 | * | ||||||||||||||||||||||||||
| Lawrence J. Ruisi(24) |
40,455 | * | ||||||||||||||||||||||||||
| Dr. Manfred Puffer(25) |
40,267 | * | ||||||||||||||||||||||||||
| H. Carl McCall(26) |
— | — | ||||||||||||||||||||||||||
| Brian Leach(27) |
— | — | ||||||||||||||||||||||||||
| Arthur Wrubel(28) |
— | — | ||||||||||||||||||||||||||
| All directors and executive officers as a group (22 persons)(29) |
12,707,312 | 21.8% | ||||||||||||||||||||||||||
| * | Represents less than 1%. |
| (1) | Class M common shares are subject to time- or performance-based vesting and following the offering will be convertible into Class A common shares. The number of Class M common shares included in the table represents the number of Class M common shares that vest as of December 30, 2016, the date that is 60 days after October 31, 2016. We assume for purposes of the table that Class M common shares convert into Class A common shares on a one-for-one basis. The column entitled “After giving effect to the initial public offering” gives effect to the conditional distribution of Athene common shares made by AAA at the time of pricing of the offering. |
| (2) | The percentage of beneficial ownership of our Class A common shares is based on 52,879,773 Class A common shares outstanding as of October 31, 2016. |
| (3) | Consists of shares held of record by the following members of the Apollo Group (the “Apollo Holders”): 86,130,376 Class B common shares held of record by AAA, 10,000,000 Class B common shares held of record by Stanhope Life, L.P., 4,480,286 Class B common shares held of record by Stanhope Life II, L.P., 9,989,661 Class B common shares held of record by Palmetto Athene Holdings (Cayman), L.P., 80,096 Class B common shares held of record by Apollo Palmetto Advisors, L.P., 6,730,769 Class B common shares held of record by AHL Investor 2014, L.P., 1,730,769 Class B common shares held of record by AHL Investor 2014 II, L.P. and 14,822,015 Class B common shares held of record by Apollo Principal Holdings III, L.P. Athene Asset Management, L.P. also holds one Class B common share. |
251
Table of Contents
AAA Investments, L.P. is the general partner of the AAA Investor. AAA Associates, L.P. is the general partner of AAA Investments, L.P. and AAA is the limited partner of AAA Investments, L.P. AAA MIP Limited is the general partner of AAA Associates, L.P. and AAA Guernsey Limited is the general partner of AAA. Apollo Alternative Assets, L.P. provides investment services to the AAA Investor, AAA Investments, L.P., AAA Associates, L.P., AAA Guernsey Limited and AAA MIP Limited. Apollo International Management, L.P. is the managing general partner of Apollo Alternative Assets, L.P. Apollo International Management GP, LLC is the general partner of Apollo International Management, L.P.
Apollo Palmetto Management, LLC is the general partner of Palmetto Athene Holdings (Cayman), L.P. and Apollo Palmetto Advisors, L.P. Apollo Palmetto Athene Partnership, L.P. is the limited partner of Palmetto Athene Holdings (Cayman), L.P. and as such has the right to control the disposition of the Athene common shares held by Palmetto Athene Holdings (Cayman), L.P. Apollo Principal Holdings IV, L.P. is the sole member of Apollo Palmetto Management, LLC. Apollo Principal Holdings IV GP, Ltd. is the general partner of Apollo Principal Holdings IV, L.P. Apollo Palmetto Athene Management, LLC is the investment manager for Apollo Palmetto Management, LLC. The general partner of Athene Asset Management, L.P. is AAM GP Ltd. The sole shareholder of AAM GP Ltd. is Apollo Life Asset Ltd. Apollo Capital Management, L.P. is the sole member-manager of Apollo Palmetto Athene Management, LLC and the sole shareholder of Apollo Life Asset Ltd. The general partner of Apollo Capital Management, L.P is Apollo Capital Management GP, LLC. Apollo Management Holdings, L.P. is the sole member and manager of Apollo International Management GP, LLC and Apollo Capital Management GP, LLC. Apollo Management Holdings GP, LLC is the general partner of Apollo Management Holdings, L.P.
Stanhope Life Advisors, L.P. is the general partner of each of Stanhope Life, L.P. and Stanhope Life II, L.P. Apollo Administration GP Ltd. is the general partner of Stanhope Life Advisors, L.P. AHL 2014 Investor GP, Ltd. is the general partner of each of AHL 2014 Investor, L.P. and AHL 2014 Investor II, L.P. Apollo Principal Holdings III, L.P. is the sole shareholder of each of Apollo Administration GP Ltd. and AHL 2014 Investor GP, Ltd.
Apollo Principal Holdings III GP, Ltd. is the general partner of Apollo Principal Holdings III, L.P. Leon Black, Joshua Harris and Marc Rowan are executive officers and the managers or directors of Apollo Management Holdings GP, LLC, Apollo Principal Holdings III GP, Ltd. and Apollo Principal Holdings IV GP, Ltd. and as such may be deemed to have voting and dispositive control of the shares of Athene common stock that are held by the Apollo Holders.
| (4) | The address of each of the Apollo Holders, Apollo and Apollo’s investment manager and advisors, Messrs. Black, Harris and Rowan is c/o Apollo Global Management LLC, 9 West 57th Street, 43rd Floor, New York, New York 10019. |
| (5) | Refers to shares owned by 2403304 Ontario Limited (“2403304”), a wholly-owned subsidiary of Ontario Teachers’ Pension Plan Board (“OTPP”). Each of Ken Manget and Maggie Fanari may be deemed to have the power to dispose of the shares held by 2403304 because of a delegation of authority from the President and Chief Executive Officer of OTPP to such persons, and because of a delegation of authority to the President and Chief Executive Officer of OTPP from the Board of Directors of each of OTPP and 2403304, and each such person expressly disclaims beneficial ownership of such shares. The address of each of 2403304 and OTPP is 5650 Yonge Street, Toronto, Ontario M2M 4H5 Canada. |
| (6) | The address for Stanhope Investments is 190 Elgin Avenue, Grand Cayman KY1-9005, Cayman Islands. Excludes 14,480,287 Class B common shares held of record by Stanhope Life, L.P. and Stanhope Life II, L.P. which are discussed in footnote 3 above. |
| (7) | The address for Teacher Retirement System of Texas is 1000 Red River Street, Austin, TX 78701-2698. |
| (8) | The address for Normanton Investments Pte. Ltd. is Les Cascades, Edith Cavell Street, Port Louis, Republic of Mauritius. |
| (9) | Consists of (1) 886,024 Class A common shares held of record by the James and Leslie Belardi Family Trust, and (2) 4,087,166 Class M common shares vested as of December 30, 2016 which are convertible into Class A common shares following the offering. Excludes 30,972 restricted Class A common shares and 100,000 Class M common shares which are unvested as of December 30, 2016. Mr. Belardi disclaims beneficial ownership of all common shares of Athene held by members of the Apollo Group. |
| (10) | Consists of 360,923 Class A common shares and 166,667 Class M common shares vested as of December 30, 2016 which are convertible into Class A common shares following the offering. Excludes 3,195 restricted Class A common shares and 2,333,333 Class M common shares which are unvested as of December 30, 2016. |
| (11) | Consists of (1) 664,680 Class A common shares held of record by Grant Kvalheim April 2014 GRAT, (2) 37,150 Class A common shares held of record by Grant Kvalheim 2009 Children’s GST Exempt Trust-DK, (3) 37,150 Class A common shares held of record by Grant Kvalheim 2009 Children’s GST Exempt Trust-LK, (4) 37,150 Class A common shares held of record by Grant Kvalheim 2009 Children’s GST Exempt Trust-MK and (5) 1,328,182 Class A common shares held of record by Grant Kvalheim individually. Excludes 46,999 restricted Class A common shares and 484,000 Class M common shares which are unvested as of December 30, 2016. |
| (12) | Consists of 65,000 Class A common shares and 11,596 Class M common shares vested as of December 30, 2016 which are convertible into Class A common shares following the offering. Excludes 242,667 Class M common shares which are unvested as of December 30, 2016. |
| (13) | Consists of 237,004 Class A common shares and 32,000 Class M common shares vested as of December 30, 2016 which are convertible into Class A common shares following the offering. Excludes 8,558 restricted Class A common shares and 142,000 Class M common shares which are unvested as of December 30, 2016. Mr. Smith resigned from the company effective January 1, 2017. |
252
Table of Contents
| (14) | Does not own any Class A common shares and disclaims beneficial ownership of all Class A common shares owned by members of the Apollo Group. Mr. Rowan owns interests in AAA. Mr. Rowan does not have the power to vote or dispose of any Athene common shares held by AAA and therefore is not deemed to beneficially own such shares. Assuming all of such interests were exchanged on an equivalent basis for Class B common shares of Athene and such shares were in turn exchanged for Class A common shares on a one-for-one basis, in each case, as of October 31, 2016, Mr. Rowan would own an additional 1,704,533 Class A common shares. After giving effect to the conditional distribution by AAA of Athene common shares upon the pricing of the offering, Mr. Rowan will own 227,953 Athene Class A common shares. |
| (15) | Excludes 20,081 restricted Class A common shares which are unvested as of December 30, 2016. |
| (16) | Consists of 1,961,539 Class A common shares held of record by the Siddiqui Family 2014 GST Trust. Mr. Siddiqui disclaims beneficial ownership of all Class A common shares held of record by the Siddiqui Family 2014 GST Trust and all common shares of Athene held by members of the Apollo Group. In addition to his ownership of our Class A common shares, Mr. Siddiqui also owns interests in AAA. Mr. Siddiqui does not have the power to vote or dispose of any Athene common shares held by AAA and therefore is not deemed to beneficially own such shares. Assuming all of such interests were exchanged on an equivalent basis for Class B common shares of Athene, and such shares were in turn exchanged for Class A common shares on a one-for-one basis, in each case, as of October 31, 2016, Mr. Siddiqui would own an additional 7,488 Class A common shares and, together with the Class A common shares that he is deemed to beneficially own shown in the table above, he would own a total of 1,969,074 of our Class A common shares. After giving effect to the conditional distribution by AAA of Athene common shares upon the pricing of the offering, Mr. Siddiqui will own an additional 1,001 Athene Class A common shares. 1,961,539 Class A common shares owned by the Siddiqui Family 2014 GST Trust have been pledged as security to a financial institution. |
| (17) | Does not own any Class A common shares and disclaims beneficial ownership of all common shares of Athene owned by Procific. |
| (18) | Mr. Lohr disclaims beneficial ownership of all common shares of Athene held by members of the Apollo Group. In addition to his ownership of our Class A common shares, Mr. Lohr also owns interests in AAA. Mr. Lohr does not have the power to vote or dispose of any Athene common shares held by AAA and therefore is not deemed to beneficially own such shares. Assuming all of such interests were exchanged on an equivalent basis for Class B common shares of Athene, and such shares were in turn exchanged for Class A common shares on a one-for-one basis, in each case, as of October 31, 2016, Mr. Lohr would own an additional 568,191 Class A common shares and, together with the Class A common shares that he is deemed to beneficially own shown in the table above, he would own a total of 1,602,742 of our Class A common shares. After giving effect to the conditional distribution by AAA of Athene common shares upon the pricing of the offering, Mr. Lohr will own an additional 75,986 Athene Class A common shares. 1,103,589 Class A common shares owned by Mr. Lohr have been pledged as security to a financial institution. |
| (19) | Does not own any Class A common shares and disclaims beneficial ownership of all common shares of Athene owned by Procific. |
| (20) | Mr. Michelini disclaims beneficial ownership of all common shares of Athene held by members of the Apollo Group. Mr. Michelini owns interests in AAA. Mr. Michelini does not have the power to vote or dispose of any Athene common shares held by AAA and therefore is not deemed to beneficially own such shares. Assuming all of such interests were exchanged on an equivalent basis for Class B common shares of Athene and such shares were in turn exchanged for Class A common shares on a one-for-one basis, in each case, as of October 31, 2016, Mr. Michelini would own an additional 3,315 Class A common shares. After giving effect to the conditional distribution by AAA of Athene common shares upon the pricing of the offering, Mr. Michelini will own an additional 443 Athene Class A common shares. |
| (21) | Consists of (1) 37,147 Class A common shares held of record by PENSCO Trust Co. Custodian FBO Robert L. Borden IRA and (2) 3,024 Class A common shares held of record by Mr. Borden individually. Excludes 19,783 restricted Class A common shares which are unvested as of December 30, 2016. |
| (22) | Does not own any Class A common shares and disclaims beneficial ownership of all common shares of Athene owned by Stanhope Life, L.P., Stanhope Life II, L.P. and Stanhope Investments. |
| (23) | Excludes 20,832 restricted Class A common shares which are unvested as of December 30, 2016. |
| (24) | Excludes 20,231 restricted Class A common shares which are unvested as of December 30, 2016. |
| (25) | Excludes 19,931 restricted Class A common shares which are unvested as of December 30, 2016. |
| (26) | Excludes 15,000 restricted Class A common shares which are unvested as of December 30, 2016. |
| (27) | Excludes 15,000 restricted Class A common shares which are unvested as of December 30, 2016. |
| (28) | Excludes 15,000 restricted Class A common shares which are unvested as of December 30, 2016. |
| (29) | Totals include purchased Class A common shares and any restricted common shares which have or will vest as of December 30, 2016. |
253
Table of Contents
Voting Power
The following table sets forth the voting power as of October 31, 2016 of each person or group who is known by us to own beneficially more than 5% of our outstanding Class A common shares or Class B common shares (including any securities convertible or exchangeable within 60 days into Class A common shares or Class B common shares, as applicable).
The aggregate and respective voting power of our Class A common shares and Class B common shares is determined in accordance with our bye-laws. The Class A common shares collectively represent 55% of the total voting power of our common shares and the Class B common shares represent, in aggregate, 45% of the total voting power of our common shares, each subject to certain adjustments, as described in “Description of Share Capital—Common Shares—Voting Rights.” Apollo beneficially owns or exercises voting control over the Class B common shares. The voting rights exercisable by Class A shareholders other than Apollo are limited so that Control Groups are deemed not to hold more than 9.9% of the total voting power conferred by our shares. The percentage reduction of votes that occurs by operation of the foregoing limitation will generally be reallocated proportionately among other Class A common shareholders who are not members of these groups so long as such reallocation does not cause a Control Group to hold more than 9.9% of the total voting power of our shares. In addition, certain Class A common shares may be deemed non-voting when owned by a shareholder if such shareholder (or certain of its affiliates) (1) owns, directly or indirectly, Class B common shares, (2) holds an equity interest in Apollo or AAA or (3) is a member of the Apollo Group at which time any member of the Apollo Group holds Class B common shares, subject to certain exceptions. As such, certain of our Class A common shareholders hold voting shares, but such shares are non-voting when being held by such holder due to these restrictions. If such holder sold any such shares to another holder that would not be subject to these restrictions, such Class A common shares would be voting shares.
Pursuant to our bye-laws, the total voting power of Class A common shares held by members of our management and employees of the Apollo Group that are shareholders is limited to 3% of the total voting power of our common shares.
The table below shows the voting power of certain shareholders who, to our knowledge, beneficially own more than 5% of our outstanding Class A common shares and Class B common shares as of October 31, 2016.
| Number of Class A Common Shares Owned
|
Number of Class B Common Shares Owned
|
Total Number of Shares Owned
|
Percent of Total Outstanding Class A Common Shares and Class B Common Shares Owned
|
Total Voting Power of Class A Common Shares and Class B Common Shares Taken Together(1)
| ||||||||
| Entities managed by or affiliated with Apollo |
— | 135,963,975 | 135,963,975 | 72.0% | 45.0% | |||||||
| 2403304 Ontario Limited |
5,769,231 | — | 5,769,231 | 3.1% | 9.5% | |||||||
| Stanhope Investments |
4,615,385 | — | 4,615,385 | 2.4% | 0%(2) | |||||||
| Teacher Retirement System of Texas |
3,653,846 | — | 3,653,846 | 1.9% | 6.0% | |||||||
|
|
||||||||||||
| (1) | The Class B common shares represent, in aggregate, 45% of the total voting power of our common shares, subject to certain adjustments, as described in “Description of Share Capital—Common Shares—Voting Rights.” On November 8, 2016, AAA announced the declaration of a conditional distribution of common shares of Athene held by AAA to its unitholders. On November 7, 2016, the board of directors of the general partner of AAA approved a conditional distribution of 10,766,297 Athene Class B common shares in the aggregate, constituting 12.5% of the total 86,130,377 of Class B common shares beneficially owned by AAA. The distribution is conditional upon the pricing of this offering. The Class B common shares distributed by AAA will automatically become Class A common shares upon distribution to unitholders unless a unitholder is a member of the Apollo Group. This table does not give effect to this conditional distribution. |
| (2) | Owns non-voting Class A common shares. |
254
Table of Contents
Selling Shareholders
The following table sets forth, as of the date of this prospectus, the names of the selling shareholders for whom we are registering shares for resale to the public, and the number of Class A common shares that each selling shareholder may offer pursuant to this prospectus. The Class A common shares offered by the selling shareholders were issued pursuant to exemptions from the registration requirements of the Securities Act of 1933, as amended (the “Securities Act”).
Based on information provided to us by the selling shareholders and as of the date the same was provided to us, assuming that the selling shareholders sell all the Class A common shares beneficially owned by them that have been registered by us and do not acquire any additional shares during the offering, the selling shareholders will not own any shares other than those appearing in the column entitled “Number of Class A Common Shares Owned After the Offering.”
| Selling Shareholder |
Number of Class A Common Shares Owned Prior to the Offering |
Number of |
Number of Class A Common Shares Owned After the Offering |
Percentage of Class A Common Shares Outstanding After the Offering |
||||||||||||
255
Table of Contents
CERTAIN RELATIONSHIPS AND RELATED PARTY TRANSACTIONS
The following is a description of certain relationships and transactions that have existed or that we have entered into with our directors, executive officers, or shareholders who are known to us to beneficially own more than five percent of our voting Class A common shares or Class B common shares and their immediate family members as well as certain other transactions.
Relationships and Related Party Transactions with Apollo or its Affiliates
We have a strategic relationship with Apollo. Apollo’s indirect subsidiary, AAM, serves as our investment manager. In addition to being our co-founder, Apollo assists us in identifying and capitalizing on acquisition opportunities that have been critical to our ability to significantly grow our business. Members of the Apollo Group are significant owners of our common shares and control 45% of the aggregate voting power of our equity securities. Our Chief Executive Officer is also an employee of, and receives substantial remuneration from acting as Chief Executive Officer of, AAM and owns a 5% profits interest in AAM. Additionally, employees of Apollo and its affiliates serve on our board of directors. We expect our strategic relationship with Apollo to continue for the foreseeable future. A number of our directors are also employees of Apollo or its affiliates.
A description of certain relationships we have with Apollo and its affiliates and transactions that have existed or that we have entered into with Apollo and its affiliates are described below.
The following table summarizes the fees we have incurred, directly and indirectly, from Apollo and its affiliates for the periods presented below ($ in millions):
| Nine Months Ended September 30, 2016 |
Years Ended December 31, | |||||||||||||||||||||||||||||||
| 2015 | 2014 | 2013 | ||||||||||||||||||||||||||||||
| Fees Incurred |
% of Average Invested Assets(1) |
Fees Incurred |
% of Average Invested Assets |
Fees Incurred |
% of Average Invested Assets |
Fees Incurred |
% of Average Invested Assets |
|||||||||||||||||||||||||
| IMAs—U.S. and Bermuda(2) |
$ | 175.6 | 0.34% | $ | 233.5 | 0.38% | $ | 229.2 | 0.39% | $ | 103.2 | 0.40% | ||||||||||||||||||||
| Investment Advisory Agreement—Germany |
5.0 | 0.01% | 1.2 | 0.00% | — | 0.00% | — | 0.00% | ||||||||||||||||||||||||
| Apollo Master Sub-Advisory Agreement |
45.0 | 0.08% | 41.9 | 0.07% | 36.3 | 0.06% | 20.0 | 0.08% | ||||||||||||||||||||||||
| Apollo Fund Investment(3) |
36.3 | 0.07% | 50.9 | 0.08% | 43.1 | 0.07% | 118.1 | 0.45% | ||||||||||||||||||||||||
| Third Party Sub-Advisory Agreement |
— | 0.00% | — | 0.00% | — | 0.00% | 0.3 | 0.00% | ||||||||||||||||||||||||
| AmeriHome |
5.3 | 0.01% | 2.9 | 0.01% | 0.4 | 0.00% | — | 0.00% | ||||||||||||||||||||||||
| Shared Services Agreement |
4.6 | 0.01% | 2.3 | 0.00% | (13.0 | ) | (0.02)% | 15.8 | 0.06% | |||||||||||||||||||||||
| Commercial Mortgage Loan Servicing Agreement |
0.1 | 0.00% | 0.5 | 0.00% | 0.7 | 0.00% | — | 0.00% | ||||||||||||||||||||||||
| Out-of-Pocket Expenses(4)(5) |
4.0 | 0.01% | 5.3 | 0.01% | 1.9 | 0.00% | 2.9 | 0.01% | ||||||||||||||||||||||||
|
|
|
|
|
|
|
|
|
|
|
|
|
|
|
|
|
|||||||||||||||||
| $ | 275.9 | 0.53% | $ | 338.5 | 0.55% | $ | 298.6 | 0.50% | $ | 260.3 | 1.00% | |||||||||||||||||||||
|
|
|
|
|
|
|
|
|
|
|
|
|
|
|
|
|
|||||||||||||||||
| Average invested assets |
$ | 69,068 | $ | 61,484 | $ | 59,207 | $ | 25,965 | ||||||||||||||||||||||||
|
|
|
|
|
|
|
|
|
|||||||||||||||||||||||||
| (1) | Percent of average invested assets for the nine months ended September 30, 2016 is annualized. |
| (2) | Exclusive of amounts we received pursuant to the AAM long-term incentive plan. See “—Equity Transactions.” |
| (3) | Includes total management, carried interest (including unrealized but accrued carried interest fees) and other fees, including those we hold as equity method investments. |
256
Table of Contents
| (4) | Advisory Services Agreement entered into on August 23, 2016. Prior to the agreement, we reimbursed Apollo or its affiliates for certain out-of-pocket expenses they incurred in connection with rending services to us. |
| (5) | Years ended December 31, 2014 and 2013 exclude fees paid in connection with the termination of the TASA. See “—Transaction Advisory Services Agreement”. |
Investment Management Relationships
Under our IMAs with AAM, except with respect to our German operations, substantially all of our invested assets are managed by AAM. AAM provides a full array of asset and portfolio management services to us. AAM was founded as a partnership between James R. Belardi and Apollo to provide Athene with a dedicated investment asset manager capable of creating and executing a bespoke investment strategy that is optimal for Athene’s dynamic investment needs. AAM has built a dedicated team of more than 100 investment and operations professionals, senior members of which have deep sector experience in the asset management industry and have overseen our investment portfolio since our founding. As a subsidiary of Apollo, AAM is fully integrated into the Apollo investment platform and provides Athene with access to Apollo’s investment expertise and fully-built infrastructure without the burden of incurring the development and maintenance costs of building an in-house investment asset manager with the capabilities of Apollo/AAM.
As of September 30, 2016, AAM’s investment professionals directly invested approximately 81% of the North America Accounts in a number of asset classes, including investment grade corporate credit and RMBS. For the remainder of the invested assets in the North America Accounts, which is comprised of assets which often require additional sourcing and underwriting capabilities, AAM has chosen to mandate subadvisors rather than building out in-house capabilities. In this regard, AAM is able to leverage its relationship with Apollo in a sub-advisory capacity, pursuant to which AAM has mandated Apollo to invest in asset classes in which Apollo has investment expertise and sourcing capabilities, such as high yield credit, CMLs, CLOs, CMBS and certain ABS. All sub-advised assets are ultimately overseen by AAM to ensure they are appropriate for our business and consistent with our investment strategy. Through our relationship with Apollo and having extensive knowledge of our corporate structure and business targets, AAM often creates or sources unique investment opportunities, such as our investments in MidCap and AmeriHome, described under “—MidCap” and “—AmeriHome”.
We have historically relied on AAM to efficiently reinvest large blocks of invested assets we have acquired. AAM’s investment professionals have developed an intimate knowledge of our liability profile, which is long-dated and predominantly surrender charge protected. This knowledge serves as the foundation of our asset management strategy by enabling us to take advantage of our generally illiquid liability profile and identify asset opportunities with an emphasis on earning incremental yield by taking liquidity risk and complexity risk, rather than assuming solely credit risk. Through AAM and Apollo, we are able to source, value and invest in these high quality assets to drive and target greater investment returns. Additionally, AAM has grown as we have grown. In response to our rapid asset growth and other significant changes in our requirements, such as our strategy of pursuing ongoing retail product sales, AAM has added resources to directly manage our assets and has significantly increased the number and capabilities of its staff to service our growing investment portfolio.
In connection with the acquisition of DLD, our internal German asset management company, ADKG, entered into an investment advisory agreement with AAME pursuant to which AAME provides advisory services for a significant portion of our German investment portfolio.
As discussed in greater detail below, for services related to the investment assets of our U.S. and Bermuda companies, AAM earns an investment management fee of 0.40% per annum on all assets in the North America Accounts (subject to certain exceptions), and other affiliates of Apollo earn additional fees for sub-advisory services rendered with respect to certain invested assets within the North America Accounts. Affiliates of Apollo also earn additional fees paid by funds or other collective investment vehicles in which we are invested for management and other services provided by such affiliates of Apollo to such funds and investment vehicles. For the services related to our investment assets in Germany, AAME earns advisory fees of 0.10% on assets advised
257
Table of Contents
by AAME and affiliates of AAME receive an advisory fee of 0.35% per year on certain German special investment funds (the discrepancy in rates earned by AAME and AAM is due to differences in the investment characteristics, as described in greater detail below). We believe that our relationships with AAM, Apollo and other Apollo affiliates have contributed to and will continue to contribute to our strong financial performance. For the nine months ended September 30, 2016 and the years ended December 31, 2015, 2014 and 2013, we generated net investment income of $2.1 billion, $2.5 billion, $2.3 billion and $1.1 billion, respectively. Net of the aforementioned fees, we achieved consolidated net investment earned rates of 4.23%, 4.24%, 4.29% and 6.66% for the nine months ended September 30, 2016 and the years ended December 31, 2015, 2014 and 2013, respectively.
Although the investment management fee that AAM charges us is generally 0.40% per annum on all assets in the North America Accounts, in order to support continued profitable growth for Athene, AAM has offered to discount certain fees due by Athene. For the total dollar amount of all liabilities sourced through our organic distribution channels during 2016 in excess of $5.1 billion (subject to certain exceptions, “Excess Liabilities”), AAM has agreed to discount fees as follows:
| • | During 2016, a discount of 0.40% per annum multiplied by such Excess Liabilities. The 2016 discount relating to such Excess Liabilities is intended to reasonably approximate a full discount of the AAM fee on the assets relating to such Excess Liabilities during the remainder of the 2016 calendar year. |
| • | For 2017, a discount of 0.20% per annum multiplied by such Excess Liabilities, resulting in a reasonable approximation of a 0.20% fee on the assets relating to such Excess Liabilities during the 2017 calendar year. |
| • | For 2018 and thereafter, a discount of 0.075% per annum, resulting in a reasonable approximation of a 0.325% fee on the assets relating to such Excess Liabilities during the 2018 calendar year and thereafter. |
Excess Liabilities are determined based on our actuarial projections at the time that such Excess Liabilities are written and will amortize on a quarterly basis according to our projections for purposes of determining the discount. As of September 30, 2016, our organic channels have provided deposits of $6.9 billion.
Messrs. Rowan, Lohr, Michelini and Siddiqui, members of our board of directors, also serve as directors of AAM. Messrs. Rowan and Lohr are also directors of AAME. James R. Belardi, our Chief Executive Officer and a member of our board of directors, is the Chief Executive Officer, Chief Investment Officer and a director of AAM. Mr. Belardi has owned equity units in AAM since its founding and currently owns a profits interest equivalent to approximately 5% of the equity of AAM.
IMAs – U.S. and Bermuda
As of September 30, 2016, AAM managed approximately $66.2 billion of assets in the North America Accounts. These assets are invested primarily in a diversified portfolio of fixed maturity and other securities. Approximately $54.0 billion of these assets, the majority of which are investment grade fixed income assets, are in accounts directly invested by AAM while the remainder of our investment assets in the United States and Bermuda are primarily managed by AAM and Apollo through a sub-advisory arrangement between AAM and Apollo. As compensation for the enhanced and bespoke investment management services that AAM provides to us, under investment management agreements between AAM and us, AAM receives a gross fee of 0.40% per annum on all assets in the North America Accounts, with certain limited exceptions. The gross fee of 0.40% per annum is paid in part by the North America Accounts and in part by AHL to the extent that any North America Account’s direct rate is less than 0.40% per annum.
Investment Advisory Agreement – Germany
As of September 30, 2016, AAME advised with respect to approximately $5.3 billion of assets owned by our German Group Companies. As compensation for the investment advisory services rendered to ADKG under
258
Table of Contents
the investment advisory agreement between AAME and ADKG in relation to the assets ADKG manages for our German Group Companies, AAME receives a gross fee of 0.10% per annum on the assets with respect to which it advises, which includes all assets of our German Group Companies except operating cash and certain other excluded asset classes. As discussed in “Business—Investment Management,” the investment characteristics of our assets held by ADKG and our other Germany Group Companies differ substantially from the characteristics of our U.S. and Bermuda subsidiaries. Given these differences in the overall business model and lower yielding, more homogenous investment portfolio and resulting less diverse requisite expertise, our asset management fees in Germany are significantly lower than those paid by us with respect to the North America Accounts.
Termination of Investment Management or Advisory Agreements with AAM and AAME
The investment management or advisory agreements between us and AAM or AAME have no stated term and may be terminated by either AAM or AAME, or AHL or the relevant subsidiary, as applicable, upon notice at any time. However, our bye-laws provide that neither AHL nor its subsidiaries will exercise their termination rights under such agreements, except that any such agreement between AHL or any of its subsidiaries and AAM or AAME may only be terminated on an IMA Termination Date, and any termination on an IMA Termination Date without cause requires (i) the approval of AHL’s board of directors and at least 50% of the total issued shares of AHL that are entitled to vote (giving effect to the voting allocation provisions set forth in AHL’s bye-laws) and (ii) six months’ prior written notice to AAM or AAME of such termination. Notwithstanding the foregoing, any such IMA may be terminated by AHL’s board of directors for cause (as defined in AHL’s bye-laws) which includes (a) material violations of law relating to AAM’s or AAME’s advisory business, (b) AAM’s or AAME’s gross negligence, willful misconduct or reckless disregard of its obligations under the relevant agreement, (c) a determination by the board of directors, in its sole discretion and acting in good faith, on an annual basis, of unsatisfactory long-term performance of AAM or AAME, or (d) a determination by the board of directors, in its sole discretion and acting in good faith, on an annual basis, that the fees being charged by AAM or AAME are unfair and excessive compared to a comparable asset manager (provided, that in the case of the immediately preceding clauses (c) and (d), the board of directors must deliver notice of such determination to AAM or AAME, as applicable, and AAM or AAME, as applicable, shall have 30 days after receipt of such notice to address the board of directors’ concerns, and, provided, further, that in the case of the immediately preceding clause (d), AAM or AAME has the right to lower its fees to match the fees of such comparable asset manager). In addition, the boards of directors of AHL’s subsidiaries may terminate an investment management or advisory agreement with AAM or AAME with regards to the applicable subsidiary if such subsidiary’s board of directors determines that such termination is required in the exercise of its fiduciary duties. AAM or AAME may terminate such agreements at any time, which may adversely affect our investment results. See “Risk Factors—Risks Relating to Our Investments and Investment Manager—We rely on our investment management or advisory agreements with AAM and AAME for the management of our investment portfolio. AAM and AAME may terminate these arrangements at any time, and there are limitations on our ability to terminate such arrangements, which may adversely affect our investment results.”
Apollo Master Sub-Advisory Agreement (“MSAA”) and Apollo Fund Investments
AAM and certain affiliates of Apollo entered into MSAAs for the benefit of our insurance subsidiaries whereby such Apollo affiliates would sub-advise AAM with respect to a portion of the invested assets held in the North America Accounts. Sub-advisory mandates with Apollo generally relate to certain asset classes where Apollo managers have investment expertise and for which AAM has determined that it is more appropriate to sub-advise rather than build out in-house capabilities to invest in these assets. Sub-advisory fees relating to the MSAA and any other sub-advisory arrangement are recharged by AAM to the North America Accounts and are in addition to the gross fee of 0.40% per annum paid to AAM under the IMAs. Currently, the MSAA, as amended, covers services rendered by Apollo-affiliated sub-advisors relating to the following asset classes, among others: bank loans, high yield debt, CMLs, emerging market debt, convertible securities, mortgage- and asset-backed securities (including CLOs), oil and gas royalties and ILS. Under the MSAA, with certain limited exceptions, Apollo earns 0.40% per annum on all assets sub-advised by Apollo up to $10 billion and 0.35% per
259
Table of Contents
annum on all assets sub-advised by Apollo in excess of $10 billion. In certain instances, Apollo earns an incentive fee. As of September 30, 2016 and December 31, 2015, 2014 and 2013, Apollo affiliates directly sub-advised AAM with respect to approximately $12.3 billion, $11.8 billion, $9.8 billion and $6.3 billion, respectively, constituting approximately 19%, 20%, 16% and 11%, respectively, of the North America Accounts. The increase in the AUM of the North America Accounts directly sub-advised by Apollo is due to the acquisition of Aviva USA in October 2013, which resulted in us growing to approximately four times our size immediately prior to the acquisition (as measured by total assets), and subsequent reinvestment of the acquired investments in accordance with our investment strategy.
In addition to invested assets sub-advised by Apollo, from time to time, AAM also invests our assets in investment funds or other collective investment vehicles whose general partner, managing member, investment manager or collateral manager is owned, directly or indirectly, by Apollo or by one or more of Apollo’s subsidiaries (“Apollo fund investments”), and which comprised 67% of our alternative investment portfolio as of September 30, 2016. AAM’s alternative investment strategy is inherently opportunistic and subject to concentration limits on specific risks. We opportunistically target allocating 5-10% of the assets in the North America Accounts to alternative investments. Individual alternative investments are selected based on the investment’s risk-reward profile, incremental effect on diversification and potential for attractive returns due to sector and/or market dislocations. There is a preference for alternative investments that have the following characteristics, among others: (i) investments that constitute a direct investment or an investment in a fund with a high degree of co-investment; (ii) investments with debt-like characteristics (for example, a stipulated maturity and par value), or alternatively, investments with reduced volatility when compared to pure equity; and (iii) investments that have less downside risk. As of September 30, 2016 and December 31, 2015, 2014 and 2013, 3.4%, 3.4%, 3.7% and 3.3%, respectively, of our assets in the North America Accounts were invested in Apollo fund investments. Fees related to such invested assets varied from 0% per annum to 1.75% per annum with respect to management fees and 0% to 20% of profits for carried interest, subject in many cases to preferred return hurdles. See “Business—Investment Management.”
260
Table of Contents
As of September 30, 2016, our Apollo sub-advised investments and Apollo fund investments consisted of the following (dollars in millions):
| September 30, 2016 | ||||||||
| Amount | Percent of Total | |||||||
| Apollo sub-advised investments: |
||||||||
| Fixed maturity securities, available for sale |
||||||||
| State, municipals, and political subdivisions |
$ | 5 | —% | |||||
| Foreign governments |
151 | 1.0% | ||||||
| Corporate |
2,056 | 14.2% | ||||||
| CLO |
5,271 | 36.4% | ||||||
| ABS |
1,022 | 7.1% | ||||||
| CMBS |
1,093 | 7.6% | ||||||
| Trading securities, fixed maturity securities |
||||||||
| ABS |
87 | 0.6% | ||||||
| CLO |
59 | 0.4% | ||||||
| Mortgage Loans |
2,359 | 16.3% | ||||||
| Investment Funds |
82 | 0.6% | ||||||
| Other Investments |
84 | 0.6% | ||||||
|
|
|
|
|
|||||
| Subtotal |
12,269 | 84.8% | ||||||
|
|
|
|
|
|||||
| Apollo Fund Investments: |
||||||||
| Credit Funds |
234 | 1.6% | ||||||
| CLO Equities, affiliated |
221 | 1.5% | ||||||
| Mortgage and Real Assets |
264 | 1.8% | ||||||
| Hedge Funds |
186 | 1.3% | ||||||
| Natural resources |
45 | 0.3% | ||||||
| Private equity – AAA: |
||||||||
| Private equity – Public |
185 | 1.3% | ||||||
| Private equity – MidCap |
511 | 3.6% | ||||||
| Private equity – Other |
130 | 0.9% | ||||||
| A-A Mortgage |
379 | 2.6% | ||||||
| Other Private Equity |
47 | 0.3% | ||||||
|
|
|
|
|
|||||
| Subtotal |
2,202 | 15.2% | ||||||
|
|
|
|
|
|||||
| Total |
$ | 14,471 | 100.0% | |||||
|
|
|
|
|
|||||
For the years ended December 31, 2015, 2014 and 2013, we experienced significant non-recurring carried interest fees as a result of the strong performance of public equity positions within Co-Invest VI and MidCap (as discussed further below). As a result, total fees incurred during such periods were uncharacteristically high. For the year ended December 31, 2013, Co-Invest VI held or liquidated certain positions having unrealized and realized gains of $579 million, which triggered the allocation of carried interest fees to the general partner of $81 million. For the years ended December 31, 2015 and 2014, we incurred carried interest fees of $16 million and $14 million, respectively, due to gains subject to carried interest fees of $78 million and $72 million, respectively, related to MidCap Financial. The restructuring of MidCap Financial to form MidCap resulted in Co-Invest VII distributing $30 million of its Class A notes to Apollo during 2015 to settle the carried interest fees.
261
Table of Contents
As of September 30, 2016 and December 31, 2015, 2014 and 2013, 3.6%, 4.1%, 2.8%, and 2.8%, respectively, of our total investments, including related parties and consolidated VIEs, are comprised of securities, including investment funds, in which Apollo, or an Apollo affiliate, has significant influence or control over the issuer of a security or the sponsor of the investment fund. The following table summarizes our cash flow activity related to these investments for the periods presented below (dollars in millions):
| Nine months ended September 30, 2016 |
Years ended December 31, | |||||||||||||||
| 2015 | 2014 | 2013 | ||||||||||||||
| Sales, maturities, and repayments |
$ | 321 | $ | 610 | $ | 2,159 | $ | 919 | ||||||||
| Purchases |
$ | (321 | ) | $ | (728 | ) | $ | (1,846 | ) | $ | (1,774 | ) | ||||
For additional information regarding these investments, refer to our unaudited condensed consolidated financial statements and notes thereto and our audited consolidated financial statements and notes thereto.
Certain members of our board of directors may directly receive carried interest or may receive a portion of the carried interest that Apollo receives from fund investments in which Athene is invested. Certain directors may invest in fund investments in which we have invested. Additionally, Mr. Belardi and Mr. Kvalheim also have co-investment interests in certain of these fund investments.
Dr. Puffer and Mr. Lohr serve on the board of directors of Athene Lebensversicherung AG, a subsidiary of our German entity. Dr. Puffer received compensation in 2015 for serving as a director of such subsidiary in the amount of EUR 6,250. Mr. Lohr does not receive any compensation for his board service of this subsidiary.
Third Party Sub-Advisory Agreements
In the limited instances in which AAM desires to invest in asset classes for which neither AAM nor Apollo possesses the investment expertise or sourcing abilities required to manage the assets or in instances in which AAM makes the determination that it is more effective or efficient to do so, AAM mandates third-party sub-advisors to invest in such asset classes and we reimburse AAM for fees paid to such sub-advisors.
MidCap
We hold a significant investment in MidCap through Co-Invest VII, a consolidated investment fund managed by an affiliate of Apollo. Additionally we have made loans directly to MidCap Financial to which subsidiaries of MidCap succeeded as borrower. When we originally invested in MidCap Financial in November 2013, MidCap Financial was a specialty finance company which primarily originated lending opportunities in the healthcare sector. With the assistance of Apollo, MidCap Financial entered new lending markets, raised substantial equity capital and restructured as MidCap in January 2015. MidCap represents a unique investment in an origination platform made available to us through our relationship with Apollo and, from time to time, provides us with access to assets for our investment portfolio.
In January 2015, Co-Invest VII contributed its primary investment, MidCap Financial, to a newly formed entity, MidCap, in exchange for subordinated notes issued by MidCap and shares in MidCap’s parent company, MidCap Holdings. Concurrent with this restructuring, Co-Invest VII distributed to its general partner, an affiliate of Apollo, $30 million of the MidCap notes in satisfaction of the carried interest that had been earned by the general partner under the previous MidCap Financial structure through the date of the restructuring. Additionally, unrelated investors made cash contributions to MidCap of $1.0 billion through December 31, 2015. Following the restructuring and funding by unrelated investors, Co-Invest VII owned 31% of the outstanding economic interests of MidCap as of September 30, 2016. Also, Co-Invest VII agreed to certain transfer restrictions and has foregone certain rights associated with its investment in MidCap for a period of two years from the date of the restructuring, resulting in a discount applied to the value of the notes held by Co-Invest VII described above, equal to 4% as of September 30, 2016.
In connection with the acquisition of MidCap Financial by Co-Invest VII in 2013, we entered into a subordinated debt facility with MidCap Financial with a principal amount of $245 million and a maturity date of
262
Table of Contents
July 2018. In addition, in December 2014, we entered into two bridge loan transactions whereby we loaned $100 million to MidCap Financial and one of its subsidiaries with the loans having maturity dates in May and June 2015. In connection with the restructuring of MidCap Financial into MidCap in January 2015, subsidiaries of MidCap Holdings succeeded as borrower under the subordinated debt facility and bridge loan facilities, and the maturity date of the subordinated debt facility was extended to January 2022. For the nine months ended September 30, 2016 and the year ended December 31, 2015, we earned income of $18 million and $33 million, respectively, in connection with these debt financings. MidCap repaid $45 million of the bridge loans during the first quarter of 2015 and repaid the remaining $55 million in January 2016. In January 2016, the subordinated debt facility was amended and restated in connection with new loans made by third-party lenders. The loans under the amended and restated facility mature in January 2026. In consideration of accepting a decrease in the interest rate, from 10% to 9%, extending maturity and other changes to the terms of the loan, a subsidiary of MidCap paid us an amendment fee of $8 million.
The restructuring transactions described above were approved by a special committee of our board of directors consisting of five independent directors. The special committee was formed for the purpose of reviewing the transactions and, in considering whether to approve the transactions, the special committee hired independent legal counsel and received a fairness opinion from a third-party investment bank.
From time to time, we have entered into participation arrangements with MidCap Holdings with respect to loans we purchase that were originated or otherwise sourced by MidCap Holdings. In January 2016, we purchased a pool of loans that were sourced by MidCap and contemporaneously sold participation interests in the loans to a subsidiary of MidCap receiving aggregate consideration of $24 million.
AmeriHome
We hold a significant investment in AmeriHome, a mortgage lender and mortgage servicer, through our investment in A-A Mortgage, an investment fund managed by AAM. AmeriHome originates assets that we may acquire that are consistent with our investment strategy.
Through September 30, 2016, we made equity investments of $266 million in A-A Mortgage. We have approximately 75% of the economic interests in A-A Mortgage, A-A Mortgage owns 100% of the equity interests in Aris Holdco (not including profits interests in Aris Holdco held by AmeriHome management), and Aris Holdco owns 100% of the equity interests in AmeriHome. In 2015, we provided debt financing whereby Athene USA loaned $85 million to A-A Mortgage, which amounts were ultimately invested in AmeriHome. This debt financing was repaid in full in 2015, using the proceeds of additional equity contributions to A-A Mortgage that were made contemporaneous with the repayment of debt. For the year ended December 31, 2015, we earned interest income of $2 million in connection with the debt financing. See “Management’s Discussion and Analysis of Financial Condition and Results of Operations—Consolidated Investment Portfolio—Investment Funds and Variable Interest Entities.”
In connection with our equity investment in A-A Mortgage, we agreed that Aris Holdco will pay AAM a management fee equal to 1.5% of Aris Holdco’s consolidated equity, in addition to the 10% carried interest that AAM receives subject to an 8% hurdle. This management fee is paid in respect of certain management and oversight services provided by AAM to A-A Mortgage and its subsidiaries. In connection with transaction advice that may be rendered by AGS relating to certain strategic transactions that may be entered into by Aris Holdco and/or its subsidiaries, Aris Holdco has agreed to pay to AGS transaction fees equal to 1% of the aggregate consideration in such transactions for which AGS provides advice. In addition, certain other investors in A-A Mortgage, including an Apollo-affiliated fund, as a condition to their commitments to invest in A-A Mortgage, required that the amounts paid by Aris Holdco to AAM in respect of the management fee and amounts paid to AGS in respect of transaction fees would be rebated to such investors.
Gross management fees incurred by Aris Holdco for services rendered by AAM for the nine months ended September 30, 2016 and the years ended December 31, 2015, 2014 and 2013 totaling $1.3 million, $0.7 million, $0.1 million and $0 million, respectively, were rebated to other investors in A-A Mortgage. AAM also
263
Table of Contents
recognized approximately $3.8 million, $2.5 million, $0 million and $0 million in unrealized incentive income for the nine months ended September 30, 2016 and the years ended December 31, 2015, 2014 and 2013, respectively. As of the date of this prospectus, no transaction fees have been paid by Aris Holdco to AGS.
In 2015, we entered into loan purchase and servicing agreements with AmeriHome. The agreements allow us to purchase certain RMLs which AmeriHome has purchased from correspondent sellers and pooled for sale in the secondary market. AmeriHome retains the servicing rights to the sold loans. For the nine months ended September 30, 2016 and the year ended December 31, 2015, we had purchased $19 million and $83 million, respectively, of RMLs under this agreement.
Apollo Commercial Real Estate Finance, Inc.
On August 31, 2016, Apollo Residential Mortgage, Inc. (“AMTG”) merged with and into ARI, with ARI continuing as the surviving corporation (the “Merger”). In connection with the Merger, certain of our subsidiaries entered into several agreements with ARI: (i) an Asset Purchase and Sale Agreement (the “Asset Purchase Agreement”) among ARI, AADE and AAIA, (ii) a Loan Agreement (the “ARI Loan Agreement”) between ARI and Athene USA, and (iii) a Stock Purchase Agreement (the “ARI Stock Purchase Agreement”) between ARI and Athene USA.
Pursuant to the Asset Purchase Agreement, immediately following the consummation of the Merger, AADE and AAIA purchased from ARI $1.1 billion of primarily non-agency RMBS (the “ARI Asset Sale”).
Pursuant to the ARI Loan Agreement, Athene USA provided ARI with a secured term loan of $175 million at an interest rate of one-month LIBOR plus 7.00% to consummate the Merger. The term loan was subsequently repaid by ARI with the net cash proceeds that ARI received from the ARI Asset Sale.
Pursuant to the ARI Stock Purchase Agreement, during the first thirty trading days following the closing of the Merger, Athene USA purchased $20 million in shares of ARI common stock in the open market at the then-current market price, which purchase was required pursuant to the ARI Stock Purchase Agreement if the quoted price of a share of ARI common stock on the NYSE at any time during such specified period was less than the price per share at which the ARI common stock was issued to holders of AMTG common stock upon effectiveness of the Merger ($16.75 per share). In order to fulfill its purchase obligations under the ARI Stock Purchase Agreement, Athene USA entered into a purchase plan with a broker-dealer that was established for purposes of complying with Rules 10b5-1 and 10b-18 under the Exchange Act.
German Office Lease
In May 2011, Delta Lloyd Lebensversicherung AG (now known as ALV, a subsidiary of DLD), entered into a sublease with CSC Deutschland Solutions GmbH for certain office space in Wiesbaden, Germany. In July 2012 and March 2016, the sublease was amended to increase the amount of space subject to sublease and to correspondingly increase the rent payable thereunder. Prior to and unrelated to our acquisition of DLD in October 2015, Wiesbaden (Bridge) S.á.r.l., an affiliate of Apollo, purchased the property subject to sublease.
The sublease expires in January 2017 and upon or prior to the expiration of the sublease, we intend to enter into a lease with Wiesbaden (Bridge) S.á.r.l. that will commence upon the expiration of the sublease. We incurred rent under the sublease of approximately $0.8 million for the nine months ended September 30, 2016 and approximately $0.2 million for the year ended December 31, 2015.
Shared Service Agreements
We have entered into shared services agreements with AAM. Under these agreements, we and AAM make available to each other certain personnel and services. Expenses for such services are based on the amount of time spent on the affairs of the other party in addition to actual expenses incurred and cost reimbursements. These shared services agreements can be terminated for any reason upon thirty days notice. The shared services agreements can also be terminated immediately with respect to a specific party in the event of the insolvency by another party to the agreements, among other things.
264
Table of Contents
Equity Transactions
In December 2015 and 2014, we entered into purchase agreements with AAM pursuant to which AAM purchased 23,250 and 583,268, respectively, of our class M-4 common shares (or RSUs) under our 2014 Share Incentive Plan for aggregate purchase prices of approximately $0.2 million and $1.3 million, respectively. Subsequent to AAM’s purchase of our M-4 common shares, AAM distributed such shares to certain of its employees in connection with the recipient’s entry into a restricted share award agreement. AAM allocated such shares to its employees to further align incentives between AAM officers and employees and our performance.
In July 2014, AAM established a long term incentive plan (the “AAM LTIP”), pursuant to which AAM provides incentive compensation to its eligible directors, officers and senior professionals. Under the terms of the AAM LTIP, we are permitted to receive long term incentive plan (“LTIP”) units, with the determinations as to our use of the LTIP units to be in our discretion. The AAM LTIP further provides that LTIP units that remain ungranted to participants under the AAM LTIP for any given fiscal year be granted to us. AAM may unilaterally change the plan at any time without our consent and therefore we may not receive future distributions under the plan. For the nine months ended September 30, 2016 and the years ended December 31, 2015, 2014 and 2013, pursuant to the AAM LTIP, we were permitted to receive $0 million, $8.5 million, $7.5 million and $0 million, respectively.
In order to promote an alignment of interests, certain AAM employees have received grants of Class M common shares. In addition, certain AAM employees were permitted to purchase our Class A common shares at a discount from market value. As a result of these efforts, as of September 30, 2016, AAM employees (excluding our Chief Executive Officer) own approximately 492,000 Class A common shares, approximately 2,047,000 Class M common shares and approximately 12,750 RSUs. The expense (benefit) associated with stock-based compensation to AAM employees was $11 million, $11 million, $27 million and $0 million for the nine months ended September 30, 2016 and the years ended December 31, 2015, 2014 and 2013, respectively.
In 2015, we offered Messrs. Wheeler and Klein the opportunity to purchase Class A common shares at their fair market value, which was $27.83 per share, pursuant to the 2014 Share Incentive Plan. In April 2014, we offered certain of our employees, directors and affiliates the opportunity to purchase our Class A common shares at a discounted price of $13.46 per share. In the case of the 2015 issuance, the difference between the purchase price and the grant date fair value of the shares is attributable to the change in fair market value from the time Messrs. Wheeler and Klein agreed to purchase the Class A common shares at the then fair market value to the time of the actual closing of the purchase transaction. In the case of the 2014 issuance, the difference between the purchase price and the grant date fair value of the shares was to allow our employees, directors and affiliates to purchase shares, although at a later date, at the same price at which our shares were issued in our third round capital raise. Pursuant to these offers, we sold approximately 442,000 and 3,694,000 shares, respectively, for aggregated consideration approximating $12 million and $50 million, respectively. Compensation expense recorded on these sales totaled $2 million and $46 million, respectively.
Registration Rights Agreement
On April 4, 2014 we entered into the Registration Rights Agreement with our shareholders, including each shareholder that beneficially owns more than five percent of a voting class of our common shares. The Registration Rights Agreement, subject to the restrictions and limitations contained therein, sets forth the conditions under which our shareholders may demand or otherwise require us to register shares held by them and the conditions under which we may require certain shareholders to register shares held by them, in each case such registration to be effected pursuant to the Securities Act. Pursuant to the Registration Rights Agreement: (i) following this initial public offering and subject to certain holding restrictions, certain holders of five percent or greater of our common shares may request and thereby require us to use our reasonable best efforts to effect registration under the Securities Act; (ii) upon registration by us of any of our authorized but unissued Class A common shares or upon registration by us of any Other Shares (as defined in the Registration Rights Agreement), in each case, other than registration on Form S-4 or Form S-8, holders of Registrable Shares (as defined in the Registration Rights Agreement) may require us to include in such registration some or all of their Registrable
265
Table of Contents
Shares on the same terms and conditions as the securities otherwise being sold in such registration, subject to certain limitations and holding restrictions; and (iii) in connection with this initial public offering and any other registered offering of our common shares within 15 months of this initial public offering and in the event that the shares being offered pursuant to the initial public offering is less than the total number of our common shares that the managing underwriter advises is advisable to offer for sale in the initial public offering, we may require, subject to certain thresholds, that certain of our shareholders include their common shares in the registration to make up for the shortfall. See “Shares Eligible for Future Sale—Registration Rights.”
Investment Portfolio Trades with Affiliates
From time to time, AAM and/or Apollo execute cross trades which involve the purchase or sale of assets in a transaction between us, on the one hand, and a third party or an Apollo affiliated entity, in either case, to which Apollo or its affiliate acts in an investment advisor, general partner, managing member, collateral manager or other advisory or management capacity, on the other hand. In addition, from time to time, we may purchase or sell securities from or to related parties, other than through a cross trade transaction. We believe that these transactions are undertaken at market rates, and are executed based on third-party valuations where possible. For the nine months ended September 30, 2016 and the years ended December 31, 2015, 2014 and 2013, the aggregate value of such transactions where we acquired investments from related parties amounted to $1.1 billion, $0 million, $207 million and $7 million, respectively. For the nine months ended September 30, 2016 and the years ended December 31, 2015, 2014 and 2013, we did not sell any investments to related parties.
Commercial Mortgage Loan Servicing Agreements
We have entered into commercial mortgage loan servicing agreements (the “CML Servicing Agreements”) with AAM. Pursuant to these agreements, we have engaged AAM to (i) assist with the origination of and provide servicing of, commercial loans owned by us or in which we participate, secured by mortgages, deeds of trust or documents of similar effect encumbering certain real property and commercial improvements thereon and (ii) provide for management and sale of real estate owned properties.
Transaction Advisory Services Agreement
Apollo and certain of its affiliates have provided to us a diverse array of services which have enabled us to grow our balance sheet to $87.0 billion in total assets as of September 30, 2016. Since our founding, Apollo has identified acquisition opportunities for us to scale our business, and principals, partners and other senior members of Apollo have been instrumental to helping us source, underwrite, and integrate these transactions. In return for these services, prior to October 31, 2012, Apollo had a 10-year monitoring contract in place with us. Under this contract, Apollo Alternative Assets, L.P. and Apollo Management Holdings, L.P., each affiliates of Apollo, collectively charged us a quarterly monitoring fee of 0.50% of our capital and surplus plus out of pocket expenses, payable in cash. On January 1, 2013, we entered into an equity swap transaction with Apollo in connection with the termination of the quarterly monitoring fee. Pursuant to this swap, the quarterly settlement amount continued to accrue to Apollo, but the payment of those amounts (whether in stock or cash) would not be made to Apollo until the earlier of the time when Apollo was no longer deemed to control us within the meaning of the derivative instrument delivered pursuant to the TASA and October 31, 2017. In April 2014, as a result of the external capital raise, Apollo was no longer deemed to control the Company (as defined under the swap) and, as a result, the swap was settled in stock for settlement amounts owed through that date. Additionally, in April 2014, we further amended the TASA to exclude from capital and surplus, on which the quarterly monitoring fee was calculated, the capital received in the April 2014 capital raise, and any capital raised in connection with certain potential future acquisitions as defined in the amended TASA. As we grew our business and platform and began to prepare to become a public company, Apollo voluntarily unwound the monitoring contract at a discount relative to the expected amounts payable over the remaining term thereof. As a result, pursuant to the terms of the TASA, Apollo Alternative Assets, L.P., Apollo Management Holdings, L.P., and AGS (collectively, the “Apollo TASA Parties”), agreed to accelerate the termination date of the monitoring contract from July 14, 2019 to December 31, 2014 in exchange for 2.5 times the quarterly monitoring fee for eight consecutive quarters beginning with the quarter ending March 31, 2013. All amounts accrued under the TASA and outstanding as of
266
Table of Contents
December 31, 2014 were subsequently paid in the form of Class B common shares (or equivalent derivatives) to the Apollo TASA Parties. The total costs, including management fees, incurred for these services and for terminating the TASA were $0 million, $0 million, $228 million and $134 million for the nine months ended September 30, 2016 and the years ended December 31, 2015, 2014 and 2013, respectively.
AAA Transaction
On October 30, 2012, in order to provide pre-funding for and increase certainty to close future acquisitions, the AAA Investor and certain other parties entered into a contribution agreement (the “Contribution Agreement”). Pursuant to the Contribution Agreement, the AAA Investor contributed investment assets to us in exchange for (1) 44,444,457 of our Class B common shares for a purchase price of $13.46 per share, (2) $83 million in cash and (3) a promissory note payable to the AAA Investor with a principal amount of approximately $113 million. The transfer of 1,509,091 of the Class B shares was deferred pending regulatory approvals of certain of the assets being transferred by the AAA Investor pursuant to the Contribution Agreement. Such approvals were received in 2013 and the shares were thereafter issued in exchange for these assets, which were comprised of investment partnerships. The AAA Investor contributed three partnerships (the “AAA Partnerships”) to us pursuant to the Contribution Agreement. At the time of contribution, the AAA Partnerships largely consisted of non-publicly traded equity investments that were co-investments, including Co-Invest VI and Co-Invest VII, alongside private equity funds sponsored by Apollo. We satisfied our obligations under the note in full, together with accrued interest, in September 2014 by issuing 3,808,626 Class B common shares.
The Contribution Agreement described above was approved by a special committee of the conflicts committee consisting of three independent directors. The special committee was formed for the purpose of reviewing the transaction and, in considering whether to approve the transaction, the special committee hired independent legal counsel and received a fairness opinion from a third-party investment bank.
Advisory Services Agreement
On August 23, 2016, we entered into an advisory services agreement (the “Advisory Services Agreement”) with Apollo Management Holdings, L.P. (“AMHLP”). Pursuant to the Advisory Services Agreement, AMHLP or certain other affiliates of Apollo may provide certain non-exclusive management, consulting, financial and other advisory services to us and our subsidiaries. Such services, which differ from those covered by AAM and its affiliates under our IMAs and sub-advisory agreements, involve advice and recommendations related to future acquisitions, capital market activities and strategic priorities (including growth). Apollo and its affiliates do not charge us or our subsidiaries for their services and may determine not to provide any services. Apollo and its affiliates have the right to request a fee for any service they provide, however, such a request is subject to prior approval by us or the applicable subsidiary. We are responsible for all reasonable third party out-of-pocket expenses incurred by Apollo or its affiliates related to the services they offer and provide such entities indemnification against any loss or liability arising out of the Advisory Services Agreement. The Advisory Services Agreement is effective until December 31, 2025. Prior to entering into the Advisory Services Agreement, we reimbursed Apollo or its affiliates for certain out-of-pocket expenses they incurred in connection with rendering services to us.
Other Related Party Transactions and Relationships
We have entered into side letters with certain of our shareholders and have granted them certain rights pursuant to the respective side letters.
We have entered into side letters with Procific (the “Procific Side Letters”), which has a significant indirect interest in us through its holdings in AAA and AHL 2014 Investor, L.P. Pursuant to the Procific Side Letters, among other things: (i) we agree not to amend certain provisions of the Sixth Amended and Restated Shareholders Agreement (the “Shareholders Agreement”) in a manner directly or indirectly adverse to Procific, without Procific’s consent and (ii) the Apollo Group agrees to vote in favor of the election of two senior investment professionals employed by ADIA, Procific or their respective subsidiaries that are identified by
267
Table of Contents
Procific to our board of directors and further agrees to vote in favor of the appointment of a Procific nominee designated by Procific to serve as a member of our conflicts committee. Should a termination event (as defined in the Procific Side Letters as the public offering of the common shares of AHL where 15% or more of such shares are held by non-affiliates of AHL and freely tradable) occur, Procific agrees to cause one Procific nominee to resign from our board of directors and further agrees to cause any Procific nominee serving on our conflicts committee to resign therefrom, in each case, with such resignation to be effective on the termination date. Upon the consummation of this offering, a termination event is expected to occur. In the event that Procific, ADIA or any other affiliate of Procific that is controlled by ADIA ever has the opportunity to hold our shares directly, then the respective entity shall elect whether to hold such shares either directly or through a limited partnership for which an Apollo affiliate acts as a general partner. Should Procific or any Tax Attributable Affiliate (as defined in our bye-laws) of Procific ever hold any of our shares directly, such shares shall be non-voting (to the extent provided in our bye-laws) and the Apollo Group shall have no further obligation to vote in favor of the election of any Procific nominee to our board of directors or the appointment of any Procific nominee to any committee of our board of directors and Procific or its affiliate, as applicable, shall cause the Procific nominee(s) to immediately resign from our board of directors and all committees thereof. The Procific Side Letters further afford Procific the opportunity, in the event that Procific is, directly or indirectly (through its interests in AAA or AHL 2014 Investor, L.P.), required to sell shares in a public offering pursuant to the Registration Rights Agreement, to purchase shares from us in connection with the public offering with such purchase to be effected at the then market price less an amount equal to the underwriting commission per share, up to the number of shares that Procific is required to sell shares in such public offering. Subject to certain exceptions, the Procific Side Letters also provide Procific with an option to elect more favorable lock-up terms to the extent that certain of our investors are afforded lock-up terms that are more favorable than those to which Procific is subject. Finally, we agree to reimburse a special purpose vehicle formed by Procific in connection with our private placement for organizational and operational expenses it incurs during any calendar year. The total of such fees paid by us for the nine months ended September 30, 2016 and the years ended December 31, 2015, 2014 and 2013 was insignificant.
We entered into a side letter with AAA (the “AAA Side Letter”) in connection with our private placement. Pursuant to the AAA Side Letter, for so long as AAA holds any of our equity securities directly or indirectly, it shall have the right to have one representative present at all meetings of our board of directors (and committees thereof); provided that such representative shall not be entitled to vote at such meetings.
Other than as stated or summarized above, since the beginning of our fiscal year ended December 31, 2014, no director, executive officer or shareholder who is known to us to beneficially own more than five percent of our Class A common shares or Class B common shares, or any member of the immediate family of such director, executive officer or shareholder, had or will have a direct or indirect material interest in a transaction or series of transactions in which we are, or one of our subsidiaries is, a party and the amount involved exceeds $120,000.
Related Party Transaction Policy
We have established a related party transaction policy which provides procedures for the review of transactions in excess of $120,000 in any year between us and any covered person having a direct or indirect material interest with certain exceptions. Covered persons include any director, executive officer, director nominee, shareholders known to us to beneficially own 5% or more of our Class A common shares or Class B common shares or any immediate family members of the foregoing. Any such related party transactions shall require advance approval by a majority of our independent directors or by our conflicts committee to the extent that such transactions constitute Apollo Conflicts (as described below) or related party transactions incidental or ancillary thereto. To the extent that the related party transaction is other than either an Apollo Conflict or a related party transaction that is incidental or ancillary thereto, our audit committee charter provides that the audit committee has the authority to review and approve all such transactions.
Because the Apollo Group has a significant voting interest in AHL, and because AHL and its subsidiaries have entered into, and will continue in the future to enter into, transactions with Apollo and its affiliates, our bye-
268
Table of Contents
laws created a conflicts committee, consisting of five of our directors who are not officers or employees of any member of the Apollo Group and are designated by our board of directors. The conflicts committee consists of Messrs. Beilinson, Borden, Cutis and Ghubash and Ms. Taitz. Our Nominating and Corporate Governance Committee and our board of directors have determined that each member of the conflicts committee meets the independence requirements of the NYSE rules. The conflicts committee reviews and must approve of certain material transactions by and between AHL and its subsidiaries, on the one hand, and the Apollo Group, on the other hand, including any modification or waiver of the IMAs with AAM, subject to certain exceptions.
An “Apollo Conflict” is:
| • | the entering into or amendment of any material agreement by and between us and any member of the Apollo Group; or |
| • | the imposition of any new fee or increase in the rate, directly or indirectly, at which fees are charged to us by any member of the Apollo Group, or the provision for any additional expense reimbursement or offset to be borne by us or any of our subsidiaries. |
We require that any new (or amendments to any existing) transactions by and between us and any member of the Apollo Group be, prior to the time such transaction is entered into:
| • | fair and reasonable, taking into account the totality of the relationships between the parties involved (including other transactions that may be or have been particularly advantageous to us); |
| • | entered into on an arms-length basis; |
| • | approved by a majority of our disinterested directors; |
| • | approved by the holders of a majority of our issued and outstanding Class A common shares; or |
| • | approved by the conflicts committee. |
In connection with any matter submitted to the conflicts committee, materials are prepared by management summarizing the applicable conflict and recommending the proposed transaction. The conflicts committee reviews market comparison data (to the extent available) relating to the reasonableness of any proposed fees to be paid.
For operational and administrative ease, certain transactions that fall within the definition of an Apollo Conflict but do not pose a material risk to us need not be approved by the conflicts committee. These exceptions include specific thresholds under which we may engage Apollo or its affiliates in a sub-advisory capacity without prior conflicts committee review or approval. If (1) for any non-alternative assets, Apollo or any affiliate receives fee rates not exceeding 50 basis points per annum on such AUM and (2) for any alternative assets, Apollo or any affiliate receives fee rates not exceeding 100 basis points per annum on such AUM, no prior conflicts committee review or approval is necessary. Furthermore, the following transactions, among others, are expressly excluded from the definition of Apollo Conflict and do not require the consent of the conflicts committee:
| • | investments in an Apollo-sponsored fund made on the same or better terms for us or our subsidiaries, as applicable, as those applicable to other third-party investors in the same Apollo-sponsored fund who invested an amount in such fund equal to or less than that invested by us or our subsidiaries, as applicable, provided that such investment by us or our subsidiaries represents no more than 25% of the outstanding or committed equity interests of such Apollo-sponsored fund; |
| • | a transaction that has been approved by a majority of our disinterested directors, provided that the disinterested directors are notified that such transaction would otherwise constitute an Apollo Conflict prior to such approval; |
| • | any modification, supplement, amendment or restatement of our bye-laws that has been approved in accordance with our bye-laws and applicable Bermuda law; |
| • | amendments to contracts or transactions previously approved by the conflicts committee or a majority of our disinterested directors, or which are not required to be approved by either, so long as, in each |
269
Table of Contents
| case, such amendments either (i) are not materially adverse to AHL or any of its subsidiaries, or (ii) would not cause the relevant contract or transaction to require approval by the conflicts committee or a majority of our disinterested directors under our bye-laws after giving effect to the relevant amendment; |
| • | the entry into a new IMA or new MSAA on terms similar to and not more economically favorable in the aggregate to any member of the Apollo Group than those in the IMA or MSAA then in effect (which includes changes previously approved by the conflicts committee); |
| • | cross trades between two accounts managed by any member of the Apollo Group where one of the two accounts are owned by us and no broker-dealer or brokerage commission or any additional brokerage fee is involved where the original investment was either approved by the conflicts committee or not required to be approved under the conflicts policy (which does not include trades involving members of the Apollo Group acting in the capacity of principal and trading on their own account); |
| • | allocations of costs or expenses between AHL or any of its subsidiaries and the Apollo Group not in excess of five basis points per annum, calculated on the total investible assets of AHL or any relevant subsidiary including accounts supporting reinsurance agreements for which AHL or such relevant subsidiary acts as reinsurer as of the effective date of such allocation (provided that any such allocation of costs or expenses may not be used to pay investment management fees); and |
| • | any other class of transactions, rights, fees or agreements determined by approval of the conflicts committee to not be an Apollo Conflict nor require approval of the conflicts committee. |
Each strategy that is managed, advised or sub-advised for us by AAM or Apollo through a managed account and was previously subject to conflicts committee approval (other than the existing IMA or new IMAs previously approved) may be re-examined by the conflicts committee if such strategy underwent a material change in the amount of AUM in the immediately preceding 12 months.
Our conflicts committee or applicable disinterested directors have previously approved the existing transactions described above under “—Relationships and Related Party Transactions with Apollo or its Affiliates” that are required to be approved by the terms of our conflicts committee charter.
270
Table of Contents
General
We are an exempted company incorporated under the laws of Bermuda. We are registered with the Registrar of Companies in Bermuda under registration number 42353. We were incorporated in 2008 under the name Athene Holding Ltd. and our registered office is located at 96 Pitts Bay Road, Pembroke, HM 08, Bermuda. Our agent for service of process in the United States in connection with this offering is CT Corporation System, 111 Eighth Avenue, New York, New York 10011.
The following description of our share capital, memorandum of association and bye-laws is intended as a summary only and is qualified in its entirety by reference to our memorandum of association and bye-laws, as in effect immediately prior to the completion of this offering and as filed as exhibits to our registration statement, of which this prospectus forms a part, to applicable Bermuda law and the listing rules of the NYSE.
Authorized and Outstanding Share Capital
As of October 31, 2016, our authorized share capital will consist of 425,000,000 Class A common shares, par value $0.001 per Class A common share, of which 52,879,773 Class A common shares are outstanding and held of record by 72 shareholders, 325,000,000 Class B common shares, par value $0.001 per Class B common share, of which 135,963,975 Class B common shares are outstanding and held of record by 10 shareholders, 7,109,560 Class M-1 common shares, of which 3,474,205 Class M-1 common shares are outstanding and held of record by 5 shareholders, 5,000,000 Class M-2 common shares, of which 1,268,749 Class M-2 common shares are outstanding and held of record by 16 shareholders, 7,500,000 Class M-3 common shares, of which 1,480,800 Class M-3 common shares are outstanding and held of record by 24 shareholders, and 7,500,000 Class M-4 common shares, of which 5,639,443 Class M-4 common shares are outstanding and held of record by 118 shareholders. Our authorized share capital also consists of 150,000,000 undesignated shares, of which none are outstanding. The number of record holders of the Class A common shares and Class B common shares does not give effect to the conditional distribution by AAA of Athene common shares or this offering.
Common Shares
General
Pursuant to our bye-laws, subject to the applicable listing rules of the NYSE and to any resolution of the shareholders to the contrary, our board of directors is authorized to issue any of our authorized but unissued common shares. Our common shares have no pre-emptive rights or other rights to subscribe for additional shares, and no rights of redemption, conversion or exchange.
Our common shares currently consist of Class A common shares, Class B common shares and Class M common shares. Class A and Class B common shares are voting common shares and Class M common shares represent non-voting incentive compensation shares which, upon the satisfaction of certain conditions, may be converted into Class A common shares. The Class M common shares have been issued to employees of us and AAM.
While our two voting share classes are economically equivalent – the dollar value of one Class A common share is equivalent to the dollar value of one Class B common share – they differ in terms of voting power. The Class A common shares currently account for 55% of the aggregate voting power of our equity securities, subject to adjustment as described under “—Voting Rights—Class A Common Shares Voting Restrictions of Class A Common Shares” below. The voting Class A common shares are currently owned by persons that are not members of the Apollo Group, including certain members of our management. The Class B common shares currently account for the remaining 45% of the aggregate voting power of our equity securities, subject to adjustment as described under “—Voting Rights—Class B Common Shares” below. The Class B common shares are held by members of the Apollo Group, and accordingly, the Apollo Group beneficially owns or exercises voting control over the Class B common shares.
271
Table of Contents
Our Class A common shares may be subject to a cap of the voting power attributable to such shares or may be deemed to be non-voting depending upon whether a holder of such shares is subject to the restrictions set forth in our bye-laws described below under “—Voting Rights—Class A Common Shares—Voting Restrictions of Class A Common Shares.” These restrictions are applicable to certain holders only and such Class A common shares are not subject to such restrictions to the extent that our Class A common shares are held by persons not subject to such restrictions.
Class A Common Shares
The shares being offered in this offering are our Class A common shares. All Class A common shares, including those sold pursuant to this offering, are fully paid and non-assessable.
Class B Common Shares
Our Class B common shares are voting common shares of the company and are economically equivalent to our Class A common shares – the dollar value of one Class A common share is equivalent to the dollar value of one Class B common share. Holders of the Class B common shares may convert any or all of their Class B common shares into Class A common shares on a one-to-one basis, at any time, upon notice to the company. All of our issued and outstanding Class B common shares are fully paid and non-assessable.
In general, our Class B common shares may only be held by members of the Apollo Group.
The holders of our Class B common shares, by a vote of the majority of the Class B common shares, may at any time and from time to time elect to reduce the percentage of the total voting power of AHL represented by the Class B common shares (and correspondingly increase the percentage of the total voting power of AHL represented by the Class A common shares, so that the total voting power of AHL remains equal to 100%). Should the holders of our Class B common shares elect to reduce the percentage of the total voting power of AHL represented by the Class B common shares, such holders, at their sole discretion, may at the time of election stipulate that the election is irrevocable by such holders.
Because our Class A common shares and Class B common shares are economically equivalent, the Class A common shares will not experience dilution solely as a result of the Class B common shares converting into Class A common shares.
Class M Common Shares
Our Class M-1, M-2, M-3 and M-4 common shares (collectively, the “Class M common shares”) are non-voting incentive compensation shares, convertible into our Class A common shares upon the satisfaction of certain conditions, as described below. The Class M common shares are owned by employees of us and AAM. We do not anticipate issuing any Class M common shares after our initial public offering.
Class M common shares are granted subject to vesting and forfeiture conditions. Each such grant is divided into two tranches. One tranche is subject to time-based vesting only, with the shares generally vesting ratably on each of the first five anniversaries of the date of grant if the holder is still in service with our company on such anniversary. These time-based vesting shares also become vested automatically in full upon a sale or change of control of our company. The other tranche is subject to performance-based vesting, generally based on the achievement by our Class A common shareholders of specified IRRs and MOIC returned to shareholders. The one exception to these performance-based vesting conditions are the grants of restricted Class M-4 Prime common shares made to Messrs. Wheeler and Klein when they joined the company in the second half of 2015. In light of the proximity of their hiring to our initial public offering, the performance-based tranche of the Class M-4 Prime common shares granted to them will vest based on the trading price of the Class A common shares. We also granted Class M-4 Prime common shares to other individuals for whom share awards were
272
Table of Contents
approved in February 2016. See “Compensation of Executive Officers and Directors—2015 Compensation Elements—Athene Equity Awards” for more information about the vesting provisions of the performance-based tranches of Class M common shares.
Notwithstanding the foregoing, in connection with any shareholder vote to approve a merger or amalgamation with respect to AHL, each Class M common share, and each non-voting Class A common share, shall have the power to vote in connection with such approval. Solely in connection with such a vote, the Class M common shares and the non-voting Class A common shares shall collectively represent 0.1% of the total voting power of AHL (such voting power to be allocated equally among the Class M common shares and the non-voting Class A common shares), with the total voting power attributable to each of the voting Class A common shares and Class B common shares being reduced by such percentage on a pro rated basis determined based on the total voting power of each such class.
Repurchase Right
Following certain terminations of the employment or service of a holder of Class M common shares, the company has the right (but not the obligation) to repurchase all or any portion of the vested Class M common shares held by such person.
Conversion to Class A Common Shares
After such time as either (1) certain investors in the Apollo Group receive a 100% return of capital invested in the company or (2) Class A common shares are listed on a national public securities exchange (which condition will be satisfied upon the consummation of this offering), a holder of vested Class M common shares may elect to exchange any or all of such shares for an equivalent number of Class A common shares upon payment to the company (in cash or in shares at the election of the holder of Class M common shares) of an amount equal to the product of (a) the number of vested Class M common shares that are being exchanged and (b) the applicable conversion price, less the per share dividends and other distributions, if any, previously paid by the company in respect of the Class A common shares from and after the issuance of the applicable Class M common shares.
The conversion price for the Class M-1 common shares is $10.00 per share, the conversion price for the Class M-2 common shares is $10.78 per share, the conversion price for the Class M-3 common shares is $13.46 per share and the conversion price for the Class M-4 common shares is $26.00 per share. Each such conversion price is based upon the price per share paid by investors in the private placement of our Class A common shares associated with the applicable Class M common shares. We have issued Class M-4 Prime common shares with conversion prices of $27.83, $28.26 and $33.28, which in each case was the grant date fair value of a Class A common share at the time of grant.
Following conversion of Class M common shares, such converted Class A common shares may be sold for cash subject to applicable contractual transfer restrictions or legal restrictions, such as blackout periods and affiliate sale volume restrictions.
Dividends
Our board of directors may, subject to Bermuda law and our bye-laws, declare a dividend to be paid (in cash or wholly or partly in kind) to shareholders of record on a record date set by our board of directors. Our board of directors may declare and pay a dividend on one or more classes of shares to the extent one or more classes of shares ranks senior to or has a priority over another class of shares. No unpaid dividend will bear any interest.
The holders of unvested Class M common shares are not entitled to receive dividends declared with respect to such shares until specified investors in our company have achieved an actual or deemed return of investment specified in the award agreements relating to the grants of the shares. Dividends on vested Class M common shares are paid to the holders of such shares at the same time that dividends are paid to other shareholders.
273
Table of Contents
We do not currently pay dividends on any of our common shares and we currently intend to retain all available funds and any future earnings for use in the operation of our business. We may, however, pay cash dividends on our common shares, including our Class A common shares, in the future. Any future determination to pay dividends will be made at the discretion of our board of directors and will depend upon many factors, including our financial condition, earnings, legal requirements, restrictions in our debt agreements and other factors our board of directors deems relevant. We are a holding company and we have no direct operations. All of our business operations are conducted through our subsidiaries. Any dividends we pay will depend upon our funds legally available for distribution, including dividends from our subsidiaries. Our U.S. insurance subsidiaries are highly regulated and are required to comply with various conditions before they are able to pay dividends or make distributions to us. See “Business—Regulation—United States—Restrictions on Dividends and Other Distributions.” Our ability to pay dividends on our Class A common shares is limited by the terms of our existing indebtedness and may be restricted by the terms of any future credit agreement or any future debt or preferred securities of ours or of our subsidiaries, as well as withholding tax related considerations. See “Dividend Policy” and “Description of Certain Indebtedness—Credit Facility.” While we do not currently have any preference shares issued or outstanding, if we issue such shares in the future, our board of directors may declare and pay a dividend on one or more classes of shares to the extent one or more classes of shares ranks senior to or has priority over another class of shares.
Voting Rights
The total voting power of our common shares, as referred to in our bye-laws, means the total votes attributable to all of our shares issued and outstanding. The voting rights associated with each class of our common shares is as set forth below.
General
Our bye-laws restrict all holders of all classes of our shares from owning, directly or indirectly, an amount of outstanding capital stock of us such that any one holder that is a “United States person” (as defined in Section 957(c) of the Code) would possess 50% or more of either the total voting power or total value of our shares outstanding, including any securities exchangeable for our capital stock and all options, warrants, contractual and other rights to purchase our capital stock (“Equity Securities”). Our bye-laws also prohibit any holder of any class of our shares from transferring any such shares if, after giving effect to such transfer, 19.9% or greater of the total voting power or the total value of our outstanding shares or Equity Securities would be owned, directly or indirectly, by either (i) U.S. shareholders (as defined in Section 953(c) of the Code) who are insured or reinsured by us or any of our subsidiaries or ceding companies or (ii) any person who is related to any such person. In the event any holder of our shares or Equity Securities is in violation of these restrictions, our board of directors may require such holder to sell or allow us to repurchase some or all of such holder’s shares or Equity Securities at fair market value, as the board of directors and such holder agree in good faith, or to take any reasonable action that the board of directors deems appropriate.
Class A Common Shares
Our bye-laws generally provide that Class A common shareholders have one vote for each Class A common share held by them and are entitled to vote, on a non-cumulative basis, at all annual general and special meetings of shareholders with respect to matters on which Class A common shares are eligible to vote. The Class A common shares collectively represent 55% of the total voting power of our common shares, subject to certain voting restrictions and adjustments described herein. This allocation of 55% of the total voting power to the Class A common shares applies regardless of the number of Class A common shares that may be issued and outstanding.
Voting Restrictions of Class A Common Shares - Our Class A common shares may be subject to a cap of the voting power attributable to such shares or may be deemed to be non-voting depending upon whether a holder of such shares is subject to the restrictions set forth in our bye-laws described in this section below. These
274
Table of Contents
restrictions are applicable to certain holders only and such Class A common shares are not subject to such restrictions to the extent that our Class A common shares are held by persons not subject to such restrictions.
We have two primary voting restrictions over our Class A common shares:
| • | As described under “Risk Factors—Risks Relating to this Offering and an Investment in Our Class A Common Shares—Our bye-laws contain provisions that could discourage takeovers and business combinations that our shareholders might consider in their best interests, including provisions that prevent a holder of Class A common shares from having a significant stake in Athene,” our bye-laws prohibit holders of our Class A common shares and certain other classes of our common shares (other than those owned by the Apollo Group) from having more than 9.9% of the total voting power of our common shares. This limitation is intended to reduce the likelihood that AHL, ALRe or any of the German Group Companies will be treated as a CFC in any taxable year (other than for purposes of taking into account RPII). |
| • | Additionally, under our bye-laws, the voting rights exercisable by shareholders of the company other than members of the Apollo Group are limited so that Control Groups are deemed not to hold more than 9.9% of the total voting power conferred by our shares. In addition, our board of directors retains certain discretion to make adjustments to the aggregate number of votes attaching to the shares of any Control Group that they consider fair and reasonable in all the circumstances to ensure that such Control Group will not hold more than 9.9% of the total voting power represented by our then outstanding shares. The reduction in votes is generally to be applied proportionately among all shareholders who are members of the Control Group. A Control Group includes all shares directly owned by the shareholders within that Control Group and all shares directly owned by each other shareholder any of whose shares are included in the controlled shares of such person. Controlled shares means all Class A common shares that a person is deemed to own directly, indirectly, within the meaning of Section 958(a) of the Code, or constructively, within the meaning of Section 958(b) of the Code. |
The amount of any reduction of votes that occurs by operation of the above limitations will generally be reallocated proportionately among all other of our Class A common shareholders who were not members of these groups so long as such reallocation does not cause a Control Group to hold more than 9.9% of the total voting power of our shares.
In the event any of a shareholder’s Class A common shares are deemed to be non-voting, those non-voting Class A common shares will not be counted in determining the voting power of other Class A common shares. Furthermore, at such time when Class A common shares that have been deemed to be non-voting are transferred to a shareholder who (1) is not an owner, directly or indirectly, of Class B common shares, (2) does not hold an equity interest in Apollo or AAA, and (3) is not a member of the Apollo Group, such Class A common shares become full voting shares following such transfer. Such Class A common shares will, however, remain subject to the voting cutbacks described above.
Our bye-laws provide that our board of directors may determine that certain shares shall not carry voting rights or shall have reduced voting rights to the extent that the board reasonably determines, by the affirmative vote of a majority of the directors, that it is necessary to do so to avoid any adverse tax consequences or materially adverse legal or regulatory treatment to us, any of our subsidiaries or any shareholder or its affiliates.
We also have the authority under our bye-laws to request information from any shareholder for the purpose of determining whether a shareholder’s voting rights are to be reallocated pursuant to the bye-laws. If, after a reasonable cure period, a shareholder fails to respond to our request for information or submits incomplete or inaccurate information in response to a request by us, we in our reasonable discretion, may reduce or eliminate the shareholder’s voting rights.
275
Table of Contents
Pursuant to our bye-laws, the total voting power of Class A common shares held by members of our management and employees of the Apollo Group that are shareholders is limited to 3% of the total voting power of our common shares.
Any of the foregoing adjustments are likely to result in a shareholder having voting rights in excess of one vote per share. Therefore, a shareholder’s voting rights may increase above 5% of the aggregate voting power of the outstanding common shares, thereby possibly resulting in the shareholder becoming a reporting person subject to Schedule 13D or 13G filing requirements under the Exchange Act.
Class B Common Shares
Class B common shares represent, in aggregate, 45% of the total voting power of our common shares, subject to certain adjustments, as described herein. In general, only members of the Apollo Group may own Class B common shares. Because the Class B common shares are held only by entities that are controlled by Apollo and its affiliates, Apollo and its affiliates control the voting power of the Class B common shares, which may make it difficult for other shareholders to influence or control the company. See “Risk Factors—Risks Relating to this Offering and an Investment in Our Class A Common Shares—The interest of the Apollo Group, which controls and is expected to continue to control 45% of the total voting power of AHL and holds a number of the seats on our board of directors, may conflict with those of other shareholders and could make it more difficult for you and other shareholders to influence significant corporate decisions.” Any holder of Class B common shares that is a member of the Apollo Group may, with the consent of the holders of a supermajority of the Class B common shares, reduce the voting power attributable to its Class B common shares though certain transfers and/or the conversion of such holder’s Class B common shares to a new series or class of securities. In addition, prior to an Apollo Termination Event, any member of the Apollo Group may convert any or all of its Class B common shares into Class A common shares on a one-for-one basis.
AHL’s bye-laws also generally reduce the voting power of Class B common shares held by certain holders if (A) one or more U.S. persons that own (or are treated as owning) more than 9.9% of the total voting power of our common shares own (or are treated as owning) individually or in the aggregate more than 24.9% of the voting power or the value of our common shares or (B) a U.S. person that is classified as an individual, an estate or a trust for U.S. federal income tax purposes owns (or is treated as owning) more than 9.9% of the total voting power of our common shares. In certain circumstances, these limitations could result in a reduction of the total voting power of AHL represented by the Class B common shares (and a corresponding increase in the relative voting power of the Class A common shares).
Generally, members of the Apollo Group will not own Class A common shares. If a member of the Apollo Group elects to purchase Class A common shares from the company or another shareholder, such Class A common shares will ordinarily be deemed to be non-voting common shares unless such member designates those Class A common shares to constitute voting Class A common shares. This could have the effect of increasing control by members of the Apollo Group over the company and subjecting U.S. persons who own our common shares to materially adverse tax consequences. See “Risk Factors—Risks Relating to this Offering and an Investment in Our Class A Common Shares—U.S. persons who own our shares may have more difficulty in protecting their interests than U.S. persons who are shareholders of a U.S. corporation.”
Pursuant to our bye-laws, the holders of our Class B common shares, by a vote of a supermajority of the Class B common shares, may at any time and from time to time elect to reduce the percentage of the total voting power of AHL represented by the Class B common shares (and correspondingly increase the percentage of the total voting power of AHL represented by the Class A common shares, so that the total voting power of AHL remains equal to 100%).
Class M Common Shares
Until having vested and converted into Class A common shares, none of the Class M common shares have voting rights, except where required under Bermuda law. Notwithstanding the foregoing, in connection with any
276
Table of Contents
shareholder vote to approve a merger or amalgamation with respect to AHL, each vested and unvested Class M common share, and each non-voting Class A common share, shall have the power to vote in connection with such approval. Solely in connection with such a vote, the Class M common shares and the non-voting Class A common shares shall collectively represent 0.1% of the total voting power of AHL (such voting power to be allocated equally among the Class M common shares and the non-voting Class A common shares), with the total voting power attributable to each of the voting Class A common shares and Class B common shares being reduced by such percentage on a pro rated basis determined based on the total voting power of each such class.
Voting of Subsidiary Shares
AHL’s bye-laws require the board of AHL to refer certain decisions with respect to our non-U.S. subsidiaries to our shareholders, and to vote our shares accordingly. The decisions required to be referred to our shareholders by this provision include the appointment, removal or remuneration of directors of non-U.S. subsidiaries and any other decisions with respect to non-U.S. subsidiaries that legally require the approval of such non-U.S. subsidiary’s shareholders.
Rights upon Liquidation
In the event of a liquidation, dissolution or winding up of the company, holders of Class A common shares, Class B common shares and Class M common shares are entitled to share in the assets remaining after payment of liabilities and the liquidation preferences of any outstanding preferred stock, with the holders of Class A common shares, Class B common shares and vested Class M common shares (to the extent that an amount equal to the applicable conversion price associated with the relevant class of Class M common shares has been received by holders of the Class A common shares and Class B common shares) entitled to preferential distributions as set forth in our bye-laws.
Preference Shares
Pursuant to Bermuda law and our bye-laws, our board of directors may establish one or more series of preference shares having such designations, dividend rates, redemption features, liquidation rights and preferences, conversion or exchange rights, relative voting rights or such other special rights, qualifications, limitations or restrictions as may be fixed by the board without any further shareholder approval. Such rights, preferences, powers and limitations as may be established could have the effect of discouraging an attempt to obtain control of our company.
As of the date of this prospectus, we have not issued or authorized any preference shares.
Certain Bye-law Provisions
Certain provisions of our bye-laws may have an anti-takeover effect and may delay, defer or prevent a tender offer or takeover attempt that you might consider in your best interest, including an attempt that might result in your receipt of a premium over the market price for your shares. These provisions are also designed, in part, to encourage persons seeking to acquire control of us to first negotiate with our board of directors, which could result in an improvement of such persons’ terms. See “Risk Factors—Risks Relating to this Offering and an Investment in Our Class A Common Shares—Our bye-laws contain provisions that could discourage takeovers and business combinations that our shareholders might consider in their best interests, including provisions that prevent a holder of Class A common shares from having a significant stake in Athene” and “—Common Shares—Voting Rights.”
Classified Board of Directors
In accordance with the terms of our bye-laws, our board is classified as described under “Management—Corporate Governance—Classified Board of Directors.”
277
Table of Contents
Removal of Directors
Our bye-laws provide that a director may only be removed for cause by a majority of our board or shareholders holding a majority of the total voting power of our common shares at any general meeting.
Shareholder Action by Written Consent
Subject to certain exceptions, our bye-laws provide that shareholder action may be taken by written resolution, if such resolution is signed by or on behalf of, more than 55% of the total voting power of our common shares.
Shareholder Advance Notice Procedures
Our bye-laws establish advance notice procedures for shareholders to bring business before or to nominate directors at an annual meeting of our shareholders. Our bye-laws provide that any shareholder wishing to bring such business before or to nominate directors at an annual meeting must be a shareholder of record (1) meeting the minimum requirements set forth for eligible shareholders to submit shareholder proposals under Rule 14a-8 of the Exchange Act (a “minimum shareholder”), at the time of giving of notice and at the time of the meeting, (2) entitled to vote at the meeting and (3) who complies with the notice procedures set forth below. These requirements may have the effect of precluding the conduct of certain business at a meeting if the proper procedures are not followed. In addition, we expect that these provisions, insofar as they relate to the nomination of directors, may also discourage or deter a potential acquirer from conducting a solicitation of proxies to elect the acquirer’s own slate of directors or otherwise attempting to obtain control of our company.
To be timely, the shareholder’s notice to bring business before or to nominate directors at an annual meeting must be delivered to or mailed and received by us not less than 90 days nor more than 120 days before the anniversary date of the preceding annual meeting, except that if the annual meeting is set for a date that is not within 30 days before or after such anniversary date, we must receive the notice not later than the later of (1) the close of business 90 days prior to the date of such annual meeting or (2) if the first public announcement of the date of such advanced or delayed annual meeting is less than 100 days prior to such date, 10 days following the date of the first public announcement of the general meeting.
The notice must include the following information:
| • | the name and address of the shareholder who intends to make the nomination and either the name and address of the person or persons to be nominated or the nature of the business to be proposed; |
| • | the class and number of equity securities directly or indirectly owned by such shareholder or its affiliates and a description of any agreement, arrangement or understanding to which such shareholder is a party as of the date of such notice with respect to any equity securities or that has the effect or intent of mitigating loss to, managing the potential risk or benefit of share price changes for, or increasing or decreasing the voting power of such shareholder or its affiliates with respect to such equity securities; |
| • | a representation that the shareholder is a shareholder of record of our share capital entitled to vote at such meeting and intends to appear in person or by proxy at the meeting to nominate the person or persons or to introduce the business specified in the notice; |
| • | if applicable, a description of all arrangements or understandings between the shareholder and each nominee and any other person or persons, naming such person or persons, pursuant to which the nomination is to be made or business is to be proposed by the shareholder; |
| • | a representation whether the shareholder intends, or is part of a “group” (as defined in Rule 13d-5 of the Exchange Act) that intends, to deliver a proxy statement and/or form of proxy statement to holders of at least the percentage of common shares required to approve or adopt the proposal and/or to otherwise solicit proxies from other shareholders in support of such proposal; |
278
Table of Contents
| • | such other information regarding each nominee or each matter of business to be proposed by such shareholder as would be required to be included in a proxy statement filed under the SEC’s proxy rules if the nominee had been nominated or intended to be nominated, or the matter that had been proposed, or intended to be proposed by the board of directors; |
| • | if applicable, the consent of each nominee to serve as a director if elected; and |
| • | such other information that the board of directors may request in its discretion. |
Notwithstanding anything to the contrary, with respect to shareholder proposals, the notice requirements set forth in our bye-laws will be deemed satisfied by a shareholder if such shareholder has submitted a proposal to us in compliance with Rule 14a-8 of the Exchange Act and such proposal has been included in a proxy statement that has been prepared by us (provided that the shareholder has provided the information specified above). In addition, no business may be brought by a shareholder except in accordance with the above, and unless otherwise required by the rules of the NYSE, if a shareholder intending to bring business before a general meeting does not provide the timely notifications contemplated above or appear in person or by proxy, such business will not be transacted.
Corporate Opportunities
In recognition that members of the Apollo Group or members of its affiliates may serve as our directors and/or officers, and that the Apollo Group and its affiliates may engage in activities or lines of business similar to those in which we engage, our bye-laws provide for the allocation of certain corporate opportunities between us and the Apollo Group and its affiliates. Specifically, (i) no member of the Apollo Group or any affiliate of any member of the Apollo Group (other than us and our subsidiaries), (ii) no director or any affiliate of such director, and (iii) none of our officers, employees or agents, or any officer, director, employee or agent of any of our subsidiaries, who is also, and is presented such opportunity in his or her capacity as, an officer, director, employee, managing director, general or limited partner, manager, member, shareholder, agent or other affiliate of any member of the Apollo Group or of any affiliate of any member of the Apollo Group (other than us and our subsidiaries), in the cases of clauses (i), (ii) and (iii), excluding our Chief Executive Officer, has any duty to refrain from engaging, directly or indirectly, in the same or similar business activities or lines of business that we do. In the event that the Apollo Group or any of its affiliates acquires knowledge of a potential transaction or matter which may be a corporate opportunity for itself and us, we will not have any expectancy to such corporate opportunity, and the Apollo Group or members of its affiliates, as applicable, will not have any duty to communicate or offer such corporate opportunity to us and may pursue or acquire such corporate opportunity for itself or direct such opportunity to another person. In addition, if one of our directors who is also an officer, director, employee, managing director, general or limited partner, manager, member, shareholder, agent or other affiliate of any member of the Apollo Group or of any affiliate of any member of the Apollo Group (other than us and our subsidiaries) acquires knowledge of a potential transaction or matter which may be a corporate opportunity for us and the Apollo Group or its affiliates, we will not have any expectancy to such corporate opportunity unless such potential transaction or matter was presented to such director solely in his or her capacity as such.
By becoming a stockholder in our Company, you will be deemed to have notice of and consented to these provisions of our bye-laws.
Amendments to Memorandum of Association and Bye-laws
Amendments to our bye-laws require an affirmative vote of majority of our board and a majority of the voting power at any annual or special meeting of shareholders.
Meetings of Shareholders
Our annual general meeting will be held each year at such place, date and time as determined by the board. A special general meeting may be called upon the request of the Chairman, the Chief Executive Officer or a
279
Table of Contents
majority of the board. The Companies Act requires that shareholders be given at least five business days’ notice of a meeting, excluding the date the notice is given and the date of the meeting. In addition, upon receiving a requisition from holders of at least 10% of total voting power of our common shares, the board is required to convene a special general meeting. The presence in person or by proxy of holders of our common shares holding a majority of the voting power of the company at such meeting constitutes a quorum for the transaction of business at a general meeting.
Market Listing
We intend to apply to list our Class A common shares on the NYSE under the symbol “ATH.”
Transfer Agent and Registrar
Upon the completion of this offering, the transfer agent and registrar for our common shares will be Computershare Limited.
280
Table of Contents
DESCRIPTION OF CERTAIN INDEBTEDNESS
We borrow funds primarily to provide liquidity and for general corporate purposes, and we may in the future incur additional indebtedness. Our ability to borrow funds depends on a variety of factors including, but not limited to, the credit ratings of AHL and its insurance company subsidiaries, general macroeconomic conditions, capital levels, collateral availability and earnings. This section includes a description of certain indebtedness, including potential sources of liquidity; other indebtedness is described in our consolidated financial statements and notes thereto.
Credit Facility
On January 22, 2016, AHL, ALRe and Athene USA entered into the AHL Credit Agreement, with Citibank, N.A., as administrative agent (the “AHL Facility Administrative Agent”), pursuant to which AHL, ALRe and Athene USA (and any related borrowers from time to time party thereto) are entitled to incur, in the aggregate, up to $1 billion thereunder on a revolving basis. In connection with the AHL Credit Agreement, AHL, ALRe and Athene USA also entered into a Guaranty, dated as of January 22, 2016 (the “Guaranty”), with the AHL Facility Administrative Agent, pursuant to which (1) AHL and Athene USA each, on a joint and several basis, guaranteed all of the obligations of AHL, ALRe and Athene USA under and in respect of the AHL Credit Agreement and the other loan documents related thereto and (2) ALRe, on a joint and several basis with AHL and Athene USA, guaranteed certain of the obligations of AHL and Athene USA under and in respect of the AHL Credit Agreement and the other loan documents related thereto.
Interest accrues on outstanding borrowings under the AHL Credit Agreement at a rate per annum equal to either: (i) the Eurodollar Rate (as defined in the AHL Credit Agreement) plus a margin determined on a sliding scale from 1.125% to 2.50% based on the financial strength rating of AHL or (ii) the Base Rate (as defined in the AHL Credit Agreement) plus a margin determined on a sliding scale from 0.125% to 1.50% based on the financial strength rating of AHL. The borrowers under the AHL Credit Agreement will also be required to pay a fee on undrawn commitments on a sliding scale from 0.15% to 0.50% based on the financial strength rating of AHL.
The AHL Credit Agreement contains a number of customary representations and warranties, affirmative and negative covenants and events of default. Such covenants, among other things, restrict, subject to certain exceptions, the ability of AHL, ALRe, Athene USA and certain material subsidiaries of each to:
| • | incur additional indebtedness, make guarantees and enter into derivative arrangements; |
| • | create liens on our or such subsidiaries’ assets; |
| • | make fundamental changes; |
| • | engage in certain transactions with affiliates; |
| • | make changes in the nature of their business; and |
| • | pay dividends and distributions or repurchase common shares. |
The AHL Credit Agreement also contains covenants that require AHL to maintain (1) a ratio of Consolidated Adjusted Debt (as defined in the AHL Credit Agreement) to Consolidated Adjusted Capitalization (as defined in the AHL Credit Agreement) of not greater than 35% and (2) a minimum Consolidated Net Worth (as defined in the AHL Credit Agreement) of no less than the sum of $3.7 billion plus 50% of the net cash proceeds received from any equity issuances occurring after the date of the AHL Credit Agreement.
If an event of default occurs, the lenders under the AHL Credit Agreement will be entitled to take various actions, including the termination of the lenders’ commitments and the acceleration of amounts due thereunder. As of the date of this prospectus, AHL was in compliance with all covenants and no borrowings under the AHL Credit Agreement were outstanding.
281
Table of Contents
Repurchase Agreements
We have repurchase agreements in place with several bank counterparties in the normal course of business under which we can borrow funds for purposes of bridging liquidity gaps or for general corporate purposes. These facilities are non-committed facilities and are required to be secured by collateral. The bank counterparties under these non-committed facilities generally decide whether to lend to us based on our current credit risk, including our and our subsidiaries’ credit ratings, the types and quality of collateral that we have available to pledge and general macroeconomic conditions. If we are unable to access funds under these non-committed facilities, we may need to access other facilities, dispose of securities underlying such facilities or otherwise at prices that are not optimal to us or issue additional equity to raise additional funds. These actions may have an adverse effect on our financial condition, liquidity and cash flows and may be dilutive to your investment. See “Risk Factors—Risks Relating to Our Business—We may want or need additional capital in the future, and such capital may not be available to us on favorable terms or at all due to volatility in the equity or credit markets, adverse economic conditions or our creditworthiness.”
FHLB Advances
AAIA is a member of FHLBDM and ALIC is a member of FHLBI. Through their respective memberships, each has issued funding agreements to the respective FHLB in exchange for cash advances. The funding agreements are required to be fully collateralized, taking into account applicable discounts to the value of securities posted. ALIC is required to also collateralize any potential prepayment penalty that would be incurred if ALIC were to prepay the funding agreements prior to maturity. The funding agreement policies may not be accelerated by the holder unless there is a default under the agreement. Each of AAIA and ALIC may retire any or all of their respective funding agreements at any time, subject in certain instances to prepayment penalties.
AAIA and ALIC are required to maintain a collateral deposit that backs any funding agreements issued to the FHLBs, or advances or letters of credit issued by the FHLBs. AAIA and ALIC have the ability to obtain funding from the FHLBs based on a percentage of the value of their respective assets and are subject to the availability of eligible collateral, subject to certain limits. Furthermore, collateral is pledged based on the outstanding balances of FHLB advances, funding agreements and letters of credit. The amount varies based on the type, rating and maturity of the collateral posted to the FHLB. Market value fluctuations resulting from changes in interest rates, spreads and other risk factors for each type of assets are monitored and additional collateral is either pledged or released as needed.
On August 11, 2016 we provided notice to the FHLBI that ALIC is withdrawing its membership thereto. The FHLBI confirmed receipt of our request on the following day. Pursuant to the FHLBI’s capital plan, ALIC’s membership will be withdrawn as of the fifth anniversary of the FHLBI’s receipt of our notice. Until such time that ALIC’s membership is withdrawn, ALIC continues to have all of the rights and obligations of being a member of the FHLBI, except that with respect to some or all of the FHLBI stock that ALIC owns, we will be entitled to a lower dividend amount, to the extent that the FHLBI declares a dividend. ALIC may continue to borrow from the FHLBI, provided that without the consent of the FHLBI, the transaction must mature or otherwise terminate prior to ALIC’s withdrawal of membership.
As of September 30, 2016, our maximum credit capacity under the FHLBDM facility was $13.5 billion. However, our ability to borrow under the facility is constrained by the availability of assets that qualify as eligible collateral under the facility and by the Iowa Code requirement that we maintain funds equivalent to our legal reserve in certain permitted investments, from which we exclude pledged assets. Considering these limitations, we estimate that as of September 30, 2016, we had the ability to draw up to a total of approximately $4.7 billion, inclusive of borrowings then outstanding. Drawing such amounts would have an adverse impact on AAIA’s RBC ratio, which may further restrict our ability or willingness to draw up to our estimated capacity. Our ability to access the FHLBDM facility does not have a defined expiration date. Pursuant to the terms of the facility, we are able to access the facility as long as AAIA maintains a satisfactory level of creditworthiness
282
Table of Contents
based on FHLBDM’s credit assessment and meets the applicable collateral posting requirements. Amounts outstanding are included in interest sensitive contract liabilities in our consolidated balance sheet and the market value of assets that collateralize the FHLB funding agreements are included in AFS fixed maturity securities on the consolidated balance sheet. The following table provides certain information about the outstanding advances received from the respective FHLB (dollars in millions):
| September 30, 2016 | ||||||||||||||||||
| Borrowing Entity |
Advance Type | Aggregate Advance Amount |
Weighted Average Time to Maturity |
Weighted Average Interest Rate |
Aggregate Collateral Value |
|||||||||||||
| FHLBDM |
AAIA | Funding Agreement | $ | 686 | 1.24 years | 3.01% | $ | 1,085 | ||||||||||
| FHLBI |
ALIC | Funding Agreement | $ | 50 | 2.25 years | 3.08% | $ | 68 | ||||||||||
283
Table of Contents
COMPARISON OF SHAREHOLDER RIGHTS
Differences in Corporate Law
You should be aware that the Companies Act, which applies to us, differs in certain material respects from laws generally applicable to U.S. companies incorporated in the State of Delaware and their shareholders. The following is a summary of certain significant differences between the Companies Act (including modifications adopted pursuant to our bye-laws) and Bermuda common law applicable to us and our shareholders, on the one hand, and the provisions of the Delaware General Corporation Law applicable to U.S. companies organized under the laws of Delaware and their shareholders, on the other hand.
Duties of Directors
The Companies Act authorizes the directors of a company, subject to its bye-laws, to exercise all powers of the company except those that are required by the Companies Act or the company’s bye-laws to be exercised by the shareholders of the company. Our bye-laws provide that our business is to be generally managed and conducted by our board of directors. In accordance with Bermuda common law, members of a board of directors owe a fiduciary duty to the company to act in good faith in their dealings with or on behalf of the company and exercise their powers and fulfill the duties of their office honestly. This duty includes the following essential elements:
| • | a duty to act in good faith in the best interests of the company; |
| • | a duty not to make a personal profit from opportunities that arise from the office of director; |
| • | a duty to avoid situations in which there is an actual or potential conflict between a personal interest or the duties owed to third parties and/or the director’s duty to the company; and |
| • | a duty to exercise powers for the purpose for which such powers were intended. |
The Companies Act imposes a duty on directors and officers of a Bermuda company:
| • | to act honestly and in good faith with a view to the best interests of the company; and |
| • | to exercise the care, diligence and skill that a reasonably prudent person would exercise in comparable circumstances. |
The Companies Act also imposes various duties on directors and officers of a company with respect to certain matters of management and administration of the company.
Under Bermuda law, directors and officers generally owe fiduciary duties to the company itself, not to the company’s individual shareholders or members, creditors, or any class of either shareholders, members or creditors. Our shareholders may not have a direct cause of action against our directors.
Under Delaware law, the business and affairs of a corporation are managed by or under the direction of its board of directors. In exercising their powers, directors are charged with a fiduciary duty of care to protect the interests of the corporation and a fiduciary duty of loyalty to act in the best interests of its shareholders. The duty of care requires that a director act in good faith, with the care that an ordinarily prudent person would exercise under similar circumstances. Under this duty, a director must inform himself of, and disclose to shareholders, all material information reasonably available regarding a significant transaction. The duty of loyalty requires that a director act in a manner he reasonably believes to be in the best interests of the company. He must not use his corporate position for personal gain or advantage. This duty prohibits self-dealing by a director and mandates that the best interest of the company and its shareholders take precedence over any interest possessed by a director, officer or controlling shareholder and not shared by the shareholders generally. In general, actions of a director are presumed to have been made on an informed basis, in good faith and in the honest belief that the action taken was in the best interests of the corporation. However, this presumption may be rebutted by evidence
284
Table of Contents
of a breach of one of the fiduciary duties. Should such evidence be presented concerning a transaction by a director, a director must prove the procedural fairness of the transaction, and that the transaction was of fair value to the company.
Interested Directors
Bermuda law provides that a transaction entered into by us in which a director has an interest will not be voidable by us and such director will not be liable to us for any profit realized pursuant to such transaction as a result of such interest, provided the nature of the interest is disclosed at the first opportunity either at a meeting of directors or in writing to the directors. While we are not aware of any Bermuda case law on the meaning of “first opportunity,” a Bermuda court will likely employ a practical interpretation of those words. Subject to the rules of the NYSE and applicable U.S. securities laws, our bye-laws do not require directors to recuse themselves from any discussion or decision involving any contract or proposed contract or arrangement in which the director is directly or indirectly interested so long as the nature of the interest is disclosed, and such director may be counted in the quorum for such meeting.
Under Delaware law, such transaction would not be voidable if (1) the material facts as to such interested director’s relationship or interests are disclosed or are known to the board of directors and the board in good faith authorizes the transaction by the affirmative vote of a majority of the disinterested directors, (2) such material facts are disclosed or are known to the shareholders entitled to vote on such transaction and the transaction is specifically approved in good faith by vote of the majority of shares entitled to vote on the matter or (3) the transaction is fair as to the company as of the time it is authorized, approved or ratified. Under Delaware law, such interested director could be held liable for a transaction in which such director derived an improper personal benefit.
Voting Rights and Quorum Requirements
Under Bermuda law, the voting rights of our shareholders are regulated by our bye-laws and, in certain circumstances, the Companies Act. Generally, except as otherwise provided in the bye-laws or the Companies Act, any action or resolution requiring approval of the shareholders may be passed by a simple majority of votes cast.
Any individual who is a shareholder of our company and who is present at a meeting may vote in person, as may any corporate shareholder that is represented by a duly authorized representative at a meeting of shareholders. Our bye-laws also permit attendance at general meetings by proxy, provided the instrument appointing the proxy is in the form specified in the bye-laws or such other form as the board may determine. The specific voting rights of our common shares are set forth in detail under “Description of Share Capital—Common Shares—Voting Rights.”
Under Delaware law, unless otherwise provided in a company’s certificate of incorporation, each shareholder is entitled to one vote for each share of stock held by the shareholder. Delaware law provides that unless otherwise provided in a company’s certificate of incorporation or bylaws, a majority of the shares entitled to vote, present in person or represented by proxy, constitutes a quorum at a meeting of shareholders. In matters other than the election of directors, with the exception of special voting requirements related to extraordinary transactions, and unless otherwise provided in a company’s certificate of incorporation or bylaws, the affirmative vote of a majority of shares present in person or represented by proxy and entitled to vote at a meeting in which a quorum is present is required for shareholder action, and the affirmative vote of a plurality of shares present in person or represented by proxy and entitled to vote at the meeting is required for the election of directors.
Amalgamations, Mergers and Similar Arrangements
The amalgamation or merger of a Bermuda company with another company or corporation (other than certain affiliated companies) requires the amalgamation or merger agreement to be approved by the company’s
285
Table of Contents
board of directors and by its shareholders. Unless the company’s bye-laws provide otherwise, the approval of 75% of the shareholders voting at such meeting is required to approve the amalgamation or merger agreement, and the quorum for such meeting must be two persons holding or representing more than one-third of the issued shares of the company. Our bye-laws provide that a majority of the total voting power of the common shares of the company is required to approve an amalgamation or merger.
Under Bermuda law, in the event of an amalgamation or merger of a Bermuda company with another company or corporation, including a public Bermuda company, a shareholder of the Bermuda company who did not vote in favor of the amalgamation or merger and is not satisfied that fair value has been offered for such shareholder’s shares may, within one month of notice of the shareholders meeting, apply to the Supreme Court of Bermuda to appraise the fair value of those shares.
Under Delaware law, with certain exceptions, a merger, consolidation or sale of all or substantially all the assets of a corporation must be approved by the board of directors and a majority of the issued and outstanding shares entitled to vote on such transaction. A shareholder of a company participating in certain merger and consolidation transactions may, under certain circumstances, be entitled to appraisal rights, such as having a court to determine the fair value of the stock or requiring the company to pay such value in cash. However, such appraisal right is not available to shareholders if the stock received in such transaction is listed on a national securities exchange, including either the NYSE or the Nasdaq Global Market.
Acquisitions
Under Bermuda law, an acquiring party is generally able to acquire compulsorily the common shares of minority holders of a company in the following ways:
| • | By a procedure under the Companies Act known as a “scheme of arrangement.” A scheme of arrangement could be effected by obtaining the agreement of the company and of holders of common shares, representing in the aggregate a majority in number and at least 75% in value of the common shareholders present and voting at a court ordered meeting held to consider the scheme of arrangement. The scheme of arrangement must then be sanctioned by the Bermuda Supreme Court. If a scheme of arrangement receives all necessary agreements and sanctions, upon the filing of the court order with the Registrar of Companies in Bermuda, all holders of common shares could be compelled to sell their shares under the terms of the scheme of arrangement. |
| • | By acquiring pursuant to a tender offer 90% of the shares or class of shares not already owned by, or by a nominee for, the acquiring party (the offeror), or any of its subsidiaries. If an offeror has, within four months after the making of an offer for all the shares or class of shares not owned by, or by a nominee for, the offeror, or any of its subsidiaries, obtained the approval of the holders of 90% or more of all the shares to which the offer relates, the offeror may, at any time within two months beginning with the date on which the approval was obtained, by notice compulsorily acquire the shares of any non-tendering shareholder on the same terms as the original offer unless the Supreme Court of Bermuda (on application made within a one-month period from the date of the offeror’s notice of its intention to acquire such shares) orders otherwise. |
| • | Where the acquiring party or parties hold not less than 95% of the shares or a class of shares of the company, by acquiring, pursuant to a notice given to the remaining shareholders or class of shareholders, the shares of such remaining shareholders or class of shareholders. When this notice is given, the acquiring party is entitled and bound to acquire the shares of the remaining shareholders on the terms set out in the notice, unless a remaining shareholder, within one month of receiving such notice, applies to the Supreme Court of Bermuda for an appraisal of the value of their shares. This provision only applies where the acquiring party offers the same terms to all holders of shares whose shares are being acquired. |
Delaware law provides that a parent corporation, by resolution of its board of directors and without any shareholder vote, may merge with any subsidiary of which it owns at least 90% of each class of its capital stock.
286
Table of Contents
Upon any such merger, and in the event the parent corporation does not own all of the stock of the subsidiary, dissenting shareholders of the subsidiary are entitled to certain appraisal rights. Delaware law also provides, subject to certain exceptions, that if a person acquires 15% of voting stock of a company, the person is an “interested shareholder” and may not engage in “business combinations” with the company for a period of three years from the time the person acquired 15% or more of voting stock.
Shareholders’ Suits
Class actions and derivative actions are generally not available to shareholders under Bermuda law. The Bermuda courts, however, would ordinarily be expected to permit a shareholder to commence an action in the name of a company to remedy a wrong to the company where the act complained of is alleged to be beyond the corporate power of the company or illegal, or would result in the violation of the company’s memorandum of association or bye-laws, including any breach of fiduciary duty claims in cases where the actions from which such claims arise have not been ratified by a majority of the shareholders.
Furthermore, consideration would be given by a Bermuda court to acts that are alleged to constitute a fraud against the minority shareholders or, for instance, where an act requires the approval of a greater percentage of the company’s shareholders than that which actually approved it.
When the affairs of a company are being conducted in a manner which is oppressive or prejudicial to the interests of some part of the shareholders, one or more shareholders may apply to the Supreme Court of Bermuda, which may make such order as it sees fit, including an order regulating the conduct of the company’s affairs in the future or ordering the purchase of the shares of any shareholders by other shareholders or by the company.
Class actions and derivative actions generally are available to shareholders under Delaware law for, among other things, breach of fiduciary duty, corporate waste and actions not taken in accordance with applicable law. In such actions, the court generally has discretion to permit the winning party to recover attorneys’ fees incurred in connection with such action.
Pursuant to our bye-laws, any suit that arises concerning the Companies Act or out of or in connection with our bye-laws shall be subject to the exclusive jurisdiction of the Supreme Court of Bermuda.
Indemnification of Directors and Officers
Section 98 of the Companies Act provides generally that a Bermuda company may indemnify its directors, officers and auditors against any liability which by virtue of any rule of law would otherwise be imposed on them in respect of any negligence, default, breach of duty or breach of trust, except in cases where such liability arises from fraud or dishonesty of which such director, officer or auditor may be guilty in relation to the company. Section 98 further provides that a Bermuda company may indemnify its directors, officers and auditors against any liability incurred by them in defending any proceedings, whether civil or criminal, in which judgment is awarded in their favor or in which they are acquitted or granted relief by the Supreme Court of Bermuda pursuant to Section 281 of the Companies Act. Section 98 of the Companies Act further provides that a company may advance moneys to an officer or auditor for the costs, charges and expenses incurred by the officer or auditor in defending any civil or criminal proceedings against them, on condition that the officer or auditor shall repay the advance if any allegation of fraud or dishonesty is proved against them.
We have adopted provisions in our bye-laws that provide that we shall indemnify our officers and directors (subject to certain exceptions for fraud and/or dishonesty). Section 98A of the Companies Act permits us to purchase and maintain insurance for the benefit of any officer or director in respect of any loss or liability attaching to him in respect of any negligence, default, breach of duty or breach of trust, whether or not we may otherwise indemnify such officer or director. We have purchased and maintain a directors’ and officers’ liability policy for this purpose.
287
Table of Contents
Pursuant to our bye-laws, our shareholders have agreed to waive any claim or right of action such shareholder may have, whether individually or by or in right of AHL, against any director or officer of AHL on account of any action taken by such director or officer, or the failure of such director or officer to take any action in the performance of his or her duties with or for AHL or any subsidiary of AHL; provided that such waiver does not extend to any matter in respect of any fraud or dishonesty which may attach to such director or officer.
Under Delaware law, a corporation may include in its certificate of incorporation a provision that, subject to the limitations described below, eliminates or limits director liability to the corporation or its shareholders for monetary damages for breaches of their fiduciary duty of care. Under Delaware law, a director’s liability cannot be eliminated or limited for (1) breaches of the duty of loyalty, (2) acts or omissions not in good faith or that involve intentional misconduct or a knowing violation of law, (3) the payment of unlawful dividends or expenditure of funds for unlawful stock purchases or redemptions or (4) transactions from which such director derived an improper personal benefit.
Delaware law provides that a corporation may indemnify a director, officer, employee or agent of the corporation against any liability or expenses incurred in any civil, criminal, administrative or investigative proceeding if they acted in good faith and in a manner they reasonably believed to be in or not opposed to the best interests of the corporation and, with respect to any criminal proceeding, had no reasonable cause to believe their conduct was unlawful, except that in any action brought by or in the right of the corporation, such indemnification may be made only for expenses (not judgments or amounts paid in settlement) and may not be made even for expenses if the officer, director or other person is adjudged liable to the corporation (unless otherwise determined by the court). In addition, under Delaware law, to the extent that a director or officer of a corporation has been successful on the merits or otherwise in defense of any proceeding referred to above, he or she must be indemnified against expenses (including attorneys’ fees) actually and reasonably incurred by that party. Furthermore, under Delaware law, a corporation is permitted to maintain directors’ and officers’ insurance.
Special Meeting of Shareholders
Under our bye-laws, a special general meeting of shareholders may be called upon the request of our Chairman, our Chief Executive Officer or our board of directors. In addition, upon receiving a requisition from holders of common shares representing at least ten percent (10%) of the total voting power of our common shares, the board will convene a special general meeting.
Delaware law permits the board of directors or any person who is authorized under a corporation’s certificate of incorporation or bylaws to call a special meeting of shareholders.
Notice of Shareholder Meetings
Bermuda law requires that shareholders be given at least five days’ advance notice of any general meeting and our bye-laws provide that not less than 21 days’ notice nor more than 60 days’ advance notice be provided. Under Delaware law, a company is generally required to give written notice of any meeting not less than 10 days nor more than 60 days before the date of the meeting to each shareholder entitled to vote at the meeting.
Dividends and Other Distributions
Under Bermuda law, a company may not declare or pay a dividend, or make a distribution out of contributed surplus, if there are reasonable grounds for believing that (1) the company is, or would after the payment be, unable to pay its liabilities as they become due; or (2) the realizable value of the company’s assets would thereby be less than its liabilities. “Contributed surplus” is defined for purposes of Section 54 of the Companies Act to include the proceeds arising from donated shares, credits resulting from the redemption or conversion of shares at less than the amount set up as nominal capital and donations of cash and other assets to the company.
288
Table of Contents
Under Delaware law, subject to any restrictions contained in the company’s certificate of incorporation, a company may pay dividends out of surplus or, if there is no surplus, out of net profits for the fiscal year in which the dividend is declared and for the preceding fiscal year. Delaware law also provides that dividends may not be paid out of net profits if, after the payment of the dividend, capital is less than the capital represented by the outstanding stock of all classes having a preference upon the distribution of assets.
Inspection of Corporate Records
Members of the general public have the right to inspect our public documents available at the office of the Registrar of Companies in Bermuda and our registered office in Bermuda, which will include our memorandum of association (including its objects and powers) and certain alterations to our memorandum of association. Our shareholders have the additional right to inspect our bye-laws, minutes of general meetings and audited financial statements, which must be presented to the annual general meeting of shareholders.
The register of members of a company is also open to inspection by shareholders and members of the general public without charge. The register of members is required to be open for inspection for not less than two hours in any business day (subject to the ability of a company to close the register of members for not more than 30 days in a year). A company is required to maintain its share register in Bermuda but may, subject to the provisions of the Companies Act, establish a branch register outside of Bermuda. A company is required to keep at its registered office a register of directors and officers. Bermuda law does not, however, provide a general right for shareholders to inspect or obtain copies of any other corporate records.
Delaware law requires that a company, within 10 days before a meeting of shareholders, prepare and make available a complete list of shareholders entitled to vote at the meeting. This list must be open to the examination of any shareholder for any purpose relating to the meeting for a period of at least 10 days prior to the meeting during ordinary business hours and at the principal place of business of the company. Delaware law also permits a shareholder to inspect the company’s books and records if the shareholder can establish that he or she is a shareholder of the company, the shareholder has complied with Delaware law with respect to the form and manner of making demand for inspection of corporate records and the inspection by the shareholder is for a proper purpose.
Shareholder Proposals
Under Bermuda law, shareholders may, as set forth below and at their own expense (unless the company otherwise resolves), require the company to: (1) give notice to all shareholders entitled to receive notice of the annual general meeting of any resolution that the shareholders may properly move at the next annual general meeting; and/or (2) circulate to all shareholders entitled to receive notice of any general meeting a statement in respect of any matter referred to in any proposed resolution or any business to be conducted at such general meeting. The specific procedures under our bye-laws governing shareholder proposals in relation to our company are set forth under “Description of Share Capital—Certain Bye-law Provisions—Shareholder Advance Notice Procedures.”
Delaware law does not include a provision restricting the manner in which nominations for directors may be made by shareholders or the manner in which business may be brought before a meeting, although restrictions may be included in a Delaware corporation’s certificate of incorporation or bylaws.
Amendment of Memorandum of Association/Certificate of Incorporation
Bermuda law provides that the memorandum of association of a company may be amended by a resolution passed at a general meeting of shareholders of which due notice has been given. Certain amendments to the memorandum of association may require approval of the Minister, who may grant or withhold approval at his or her discretion.
289
Table of Contents
Under Bermuda law, the holders of an aggregate of not less than 20% in par value of a company’s issued and outstanding share capital have the right to apply to the Bermuda courts for an annulment of any amendment of the memorandum of association adopted by shareholders at any general meeting, other than an amendment which alters or reduces a company’s share capital as provided in the Companies Act. Where such an application is made, the amendment becomes effective only to the extent that it is confirmed by the Bermuda court. An application for an annulment of an amendment of the memorandum of association must be made within 21 days after the date on which the resolution altering the company’s memorandum of association is passed and may be made on behalf of persons entitled to make the application by one or more of their designees as such holders may appoint in writing for such purpose. No application may be made by the shareholders voting in favor of the amendment.
Under Delaware law, amendment of the certificate of incorporation, which is the equivalent of a memorandum of association, of a company must be made by a resolution of the board of directors setting forth the amendment, declaring its advisability, and either calling a special meeting of the shareholders entitled to vote or directing that the proposed amendment be considered at the next annual meeting of the shareholders. Delaware law requires that, unless a greater percentage is provided for in the certificate of incorporation, a majority of the outstanding voting power of the corporation is required to approve the amendment of the certificate of incorporation at the shareholders’ meeting. If the amendment would alter the number of authorized shares or par value or otherwise adversely affect the powers, preferences or special rights of any class of a company’s stock, the holders of the issued and outstanding shares of such affected class, regardless of whether such holders are entitled to vote by the certificate of incorporation, are entitled to vote as a class upon the proposed amendment. However, the number of authorized shares of any class may be increased or decreased, to the extent not falling below the number of shares then outstanding, by the affirmative vote of the holders of a majority of the stock entitled to vote, if so provided in the company’s original certificate of incorporation.
Amendment of Bye-laws
Our bye-laws provide that the bye-laws may only be amended upon a resolution approved by a majority of the board and a resolution approved by a majority of the shareholders of the company. In addition, no amendment to the bye-laws may be made which would materially, adversely and disproportionately affect the rights, obligations, powers or preferences of any class of common shares without similarly affecting the rights, obligations, powers or preferences of all other classes of common shares without the majority vote of the shares constituting such class so affected.
Under Delaware law, unless the certificate of incorporation or bylaws provide for a different vote, holders of a majority of the voting power of a corporation and, if so provided in the certificate of incorporation, the directors of the corporation have the power to adopt, amend and repeal the bylaws of a corporation.
Dissolution
Under Bermuda law, a solvent company may be wound up by way of a shareholders’ voluntary liquidation. Prior to the company entering liquidation, a majority of the directors are each required to make a statutory declaration, which states that the directors have made a full inquiry into the affairs of the company and have formed the opinion that the company will be able to pay its debts within a period of 12 months of the commencement of the winding up and must file the statutory declaration with the Bermuda Registrar of Companies. The general meeting is required to be convened primarily for the purposes of passing a resolution that the company be wound up voluntarily and appointing a liquidator. The winding up of the company is deemed to commence at the time of the passing of the resolution.
Under Delaware law, a corporation may voluntarily dissolve (1) if a majority of the board of directors adopts a resolution to that effect and the holders of a majority of the issued and outstanding shares entitled to vote thereon vote for such dissolution; or (2) if all shareholders entitled to vote thereon consent in writing to such dissolution.
290
Table of Contents
SHARES ELIGIBLE FOR FUTURE SALE
Prior to this offering, there has been no public market for our Class A common shares. Future sales of substantial amounts of our Class A common shares in the public market, or the perception that such sales may occur, could adversely affect the prevailing market price of our Class A common shares and could impair our ability to raise capital through the sale of our equity securities. See “Risk Factors—Risks Relating to this Offering and an Investment in Our Class A Common Shares—There is currently no market for our Class A common shares, an active trading market may not develop or continue to be liquid and the market price of our common shares may be volatile.” No prediction can be made as to the effect, if any, future sales of shares, including as a result of the conversion of Class B common shares and Class M common shares into Class A common shares, or the availability of shares for future sales, will have on the market price of our Class A common shares prevailing from time to time.
Sale of Restricted Shares
Upon the closing of this offering, we will have outstanding an aggregate of approximately Class A common shares and approximately 135,963,975 Class B common shares, each of which is convertible at any time at the option of the holder, with notice to the company, into Class A common shares on a one to one basis. In addition, we will have outstanding an aggregate of approximately 11,863,197 Class M common shares as of the closing of this offering. Of these Class M common shares, will have vested at or prior to the closing of this offering and approximately will vest over the next four years. Class M common shares are convertible into Class A common shares under certain circumstances described under “Description of Share Capital—Common Shares—Class M Common Shares—Conversion to Class A Common Shares.”
Of the outstanding shares, the Class A common shares sold in this offering will be freely tradable without restriction or further registration under the Securities Act, except that any shares of such class acquired by our affiliates, as that term is defined under Rule 144 of the Securities Act, may be sold only in compliance with the limitations described below. The remaining outstanding Class A common shares and all of our Class B common shares will be deemed restricted securities, as defined under Rule 144. Restricted securities may be sold in the public market only if registered or if they qualify for an exemption from registration, generally under Rules 144 or 701 under the Securities Act, which we summarize below. All of these shares will be subject to lock-up agreements described below.
Rule 144
In general, under Rule 144, beginning 90 days after the date of this prospectus, and subject to the lock-up agreements described below, a person who is not our affiliate and has not been our affiliate at any time during the preceding three months will be entitled to sell any Class A common shares that such person has beneficially owned for at least six months, including the holding period of any prior owner other than one of our affiliates, without regard to volume limitations subject only to the availability of current public information about us (which requirement will cease to apply after such person has beneficially owned such shares for at least 12 months).
Approximately of our outstanding Class A common shares that are not subject to the lock-up agreements described below will be eligible for sale under Rule 144 immediately upon the closing of this offering.
Without giving effect to any lock-up agreements, beginning 90 days after the date of this prospectus, our affiliates who have beneficially owned our Class A common shares for at least six months, including the holding period of any prior owner other than one of our affiliates, would be entitled to sell within any three-month period a number of shares that does not exceed the greater of:
| • | 1% of the number of Class A common shares then outstanding, which will equal approximately shares immediately after this offering; and |
291
Table of Contents
| • | the average weekly trading volume in our Class A common shares on the NYSE during the four calendar weeks preceding the date of filing of a Notice of Proposed Sale of Securities Pursuant to Rule 144 with respect to the sale. |
Sales under Rule 144 by our affiliates are also subject to manner of sale provisions and notice requirements and to the availability of current public information about us.
Rule 701
In general, under Rule 701 as currently in effect, any of our employees, directors, officers, consultants or advisors who purchase shares from us in connection with a compensatory stock or option plan or other written agreement before the effective date of this offering is entitled to sell such shares 90 days after the effective date of this offering in reliance on Rule 144, in the case of affiliates, without having to comply with the holding period requirements of Rule 144 and, in the case of non-affiliates, without having to comply with the public information or holding period requirements of Rule 144. However, substantially all Rule 701 shares are subject to lock-up agreements as described below.
Stock Plans
We will file registration statements on Form S-8 under the Securities Act from time to time in order to register Class A common shares issuable or convertible from Class M common shares under our 2009, 2012 and 2014 Share Incentive Plans. Subject to lock-up agreements, these registration statements are expected to be filed as soon as practicable after the date of this prospectus. As a result, shares issued pursuant to such plan will be eligible for resale in the public market without restriction, subject to the Rule 144 limitations applicable to affiliates, and the lock-up period, as applicable, described above.
Registration Rights
In 2014, we completed a private placement of Class A and Class B common shares. In connection with such private placement, we entered into a Registration Rights Agreement with all holders of our Class A and Class B common shares (including all holders of any our capital stock convertible into the Class A common shares). Under the Registration Rights Agreement, after the expiration of the respective lock-up periods and subject to certain exceptions:
| • | holders of greater than 10% of our Class A common shares (and any Class A common shares issuable upon conversion of our other capital stock) are entitled to an unlimited number of demands that we file and have declared effective a registration statement registering the sale of the shares that they own; and |
| • | holders of greater than 5% and less than 10% of our Class A common shares (and any Class A common shares issuable upon conversion of our other capital stock) are entitled to two demands that we file and have declared effective a registration statement registering the sale of the shares that they own. |
Additionally, certain holders under the Registration Rights Agreement are entitled to “piggyback” registration rights exercisable at certain times that allow them to include their shares of our Class A common shares (and any Class A common shares issuable upon conversion of our other capital stock) that they own in any public offering of equity securities initiated by us for our own account or the account of others (other than those public offerings pursuant to registration statements on forms that do not permit registration for resale by them). These “piggyback” registration rights are not available with respect to any shares of our Class A common shares (and any Class A common shares issuable upon conversion of our other capital stock) held by such investors or purchasers which are eligible for resale pursuant to certain exemptions from registration under the Securities Act or that are the subject of a then-effective registration statement.
If all of the current holders of our common shares that currently have rights to cause us to register the offer and sale of their shares sell them after the expiration of the respective lock-up periods, the market price of our common shares could substantially decline.
292
Table of Contents
Lock-Up Agreements
Certain existing shareholders (other than certain executive officers, directors and certain Apollo shareholders) are selling a number of their Class A common shares in this offering. Such selling shareholders who own Class B common shares will have their Class B common shares that are sold in this offering automatically converted into Class A common shares immediately prior to sale in this offering. On November 8, 2016, AAA announced the declaration of a conditional distribution of common shares of Athene held by AAA to its unitholders. On November 7, 2016, the board of directors of the general partner of AAA approved a conditional distribution of 10,766,297 Athene Class B common shares in the aggregate, constituting 12.5% of the total 86,130,377 of Class B common shares beneficially owned by AAA. The distribution is conditional upon the occurrence of this offering. The Class B common shares distributed by AAA will automatically become Class A common shares upon distribution to unitholders unless a unitholder is a member of the Apollo Group. If AAA does not sell any of its remaining Class B common shares as part of this initial public offering, then we expect AAA, upon the expiration of each lock-up period described below, to convert its released Class B common shares into Class A common shares and then distribute such Class A common shares to its own shareholders. Except with respect to certain significant holders of equity of AAA that are also our shareholders, holders of equity of AAA are generally not subject to a lock-up with respect to their interests in AAA.
Our directors, executive officers and shareholders holding 100% of our common shares at the time of our private placement in 2014 agreed that they will not sell any shares prior to the expiration of certain time periods after the date of this prospectus. “Lock-up” expiration periods applicable to existing holders end with respect to one-third of the shares owned by such holders at each of 225 days, 375 days and 450 days after the date of this prospectus, provided that certain of our shareholders, executive officers, directors and current and former employees representing approximately % and % of our common shares have agreed not to sell any shares for 450 days and two years, respectively, from the date of this prospectus. Approximately , , and of our common shares will be eligible for future sale at the expiration of such 225 day, 375 day, 450 day and two-year periods, respectively. These restrictions are subject to waiver by our board of directors, including in the event holders are permitted to sell their shares in follow-on registered offerings by us after the date of this initial public offering. As these lock-up periods end, the market price of our common shares could decline if the holders of those shares sell them or are perceived by the market as intending to sell them. Additionally, existing holders of our common shares have registration rights under the Registration Rights Agreement, subject to some conditions, which require us to file registration statements covering the sale of their shares or to include their shares in registration statements that we may file for ourselves or other shareholders in the future.
293
Table of Contents
The following is a discussion of material Bermuda and U.S. federal income tax considerations that may be relevant to a prospective investor considering an investment in our Class A common shares in connection with this offering.
Bermuda Tax Considerations
At the present time, there is no Bermuda income or profits tax, withholding tax, capital gains tax, capital transfer tax, estate duty or inheritance tax payable by us or by our shareholders in respect of our shares. We have obtained an assurance from the Minister under the Exempted Undertakings Tax Protection Act 1966 that, in the event that any legislation is enacted in Bermuda imposing any tax computed on profits or income, or computed on any capital asset, gain or appreciation or any tax in the nature of estate duty or inheritance tax, such tax shall not, until March 31, 2035, be applicable to us or to any of our operations or to our shares, debentures or other obligations except insofar as such tax applies to persons ordinarily residing in Bermuda or is payable by us in respect of real property owned or leased by us in Bermuda.
U.S. Federal Income Tax Considerations
The following is a general discussion of the material U.S. federal income tax considerations relating to the ownership and disposition of our Class A common shares purchased in this offering. The statements of law or legal conclusions as to matters of U.S. federal income tax law included in this discussion are, subject to the limitations, qualifications and assumptions set forth below, the opinion of our counsel, Sidley Austin LLP. Statements herein regarding the beliefs, expectations and intentions of the company represent the view of management and do not represent the opinions of counsel. The discussion is based on the Code, U.S. Treasury regulations, judicial decisions, administrative pronouncements and the income tax treaty between the United States and Bermuda (the “Bermuda Treaty”), all as currently in effect. Such authorities are subject to change, possibly with retroactive effect. Any such change could result in U.S. federal income tax consequences that are materially different from those described below. Moreover, any change after this offering in any of the factual matters set forth in this prospectus or in the conduct, practices or activities of the company may affect the considerations discussed below. We are under no obligation to update the discussion to reflect future changes in law or changes in any of the foregoing factual matters that may later come to our attention.
This discussion does not address all aspects of U.S. federal income taxation that may be relevant to all prospective investors, some of which, such as dealers in securities, banks, thrifts or other financial institutions, insurance companies, regulated investment companies, tax-exempt organizations, U.S. expatriates, non-U.S. persons who are engaged in a trade or business in the United States, persons that hold our common shares as part of a straddle, conversion transaction or hedge, persons deemed to sell our common shares under the constructive sale provisions of the Code, investors that are subject to the alternative minimum tax, investors whose functional currency is not the U.S. dollar, investors that are treated as partnerships for U.S. federal income tax purposes, investors that are not the beneficial owners of our common shares, and investors that own, actually or under applicable constructive ownership rules, 10% or more of our common shares, may be subject to special rules. This discussion deals only with holders who purchase Class A common shares in connection with this offering and hold the Class A common shares as a capital asset (within the meaning of Section 1221 of the Code) and does not deal with investors that also own Class B or Class M common shares. If an entity treated as a partnership for U.S. federal income tax purposes holds our common shares, the U.S. federal income tax treatment of a partner of the partnership will depend on the status of the partner and the activities of the partnership. If you are a partner of a partnership holding common shares, you are urged to consult your tax adviser regarding the consequences to you of the partnership’s ownership and disposition of our common shares.
This discussion does not address any U.S. federal tax laws other than U.S. federal income tax laws, any U.S. state or local tax laws or any non-U.S. tax laws. You are encouraged to consult your tax advisers concerning the
294
Table of Contents
overall tax consequences arising in your own particular situation under U.S. federal, state, local and non-U.S. laws from the ownership and disposition of our common shares. The conclusions expressed in the discussion below are not binding on the IRS or any court, and there is no assurance that the IRS or a court would not reach a contrary conclusion. No ruling has been or will be sought from the IRS regarding any matter discussed in this prospectus.
Taxation of AHL and ALRe
In general, a non-U.S. corporation is subject to U.S. federal income tax on its taxable income which is effectively connected with the conduct of a trade or business in the United States, including a branch profits tax based upon its after-tax effectively connected earnings and profits, with certain adjustments. We currently intend to limit our U.S. activities so that AHL and ALRe are not considered to be engaged in a U.S. trade or business. No definitive standards, however, are provided by the Code, U.S. Treasury regulations or court decisions regarding when a foreign corporation is engaged in the conduct of a U.S. trade or business. Because the law is unclear, and the determination is highly factual and must be made annually, there is no assurance that the IRS will not contend that one or both of AHL or ALRe is engaged in a U.S. trade or business. If AHL or ALRe were found to be so engaged, it would be subject to U.S. federal income tax at regular corporate rates (currently up to 35%) and a 30% branch profits tax, except as described below with respect to the Bermuda Treaty. A non-U.S. corporation is generally entitled to deductions and credits only if it timely files a U.S. federal income tax return. AHL and ALRe have in the past filed, and intend to continue to file, such returns on a protective basis for each tax year. U.S. federal income tax, if imposed, would be based on effectively connected income and computed in a manner generally analogous to that applied to the income of a U.S. corporation.
Bermuda Treaty Benefits
If ALRe is entitled to the benefits of the Bermuda Treaty for a given taxable year, it will not be subject to U.S. federal income tax on certain of its business profits for that year unless those business profits are attributable to a permanent establishment in the United States. ALRe currently intends to conduct its activities in such a manner as to avoid having a permanent establishment in the United States, but because the determination of whether a person has a permanent establishment in the United States is highly factual, and must be made annually, there can be no assurances that it will be successful in that regard.
An insurance enterprise resident in Bermuda whose shares are not traded on an exchange will be entitled to the benefits of the Bermuda Treaty only if (1) more than 50% of its shares are beneficially owned, directly or indirectly, by any combination of individual residents of the United States or Bermuda or U.S. citizens and (2) its income is not used in substantial part, directly or indirectly, to make certain disproportionate distributions to, or to meet certain liabilities of, persons who are neither residents of the United States or Bermuda nor U.S. citizens. It cannot be predicted whether ALRe will take the position in any particular year that it qualifies for the benefits of the Bermuda Treaty because it cannot be predicted whether its direct or indirect ownership will satisfy the requirements described above.
Net Investment Income
Non-U.S. insurance companies carrying on an insurance business within the United States are treated under the Code as having a certain minimum amount of effectively connected net investment income, determined in accordance with a formula that depends, in part, on the amount of U.S. risk insured or reinsured by such companies. If, contrary to the company’s intention, ALRe is considered to be engaged in the conduct of an insurance business in the United States and is not entitled to the benefits of the Bermuda Treaty, a significant portion of ALRe’s investment income could be subject to U.S. federal income tax. In addition, while the Bermuda Treaty clearly applies to premium income, it is uncertain whether it applies to other income such as investment income. Because the law is not clear, there is no assurance that if ALRe is considered to be engaged in the conduct of an insurance business in the United States, a significant portion of ALRe’s investment income would not be subject to U.S. federal income tax (including branch profits tax), even if ALRe is entitled to the benefits of the Bermuda Treaty.
295
Table of Contents
Withholding Tax
Non-U.S. corporations not engaged in a trade or business in the United States generally are subject to a 30% U.S. federal income tax (imposed on a gross basis and generally collected by withholding) on certain “fixed or determinable annual or periodical gains, profits and income” from sources within the United States. Such income includes certain distributions from U.S. corporations and certain interest on investments but does not include insurance premiums paid with respect to a contract that is subject to the excise tax described below. Because, as discussed above, it is uncertain whether the Bermuda Treaty applies to investment income, it is unclear whether the Bermuda Treaty would provide any relief from this tax, even if ALRe is entitled to the benefits of the Bermuda Treaty. If any of AHL’s U.S. subsidiaries makes a distribution to AHL, the distribution will be treated as a dividend to which the 30% withholding tax will apply to the extent the distribution is paid out of the subsidiary’s current or accumulated earning and profits, as determined for U.S. federal income tax purposes.
Excise Tax
The United States imposes an excise tax on insurance and reinsurance premiums paid to non-U.S. insurers or reinsurers with respect to risks located in the United States. The applicable tax rates are 1% for life insurance and annuity contract premiums and 1% for reinsurance premiums. The Bermuda Treaty does not provide any relief from this excise tax. The person who pays the premium to the non-U.S. insurer or reinsurer is customarily responsible for the excise tax. If, however, the tax is not paid by the purchaser of the insurance or reinsurance, the non-U.S. insurer may be held liable for the tax. Accordingly, if our non-U.S. subsidiaries reinsure U.S. risks written by third-party insurance companies, and such insurance companies were not to pay this excise tax, we could be held liable for it.
Taxation of U.S. Holders
For purposes of this discussion, you are a “U.S. holder” if, for U.S. federal income tax purposes, you are treated as a beneficial owner of our Class A common shares and you are:
| • | a citizen or resident of the United States; |
| • | a corporation created or organized in or under the law of the United States or any state thereof (including the District of Columbia); |
| • | an estate the income of which is subject to U.S. federal income taxation regardless of its source; or |
| • | a trust if (1) a court within the United States is able to exercise primary supervision over the administration of the trust and one or more U.S. persons have the authority to control all substantial decisions of the trust or (2) the trust has in effect a valid election under applicable U.S. Treasury regulations to be treated as a U.S. person. |
Distributions on Our Class A Common Shares
We do not currently make distributions on any of our common shares and we currently intend to retain all available funds and any future earnings for use in the operation of our business. See “Dividend Policy.” Subject to the discussions below relating to the potential application of the CFC, RPII and PFIC provisions, distributions on our Class A common shares will constitute dividends for U.S. federal income tax purposes to the extent paid out of AHL’s current or accumulated earnings and profits, as determined for U.S. federal income tax purposes. To the extent that distributions on Class A common shares exceed AHL’s earnings and profits, the distributions will be treated as a tax-free return of capital that will reduce, but not below zero, your tax basis in the Class A common shares and thereafter as capital gain from the sale or exchange of the Class A common shares (discussed below). AHL’s earnings and profits generally will not include the earnings and profits of its subsidiaries until such amounts are distributed to AHL.
296
Table of Contents
Dividends paid with respect to our Class A common shares will generally be treated as “passive category income” for purposes of computing allowable foreign tax credits for U.S. foreign tax credit purposes. Further, any such dividends generally will not be eligible for the dividends received deduction for corporate shareholders.
Dividends paid with respect to the Class A common shares to a U.S. holder that is treated for U.S. federal income tax purposes as an individual, a trust or an estate (a “non-corporate U.S. holder”) will be treated as “qualified dividend income” taxed at the preferential rates applicable to long-term capital gain if (i) the Class A common shares are readily tradable on an established securities market in the United States (such as the NYSE, on which we expect the Class A common shares to be traded), (ii) AHL is not a PFIC for the taxable year during which the dividend is paid and AHL was not a PFIC for the immediately preceding taxable year (see discussion below), (iii) the U.S. holder owns the Class A common shares for more than 60 days in the 121-day period beginning 60 days before the date on which the common shares become ex-dividend (and does not enter into certain risk-limiting transactions with respect to the common shares), (iv) the U.S. holder is not under an obligation to make related payments with respect to positions in substantially similar or related property, and (v) the U.S. holder does not take the dividends into account as investment income for purposes of deducting investment interest. Dividends you receive from AHL that are not treated as “qualified dividend income” will be taxed at ordinary income rates.
Special rules may apply to any “extraordinary dividend.” Generally, a dividend with respect to a Class A common share will be an extraordinary dividend if the amount of such dividend equals or exceeds 10% of your adjusted tax basis (or fair market value in certain circumstances) in such Class A common share (subject to certain aggregation rules). In addition, extraordinary dividends include dividends received within a one-year period that, in the aggregate, equal or exceed 20% of your adjusted tax basis (or fair market value). If you receive an extraordinary dividend on a Class A common share that is treated as qualified dividend income and you are a non-corporate U.S. holder, then any loss recognized by you from a subsequent sale or exchange of such Class A common share will be treated as a long-term capital loss to the extent of such dividend.
Dividends paid with respect to our Class A common shares to a non-corporate U.S. holder may also be subject to an additional 3.8% tax on net investment income, described below.
CFC Provisions
Each of AHL, ALRe and the German Group Companies will be considered a CFC if, on any day of its taxable year, “10% U.S. Shareholders” (as defined below) own (directly, indirectly through non-U.S. entities or constructively through the application of certain constructive ownership rules (“constructively”)) more than 50% of the total combined voting power of all classes of its voting stock or more than 50% of the total value of all of its stock. For purposes of taking into account certain insurance income, however, ALRe and each German Group Company will be a CFC if more than 25% of the total combined voting power of all classes of its voting shares or more than 25% of the total value of all of its shares are owned by 10% U.S. Shareholders. Except as discussed below with respect to RPII, a U.S. holder that is not a 10% U.S. Shareholder is not expected to experience adverse U.S. federal income tax consequences under the CFC provisions regardless of whether any of AHL, ALRe, or the German Group Companies is treated as a CFC.
A “10% U.S. Shareholder” of an entity treated as a foreign corporation for U.S. federal income tax purposes is a U.S. person who owns (directly, indirectly through non-U.S. entities or constructively) 10% or more of the total combined voting power of all classes of voting shares of the corporation. Because of the provisions in AHL’s organizational documents relating to voting in AHL and AHL’s non-U.S. subsidiaries (see “Description of Share Capital—Common Shares—Voting Rights” for a discussion regarding these provisions), among other factors (including the expected ownership of AHL’s common shares following this offering), a U.S. person that acquires Class A common shares in this offering is not expected to thereby become a 10% U.S. Shareholder of AHL, ALRe or any German Group Company. However, because the attribution rules contained in the Code are complex and there is no definitive legal authority on whether the voting provisions included in AHL’s
297
Table of Contents
organizational documents are effective for purposes of the CFC provisions, there can be no assurance that this will be the case.
If AHL, ALRe or a German Group Company is a CFC for an uninterrupted period of 30 days or more during a taxable year, any 10% U.S. Shareholder of AHL, ALRe or such German Group Company, respectively, who owns Class A common shares directly, or indirectly through non-U.S. entities, on the last day in AHL’s, ALRe’s or such German Group Company’s (as applicable) taxable year on which it is a CFC must include in its gross income for U.S. federal income tax purposes its pro rata share (based on direct or indirect ownership of value) of AHL’s, ALRe’s or such German Group Company’s (as applicable) “subpart F income,” even if the subpart F income is not distributed. “Subpart F income” of a CFC typically includes, among other items, passive income such as interest and dividends as well as certain insurance and reinsurance income (including underwriting and investment income). The subpart F income of a CFC for any taxable year is limited to the CFC’s earnings and profits for the taxable year. The earnings and profits of a foreign corporation attributable to amounts which are, or have been, included in the gross income of a 10% U.S. Shareholder pursuant to the CFC provisions will not, when subsequently distributed to such 10% U.S. Shareholder (or, if certain requirements are met, other U.S. persons) directly or indirectly through a chain of non-U.S. entities be again included in the gross income of such 10% U.S. Shareholder (or other U.S. person).
If AHL, ALRe or a German Group Company is a CFC, the rules relating to PFICs generally would not apply to a 10% U.S. Shareholder of AHL, ALRe or such German Group Company, respectively.
Related Person Insurance Income – Special rules apply with respect to a CFC that earns RPII. For purposes of taking into account RPII, an entity treated as a foreign corporation for U.S. federal income tax purposes will be considered a CFC (a “RPII CFC”) if, on any day of its taxable year, U.S. persons who own (directly or indirectly through non-U.S. entities) any of its stock (each such person, a “RPII Shareholder”) own (directly, indirectly through non-U.S. entities or constructively) 25% or more of the total combined voting power of all classes of its voting stock or 25% or more of the total value of all of its stock.
The RPII of a RPII CFC is certain insurance and reinsurance income (including underwriting and investment income) attributable to a policy of insurance or reinsurance with respect to which the person (directly or indirectly) insured is a “RPII Shareholder” or a “related person” to a RPII Shareholder. Generally, a person is a related person to a RPII Shareholder if the person controls or is controlled by the RPII Shareholder, or if the person is controlled by the same person or persons who control the RPII Shareholder. Control is defined for these purposes as direct or indirect ownership of more than 50% of the value or voting power of the stock of a person treated as a corporation for U.S. federal income tax purposes or more than 50% of the value of the beneficial interests in a person treated as a partnership, trust, or estate for U.S. federal income tax purposes. Certain attribution rules apply for purposes of determining control.
As a general matter, although we have identified a small number of our RPII Shareholders that have purchased policies from one of our U.S. subsidiaries, we do not believe that ALRe or any German Group Company earns more than a de minimis amount of RPII from insuring risks of RPII Shareholders. In order to strengthen our protection against ALRe or any German Group Company recognizing RPII from insuring risks of persons related to RPII Shareholders, existing voting restrictions on our common shares set forth in our bye-laws are generally intended to prevent the Apollo Group or their affiliates from being treated as owning (directly, indirectly or constructively) more than 45% of the total voting power of our common shares. These restrictions have the effect of reducing the likelihood that any of our subsidiaries would be treated as related to any member of the Apollo Group (or their affiliates) for RPII purposes. Under our bye-laws, any member of the Apollo Group has the right to designate any newly acquired Class A common shares as having the right to vote. If a member of the Apollo Group were to exercise such right, our subsidiaries may be treated as “related” to a member of the Apollo Group (or one of their affiliates) for these purposes. In such case, substantially all of ALRe’s income might constitute RPII, triggering the adverse RPII consequences to all U.S. persons that hold AHL’s common shares directly or indirectly through non-U.S. entities, as described below.
298
Table of Contents
RPII Exceptions – The RPII rules will not apply with respect to ALRe or a German Group Company for a taxable year if (1) at all times during its taxable year less than 20% of the total combined voting power of all classes of ALRe’s or such German Group Company’s (as applicable) voting stock and less than 20% of the total value of all of its stock is owned (directly or indirectly) by persons who are (directly or indirectly) insured under any policy of insurance or reinsurance issued by ALRe or such German Group Company, respectively, or who are related persons to any such person or (2) its RPII (determined on a gross basis) is less than 20% of its insurance income (as so determined) for the taxable year, determined with certain adjustments. It is expected that one or both of these exceptions will apply to ALRe and each German Group Company, but because AHL cannot be certain of its future ownership or its ability to obtain information about its shareholders to manage such ownership to ensure that it qualifies for one or both of these exceptions, there can be no assurance in this regard.
Apportionment of RPII to RPII Shareholders – If ALRe or a German Group Company does not qualify for either of the exceptions described above for a taxable year and ALRe or such German Group Company (as applicable) was a RPII CFC for an uninterrupted period of 30 days or more during that taxable year, then a RPII Shareholder that owns, directly or indirectly through non-U.S. entities, any of the Class A common shares on the last day of that taxable year will be required to include in gross income the RPII Shareholder’s pro rata share of ALRe’s or such German Group Company’s (as applicable) RPII for the entire taxable year, whether or not distributed, even if that RPII Shareholder did not own the Class A common shares throughout the period. The RPII Shareholder’s share of the RPII for the taxable year will be determined as if all RPII were distributed proportionately only to RPII Shareholders at that date, but limited by each such RPII Shareholder’s share of ALRe’s or such German Group Company’s (as applicable) current year earnings and profits as reduced by the RPII Shareholder’s share, if any, of certain prior-year deficits in earnings and profits. The RPII Shareholder may exclude from income the amount of any distributions by AHL of earnings and profits attributable to amounts which are, or have been, included in the gross income of the RPII Shareholder. A RPII Shareholder will not be able to exclude from income the amount of any distributions by AHL of earnings and profits attributable to RPII amounts which have been included in the gross income of any previous RPII Shareholders of the Class A common shares owned, directly or indirectly through non-U.S. entities, by such RPII Shareholder if the RPII Shareholder is unable to identify the previous RPII Shareholders and demonstrate the amount of RPII that had previously been included in the gross income of the previous RPII Shareholders.
A RPII Shareholder who owns (directly or indirectly) our Class A common shares during ALRe’s or a German Group Company’s taxable year but not on the last day of the taxable year is not required to include in gross income any part of ALRe’s or such German Group Company’s (as applicable) RPII for that taxable year.
Computation of RPII – For any year in which the RPII rules apply with respect to ALRe or a German Group Company, we may seek information from our shareholders as to whether direct or indirect owners of our shares at the end of the year are RPII Shareholders so that the RPII may be determined and apportioned among such persons. We are not under any obligation to do so or to report any RPII to our RPII Shareholders. To the extent we are unable to determine whether a direct or indirect owner of our shares is a RPII Shareholder, we may assume that such owner is not a RPII Shareholder, thereby increasing the per-share RPII amount for all known RPII Shareholders. Calculating the amount of RPII AHL may receive, and determining whether AHL is eligible for the RPII exceptions, requires information about AHL’s shareholders and insureds that AHL may not have. Therefore, there can be no assurance that AHL will be able to determine the availability of the RPII exceptions and the amount of insurance income that is RPII.
Uncertainty as to the Application of the RPII Provisions – The meaning of various RPII provisions and the application of those provisions to ALRe and the German Group Companies is uncertain. Regulations interpreting the RPII provisions exist only in proposed form, and it is uncertain whether those regulations will be adopted in their proposed form (or at all) or whether changes or clarifications might be made to them. It is also uncertain whether any such changes or any interpretation or application of the RPII provisions by the IRS or the courts might have retroactive effect. In addition, there can be no assurance that the amount of RPII or the amounts of the RPII inclusions for any particular RPII Shareholder, if any, will not be subject to adjustment
299
Table of Contents
based upon subsequent IRS examination. Prospective investors are urged to consult their tax advisers regarding the effects of these uncertainties and the application of the RPII provisions to them.
Basis Adjustments – A U.S. holder’s tax basis in the Class A common shares will be increased by the amount of any of AHL’s, ALRe’s or any German Group Company’s subpart F income (including any RPII) that such U.S. holder includes in income under the CFC and RPII rules. A U.S. holder’s tax basis in the Class A common shares will be reduced by the amount of any distributions on the Class A common shares of previously taxed income that is excluded from the U.S. holder’s gross income. If such distributions exceed the U.S. holder’s tax basis in the Class A common shares, the excess will be treated as gain from the sale or exchange of our Class A common shares (see discussion below).
Tax-Exempt U.S. Holders – If a U.S. holder that is a tax-exempt organization is required to include any of ALRe’s or any German Group Company’s insurance income (including RPII) in its gross income under the CFC rules, such income will be unrelated business taxable income, which is subject to tax. Prospective investors that are tax-exempt organizations are urged to consult their tax advisers as to the potential impact of the unrelated business taxable income provisions of the Code on an investment in our Class A common shares. A tax-exempt organization that is treated as a 10% U.S. Shareholder or a RPII Shareholder also must file IRS Form 5471, as described below.
Dispositions of Class A Common Shares
Subject to the discussions below relating to the potential application of Section 1248 of the Code and the PFIC rules, U.S. holders will recognize capital gain or loss on the sale or other taxable disposition of our Class A common shares. If the holding period for the Class A common shares sold or otherwise disposed of exceeds one year, any gain recognized by a non-corporate U.S. holder will be subject to tax at a maximum U.S. federal income tax rate of 20% and may also be subject to an additional 3.8% tax imposed on certain net investment income, as discussed below. With certain exceptions, any gain will be U.S. source gain and generally will be passive category income for foreign tax credit limitation purposes. The deductibility of capital losses is subject to limitations.
Under Section 1248 of the Code, if a U.S. holder sells or exchanges Class A common shares and the U.S. holder owned (directly, indirectly through non-U.S. entities or constructively) 10% or more of the total combined voting power of the voting stock of AHL when AHL was a CFC at any time during the 5-year period ending on the date of the sale or exchange, then any gain recognized on the sale or exchange of the stock will be treated as a dividend to the extent of AHL’s earnings and profits (determined under U.S. federal income tax principles) attributable to the stock accumulated during the period that the U.S. holder held stock of AHL while AHL was a CFC (with certain adjustments). Because of the provisions in AHL’s organizational documents that limit voting power in AHL (see “Description of Share Capital—Common Shares—Voting Rights” for a discussion regarding these provisions), among other factors (including the expected ownership of our common shares following this offering), a U.S. holder that acquires Class A common shares in this offering is not expected to be treated as owning (directly, indirectly through non-U.S. entities or constructively) 10% or more of the total combined voting power of the voting stock of AHL and, consequently, subject to the discussion of RPII below, Section 1248 of the Code is not expected to apply to any sales or exchanges of our Class A common shares. However, because of the complexity of the attribution rules contained in the Code and the uncertainty of the effectiveness of the voting provisions in our organizational documents, there can be no assurance that this will be the case.
Section 953(c)(7) of the Code provides that the rules of Section 1248 of the Code will also apply to the sale or exchange of shares in a non-U.S. corporation by a U.S. person (regardless of whether the person is a 10% U.S. Shareholder) if the non-U.S. corporation would be taxed under the provisions of the Code applicable to U.S. insurance companies if it were a U.S. corporation and the non-U.S. corporation is (or would be but for certain exceptions) treated as a RPII CFC. If Section 1248 applies under such circumstances, gain on the disposition of shares in the non-U.S. corporation may be recharacterized as a dividend to the extent of the U.S. person’s share of the corporation’s undistributed earnings and profits that were accumulated during the period that the U.S. person owned the shares (possibly whether or not those earnings and profits are attributable to RPII).
300
Table of Contents
AHL does not directly engage in an insurance or reinsurance business, but ALRe and the German Group Companies do. Existing proposed regulations do not address whether the provisions of Section 953(c)(7) of the Code may apply with respect to the sale of stock in a non-U.S. corporation that is not a RPII CFC but has a non-U.S. subsidiary that is a RPII CFC and that would be taxed under the provisions of the Code applicable to U.S. insurance companies if it were a U.S. corporation. In the absence of legal authority to the contrary, there is a strong argument that this specific rule should not apply to a disposition of Class A common shares because AHL is not itself directly engaged in the insurance business. However, there is no assurance that the IRS will not successfully assert that Section 953(c)(7) applies in such circumstances and thus may apply to the sale or exchange by a U.S. holder of our Class A common shares. Prospective investors are urged to consult their tax advisers regarding the effects of these rules on a disposition of our Class A common shares.
PFIC Provisions
In general, a non-U.S. corporation will be a PFIC during a taxable year if (1) 75% or more of its gross income constitutes passive income or (2) 50% or more of its assets produce, or are held for the production of, passive income. For these purposes, passive income includes interest, dividends and other investment income, with certain exceptions. Income derived in the active conduct of an insurance business by a corporation that is predominantly engaged in an insurance business, however, is not treated as passive income provided that the corporation does not maintain financial reserves in excess of the reasonable needs of its insurance business. The PFIC provisions also contain a look-through rule under which a non-U.S. corporation will be treated as if it received directly its proportionate share of the income, and held its proportionate share of the assets, of another corporation if it owns at least 25% of the value of the stock of such other corporation. We currently expect that, for purposes of the PFIC rules, each of ALRe and the German Group Companies will be predominantly engaged in the active conduct of an insurance business and will not, after giving effect to the initial public offering, have financial reserves in excess of the reasonable needs of its insurance business in each year of operations. Accordingly, the current expectation is that none of the income or assets of ALRe or any of the German Group Companies will be treated as passive and that each of ALRe and the German Group Companies will not be treated as a PFIC for the current year or in the foreseeable future. Similarly, the current expectation is that no material amount of the income and assets of each of AHL’s other subsidiaries will be treated as passive income or assets that produce, or are held for the production of, passive income. Therefore, under the look-through rule, we currently expect that AHL will not be treated as a PFIC for the current year or the foreseeable future. There is no assurance, however, that AHL and ALRe will not be deemed to be PFICs by the IRS. No final or temporary regulations currently exist regarding the application of the PFIC provisions to an insurance company. Proposed regulations have recently been issued, which will not be effective until adopted in final form. At this time it is unclear whether and how such regulations would affect the characterization of AHL and its subsidiaries. Additionally, legislation has been introduced in Congress that, if enacted, would characterize a non-U.S. insurance company with insurance liabilities of 25% or less of such company’s assets as a PFIC unless it can qualify for a temporary exception based on both an asset test and a facts and circumstances test. No prediction can be made as to what effect, if any, any new guidance or legislation would have on an investor that is subject to U.S. federal income taxation. As a result of these uncertainties in the present and future application of the PFIC rules to AHL and its subsidiaries, there can be no assurance that the IRS will not assert that AHL or any of its subsidiaries is a PFIC or that a court will not sustain such an assertion.
If AHL is characterized as a PFIC for a taxable year, a U.S. holder that receives an “excess distribution” on our Class A common shares or recognizes a gain on the disposition of our Class A common shares generally will determine its U.S. federal income tax on such amounts by (1) allocating the excess distribution or gain ratably to each day in the U.S. holder’s holding period for the Class A common shares, (2) including in gross income as ordinary income for the current year the amounts allocated to the current year or to years before AHL became a PFIC, and (3) increasing the current year’s tax by the “deferred tax amount,” which is determined by multiplying the amounts allocated to each of the other taxable years by the highest rate of tax in effect for such taxable year (for the applicable class of taxpayers) to calculate the increases in taxes for each prior year, calculating an interest charge (at the rate applicable to underpayments of U.S. federal income tax for the relevant period) for the
301
Table of Contents
deemed deferral of such taxes from each prior year to the current year, and combining such increases in taxes and interest charges. In addition, a U.S. holder would be treated as owning a proportionate amount of any shares AHL owns, directly or indirectly by application of certain attribution rules, in other PFICs (including ALRe or the German Group Companies, if they are PFICs) and would be subject to the PFIC rules on a separate basis with respect to its indirect interests in any such PFICs. In general, a U.S. person that owns shares in a PFIC is treated as receiving an “excess distribution” from the PFIC if the distributions received by the U.S. person with respect to such shares in a taxable year exceed 125% of the average annual distributions received by the U.S. person in the three preceding taxable years (or, if shorter, the U.S. person’s holding period for the shares).
If AHL is a PFIC, a U.S. holder may be able to mitigate the negative tax consequences described above if the U.S. holder makes a “qualified electing fund” election or “mark-to-market” election with respect to the Class A common shares. However, such an election may itself have negative tax consequences to a U.S. holder. Further, we do not expect to provide the information necessary for U.S. holders to make “qualified electing fund” elections, and a “mark-to-market” election may not mitigate any negative tax consequences with respect to PFICs directly or indirectly owned by AHL. U.S. holders should consult with their tax advisers regarding the availability and advisability of such elections (including a retroactive qualified electing fund election). As described above, if AHL were a PFIC for any taxable year and any of its non-U.S. subsidiaries were also a PFIC, a U.S. holder of Class A common shares would be treated as owning a proportionate amount (by value) of the shares of the lower-tier PFIC for purposes of the application of these rules. A U.S. holder would not be able to make a mark-to-market election with respect to stock of any lower-tier PFIC. In addition, a U.S. holder may be required to comply with other reporting requirements, regardless of the number of shares held, and whether or not a “qualified electing fund” or “mark-to-market” election is made.
U.S. holders are urged to consult their own tax advisers about the application of the PFIC rules, the advisability and availability of any elections (including a retroactive qualified electing fund election), and the additional reporting requirements described above.
Foreign Tax Credits
In the event that U.S. persons own (directly, indirectly through non-U.S. entities or constructively) 50% or more of the total combined voting power of all classes of our voting common shares or 50% or more of the total value of AHL’s common shares, only a portion of the current income inclusions, if any, under the CFC, RPII and PFIC provisions and of any dividends paid by AHL (including any gain from the sale or other taxable disposition of common shares that is treated as a dividend under Code Section 1248) will be treated as non-U.S. source income for purposes of computing a U.S. holder’s U.S. foreign tax credit limitation. It is likely that the “subpart F income,” RPII and dividends that are non-U.S. source income will constitute passive category income for foreign tax credit limitation purposes. Thus, shareholders might not be able to utilize any excess foreign tax credits from other sources to reduce U.S. tax on such income.
Net Investment Income Tax
A 3.8% tax is imposed on all or a portion of the net investment income of certain individuals with modified adjusted gross income of over $200,000 ($250,000 in the case of joint filers) and the undistributed net investment income of certain estates and trusts. For these purposes, “net investment income” will include a U.S. holder’s share of dividends and gain on the sale or other taxable disposition of Class A common shares. Unless a U.S. holder elects otherwise or holds Class A common shares in connection with certain trades or businesses, the CFC and PFIC provisions generally will not apply for purposes of determining a U.S. holder’s net investment income.
Reporting Requirements for U.S. Holders
Form 926 – A U.S. holder who transfers cash to AHL in exchange for Class A common shares may be required to file Form 926 (Return by a U.S. Transferor of Property to a Foreign Corporation) with the IRS if
302
Table of Contents
(1) immediately after the transfer, such U.S. holder holds, directly or indirectly, at least 10% of the total voting power or the total value of AHL, or (2) the amount of cash transferred by such U.S. holder (or certain related persons) during the 12-month period ending on the date of the transfer exceeds $100,000.
Form 5471 – A U.S. holder who is a 10% U.S. Shareholder or RPII Shareholder of AHL, ALRe or a German Group Company will be required to file Form 5471 (Information Return of U.S. Persons with Respect to Certain Foreign Corporations) with the IRS for one or more taxable years with respect to AHL, ALRe or such German Group Company, as applicable. This information return requires certain disclosures concerning the filing shareholder, other 10% U.S. Shareholders and AHL, ALRe or such German Group Company, as applicable.
Form 8621 – A U.S. person that is a shareholder of a PFIC is required to file Form 8621 (Information Return by a Shareholder of a Passive Foreign Investment Company or Qualified Electing Fund) with the IRS. If AHL is a PFIC in any year, U.S. holders may be required to file Forms 8621 with the IRS with respect to AHL and any PFICs owned by AHL, directly or indirectly by application of certain attribution rules.
Form 8938 – U.S. holders who are individuals may be required to file Form 8938 (Statement of Specified Foreign Financial Assets) with the IRS. A U.S. holder that is formed or availed of for purposes of holding, directly or indirectly, specified foreign financial assets may also be required to file this form.
Potential investors are urged to consult their tax advisers for advice regarding reporting on Forms 926, 5471, 8621 and 8938 and any other reporting requirements that may apply to their acquisition, ownership or disposition of our common shares. AHL is not obligated to provide U.S. holders with the information necessary to satisfy such reporting requirements. Failure to properly file such forms, if required, may result in the imposition of substantial penalties and an extension of the statute of limitations for the assessment of any U.S. federal income tax with respect to any tax return, event or period to which the information required to be reported on such forms relates.
Taxation of Non-U.S. Holders
For purposes of this discussion, you are a “Non-U.S. holder” if you are a beneficial owner of our Class A common shares, you are not a U.S. holder and you are not treated as a partnership for U.S. federal income tax purposes.
Distributions on Our Class A Common Shares
If AHL makes distributions on the Class A common shares, the distributions will be dividends for U.S. federal income tax purposes to the extent paid out of AHL’s current or accumulated earnings and profits, as determined for U.S. federal income tax purposes. Subject to the discussion below regarding FATCA, dividends on Class A common shares will not be subject to U.S. federal income tax unless the dividends are effectively connected with the Non-U.S. holder’s conduct of a U.S. trade or business (and, if an income tax treaty applies, the dividends are attributable to a U.S. permanent establishment or fixed base maintained by such Non-U.S. holder in the United States).
To the extent distributions exceed AHL’s current and accumulated earnings and profits, they will constitute a return of capital that will first reduce a Non-U.S. holder’s basis in the Class A common shares, but not below zero, and then will be treated as gain from the sale or exchange of the Class A common shares (discussed below).
Dispositions of Our Class A Common Shares
A Non-U.S. holder will not be subject to U.S. federal income tax on any gain realized upon the sale or other taxable disposition of our Class A common shares unless (1) such gain is effectively connected with the Non-U.S. holder’s conduct of a U.S. trade or business (and, if an income tax treaty applies, the gain is attributable to a U.S. permanent establishment or fixed base maintained by such Non-U.S. holder in the United States) or (2) the
303
Table of Contents
Non-U.S. holder is an individual who is present in the United States for a period or periods aggregating 183 days or more during the calendar year in which such sale or other taxable disposition occurs and certain other conditions are met.
Gain described in clause (1) immediately above will be subject to U.S. federal income tax in the manner described below under “Effectively Connected Income.” During each taxable year, a Non-U.S. holder described in clause (2) immediately above will be subject to tax at a 30% rate (or such lower rate specified by an applicable income tax treaty) on the net gain derived from the sale or other taxable disposition, which may be offset by capital losses of the Non-U.S. holder during the taxable year allocated to U.S. sources.
Effectively Connected Income
Any dividend with respect to, or gain recognized upon the sale or other taxable disposition of, Class A common shares that is effectively connected with a trade or business carried on by a Non-U.S. holder within the United States (and, if an income tax treaty applies, is attributable to a permanent establishment or fixed base maintained by such Non-U.S. holder in the United States) will be subject to U.S. federal income tax, based on the Non-U.S. holder’s net effectively connected income, generally in the same manner as if the Non-U.S. holder were a U.S. person for U.S. federal income tax purposes. If a dividend or gain is effectively connected with a U.S. trade or business of a Non-U.S. holder that is a corporation for U.S. federal income tax purposes, such corporate Non-U.S. holder may also be subject to a “branch profits tax” at a 30% rate (or such lower rate as may be specified by an applicable income tax treaty), subject to certain adjustments. Non-U.S. holders should consult their tax advisers regarding any applicable tax treaties that may provide for different rules.
Information Reporting and Backup Withholding
Information returns may be filed with the IRS in connection with distributions on Class A common shares and the proceeds from a sale or other disposition of Class A common shares unless a shareholder establishes an exemption. A U.S. holder that does not establish such an exemption may be subject to U.S. backup withholding tax on such payments if the shareholder fails to provide its taxpayer identification number on IRS Form W-9 or otherwise comply with the backup withholding rules. A Non-U.S. holder may be required to provide a certification on an applicable IRS Form W-8 to establish an exemption from such information reporting and backup withholding. The amount of any backup withholding from a payment to a U.S. holder or Non-U.S. holder will be allowed as a credit against the U.S. holder’s or Non-U.S. holder’s U.S. federal income tax liability and may entitle the U.S. holder or Non-U.S. holder to a refund provided that the required information is timely furnished to the IRS.
Proposed U.S. Tax Legislation
The tax treatment of non-U.S. companies and their U.S. and non-U.S. subsidiaries has been the subject of Congressional discussion and legislative proposals. Over the past several years, legislative proposals relating to the tax treatment of non-U.S. companies have been introduced that could, if enacted, materially affect AHL. One legislative proposal would cause certain entities otherwise treated as non-U.S. corporations to be treated as U.S. corporations for U.S. federal income tax purposes if the “management and control” of such corporations occurs, directly or indirectly, primarily within the United States. Another legislative proposal, which was included in the President’s 2017 proposed budget, would, if enacted in legislation, deny an insurance company a deduction for reinsurance premiums and other amounts paid to an affiliated foreign reinsurance company to the extent that the foreign reinsurer (or its parent company) is not subject to U.S. federal income tax with respect to the premiums received. Additionally, legislation has been introduced in Congress that, if enacted, would characterize a non-U.S. insurance company with insurance liabilities of 25% or less of such company’s assets as a PFIC unless it can qualify for a temporary exception based on both an asset test and a facts and circumstances test. No prediction can be made as to whether proposed legislation will be enacted or, if enacted, what the specific provisions or the effective date of any such legislation would be, or whether it would have any effect on AHL. It
304
Table of Contents
is also possible that other legislative proposals could emerge in the future that could also have an adverse impact on AHL.
Possible Changes in U.S. Tax Law
The U.S. federal income tax laws and interpretations, including those regarding whether a company is engaged in a U.S. trade or business (or has a U.S. permanent establishment) or is a PFIC, or whether U.S. persons would be required to include in their gross income the “subpart F income” or RPII of a CFC, are subject to change, possibly on a retroactive basis. Proposed PFIC regulations have recently been issued, which will not be effective until adopted in final form. At this time it is unclear whether and how such regulations would affect the characterization of AHL and its subsidiaries. Furthermore, new regulations or pronouncements interpreting or clarifying the PFIC, RPII or other rules may be forthcoming. No prediction can be made as to what effect, if any, any new guidance would have on an investor that is subject to U.S. federal income taxation.
FATCA Withholding
The U.S. tax provisions commonly known as FATCA impose a 30% withholding tax on certain payments of U.S. source income and
certain payments of proceeds from the sale or other disposition after December 31, 2018 of property of a type which can produce U.S. source interest or dividends, in each case to (1) a “foreign financial institution” (as defined
in Section
1471(d)(4) of the Code and the U.S. Treasury regulations promulgated thereunder), unless the foreign financial institution enters into an agreement with the IRS to, among other things, collect and disclose to the IRS certain
information regarding its U.S. accounts or meets an applicable exception, and (2) a “non-financial foreign entity” (as defined in Section 1472(d) of the Code and the U.S. Treasury regulations promulgated thereunder), unless the
entity provides the payor with certain information regarding certain direct and indirect U.S. owners of the entity, certifies that it has no such U.S. owners or meets an applicable exception. The withholding tax also applies to certain
“foreign passthru payments” made by foreign financial institutions after December 31, 2018. The IRS has issued regulations that provide for the phased implementation of the FATCA withholding requirements.
The U.S. government has signed the Bermuda IGA and the German IGA. Under the Bermuda IGA and German IGA, Bermuda and German financial institutions (other than certain non-reporting financial institutions) are required to register with the IRS and comply with certain due diligence, reporting, withholding and other requirements in order to avoid the imposition of withholding under FATCA on payments made to them. AHL, ALRe and the German Group Companies intend to comply with the obligations imposed on them under FATCA, the Bermuda IGA and the German IGA to avoid withholding under FATCA on payments made to them.
AHL is a foreign financial institution for purposes of FATCA. To avoid any withholding under FATCA, AHL may be required to report the identity of, and certain other information regarding, certain U.S. persons that directly or indirectly own Class A common shares or exercise control over shareholders to counterparties or governmental authorities, including the IRS or Bermuda government. AHL may also be required to withhold on payments and/or take other actions with respect to holders of our common shares who do not provide AHL with certain information or documentation required to fully comply with FATCA. However, our shareholders who acquire Class A common shares issued in this offering are not expected to be subject to such requirements pursuant to an exception for equity interests that are regularly traded on an established securities market, provided that the shareholder (and any intermediaries through which the shareholder holds its shares) is not a foreign financial institution that is treated as a “nonparticipating FFI” under FATCA. However, because the scope of such exception is not entirely clear and its availability will depend upon future trading activity with respect to the Class A common shares, no assurance can be provided in this regard. AHL may become subject to withholding tax or penalties if AHL is unable to comply with FATCA.
If AHL is treated as engaged in a U.S. trade or business in any taxable year, all or a portion of the dividends on Class A common shares may be treated as U.S. source income and may be subject to withholding and
305
Table of Contents
information reporting under FATCA unless a shareholder (and any intermediaries through which a shareholder holds its shares) establishes an exemption from such withholding and information reporting. In addition, any gross proceeds from the sale or other disposition of Class A common shares after December 31, 2018 might also be subject to withholding and information reporting under FATCA in such circumstances, absent an exemption. We currently intend to limit our U.S. activities so that AHL is not considered to be engaged in a U.S. trade or business. No definitive standards, however, are provided by the Code, U.S. Treasury regulations or court decisions regarding when a foreign corporation is engaged in the conduct of a U.S. trade or business. Because the law is unclear, and the determination is highly factual and must be made annually, there is no assurance that the IRS will not contend that AHL is engaged in a U.S. trade or business.
306
Table of Contents
UNDERWRITING (CONFLICTS OF INTEREST)
Goldman, Sachs & Co., Barclays Capital Inc., Citigroup Global Markets Inc. and Wells Fargo Securities, LLC are acting, severally and not jointly, as joint book-running managers of the offering and as representatives of the underwriters named below. Subject to the terms and conditions stated in the underwriting agreement dated the date of this prospectus, each underwriter named below has severally agreed to purchase and the selling shareholders have severally agreed to sell to that underwriter, the number of Class A common shares set forth opposite the underwriter’s name.
| Underwriter |
Number of Class A common shares |
|||
| Goldman, Sachs & Co. |
||||
| Barclays Capital Inc. |
||||
| Citigroup Global Markets Inc. |
||||
| Wells Fargo Securities, LLC |
||||
| BMO Capital Markets Corp. |
||||
| Credit Suisse Securities (USA) LLC |
||||
| Deutsche Bank Securities Inc. |
||||
| J.P. Morgan Securities LLC |
||||
| Merrill Lynch, Pierce, Fenner & Smith Incorporated |
||||
| Morgan Stanley & Co. LLC |
||||
| RBC Capital Markets, LLC |
||||
| BNP Paribas Securities Corp. |
||||
| BTIG, LLC |
||||
| Evercore Group L.L.C. |
||||
| SunTrust Robinson Humphrey, Inc. |
||||
| UBS Securities LLC |
||||
| Apollo Global Securities, LLC |
||||
| Dowling & Partners Securities LLC |
||||
| Keefe, Bruyette & Woods, Inc. |
||||
| Lazard Frères & Co. LLC |
||||
| Rothschild Inc. |
||||
| Sandler O’Neill & Partners, L.P. |
||||
| The Williams Capital Group, L.P. |
||||
|
|
|
|||
|
Total |
||||
|
|
|
|||
The underwriting agreement provides that the obligations of the underwriters to purchase the Class A common shares included in this offering are subject to approval of legal matters by counsel and to other conditions. The underwriters are obligated to purchase all the Class A common shares (other than those covered by the underwriters’ option to purchase additional shares described below) if they purchase any of the Class A common shares.
307
Table of Contents
Class A common shares sold by the underwriters to the public will initially be offered at the initial public offering price set forth on the cover of this prospectus. Any Class A common shares sold by the underwriters to securities dealers may be sold at a discount from the initial public offering price not to exceed $ per share. After the initial offering of the Class A common shares, the offering price and the other selling terms may be subject to change. If all the Class A common shares are not sold at the initial public offering price, the underwriters may change the offering price and the other selling terms. The representatives have advised us and the selling shareholders that the underwriters do not intend to make sales to discretionary accounts.
If the underwriters sell more Class A common shares than the total number set forth in the table above, the selling shareholders have granted to the underwriters an option, exercisable for 30 days from the date of this prospectus, to purchase up to additional shares at the initial public offering price less the underwriting discount. To the extent the option is exercised, each underwriter must purchase a number of additional Class A common shares approximately proportionate to that underwriter’s initial purchase commitment. Any Class A common shares issued or sold under the option will be issued and sold on the same terms and conditions as the other shares that are the subject of this offering.
At our request, the underwriters have reserved approximately of the shares of common stock to be offered by this prospectus for sale, at the initial public offering price, to directors, officers, employees, business associates of the company and other parties directed by the company. The number of shares of common stock available for sale to the general public will be reduced to the extent these individuals purchase such reserved shares. Any reserved shares that are not so purchased will be offered by the underwriters to the general public on the same basis as the other shares offered by this prospectus.
We, our officers and directors, the selling shareholders and substantially all of our other existing shareholders have agreed that, for a period of 180 days from the date of this prospectus, we and they will not, without the prior written consent of , dispose of or hedge any Class A common shares or any securities convertible into or exchangeable for our Class A common shares, subject to customary exceptions. The representatives in their sole discretion may release any of the securities subject to these lock-up agreements at any time, which, in the case of officers and directors, shall be with notice.
We intend to apply to list our Class A common shares on the NYSE under the symbol “ATH.”
Prior to this offering, there has been no public market for our Class A common shares. Consequently, the initial public offering price for the Class A common shares was determined by negotiations among us, the selling shareholders and the representatives. Among the factors considered in determining the initial public offering price were our results of operations, our current financial condition, our future prospects, our markets, the economic conditions in and future prospects for the industry in which we compete, our management, and currently prevailing general conditions in the equity securities markets, including current market valuations of publicly traded companies considered comparable to our company. We cannot assure you, however, that the price at which the Class A common shares will sell in the public market after this offering will not be lower than the initial public offering price or that an active trading market in our Class A common shares will develop and continue after this offering.
The following table shows the underwriting discounts and commissions that the selling shareholders are to pay to the underwriters in connection with this offering. These amounts are shown assuming both no exercise and full exercise of the underwriters’ option to purchase additional shares.
| Paid by Selling Shareholders | ||||||||
| No Exercise | Full Exercise | |||||||
| Per share |
$ | $ | ||||||
| Total |
$ | $ | ||||||
308
Table of Contents
The total expenses of this offering paid or payable by us will be approximately $ (excluding underwriting discounts and commissions), which includes an amount not to exceed $ that we have agreed to reimburse the underwriters for certain expenses (including fees of counsel for matters related to FINRA) incurred by them in connection with this offering.
In connection with the offering, the underwriters may purchase and sell Class A common shares in the open market. Purchases and sales in the open market may include short sales, purchases to cover short positions, which may include purchases pursuant to the underwriters’ option to purchase additional Class A common shares, and stabilizing purchases.
| • | Short sales involve secondary market sales by the underwriters of a greater number of Class A common shares than they are required to purchase in the offering. |
| • | “Covered” short sales are sales of Class A common shares in an amount up to the number of Class A common shares represented by the underwriters’ option to purchase additional shares. |
| • | “Naked” short sales are sales of Class A common shares in an amount in excess of the number of Class A common shares represented by the underwriters’ option to purchase additional shares. |
| • | Covering transactions involve purchases of shares either pursuant to the underwriters’ option to purchase additional shares or in the open market in order to cover short positions. |
| • | To close a naked short position, the underwriters must purchase Class A common shares in the open market. A naked short position is more likely to be created if the underwriters are concerned that there may be downward pressure on the price of the Class A common shares in the open market after pricing that could adversely affect investors who purchase in the offering. |
| • | To close a covered short position, the underwriters must purchase Class A common shares in the open market or must exercise the option to purchase additional shares. In determining the source of the Class A common shares to close the covered short position, the underwriters will consider, among other things, the price of shares available for purchase in the open market as compared to the price at which they may purchase shares through the underwriters’ option to purchase additional shares. |
| • | Stabilizing transactions involve bids to purchase shares so long as the stabilizing bids do not exceed a specified maximum. |
Purchases to cover short positions and stabilizing purchases, as well as other purchases by the underwriters for their own accounts, may have the effect of preventing or retarding a decline in the market price of the Class A common shares. They may also cause the price of the Class A common shares to be higher than the price that would otherwise exist in the open market in the absence of these transactions. The underwriters may conduct these transactions on the NYSE, in the OTC market or otherwise. If the underwriters commence any of these transactions, they may discontinue them at any time.
Conflicts of Interest
AGS is an affiliate of entities controlled by or affiliated with Apollo, which beneficially own more than 10% of our outstanding common equity and which may receive 5% or more of the net proceeds of this offering. Accordingly, AGS is deemed to have a “conflict of interest” within the meaning of FINRA Rule 5121, and this offering will be conducted in accordance with the provisions of that Rule. AGS will not confirm sales to any account over which it exercises discretion without the specific written approval of the account holder.
Other Relationships
The underwriters are full service financial institutions engaged in various activities, which may include securities trading, commercial and investment banking, financial advisory, investment management, principal
309
Table of Contents
investment, insurance and reinsurance related brokering, hedging, financing and brokerage activities. Certain of the underwriters and their respective affiliates have in the past performed commercial banking, investment banking and advisory services for Athene and Apollo from time to time for which they have received customary fees and reimbursement of expenses and may, from time to time, engage in transactions with and perform services for Athene and Apollo in the ordinary course of their business for which they may receive customary fees and reimbursement of expenses. In addition, in the ordinary course of their various business activities, the underwriters and their respective affiliates may make or hold a broad array of investments and actively trade debt and equity securities (or related derivative securities) and financial instruments (which may include bank loans and/or credit default swaps) for their own account and for the accounts of their customers and may at any time hold long and short positions in such securities and instruments. Such investments and securities activities may involve securities and/or instruments of Athene and Apollo or their affiliates. The underwriters and their affiliates may also make investment recommendations and/or publish or express independent research views in respect of such securities or financial instruments and may hold, or recommend to clients that they acquire, long and/or short positions in such securities and instruments. In addition, Mr. Wheeler, who is a member of our board of directors, also serves on the board of directors of Evercore Partners Inc., which is affiliated with one of the underwriters of this offering.
We and the selling shareholders have agreed to indemnify the underwriters against certain liabilities, including liabilities under the Securities Act, or to contribute to payments the underwriters may be required to make because of any of those liabilities.
Notice to Prospective Investors in Australia
No placement document, prospectus, product disclosure statement or other disclosure document has been lodged with the Australian Securities and Investments Commission (“ASIC”), in relation to the offering. This prospectus does not constitute a prospectus, product disclosure statement or other disclosure document under the Corporations Act 2001 (the “Corporations Act”), and does not purport to include the information required for a prospectus, product disclosure statement or other disclosure document under the Corporations Act.
Any offer in Australia of the Class A common shares may only be made to persons (the “Exempt Investors”) who are “sophisticated investors” (within the meaning of section 708(8) of the Corporations Act), “professional investors” (within the meaning of section 708(11) of the Corporations Act) or otherwise pursuant to one or more exemptions contained in section 708 of the Corporations Act so that it is lawful to offer the Class A common shares without disclosure to investors under Chapter 6D of the Corporations Act.
The shares applied for by Exempt Investors in Australia must not be offered for sale in Australia in the period of 12 months after the date of allotment under the offering, except in circumstances where disclosure to investors under Chapter 6D of the Corporations Act would not be required pursuant to an exemption under section 708 of the Corporations Act or otherwise or where the offer is pursuant to a disclosure document which complies with Chapter 6D of the Corporations Act. Any person acquiring shares must observe such Australian on-sale restrictions.
This prospectus contains general information only and does not take account of the investment objectives, financial situation or particular needs of any particular person. It does not contain any securities recommendations or financial product advice. Before making an investment decision, investors need to consider whether the information in this prospectus is appropriate to their needs, objectives and circumstances, and, if necessary, seek expert advice on those matters.
Notice to Residents of Bermuda
To the extent that the Class A common shares are offered and sold in or from Bermuda, such offer or sale will be made in accordance with the Investment Business Act 2003 of Bermuda.
310
Table of Contents
Notice to Prospective Investors in Canada
The shares may be sold only to purchasers purchasing, or deemed to be purchasing, as principal that are accredited investors, as defined in National Instrument 45-106 Prospectus Exemptions or subsection 73.3(1) of the Securities Act (Ontario), and are permitted clients, as defined in National Instrument 31-103 Registration Requirements, Exemptions and Ongoing Registrant Obligations. Any resale of the shares must be made in accordance with an exemption from, or in a transaction not subject to, the prospectus requirements of applicable securities laws.
Securities legislation in certain provinces or territories of Canada may provide a purchaser with remedies for rescission or damages if this prospectus (including any amendment thereto) contains a misrepresentation, provided that the remedies for rescission or damages are exercised by the purchaser within the time limit prescribed by the securities legislation of the purchaser’s province or territory. The purchaser should refer to any applicable provisions of the securities legislation of the purchaser’s province or territory for particulars of these rights or consult with a legal advisor.
Pursuant to section 3A.3 (or, in the case of securities issued or guaranteed by the government of a non-Canadian jurisdiction, section 3A.4) of National Instrument 33-105 Underwriting Conflicts, or NI 33-105, the underwriters are not required to comply with the disclosure requirements of NI 33-105 regarding underwriter conflicts of interest in connection with this offering.
Notice to Prospective Investors in the European Economic Area
In relation to each member state of the European Economic Area that has implemented the Prospectus Directive (each, a relevant member state), with effect from and including the date on which the Prospectus Directive is implemented in that relevant member state (the relevant implementation date), an offer of shares described in this prospectus may not be made to the public in that relevant member state other than:
| • | to any legal entity which is a qualified investor as defined in the Prospectus Directive; |
| • | to fewer than 150 natural or legal persons (other than qualified investors as defined in the Prospectus Directive), as permitted under the Prospectus Directive, subject to obtaining the prior consent of the relevant Dealer or Dealers nominated by us for any such offer; or |
| • | in any other circumstances falling within Article 3(2) of the Prospectus Directive, |
provided that no such offer of shares shall require us or any underwriter to publish a prospectus pursuant to Article 3 of the Prospectus Directive.
For purposes of this provision, the expression an “offer of securities to the public” in any relevant member state means the communication in any form and by any means of sufficient information on the terms of the offer and the shares to be offered so as to enable an investor to decide to purchase or subscribe for the shares, as the expression may be varied in that member state by any measure implementing the Prospectus Directive in that member state, and the expression “Prospectus Directive” means Directive 2003/71/EC (and amendments thereto, including Directive 2010/73/EU) and includes any relevant implementing measure in the relevant member state.
The sellers of the shares have not authorized and do not authorize the making of any offer of shares through any financial intermediary on their behalf, other than offers made by the underwriters with a view to the final placement of the shares as contemplated in this prospectus. Accordingly, no purchaser of the shares, other than the underwriters, is authorized to make any further offer of the shares on behalf of the sellers or the underwriters.
Notice to Prospective Investors in the UK
This prospectus is only being distributed to, and is only directed at, persons in the UK that are qualified investors within the meaning of Article 2(1)(e) of the Prospectus Directive that are also (i) investment
311
Table of Contents
professionals falling within Article 19(5) of the Financial Services and Markets Act 2000 (Financial Promotion) Order 2005 (the “Order”), or (ii) high net worth entities, and other persons to whom it may lawfully be communicated, falling within Article 49(2)(a) to (d) of the Order, each such person being referred to as a “relevant person.” This prospectus and its contents are confidential and should not be distributed, published or reproduced (in whole or in part) or disclosed by recipients to any other persons in the UK. Any person in the UK that is not a relevant person should not act or rely on this document or any of its contents.
Notice to Prospective Investors in France
Neither this prospectus nor any other offering material relating to the shares described in this prospectus has been submitted to the clearance procedures of the Autorité des Marchés Financiers or of the competent authority of another member state of the European Economic Area and notified to the Autorité des Marchés Financiers. The shares have not been offered or sold and will not be offered or sold, directly or indirectly, to the public in France. Neither this prospectus nor any other offering material relating to the shares has been or will be:
| • | released, issued, distributed or caused to be released, issued or distributed to the public in France; or |
| • | used in connection with any offer for subscription or sale of the shares to the public in France. |
Such offers, sales and distributions will be made in France only:
| • | to qualified investors (investisseurs qualifiés) and/or to a restricted circle of investors (cercle restreint d’investisseurs), in each case investing for their own account, all as defined in, and in accordance with articles L.411-2, D.411-1, D.411-2, D.734-1, D.744-1, D.754-1 and D.764-1 of the French Code monétaire et financier; |
| • | to investment services providers authorized to engage in portfolio management on behalf of third parties; or |
| • | in a transaction that, in accordance with article L.411-2-II-1°-or-2°-or 3° of the French Code monétaire et financier and article 211-2 of the General Regulations (Règlement Général) of the Autorité des Marchés Financiers, does not constitute a public offer (appel public à l’épargne). |
The shares may be resold directly or indirectly, only in compliance with articles L.411-1, L.411-2, L.412-1 and L.621-8 through L.621-8-3 of the French Code monétaire et financier.
Notice to Prospective Investors in Switzerland
This document as well as any other material relating to the shares of our common stock that are the subject of the offering contemplated by this prospectus do not constitute an issue prospectus pursuant to Article 652a or Article 1156 of the Swiss Code of Obligations. Our common stock will not be listed on the SWX Swiss Exchange and, therefore, the documents relating to our common stock, including, but not limited to, this document, do not claim to comply with the disclosure standards of the listing rules of SWX Swiss Exchange and corresponding prospectus schemes annexed to the listing rules of the SWX Swiss Exchange. Our common stock is being offered in Switzerland by way of a private placement, that is, to a small number of selected investors only, without any public offer and only to investors who do not purchase shares of our common stock with the intention to distribute them to the public. The investors will be individually approached by us from time to time. This document as well as any other material relating to our common stock is personal and confidential and does not constitute an offer to any other person. This document may only be used by those investors to whom it has been handed out in connection with the offering described herein and may neither directly nor indirectly be distributed or made available to other persons without our express consent. It may not be used in connection with any other offer and shall in particular not be copied and/or distributed to the public in (or from) Switzerland.
Notice to Prospective Investors in Hong Kong
The shares may not be offered or sold in Hong Kong by means of any document other than (i) in circumstances which do not constitute an offer to the public within the meaning of the Companies Ordinance
312
Table of Contents
(Cap. 32, Laws of Hong Kong), or (ii) to “professional investors” within the meaning of the Securities and Futures Ordinance (Cap. 571, Laws of Hong Kong) and any rules made thereunder, or (iii) in other circumstances which do not result in the document being a “prospectus” within the meaning of the Companies Ordinance (Cap. 32, Laws of Hong Kong) and no advertisement, invitation or document relating to the shares may be issued or may be in the possession of any person for the purpose of issue (in each case whether in Hong Kong or elsewhere), which is directed at, or the contents of which are likely to be accessed or read by, the public in Hong Kong (except if permitted to do so under the laws of Hong Kong) other than with respect to shares which are or are intended to be disposed of only to persons outside Hong Kong or only to “professional investors” within the meaning of the Securities and Futures Ordinance (Cap. 571, Laws of Hong Kong) and any rules made thereunder.
Notice to Prospective Investors in Japan
The shares offered in this prospectus have not been and will not be registered under the Financial Instruments and Exchange Law of Japan. The shares have not been offered or sold and will not be offered or sold, directly or indirectly, in Japan or to or for the account of any resident of Japan (including any corporation or other entity organized under the laws of Japan), except (i) pursuant to an exemption from the registration requirements of the Financial Instruments and Exchange Law and (ii) in compliance with any other applicable requirements of Japanese law.
Notice to Prospective Investors in Singapore
This prospectus has not been registered as a prospectus with the Monetary Authority of Singapore. Accordingly, this prospectus and any other document or material in connection with the offer or sale, or invitation for subscription or purchase, of the shares may not be circulated or distributed, nor may the shares be offered or sold, or be made the subject of an invitation for subscription or purchase, whether directly or indirectly, to persons in Singapore other than (i) to an institutional investor under Section 274 of the Securities and Futures Act, Chapter 289 of Singapore (the “SFA”), (ii) to a relevant person pursuant to Section 275(1), or any person pursuant to Section 275(1A), and in accordance with the conditions specified in Section 275 of the SFA or (iii) otherwise pursuant to, and in accordance with the conditions of, any other applicable provision of the SFA, in each case subject to compliance with conditions set forth in the SFA.
Where the shares are subscribed or purchased under Section 275 of the SFA by a relevant person which is:
| • | a corporation (which is not an accredited investor (as defined in Section 4A of the SFA)) the sole business of which is to hold investments and the entire share capital of which is owned by one or more individuals, each of whom is an accredited investor; or |
| • | a trust (where the trustee is not an accredited investor) whose sole purpose is to hold investments and each beneficiary of the trust is an individual who is an accredited investor, |
shares, debentures and units of shares and debentures of that corporation or the beneficiaries’ rights and interest (howsoever described) in that trust shall not be transferred within six months after that corporation or that trust has acquired the shares pursuant to an offer made under Section 275 of the SFA except:
| • | to an institutional investor (for corporations, under Section 274 of the SFA) or to a relevant person defined in Section 275(2) of the SFA, or to any person pursuant to an offer that is made on terms that such shares, debentures and units of shares and debentures of that corporation or such rights and interest in that trust are acquired at a consideration of not less than S$200,000 (or its equivalent in a foreign currency) for each transaction, whether such amount is to be paid for in cash or by exchange of securities or other assets, and further for corporations, in accordance with the conditions specified in Section 275 of the SFA; |
| • | where no consideration is or will be given for the transfer; or |
| • | where the transfer is by operation of law. |
313
Table of Contents
The validity of the Class A common shares offered hereby will be passed upon for us by Conyers Dill & Pearman Limited, Hamilton, Bermuda. Certain other legal matters relating to this offering will be passed upon for us by Sidley Austin LLP, New York, New York. Certain legal matters will be passed upon for the underwriters by Fried, Frank, Harris, Shriver & Jacobson LLP, New York, New York. Certain partners of Sidley Austin LLP own Class A common shares representing less than 1% of our outstanding common shares as of October 31, 2016.
314
Table of Contents
The consolidated financial statements of Athene Holding Ltd. as of December 31, 2015 and for the year ended December 31, 2015 included in this prospectus and the financial statement schedules as of December 31, 2015 and for the year ended December 31, 2015 have been so included in reliance on the report of PricewaterhouseCoopers LLP (“PwC U.S.”), an independent registered public accounting firm, given on the authority of said firm as experts in auditing and accounting.
In its annual PCAOB Rule 3526 communication to our audit committee for the fiscal year ended December 31, 2015, PwC U.S. disclosed two transactions that may reasonably be thought to bear on PwC U.S.’s independence: first, a private placement note issued by PwC U.S. in 1999 and held by Aviva USA, in the amount of $7 million; and second, a sale-leaseback transaction in 2011 in which PwC U.S. sold a data center to a third party real estate investment trust, which, in turn, financed the transaction with a $55 million securitized note from Aviva USA. The securitized note is secured by the underlying property as well as lease payments from PwC U.S., which has leased the data center for 20 years. We inherited both notes when we acquired Aviva USA in 2013. The $7 million note matured and was paid in accordance with its terms in October 2014. The current outstanding invested asset value of the securitized note is approximately $51 million.
After evaluating these disclosures and discussing the transactions with PwC U.S., management and our audit committee concluded that PwC U.S.’s objectivity and impartiality have not been impaired.
The consolidated financial statements of Athene Holding Ltd. as of December 31, 2014 and for each of the two years in the period ended December 31, 2014 included in this prospectus and the financial statement schedules as of December 31, 2014 and for each of the two years in the period ended December 31, 2014 have been so included in reliance on the report of PricewaterhouseCoopers Ltd., an independent registered public accounting firm, given on the authority of said firm as experts in auditing and accounting.
The consolidated financial statements of Aviva USA and its subsidiaries, as of October 1, 2013 and for the nine month period then ended included in this prospectus have been so included in reliance on the report of PricewaterhouseCoopers LLP, an independent registered public accounting firm, given on the authority of said firm as experts in auditing and accounting.
As a result of a change in the financial reporting responsibilities of our West Des Moines, Iowa, personnel during 2015, PricewaterhouseCoopers Ltd. (“PwC Bermuda”) and PricewaterhouseCoopers LLP (“PwC U.S.”) agreed that it would be appropriate for PwC U.S. to assume principal auditor responsibilities for the year ending December 31, 2015. We, with the approval of our audit committee, engaged PwC U.S. as our new independent registered public accounting firm with effect from December 8, 2015. Prior to the engagement, PwC Bermuda resigned as our independent registered public accounting firm on December 8, 2015.
PwC Bermuda’s reports on our financial statements for the fiscal years ended December 31, 2014 and December 31, 2013 did not contain an adverse opinion or disclaimer of opinion and were not qualified or modified as to uncertainty, audit scope or accounting principle. During the fiscal years ended December 31, 2014 and 2013 and the interim period through December 8, 2015 there were no disagreements with PwC Bermuda on any matters of accounting principles or practices, financial statement disclosure, or auditing scope and procedures which, if not resolved to the satisfaction of PwC Bermuda, would have caused PwC Bermuda to make reference thereto in their report on the financial statements for such fiscal years.
During the fiscal years ended December 31, 2014 and 2013 and the subsequent interim period through December 8, 2015, there have been no reportable events (as defined by Regulation S-K 304(a)(1)(v)) except as
315
Table of Contents
follows. During the process of preparing and completing our audited consolidated financial statements for the year ended December 31, 2013, we determined that we did not have sufficient internal control over financial reporting related to: (1) actuarial balances of the blocks of business acquired from Aviva USA and (2) the preparation and accuracy of income tax balances, each of which constitutes a material weakness. In particular, we determined we did not have sufficient internal controls in place to control the completeness and accuracy of data used in calculating the material actuarial reserves acquired from Aviva USA and monitor the accuracy of complex actuarial models. We concluded that these deficiencies constitute a material weakness. This material weakness resulted in adjustments to interest-sensitive contract liabilities, including VOBA and DAC, on our consolidated balance sheets. Also, as we prepared our audited consolidated financial statements for the year ended December 31, 2013, we identified a lack of internal control over the preparation and accuracy of income tax balances. Delays in the timely preparation of our income tax basis for the opening balance sheet for the acquisition of Aviva USA, delays in the creation of income tax accounting entries and supporting schedules and documentation, limitations in the systems that support our income tax accounting records, deficiencies in the documentation of supporting tax workpapers and deficiencies in the number of and in the training of our tax staff all contributed to our conclusion that this constitutes a material weakness in our internal control over financial reporting. Management believes that these deficiencies no longer constitute material weaknesses as of December 31, 2015 and currently assesses each one as a significant deficiency. A material weakness is a deficiency, or combination of deficiencies, in internal control over financial reporting, such that there is a reasonable possibility that a material misstatement of the annual or interim financial statements will not be prevented or detected on a timely basis. The Audit Committee of the Board of Directors discussed this matter with PwC Bermuda and has authorized PwC Bermuda to respond fully to the inquiries of PwC U.S. concerning this reportable event.
We have requested PwC Bermuda to furnish us a letter addressed to the SEC stating whether or not it agrees with the above statements. A copy of that letter, dated May 9, 2016, is filed as Exhibit 16.1 to the registration statement of which this prospectus forms a part.
During the fiscal years ended December 31, 2014 and 2013 and the subsequent interim period through December 8, 2015, PwC U.S. performed work on components of us, either in support of PwC Bermuda’s audit report or for statutory audit requirements. All consultations with PwC U.S. by us were made in the ordinary course of business.
316
Table of Contents
WHERE YOU CAN FIND MORE INFORMATION
We have filed with the SEC a registration statement on Form S-1 with respect to the Class A common shares being sold in this offering. This prospectus constitutes a part of that registration statement. This prospectus does not contain all the information set forth in the registration statement and the exhibits and schedules to the registration statement, because some parts have been omitted in accordance with the rules and regulations of the SEC. For further information with respect to us and our Class A common shares being sold in this offering, you should refer to the registration statement and the exhibits and schedules filed as part of the registration statement. If a contract or document has been filed as an exhibit to the registration statement, we refer you to the copy of the contract or document that has been filed. Each statement in this prospectus relating to a contract or document filed as an exhibit is qualified in all respects by the filed exhibit.
We are not currently subject to the informational requirements of the Exchange Act. As a result of this offering, we will become subject to the informational requirements of the Exchange Act and, in accordance therewith, will file reports and other information with the SEC. The registration statement, reports and other information we file with the SEC can be read and copied at the SEC’s Public Reference Room at 100 F Street, N.E., Washington D.C. 20549. You may obtain information regarding the operation of the public reference room by calling 1-800-SEC-0330. The SEC also maintains a website (http://www.sec.gov) that contains reports, proxy and information statements and other information that we file electronically with the SEC. We also maintain a website at www.athene.com. Information contained on our website or connected thereto does not constitute a part of, and is not incorporated by reference into, this prospectus or the registration statement of which it forms a part.
317
Table of Contents
INDEX TO CONSOLIDATED FINANCIAL STATEMENTS
| Audited Consolidated Financial Statements: |
||||
| F-2 | ||||
| F-3 | ||||
| F-4 | ||||
| F-6 | ||||
| F-7 | ||||
| F-8 | ||||
| F-9 | ||||
| F-12 | ||||
| Financial Statement Schedules: |
||||
| Schedule I—Summary of Investments—Other Than Investments in Related Parties |
F-104 | |||
| F-105 | ||||
| F-110 | ||||
| F-111 | ||||
| F-112 | ||||
| Unaudited Condensed Consolidated Financial Statements: |
||||
| F-113 | ||||
| F-115 | ||||
| Condensed Consolidated Statements of Comprehensive Income (Loss) (unaudited) |
F-116 | |||
| F-117 | ||||
| F-118 | ||||
| Notes to Condensed Consolidated Financial Statements (unaudited) |
F-121 | |||
| Audited Consolidated Financial Statements of Aviva USA: |
||||
| F-168 | ||||
| F-169 | ||||
| F-170 | ||||
| F-171 | ||||
| F-172 | ||||
| F-173 | ||||
| F-175 | ||||
F-1
Table of Contents
Report of Independent Registered Public Accounting Firm
To the Board of Directors and Shareholders
of Athene Holding Ltd.:
In our opinion, the consolidated balance sheet and the related consolidated statements of income, comprehensive income (loss), equity and cash flows present fairly, in all material respects, the financial position of Athene Holding Ltd. and its subsidiaries at December 31, 2015, and the results of their operations and their cash flows for the year then ended in conformity with accounting principles generally accepted in the United States of America. In addition, in our opinion, the financial statement schedules as of and for the year ended December 31, 2015 listed in the accompanying index present fairly, in all material respects, the information set forth therein when read in conjunction with the related consolidated financial statements. These financial statements and financial statement schedules are the responsibility of the Company’s management. Our responsibility is to express an opinion on these financial statements and financial statement schedules based on our audit. We conducted our audit of these statements in accordance with the standards of the Public Company Accounting Oversight Board (United States). Those standards require that we plan and perform the audit to obtain reasonable assurance about whether the financial statements are free of material misstatement. An audit includes examining, on a test basis, evidence supporting the amounts and disclosures in the financial statements, assessing the accounting principles used and significant estimates made by management, and evaluating the overall financial statement presentation. We believe that our audit provides a reasonable basis for our opinion.
/s/ PricewaterhouseCoopers LLP
Des Moines, IA
May 9, 2016, except for the effects of the revision discussed in Note 2 to the consolidated financial statements, as to which the date is October 25, 2016
F-2
Table of Contents
Report of Independent Registered Public Accounting Firm
To the Board of Directors and Shareholders
of Athene Holding Ltd.:
In our opinion, the consolidated balance sheets and the related consolidated statements of income, comprehensive income (loss), equity and cash flows present fairly, in all material respects, the financial position of Athene Holding Ltd. and its subsidiaries at December 31, 2014, and the results of their operations and their cash flows for each of the two years in the period ended December 31, 2014 in conformity with accounting principles generally accepted in the United States of America. In addition, in our opinion, the financial statement schedules as of December 31, 2014 and for each of the two years in the period ended December 31, 2014 listed in the accompanying index present fairly, in all material respects, the information set forth therein when read in conjunction with the related consolidated financial statements. These financial statements and financial statement schedules are the responsibility of the Company’s management. Our responsibility is to express an opinion on these financial statements and financial statement schedules based on our audits. We conducted our audits of these statements in accordance with the standards of the Public Company Accounting Oversight Board (United States). Those standards require that we plan and perform the audit to obtain reasonable assurance about whether the financial statements are free of material misstatement. An audit includes examining, on a test basis, evidence supporting the amounts and disclosures in the financial statements, assessing the accounting principles used and significant estimates made by management, and evaluating the overall financial statement presentation. We believe that our audits provide a reasonable basis for our opinion.
/s/ PricewaterhouseCoopers Ltd.
Hamilton, Bermuda
May 6, 2016, except for the effects of the revision discussed in Note 2 to the consolidated financial statements, as to which the date is October 25, 2016
F-3
Table of Contents
ATHENE HOLDING LTD.
| December 31, | ||||||||
| (In millions) | 2015 | 2014 | ||||||
| Assets |
||||||||
| Investments |
||||||||
| Available-for-sale securities, at fair value |
||||||||
| Fixed maturity securities (amortized cost: 2015 – $48,227 and 2014 – $43,407) |
$ | 47,816 | $ | 44,703 | ||||
| Equity securities (cost: 2015 – $367 and 2014 – $142) |
407 | 190 | ||||||
| Trading securities, at fair value |
2,468 | 2,795 | ||||||
| Mortgage loans, net of allowances (portion at fair value: 2015 – $48 and 2014 – $73) |
5,500 | 5,465 | ||||||
| Investment funds (portion at fair value: 2015 – $152 and 2014 – $214) |
733 | 832 | ||||||
| Policy loans |
642 | 778 | ||||||
| Funds withheld at interest (portion at fair value: 2015 – $36 and 2014 – $127) |
3,482 | 2,774 | ||||||
| Derivative assets |
871 | 1,842 | ||||||
| Real estate |
566 | — | ||||||
| Short-term investments, at fair value (cost: 2015 – $135 and 2014 – $17) |
135 | 17 | ||||||
| Other investments |
83 | 56 | ||||||
|
|
|
|
|
|||||
| Total investments |
62,703 | 59,452 | ||||||
| Cash and cash equivalents |
2,714 | 2,628 | ||||||
| Restricted cash |
116 | 77 | ||||||
| Investments in related parties |
||||||||
| Available-for-sale, fixed maturity securities, at fair value (amortized cost: 2015 – $332 and 2014 – $336) |
308 | 326 | ||||||
| Trading securities, at fair value |
217 | 268 | ||||||
| Investment funds |
997 | 585 | ||||||
| Short-term investments |
55 | — | ||||||
| Other investments |
245 | — | ||||||
| Accrued investment income (related party: 2015 – $9 and 2014 – $11) |
520 | 505 | ||||||
| Reinsurance recoverable (portion at fair value: 2015 – $2,377 and 2014 – $2,460) |
7,257 | 11,584 | ||||||
| Deferred acquisition costs, deferred sales inducements, and value of business acquired |
2,663 | 2,229 | ||||||
| Current income tax recoverable |
113 | 126 | ||||||
| Deferred tax assets |
606 | 220 | ||||||
| Other assets |
749 | 950 | ||||||
| Assets of consolidated variable interest entities |
||||||||
| Investments |
||||||||
| Trading securities, at fair value |
||||||||
| Fixed maturity securities (related party: 2015 – $53 and 2014 – $57) |
722 | 763 | ||||||
| Equity securities – related party |
309 | 510 | ||||||
| Loans held for investment, at fair value |
— | 2,071 | ||||||
| Investment funds (related party, at fair value: 2015 – $516 and 2014 – $40) |
534 | 65 | ||||||
| Cash and cash equivalents |
6 | 10 | ||||||
| Restricted cash |
— | 43 | ||||||
| Goodwill |
— | 226 | ||||||
| Other assets |
20 | 72 | ||||||
|
|
|
|
|
|||||
| Total assets |
$ | 80,854 | $ | 82,710 | ||||
|
|
|
|
|
|||||
(Continued)
See accompanying notes to consolidated financial statements
F-4
Table of Contents
ATHENE HOLDING LTD.
Consolidated Balance Sheets
| December 31, | ||||||||
| (In millions, except share and per share data) | 2015 | 2014 | ||||||
| Liabilities and Equity |
||||||||
| Liabilities |
||||||||
| Interest sensitive contract liabilities (portion at fair value: 2015 – $6,359 and 2014 – $5,854) |
$ | 57,296 | $ | 60,641 | ||||
| Future policy benefits (portion at fair value: 2015 – $2,478 and 2014 – $2,741) |
14,540 | 11,137 | ||||||
| Other policy claims and benefits |
234 | 195 | ||||||
| Dividends payable to policyholders |
856 | 130 | ||||||
| Derivative liabilities |
17 | 143 | ||||||
| Payables for collateral on derivatives |
867 | 1,402 | ||||||
| Reinsurance payable |
45 | 187 | ||||||
| Funds withheld liability (portion at fair value: 2015 – $35 and 2014 – $394) |
388 | 1,595 | ||||||
| Other liabilities (related party: 2015 – $63 and 2014 – $62) |
731 | 598 | ||||||
| Liabilities of consolidated variable interest entities |
||||||||
| Borrowings (portion at fair value: 2015 – $0 and 2014 – $1,517) |
500 | 2,017 | ||||||
| Other liabilities |
17 | 77 | ||||||
|
|
|
|
|
|||||
| Total liabilities |
75,491 | 78,122 | ||||||
|
|
|
|
|
|||||
| Equity |
||||||||
| Common stock |
||||||||
| Class A – par value $0.001 per share; authorized: 2015 and 2014 – 425,000,000 shares; issued and outstanding: 2015 – 50,151,265 and 2014 – 15,752,736 shares |
— | — | ||||||
| Class B – par value $0.001 per share; authorized: 2015 and 2014 – 325,000,000 shares; issued and outstanding: 2015 – 135,963,975 and 2014 – 125,282,892 shares |
— | — | ||||||
| Class M-1 – par value $0.001 per share; authorized: 2015 and 2014 – 7,109,560 shares; issued and outstanding: 2015 and 2014 – 5,198,273 shares |
— | — | ||||||
| Class M-2 – par value $0.001 per share; authorized: 2015 and 2014 – 5,000,000 shares; issued and outstanding: 2015 and 2014 – 3,125,869 shares |
— | — | ||||||
| Class M-3 – par value $0.001 per share; authorized: 2015 and 2014 – 7,500,000 shares; issued and outstanding: 2015 – 3,110,000 and 2014 – 3,350,000 shares |
— | — | ||||||
| Class M-4 – par value $0.001 per share; authorized: 2015 and 2014 – 7,500,000 shares; issued and outstanding: 2015 – 5,038,443 and 2014 – 0 shares |
— | — | ||||||
| Additional paid-in capital |
3,281 | 2,153 | ||||||
| Retained earnings |
2,318 | 1,758 | ||||||
| Accumulated other comprehensive income (loss) (related party: 2015 – $(24)
and |
(237) | 644 | ||||||
|
|
|
|
|
|||||
| Total Athene Holding Ltd. shareholders’ equity |
5,362 | 4,555 | ||||||
| Noncontrolling interest |
1 | 33 | ||||||
|
|
|
|
|
|||||
| Total equity |
5,363 | 4,588 | ||||||
|
|
|
|
|
|||||
| Total liabilities and equity |
$ | 80,854 | $ | 82,710 | ||||
|
|
|
|
|
|||||
(Concluded)
See accompanying notes to consolidated financial statements
F-5
Table of Contents
ATHENE HOLDING LTD.
Consolidated Statements of Income
| Years ended December 31, | ||||||||||||
| (In millions, except per share data) | 2015 | 2014 | 2013 | |||||||||
| Revenue |
||||||||||||
| Premiums |
$ | 195 | $ | 100 | $ | (1,137) | ||||||
| Product charges |
248 | 218 | 72 | |||||||||
| Net investment income (related party investment income: 2015 – $168, 2014 – $77, and 2013 – $44; and related party investment expense: 2015 – $268, 2014 – $258, and 2013 – $123) |
2,508 | 2,333 | 1,074 | |||||||||
| Investment related gains (losses) (related party: 2015 – $(19), 2014 – $(1), and 2013 – $29) |
(430) | 1,210 | 927 | |||||||||
| Other-than-temporary impairment investment losses |
||||||||||||
| Other-than-temporary impairment losses |
(40) | (7) | 4 | |||||||||
| Other-than-temporary impairment losses recognized in other comprehensive income |
10 | 1 | (5) | |||||||||
|
|
|
|
|
|
|
|||||||
| Net other-than-temporary impairment losses |
(30) | (6) | (1) | |||||||||
| Other revenues |
25 | 20 | 9 | |||||||||
| Bargain purchase gain |
— | — | 152 | |||||||||
| Revenues of consolidated variable interest entities |
||||||||||||
| Net investment income (related party: 2015 – $37, 2014 – $(5), and 2013 – $1) |
67 | 174 | 89 | |||||||||
| Investment related gains (losses) (related party: 2015 – $46, 2014 – $46, and 2013 – $597) |
33 | 51 | 564 | |||||||||
|
|
|
|
|
|
|
|||||||
| Total revenues |
2,616 | 4,100 | 1,749 | |||||||||
|
|
|
|
|
|
|
|||||||
| Benefits and Expenses |
||||||||||||
| Interest sensitive contract benefits |
690 | 1,822 | 1,064 | |||||||||
| Amortization of deferred sales inducements |
20 | 4 | 16 | |||||||||
| Future policy and other policy benefits |
517 | 696 | (950) | |||||||||
| Amortization of deferred acquisition costs and value of business acquired |
203 | 119 | 144 | |||||||||
| Interest expense |
17 | 22 | 8 | |||||||||
| Dividends to policyholders |
28 | 44 | 11 | |||||||||
| Policy and other operating expenses (related party: 2015 – $18, 2014 – $240, and 2013 – $148) |
532 | 797 | 431 | |||||||||
| Operating expenses of consolidated variable interest entities |
||||||||||||
| Interest expense |
15 | 17 | 27 | |||||||||
| Other operating expenses |
2 | 47 | 9 | |||||||||
|
|
|
|
|
|
|
|||||||
| Total benefits and expenses |
2,024 | 3,568 | 760 | |||||||||
|
|
|
|
|
|
|
|||||||
| Income before income taxes |
592 | 532 | 989 | |||||||||
| Income tax expense (benefit) |
14 | 54 | (8) | |||||||||
|
|
|
|
|
|
|
|||||||
| Net income |
578 | 478 | 997 | |||||||||
| Less: Net income attributable to noncontrolling interests |
16 | 15 | 81 | |||||||||
|
|
|
|
|
|
|
|||||||
| Net income available to Athene Holding Ltd. shareholders |
$ | 562 | $ | 463 | $ | 916 | ||||||
|
|
|
|
|
|
|
|||||||
| Earnings per share on Class A and B shares |
||||||||||||
| Basic |
$ | 3.21 | $ | 3.58 | $ | 8.07 | ||||||
| Diluted |
$ | 3.21 | $ | 3.52 | $ | 7.96 | ||||||
See accompanying notes to consolidated financial statements
F-6
Table of Contents
ATHENE HOLDING LTD.
Consolidated Statements of Comprehensive Income (Loss)
| Years ended December 31, | ||||||||||||
| (In millions) | 2015 | 2014 | 2013 | |||||||||
| Net income |
$ | 578 | $ | 478 | $ | 997 | ||||||
|
|
|
|
|
|
|
|||||||
| Other comprehensive income (loss), before tax |
||||||||||||
| Change in unrealized investment gains (losses) on available-for-sale securities, net of offsets |
(1,314) | 899 | (224) | |||||||||
| Change in noncredit component of other-than-temporary impairment losses, available-for-sale |
(10) | (1) | 5 | |||||||||
| Comprehensive income (loss) on hedging instruments |
11 | 10 | (2) | |||||||||
| Comprehensive income (loss) on pension adjustments |
12 | (17) | 1 | |||||||||
| Comprehensive income (loss) on foreign currency translation adjustments |
(4) | — | — | |||||||||
|
|
|
|
|
|
|
|||||||
| Other comprehensive income (loss), before tax |
(1,305) | 891 | (220) | |||||||||
| Income tax expense (benefit) related to other comprehensive income (loss) |
(424) | 317 | (71) | |||||||||
|
|
|
|
|
|
|
|||||||
| Other comprehensive income (loss), after tax |
(881) | 574 | (149) | |||||||||
|
|
|
|
|
|
|
|||||||
| Comprehensive income (loss) |
(303) | 1,052 | 848 | |||||||||
| Less: comprehensive income attributable to noncontrolling interests |
16 | 15 | 81 | |||||||||
|
|
|
|
|
|
|
|||||||
| Comprehensive income (loss) available to Athene Holding Ltd. shareholders |
$ | (319) | $ | 1,037 | $ | 767 | ||||||
|
|
|
|
|
|
|
|||||||
See accompanying notes to consolidated financial statements
F-7
Table of Contents
ATHENE HOLDING LTD.
Consolidated Statements of Equity
| (In millions) | Common stock |
Additional paid-in capital |
Retained earnings |
Accumulated other comprehensive income (loss) |
Total Athene Holding Ltd. shareholders’ equity |
Non controlling interest |
Total equity |
|||||||||||||||||||||
| Balance at December 31, 2012 |
$ | — | $ | 1,217 | $ | 427 | $ | 219 | $ | 1,863 | $ | — | $ | 1,863 | ||||||||||||||
| Net income |
— | — | 916 | — | 916 | 81 | 997 | |||||||||||||||||||||
| Other comprehensive loss |
— | — | — | (149) | (149) | — | (149) | |||||||||||||||||||||
| Issuance of shares, net of expenses |
— | 131 | — | — | 131 | — | 131 | |||||||||||||||||||||
| Change in equity of noncontrolling interests |
— | — | — | — | — | 13 | 13 | |||||||||||||||||||||
|
|
|
|
|
|
|
|
|
|
|
|
|
|
|
|||||||||||||||
| Balance at December 31, 2013 |
— | 1,348 | 1,343 | 70 | 2,761 | 94 | 2,855 | |||||||||||||||||||||
| Net income |
— | — | 463 | — | 463 | 15 | 478 | |||||||||||||||||||||
| Other comprehensive income |
— | — | — | 574 | 574 | — | 574 | |||||||||||||||||||||
| Issuance of shares, net of expenses |
— | 719 | — | — | 719 | — | 719 | |||||||||||||||||||||
| Stock-based compensation |
— | 116 | — | — | 116 | — | 116 | |||||||||||||||||||||
| Retirement or repurchase of shares |
— | (30) | (48) | — | (78) | — | (78) | |||||||||||||||||||||
| Change in equity of noncontrolling interests |
— | — | — | — | — | (76) | (76) | |||||||||||||||||||||
|
|
|
|
|
|
|
|
|
|
|
|
|
|
|
|||||||||||||||
| Balance at December 31, 2014 |
— | 2,153 | 1,758 | 644 | 4,555 | 33 | 4,588 | |||||||||||||||||||||
| Net income |
— | — | 562 | — | 562 | 16 | 578 | |||||||||||||||||||||
| Other comprehensive loss |
— | — | — | (881) | (881) | — | (881) | |||||||||||||||||||||
| Issuance of shares, net of expenses |
— | 1,112 | — | — | 1,112 | — | 1,112 | |||||||||||||||||||||
| Stock-based compensation |
— | 17 | — | — | 17 | — | 17 | |||||||||||||||||||||
| Retirement or repurchase of shares |
— | (1) | (2) | — | (3) | — | (3) | |||||||||||||||||||||
| Change in equity of noncontrolling interests |
— | — | — | — | — | (48) | (48) | |||||||||||||||||||||
|
|
|
|
|
|
|
|
|
|
|
|
|
|
|
|||||||||||||||
| Balance at December 31, 2015 |
$ | — | $ | 3,281 | $ | 2,318 | $ | (237) | $ | 5,362 | $ | 1 | $ | 5,363 | ||||||||||||||
|
|
|
|
|
|
|
|
|
|
|
|
|
|
|
|||||||||||||||
See accompanying notes to consolidated financial statements
F-8
Table of Contents
ATHENE HOLDING LTD.
Consolidated Statements of Cash Flows
| Years ended December 31, | ||||||||||||
| (In millions) | 2015 | 2014 | 2013 | |||||||||
| Cash flows from operating activities |
||||||||||||
| Net income |
$ | 578 | $ | 478 | $ | 997 | ||||||
| Adjustments to reconcile net income to net cash provided by operating activities: |
||||||||||||
| Amortization of deferred acquisition costs and value of business acquired |
203 | 119 | 144 | |||||||||
| Amortization of deferred sales inducements |
20 | 4 | 16 | |||||||||
| Amortization (accretion) of net investment premiums, discounts, and other (related party: 2015 – $(8), 2014 – $0, and 2013 – $(1)) |
(77) | 92 | (23) | |||||||||
| Bargain purchase gain |
— | — | (152) | |||||||||
| Payment at inception of coinsurance agreement |
(10) | — | (173) | |||||||||
| Stock-based compensation |
67 | 373 | 131 | |||||||||
| Net investment (income) loss (related party: 2015 – $(6), 2014 – $(53), and 2013 – $(16)) |
8 | (134) | (221) | |||||||||
| Net recognized (gains) losses on investments and derivatives (related party: 2015 – $42, 2014 – $0, and 2013 – $(25)) |
520 | (1,463) | (806) | |||||||||
| Policy acquisition costs deferred |
(288) | (250) | (125) | |||||||||
| Deferred income tax expense (benefit) |
33 | 138 | (89) | |||||||||
| Changes in operating assets and liabilities: |
||||||||||||
| Accrued investment income |
38 | 4 | 55 | |||||||||
| Interest sensitive contract liabilities |
879 | 2,144 | 465 | |||||||||
| Future policy benefits, other policy claims and benefits, dividends payable to policyholders, reinsurance recoverable, and reinsurance payable |
(574) | (702) | 664 | |||||||||
| Current income tax recoverable |
15 | (77) | (74) | |||||||||
| Funds withheld assets and liabilities |
(278) | — | 68 | |||||||||
| Other assets and liabilities |
(58) | (37) | 147 | |||||||||
| Consolidated variable interest entities related: |
||||||||||||
| Amortization (accretion) of net investment premiums, discounts, and other |
4 | (14) | 12 | |||||||||
| Net investment (income) loss (related party: 2015 – $(1), 2014 – $(1), and 2013 – $(12)) |
3 | 1 | 3 | |||||||||
| Net recognized (gains) losses on investments and derivatives (related party: 2015 – $(46), 2014 – $(46), and 2013 – $(595)) |
(35) | (67) | (655) | |||||||||
| Change in other assets and liabilities |
1 | (10) | 25 | |||||||||
|
|
|
|
|
|
|
|||||||
| Net cash provided by operating activities |
1,049 | 599 | 409 | |||||||||
|
|
|
|
|
|
|
|||||||
(Continued)
See accompanying notes to consolidated financial statements
F-9
Table of Contents
ATHENE HOLDING LTD.
Consolidated Statements of Cash Flows
| Years ended December 31, | ||||||||||||
| (In millions) | 2015 | 2014 | 2013 | |||||||||
| Cash flows from investing activities |
||||||||||||
| Sales, maturities, and repayments of: |
||||||||||||
| Available-for-sale securities |
||||||||||||
| Fixed maturity securities (related party: 2015 – $65, 2014 – $259, and 2013 – $12) |
$ | 10,424 | $ | 9,909 | $ | 8,061 | ||||||
| Equity securities (related party: 2015 – $0, 2014 – $0, and 2013 – $29) |
53 | 11 | 109 | |||||||||
| Trading securities (related party: 2015 – $72, 2014 – $271, and 2013 – $68) |
1,226 | 807 | 1,008 | |||||||||
| Mortgage loans |
788 | 1,062 | 320 | |||||||||
| Investment funds (related party: 2015 – $99, 2014 – $228, and 2013 – $336) |
343 | 793 | 768 | |||||||||
| Derivative instruments and other invested assets |
1,151 | 1,863 | 484 | |||||||||
| Real estate |
63 | — | — | |||||||||
| Short-term investments (related party: 2015 – $130, 2014 – $0, and 2013 – $0) |
207 | — | — | |||||||||
| Purchases of: |
||||||||||||
| Available-for-sale securities |
||||||||||||
| Fixed maturity securities (related party: 2015 – $(64), 2014 – $(527), and 2013 – $(398)) |
(11,069) | (11,000) | (6,435) | |||||||||
| Equity securities |
(239) | (51) | (68) | |||||||||
| Trading securities (related party: 2015 – $(52), 2014 – $(320), and 2013 – $(225)) |
(1,409) | (551) | (375) | |||||||||
| Mortgage loans |
(672) | (908) | (463) | |||||||||
| Investment funds (related party: 2015 – $(510), 2014 – $(517), and 2013 – $(783)) |
(614) | (676) | (1,500) | |||||||||
| Derivative instruments and other invested assets |
(698) | (682) | (229) | |||||||||
| Real estate |
(6) | — | — | |||||||||
| Short-term investments (related party: 2015 – $(85), 2014 – $0, and 2013 – $0) |
(267) | (17) | — | |||||||||
| Consolidated variable interest entities related: |
||||||||||||
| Sales, maturities, and repayments of investments (related party: 2015 – $244, 2014 – $1,401, and 2013 – $474) |
257 | 1,410 | 474 | |||||||||
| Purchases of investments (related party: 2015 – $(17), 2014 – $(482), and 2013 – $(368)) |
(17) | (491) | (373) | |||||||||
| Change in restricted cash |
— | 23 | (22) | |||||||||
| Acquisition of subsidiaries, net of cash acquired |
162 | 33 | 1,386 | |||||||||
| Cash settlement of derivatives |
25 | 1 | (149) | |||||||||
| Change in restricted cash |
(39) | 37 | (71) | |||||||||
| Other investing activities, net |
279 | (241) | 80 | |||||||||
|
|
|
|
|
|
|
|||||||
| Net cash (used in) provided by investing activities |
(52) | 1,332 | 3,005 | |||||||||
|
|
|
|
|
|
|
|||||||
(Continued)
See accompanying notes to consolidated financial statements
F-10
Table of Contents
ATHENE HOLDING LTD.
Consolidated Statements of Cash Flows
| Years ended December 31, | ||||||||||||
| (In millions) | 2015 | 2014 | 2013 | |||||||||
| Cash flows from financing activities |
||||||||||||
| Capital contributions |
$ 1,116 | $ 305 | $ 82 | |||||||||
| Proceeds from note payables |
— | — | 500 | |||||||||
| Repayment of note payables |
(4) | (300) | (302) | |||||||||
| Deposits on investment-type policies and contracts |
3,460 | 3,393 | 1,880 | |||||||||
| Withdrawals on investment-type policies and contracts |
(4,783) | (5,551) | (2,849) | |||||||||
| Payments for coinsurance agreements on investment-type contracts, net |
(153) | (320) | (64) | |||||||||
| Consolidated variable interest entities related: |
||||||||||||
| Proceeds from borrowings |
— | 319 | 154 | |||||||||
| Repayment on borrowings |
— | (723) | (6) | |||||||||
| Capital contributions from noncontrolling interests |
— | 21 | — | |||||||||
| Capital distributions to noncontrolling interests |
(30) | (97) | (38) | |||||||||
| Net change in cash collateral posted for derivative transactions |
(535) | 661 | (76) | |||||||||
| Repurchase of common stock |
(3) | (78) | — | |||||||||
| Other financing activities, net |
21 | 42 | (22) | |||||||||
|
|
|
|
|
|
|
|||||||
| Net cash used in financing activities |
(911) | (2,328) | (741) | |||||||||
|
|
|
|
|
|
|
|||||||
| Effect of exchange rate changes on cash and cash equivalents |
(4) | — | — | |||||||||
|
|
|
|
|
|
|
|||||||
| Net increase (decrease) in cash and cash equivalents |
82 | (397) | 2,673 | |||||||||
| Cash and cash equivalents at beginning of year1 |
2,638 | 3,035 | 362 | |||||||||
|
|
|
|
|
|
|
|||||||
| Cash and cash equivalents at end of year1 |
$ 2,720 | $ 2,638 | $ 3,035 | |||||||||
|
|
|
|
|
|
|
|||||||
| Supplementary information |
||||||||||||
| Cash (refunded) paid for taxes |
$ (34) | $ 59 | $ 154 | |||||||||
| Cash paid for interest |
22 | 56 | 36 | |||||||||
| Non-cash transactions |
||||||||||||
| Deposits on investment-type policies and contracts through reinsurance agreements |
1,182 | 418 | 247 | |||||||||
| Withdrawals on investment-type policies and contracts through reinsurance agreements |
373 | 219 | 166 | |||||||||
| Investment funds acquired in exchange for non-cash assets and liabilities |
473 | — | — | |||||||||
| Issuance of capital for payment of liabilities |
— | 199 | — | |||||||||
| Issuance of capital for purchase of investment funds |
— | — | 50 | |||||||||
| Reduction in investments and other assets and liabilities relating to reinsurance |
920 | — | 6,196 | |||||||||
| Increase in funds withheld liability for reinsurance receivable |
— | — | 1,450 | |||||||||
| Modco balances settled in investments |
75 | 6 | 13 | |||||||||
1 Includes cash and cash equivalents of consolidated variable interest entities
(Concluded)
See accompanying notes to consolidated financial statements
F-11
Table of Contents
ATHENE HOLDING LTD.
Notes to Consolidated Financial Statements
1. Organization and Corporate Structure
Athene Holding Ltd. (AHL), a Bermuda exempted company, together with its subsidiaries (collectively, Athene, we, our, us, or the Company), is a leading retirement services company that issues, reinsures, and acquires retirement savings products in all 50 U.S. states, the District of Columbia, and Germany.
We conduct business primarily through the following consolidated subsidiaries:
| • | Athene Life Re Ltd., a Bermuda exempted company to which AHL’s other insurance subsidiaries and third party ceding companies directly and indirectly reinsure a portion of their liabilities (ALRe); |
| • | Athene USA Corporation, an Iowa corporation and its subsidiaries (Athene USA); and |
| • | Athene Deutschland GmbH & Co. KG, a German partnership and its subsidiaries (ADKG). |
In addition, we consolidate the following variable interest entities (VIE), for which we have determined that we are the primary beneficiary:
| • | AAA Investments (Co-Invest VI), L.P., a Delaware limited partnership (CoInvest VI); |
| • | AAA Investments (Co-Invest VII), L.P., a Delaware limited partnership (CoInvest VII); |
| • | AAA Investments (Other), L.P., a Marshall Islands limited partnership (CoInvest Other); |
| • | London Prime Apartments Guernsey Holdings Limited, a Guernsey limited company (London Prime); and |
| • | 2012 CMBS-I Fund L.P., a Delaware limited partnership, and 2012 CMBS-II Fund L.P., a Delaware limited partnership (collectively, CMBS Funds). |
2. Change in Accounting Policy and Revisions
Subsequent to the original issuance of the consolidated financial statements, we adopted a change in accounting principle regarding the balance sheet presentation of assets and liabilities associated with reinsurance agreements written on a modified coinsurance (modco) basis. The funds withheld assets and liabilities arising from modco contracts are now presented gross of the corresponding policy benefit liabilities on the consolidated balance sheets, whereas these assets and liabilities were previously presented net on a contract-by-contract basis. We determined gross presentation is preferable to net presentation on the basis that gross presentation increases transparency and aligns the presentation of modco reinsurance with that of funds withheld coinsurance, which is an economically equivalent form of reinsurance. Additionally, we expect increased use of modco reinsurance in our ongoing business operations, and believe gross presentation is necessary to best reflect the economic impact of modco transactions.
We applied this change retrospectively on the consolidated balance sheets, as well as the corresponding classification changes within operating activities on the consolidated statements of cash flows. There was no impact to the consolidated statements of income, consolidated statements of comprehensive income, or consolidated statements of equity resulting from this change.
We have also revised our consolidated financial statements as a result of correcting immaterial misstatements. We assessed the materiality of these revisions and concluded these revisions are not material to the consolidated financial statements as a whole. However, we elected to revise the consolidated financial statements to increase accuracy of the consolidated financial statements, as well as consistency and comparability with balances and activities to be reported in future periods.
F-12
Table of Contents
ATHENE HOLDING LTD.
Notes to Consolidated Financial Statements
The following is a summary of the impacts of the change in accounting policy and revisions on the consolidated balance sheets:
| December 31, 2015 | ||||||||||||||||
| (In millions) | As Previously Reported |
Change in Accounting Policy |
Revisions | As Adjusted | ||||||||||||
| Assets |
||||||||||||||||
| Investments |
||||||||||||||||
| Funds withheld at interest |
$ | 2,104 | $ | 1,378 | $ | — | $ | 3,482 | ||||||||
|
|
|
|
|
|
|
|
|
|||||||||
| Total investments |
61,325 | 1,378 | — | 62,703 | ||||||||||||
| Reinsurance recoverable |
7,134 | 122 | 1 | 7,257 | ||||||||||||
| Deferred acquisition costs, deferred sales inducements, and value of business acquired |
2,654 | — | 9 | 2,663 | ||||||||||||
| Current income tax recoverable |
121 | — | (8) | 113 | ||||||||||||
| Deferred tax assets |
619 | — | (13) | 606 | ||||||||||||
| Assets of consolidated variable interest entities |
||||||||||||||||
| Investments |
||||||||||||||||
| Trading securities, at fair value |
||||||||||||||||
| Fixed maturity securities |
717 | — | 5 | 722 | ||||||||||||
|
|
|
|
|
|
|
|
|
|||||||||
| Total assets |
$ | 79,360 | $ | 1,500 | $ | (6) | $ | 80,854 | ||||||||
|
|
|
|
|
|
|
|
|
|||||||||
| Liabilities and Equity |
||||||||||||||||
| Liabilities |
||||||||||||||||
| Interest sensitive contract liabilities |
$ | 55,795 | $ | 1,480 | $ | 21 | $ | 57,296 | ||||||||
| Future policy benefits |
14,544 | — | (4) | 14,540 | ||||||||||||
| Other policy claims and benefits |
269 | — | (35) | 234 | ||||||||||||
| Reinsurance payable |
180 | (134) | (1) | 45 | ||||||||||||
| Funds withheld liability |
234 | 154 | — | 388 | ||||||||||||
| Other liabilities |
728 | — | 3 | 731 | ||||||||||||
|
|
|
|
|
|
|
|
|
|||||||||
| Total liabilities |
74,007 | 1,500 | (16) | 75,491 | ||||||||||||
|
|
|
|
|
|
|
|
|
|||||||||
| Equity |
||||||||||||||||
| Retained earnings |
2,306 | — | 12 | 2,318 | ||||||||||||
| Accumulated other comprehensive income (loss) |
(235) | — | (2) | (237) | ||||||||||||
|
|
|
|
|
|
|
|
|
|||||||||
| Total Athene Holding Ltd. shareholders’ equity |
5,352 | — | 10 | 5,362 | ||||||||||||
| Noncontrolling interest |
1 | — | — | 1 | ||||||||||||
|
|
|
|
|
|
|
|
|
|||||||||
| Total equity |
5,353 | — | 10 | 5,363 | ||||||||||||
|
|
|
|
|
|
|
|
|
|||||||||
| Total liabilities and equity |
$ | 79,360 | $ | 1,500 | $ | (6) | $ | 80,854 | ||||||||
|
|
|
|
|
|
|
|
|
|||||||||
F-13
Table of Contents
ATHENE HOLDING LTD.
Notes to Consolidated Financial Statements
The following is a summary of the impacts of the change in accounting policy and revisions on the consolidated balance sheets:
| December 31, 2014 | ||||||||||||||||
| (In millions) | As Previously Reported |
Change in Accounting Policy |
Revisions | As Adjusted | ||||||||||||
| Assets |
||||||||||||||||
| Investments |
||||||||||||||||
| Funds withheld at interest |
$ | 2,451 | $ | 323 | $ | — | $ | 2,774 | ||||||||
|
|
|
|
|
|
|
|
|
|||||||||
| Total investments |
59,129 | 323 | — | 59,452 | ||||||||||||
| Accrued investment income |
515 | — | (10) | 505 | ||||||||||||
| Reinsurance recoverable |
11,436 | 145 | 3 | 11,584 | ||||||||||||
| Deferred acquisition costs, deferred sales inducements, and value of business acquired |
2,226 | — | 3 | 2,229 | ||||||||||||
| Current income tax recoverable |
95 | — | 31 | 126 | ||||||||||||
| Deferred tax assets |
251 | — | (31) | 220 | ||||||||||||
| Other assets |
940 | — | 10 | 950 | ||||||||||||
| Assets of consolidated variable interest entities |
||||||||||||||||
| Investments |
||||||||||||||||
| Trading securities, at fair value |
||||||||||||||||
| Fixed maturity securities |
758 | — | 5 | 763 | ||||||||||||
|
|
|
|
|
|
|
|
|
|||||||||
| Total assets |
$ | 82,231 | $ | 468 | $ | 11 | $ | 82,710 | ||||||||
|
|
|
|
|
|
|
|
|
|||||||||
| Liabilities and Equity |
||||||||||||||||
| Liabilities |
||||||||||||||||
| Interest sensitive contract liabilities |
$ | 60,259 | $ | 349 | $ | 33 | $ | 60,641 | ||||||||
| Future policy benefits |
11,140 | — | (3) | 11,137 | ||||||||||||
| Other policy claims and benefits |
230 | — | (35) | 195 | ||||||||||||
| Reinsurance payable |
241 | (56) | 2 | 187 | ||||||||||||
| Funds withheld liability |
1,420 | 175 | — | 1,595 | ||||||||||||
| Other liabilities |
597 | — | 1 | 598 | ||||||||||||
|
|
|
|
|
|
|
|
|
|||||||||
| Total liabilities |
77,656 | 468 | (2) | 78,122 | ||||||||||||
|
|
|
|
|
|
|
|
|
|||||||||
| Equity |
||||||||||||||||
| Retained earnings |
1,745 | — | 13 | 1,758 | ||||||||||||
|
|
|
|
|
|
|
|
|
|||||||||
| Total Athene Holding Ltd. shareholders’ equity |
4,542 | — | 13 | 4,555 | ||||||||||||
| Noncontrolling interest |
33 | — | — | 33 | ||||||||||||
|
|
|
|
|
|
|
|
|
|||||||||
| Total equity |
4,575 | — | 13 | 4,588 | ||||||||||||
|
|
|
|
|
|
|
|
|
|||||||||
| Total liabilities and equity |
$ | 82,231 | $ | 468 | $ | 11 | $ | 82,710 | ||||||||
|
|
|
|
|
|
|
|
|
|||||||||
F-14
Table of Contents
ATHENE HOLDING LTD.
Notes to Consolidated Financial Statements
The following is a summary of the impacts of the revisions on the consolidated statements of income:
| Year ended December 31, 2015 | ||||||||||||
| (In millions, except per share data) | As Previously Reported |
Revisions | As Adjusted | |||||||||
| Revenue |
||||||||||||
| Net investment income |
$ | 2,500 | $ | 8 | $ | 2,508 | ||||||
| Investment related gains (losses) |
(414) | (16) | (430) | |||||||||
|
|
|
|
|
|
|
|||||||
| Total revenues |
2,624 | (8) | 2,616 | |||||||||
|
|
|
|
|
|
|
|||||||
| Benefits and Expenses |
||||||||||||
| Interest sensitive contract benefits |
711 | (21) | 690 | |||||||||
| Amortization of deferred sales inducements |
21 | (1) | 20 | |||||||||
| Future policy and other policy benefits |
516 | 1 | 517 | |||||||||
| Amortization of deferred acquisition costs and value of business acquired |
208 | (5) | 203 | |||||||||
| Interest expense |
19 | (2) | 17 | |||||||||
|
|
|
|
|
|
|
|||||||
| Total benefits and expenses |
2,052 | (28) | 2,024 | |||||||||
|
|
|
|
|
|
|
|||||||
| Income before income taxes |
572 | 20 | 592 | |||||||||
| Income tax expense (benefit) |
(7) | 21 | 14 | |||||||||
|
|
|
|
|
|
|
|||||||
| Net income |
579 | (1) | 578 | |||||||||
| Less: Net income attributable to noncontrolling interests |
16 | — | 16 | |||||||||
|
|
|
|
|
|
|
|||||||
| Net income available to Athene Holding Ltd. shareholders |
$ | 563 | $ | (1) | $ | 562 | ||||||
|
|
|
|
|
|
|
|||||||
| Earnings per share on Class A and B shares |
||||||||||||
| Basic |
$ | 3.22 | $ | (0.01) | $ | 3.21 | ||||||
| Diluted |
$ | 3.22 | $ | (0.01) | $ | 3.21 | ||||||
| Year ended December 31, 2014 | ||||||||||||
| (In millions, except per share data) | As Previously Reported |
Revisions | As Adjusted | |||||||||
| Revenue |
||||||||||||
| Net investment income |
$ | 2,324 | $ | 9 | $ | 2,333 | ||||||
| Investment related gains (losses) |
1,248 | (38) | 1,210 | |||||||||
|
|
|
|
|
|
|
|||||||
| Total revenues |
4,129 | (29) | 4,100 | |||||||||
|
|
|
|
|
|
|
|||||||
| Benefits and Expenses |
||||||||||||
| Interest sensitive contract benefits |
1,841 | (19) | 1,822 | |||||||||
| Future policy and other policy benefits |
702 | (6) | 696 | |||||||||
| Interest expense |
29 | (7) | 22 | |||||||||
|
|
|
|
|
|
|
|||||||
| Total benefits and expenses |
3,600 | (32) | 3,568 | |||||||||
|
|
|
|
|
|
|
|||||||
| Income before income taxes |
529 | 3 | 532 | |||||||||
| Income tax expense |
46 | 8 | 54 | |||||||||
|
|
|
|
|
|
|
|||||||
| Net income |
483 | (5) | 478 | |||||||||
| Less: Net income attributable to noncontrolling interests |
15 | — | 15 | |||||||||
|
|
|
|
|
|
|
|||||||
| Net income available to Athene Holding Ltd. shareholders |
$ | 468 | $ | (5) | $ | 463 | ||||||
|
|
|
|
|
|
|
|||||||
| Earnings per share on Class A and B shares |
||||||||||||
| Basic |
$ | 3.61 | $ | (0.03) | $ | 3.58 | ||||||
| Diluted |
$ | 3.56 | $ | (0.04) | $ | 3.52 | ||||||
F-15
Table of Contents
ATHENE HOLDING LTD.
Notes to Consolidated Financial Statements
The following is a summary of the impacts of the revisions on the consolidated statements of income:
| Year ended December 31, 2013 | ||||||||||||
| (In millions, except per share data) | As Previously Reported |
Revisions | As Adjusted | |||||||||
| Revenue |
||||||||||||
| Investment related gains (losses) |
$ | 931 | $ | (4) | $ | 927 | ||||||
| Bargain purchase gain |
146 | 6 | 152 | |||||||||
| Revenues of consolidated variable interest entities |
||||||||||||
| Investment related gains (losses) |
559 | 5 | 564 | |||||||||
|
|
|
|
|
|
|
|||||||
| Total revenues |
1,742 | 7 | 1,749 | |||||||||
|
|
|
|
|
|
|
|||||||
| Benefits and Expenses |
||||||||||||
| Interest sensitive contract benefits |
1,068 | (4) | 1,064 | |||||||||
| Amortization of deferred acquisition costs and value of business acquired |
147 | (3) | 144 | |||||||||
| Interest expense |
10 | (2) | 8 | |||||||||
|
|
|
|
|
|
|
|||||||
| Total benefits and expenses |
769 | (9) | 760 | |||||||||
|
|
|
|
|
|
|
|||||||
| Income before income taxes |
973 | 16 | 989 | |||||||||
| Income tax benefit |
— | (8) | (8) | |||||||||
|
|
|
|
|
|
|
|||||||
| Net income |
973 | 24 | 997 | |||||||||
| Less: Net income attributable to noncontrolling interests |
81 | — | 81 | |||||||||
|
|
|
|
|
|
|
|||||||
| Net income available to Athene Holding Ltd. shareholders |
$ | 892 | $ | 24 | $ | 916 | ||||||
|
|
|
|
|
|
|
|||||||
| Earnings per share on Class A and B shares |
||||||||||||
| Basic |
$ | 7.86 | $ | 0.21 | $ | 8.07 | ||||||
| Diluted |
$ | 7.75 | $ | 0.21 | $ | 7.96 | ||||||
The following is a summary of the impacts of the revisions on the consolidated statement of comprehensive loss:
| Year ended December 31, 2015 | ||||||||||||
| (In millions) | As Previously Reported |
Revisions | As Adjusted | |||||||||
| Net income |
$ | 579 | $ | (1) | $ | 578 | ||||||
| Other comprehensive loss, before tax |
||||||||||||
| Comprehensive loss on foreign currency translation adjustments |
(2) | (2) | (4) | |||||||||
|
|
|
|
|
|
|
|||||||
| Other comprehensive loss, before tax |
(1,303) | (2) | (1,305) | |||||||||
| Income tax benefit related to other comprehensive loss |
(424) | — | (424) | |||||||||
|
|
|
|
|
|
|
|||||||
| Other comprehensive loss, after tax |
(879) | (2) | (881) | |||||||||
|
|
|
|
|
|
|
|||||||
| Comprehensive loss |
(300) | (3) | (303) | |||||||||
| Less: comprehensive income attributable to noncontrolling interests |
16 | — | 16 | |||||||||
|
|
|
|
|
|
|
|||||||
| Comprehensive loss available to Athene Holding Ltd. shareholders |
$ | (316) | $ | (3) | $ | (319) | ||||||
|
|
|
|
|
|
|
|||||||
F-16
Table of Contents
ATHENE HOLDING LTD.
Notes to Consolidated Financial Statements
For the years ended December 31, 2014, and 2013, the only impact to the consolidated statements of comprehensive income were the revisions to net income for the corresponding year.
We revised the consolidated statements of equity for the years ended December 31, 2015, 2014, and 2013, for the changes to net income and other comprehensive income (loss) as presented above. In addition, the balance of retained earnings was revised from $433 million to $427 million as of December 31, 2012, as a result of revisions to periods prior to 2013.
The following is a summary of the impacts of change in accounting policy and revisions on the impacted lines of the consolidated statements of cash flows:
| Year ended December 31, 2015 | ||||||||||||||||
| (In millions) | As Previously Reported |
Change in Accounting Policy |
Revisions | As Adjusted | ||||||||||||
| Cash flows from operating activities |
||||||||||||||||
| Net income |
$ | 579 | $ | — | $ | (1) | $ | 578 | ||||||||
| Adjustments to reconcile net income to net cash provided by operating activities: |
||||||||||||||||
| Amortization of deferred acquisition costs and value of business acquired |
208 | — | (5) | 203 | ||||||||||||
| Amortization of deferred sales inducements |
21 | — | (1) | 20 | ||||||||||||
| Net investment (income) loss |
16 | — | (8) | 8 | ||||||||||||
| Net recognized (gains) losses on investments and derivatives |
512 | — | 8 | 520 | ||||||||||||
| Deferred income tax expense |
51 | — | (18) | 33 | ||||||||||||
| Changes in operating assets and liabilities: |
||||||||||||||||
| Accrued investment income |
48 | — | (10) | 38 | ||||||||||||
| Interest sensitive contract liabilities |
985 | 16 | (122) | 879 | ||||||||||||
| Future policy benefits, other policy claims and benefits, dividends payable to policyholders, reinsurance recoverable, and reinsurance payable1 |
(627) | (55) | 108 | (574) | ||||||||||||
| Current income tax recoverable |
(24) | — | 39 | 15 | ||||||||||||
| Funds withheld assets and liabilities |
(317) | 39 | — | (278) | ||||||||||||
| Other asset and liabilities |
(42) | — | (16) | (58) | ||||||||||||
|
|
|
|
|
|
|
|
|
|||||||||
| Net cash provided by operating activities |
1,075 | — | (26) | 1,049 | ||||||||||||
|
|
|
|
|
|
|
|
|
|||||||||
| Cash flows from investing activities |
||||||||||||||||
| Other investing activities, net |
269 | — | 10 | 279 | ||||||||||||
|
|
|
|
|
|
|
|
|
|||||||||
| Net cash used in investing activities |
(62) | — | 10 | (52) | ||||||||||||
|
|
|
|
|
|
|
|
|
|||||||||
| Cash flows from financing activities |
||||||||||||||||
| Other financing activities, net |
5 | — | 16 | 21 | ||||||||||||
|
|
|
|
|
|
|
|
|
|||||||||
| Net cash used in financing activities |
(927) | — | 16 | (911) | ||||||||||||
|
|
|
|
|
|
|
|
|
|||||||||
| Net increase in cash and cash equivalents |
82 | — | — | 82 | ||||||||||||
| Cash and cash equivalents at beginning of year2 |
2,638 | — | — | 2,638 | ||||||||||||
|
|
|
|
|
|
|
|
|
|||||||||
| Cash and cash equivalents at end of year2 |
$ | 2,720 | $ | — | $ | — | $ | 2,720 | ||||||||
|
|
|
|
|
|
|
|
|
|||||||||
| Supplementary information |
||||||||||||||||
| Non-cash transactions |
||||||||||||||||
| Modco balances settled in investments |
$ | — | $ | — | $ | 75 | $ | 75 | ||||||||
| 1 | Financial statement line item renamed for the current year presentation |
| 2 | Includes cash and cash equivalents of consolidated variable interest entities |
F-17
Table of Contents
ATHENE HOLDING LTD.
Notes to Consolidated Financial Statements
The following is a summary of the impacts of change in accounting policy and revisions on the impacted lines of the consolidated statements of cash flows:
| Year ended December 31, 2014 | ||||||||||||||||
| (In millions) | As Previously Reported |
Change in Accounting Policy |
Revisions | As Adjusted | ||||||||||||
| Cash flows from operating activities |
||||||||||||||||
| Net income |
$ | 483 | $ | — | $ | (5) | $ | 478 | ||||||||
| Adjustments to reconcile net income to net cash provided by operating activities: |
||||||||||||||||
| Net investment (income) loss |
(124) | — | (10) | (134) | ||||||||||||
| Net recognized (gains) losses on investments and derivatives |
(1,473) | — | 10 | (1,463) | ||||||||||||
| Deferred income tax expense |
99 | — | 39 | 138 | ||||||||||||
| Changes in operating assets and liabilities: |
||||||||||||||||
| Accrued investment income |
(6) | — | 10 | 4 | ||||||||||||
| Interest sensitive contract liabilities |
2,139 | 5 | — | 2,144 | ||||||||||||
| Future policy benefits, other policy claims and benefits, dividends payable to policyholders, reinsurance recoverable, and reinsurance payable1 |
(667) | (42) | 7 | (702) | ||||||||||||
| Current income tax recoverable |
(46) | — | (31) | (77) | ||||||||||||
| Funds withheld assets and liabilities |
(37) | 37 | — | — | ||||||||||||
| Other asset and liabilities |
(4) | — | (33) | (37) | ||||||||||||
|
|
|
|
|
|
|
|
|
|||||||||
| Net cash provided by operating activities |
612 | — | (13) | 599 | ||||||||||||
|
|
|
|
|
|
|
|
|
|||||||||
| Cash flows from investing activities |
||||||||||||||||
| Other investing activities, net |
(231) | — | (10) | (241) | ||||||||||||
|
|
|
|
|
|
|
|
|
|||||||||
| Net cash provided by investing activities |
1,342 | — | (10) | 1,332 | ||||||||||||
|
|
|
|
|
|
|
|
|
|||||||||
| Cash flows from financing activities |
||||||||||||||||
| Withdrawals on investment-type policies and contracts |
(5,540) | — | (11) | (5,551) | ||||||||||||
| Other financing activities, net |
8 | — | 34 | 42 | ||||||||||||
|
|
|
|
|
|
|
|
|
|||||||||
| Net cash used in financing activities |
(2,351) | — | 23 | (2,328) | ||||||||||||
|
|
|
|
|
|
|
|
|
|||||||||
| Net decrease in cash and cash equivalents |
(397) | — | — | (397) | ||||||||||||
| Cash and cash equivalents at beginning of year2 |
3,035 | — | — | 3,035 | ||||||||||||
|
|
|
|
|
|
|
|
|
|||||||||
| Cash and cash equivalents at end of year2 |
$ | 2,638 | $ | — | $ | — | $ | 2,638 | ||||||||
|
|
|
|
|
|
|
|
|
|||||||||
| Supplementary information |
||||||||||||||||
| Non-cash transactions |
||||||||||||||||
| Modco balances settled in investments |
$ | — | $ | — | $ | 6 | $ | 6 | ||||||||
| 1 | Financial statement line item renamed for the current year presentation |
| 2 | Includes cash and cash equivalents of consolidated variable interest entities |
F-18
Table of Contents
ATHENE HOLDING LTD.
Notes to Consolidated Financial Statements
The following is a summary of the impacts of change in accounting policy and revisions on the impacted lines of the consolidated statements of cash flows:
| Year ended December 31, 2013 | ||||||||||||||||
| (In millions) | As Previously Reported |
Change in Accounting Policy |
Revisions | As Adjusted | ||||||||||||
| Cash flows from operating activities |
||||||||||||||||
| Net income |
$ | 973 | $ | — | $ | 24 | $ | 997 | ||||||||
| Adjustments to reconcile net income to net cash provided by operating activities: |
||||||||||||||||
| Amortization of deferred acquisition costs and value of business acquired |
147 | — | (3) | 144 | ||||||||||||
| Bargain purchase gain |
(146) | — | (6) | (152) | ||||||||||||
| Deferred income tax benefit |
(81) | — | (8) | (89) | ||||||||||||
| Changes in operating assets and liabilities: |
||||||||||||||||
| Interest sensitive contract liabilities |
467 | — | (2) | 465 | ||||||||||||
| Future policy benefits, other policy claims and benefits, dividends payable to policyholders, reinsurance recoverable, and reinsurance payable1 |
869 | (159) | (46) | 664 | ||||||||||||
| Funds withheld assets and liabilities |
(91) | 159 | — | 68 | ||||||||||||
| Other asset and liabilities |
134 | — | 13 | 147 | ||||||||||||
| Consolidated variable interest entities related: |
||||||||||||||||
| Net recognized gains on investments and derivatives |
(650) | — | (5) | (655) | ||||||||||||
|
|
|
|
|
|
|
|
|
|||||||||
| Net cash provided by operating activities |
442 | — | (33) | 409 | ||||||||||||
|
|
|
|
|
|
|
|
|
|||||||||
| Cash flows from financing activities |
||||||||||||||||
| Withdrawals on investment-type policies and contracts |
(2,895) | — | 46 | (2,849) | ||||||||||||
| Other financing activities, net |
(9) | — | (13) | (22) | ||||||||||||
|
|
|
|
|
|
|
|
|
|||||||||
| Net cash used in financing activities |
(774) | — | 33 | (741) | ||||||||||||
|
|
|
|
|
|
|
|
|
|||||||||
| Net increase in cash and cash equivalents |
2,673 | — | — | 2,673 | ||||||||||||
| Cash and cash equivalents at beginning of year2 |
362 | — | — | 362 | ||||||||||||
|
|
|
|
|
|
|
|
|
|||||||||
| Cash and cash equivalents at end of year2 |
$ | 3,035 | $ | — | $ | — | $ | 3,035 | ||||||||
|
|
|
|
|
|
|
|
|
|||||||||
| Supplementary information |
||||||||||||||||
| Non-cash transactions |
||||||||||||||||
| Modco balances settled in investments |
$ | — | $ | — | $ | 13 | $ | 13 | ||||||||
| 1 | Financial statement line item renamed for the current year presentation |
| 2 | Includes cash and cash equivalents of consolidated variable interest entities |
3. Summary of Significant Accounting Policies
Consolidation and Basis of Presentation—The consolidated financial statements of the Company include our wholly owned subsidiaries, investees we control, and any variable interest entities where we are the primary beneficiary. Investments in entities that we do not control, but have the ability to exercise significant influence over operating and financing decisions, other than investments for which we have elected the fair value option, are accounted for under the equity method. Intercompany balances and transactions have been eliminated.
For entities that are consolidated, but not 100% owned, we allocate a portion of the income or loss and corresponding equity to the owners other than the Company. We include the aggregate of the income or loss and corresponding equity that is not owned by the Company in noncontrolling interests in the consolidated financial statements.
F-19
Table of Contents
ATHENE HOLDING LTD.
Notes to Consolidated Financial Statements
We report investments in related parties and assets and liabilities of consolidated VIEs separately, as further described in the accounting policies that follow.
We have prepared the consolidated financial statements in accordance with accounting principles generally accepted in the United States of America (GAAP), which requires us to make estimates and assumptions that affect the reported amounts of assets and liabilities at the date of the financial statements and the reported amounts of revenue and expenses during the period. Actual experience could materially differ from these estimates and assumptions. The Company’s principal estimates impact:
| • | fair value of investments; |
| • | impairment of investments and valuation allowances; |
| • | derivatives valuation, including embedded derivatives; |
| • | deferred acquisition costs (DAC), deferred sales inducements (DSI), and value of business acquired (VOBA); |
| • | future policy benefit reserves; |
| • | valuation allowances on deferred tax assets; and |
| • | stock-based compensation. |
Additional details around these principal estimates and assumptions are discussed in the significant accounting policies that follow and the related footnote disclosures.
Investments
Fixed Maturity and Equity Securities – Fixed maturity securities includes bonds, collateralized loan obligations (CLO), asset-backed securities (ABS), residential mortgage-backed securities (RMBS), commercial mortgage-backed securities (CMBS), and redeemable preferred stock. Equity securities includes common stock, mutual funds, and non-redeemable preferred stock. We classify fixed maturity and equity securities as available-for-sale (AFS) or trading at the time of purchase and subsequently carry them at fair value. Fair value hierarchy and valuation methodologies are discussed in Note 7 – Fair Value. Classification is dependent on a variety of factors including our expected holding period, election of the fair value option, and asset and liability matching.
AFS Securities – Unrealized gains and losses on AFS securities, net of tax and adjustments to DAC, DSI, VOBA, and future policy benefits, if applicable, are generally reflected in accumulated other comprehensive income (AOCI) on the consolidated balance sheets. Unrealized gains or losses relating to identified risks within AFS securities in fair value hedging relationships are reflected in investment related gains (losses) on the consolidated statements of income.
Trading Securities – We elected the fair value option for certain fixed maturity securities. These fixed maturity securities are classified as trading, with changes to fair value included in investment related gains (losses) on the consolidated statements of income. Although the securities are classified as trading, the trading activity related to these investments is primarily focused on asset and liability matching activities and is not intended to be an income strategy based on active trading. As such, the activity related to these investments on the consolidated statements of cash flows is classified as investing activities. Trading securities include mutual funds supporting unit-linked investment contracts.
We generally record security transactions on a trade date basis, with any unsettled trades recorded in other assets or other liabilities on the consolidated balance sheets. Private placement and investment fund purchases are recorded on a settlement date basis.
F-20
Table of Contents
ATHENE HOLDING LTD.
Notes to Consolidated Financial Statements
Purchased Credit Impaired (PCI) Securities – We purchase certain structured securities, primarily RMBS, having deterioration in credit quality since their issuance, which meet the definition of PCI securities. We determined, based on our expectations as to the timing and amount of cash flows expected to be received, that it was probable at acquisition that we would not collect all contractually required payments, including both principal and interest and considering the effects of prepayments for these PCI securities. Based on these assumptions, the difference between the undiscounted expected future cash flows of the PCI securities and the recorded investment in the securities represents the initial accretable yield, which is accreted into investment income, net of related expenses, over their remaining lives on a level-yield basis. The difference between the contractually required payments on the PCI securities and the undiscounted expected future cash flows represents the non-accretable difference at acquisition. Over time, based on actual payments received and changes in estimates of undiscounted expected future cash flows, the accretable yield and the non-accretable difference can change.
Quarterly, we evaluate the undiscounted expected future cash flows associated with PCI securities based on updates to key assumptions. Changes to undiscounted expected future cash flows due solely to the changes in the contractual benchmark interest rates on variable rate PCI securities will change the accretable yield prospectively. Declines in undiscounted expected future cash flows due to further credit deterioration, as well as changes in the expected timing of the cash flows, can result in the recognition of an other-than-temporary impairment (OTTI) charge, as PCI securities are subject to our policy for evaluating investments for OTTI. Significant increases in undiscounted expected future cash flows are recognized prospectively as an adjustment to the accretable yield.
Mortgage Loans – Mortgage loans are primarily stated at unpaid principal balance, adjusted for any unamortized premium or discount, and net of valuation allowances. Interest income is accrued on the principal amount of the loan based on its contractual interest rate. We record amortization of premiums and discounts using the effective yield method, and contractual cash flows on the underlying loan. We accrue interest on loans until it is probable we will not receive interest or the loan is 90 days past due. Interest income, amortization of premiums and discounts, and prepayment fees are reported in net investment income on the consolidated statements of income. We have also elected the fair value option on a portion of our mortgage loans.
Investment Funds – We invest in certain non-fixed income, alternative investments in the form of limited partnerships or similar legal structures (investment funds). For investment funds in which we have determined we are not the primary beneficiary, and therefore not required to consolidate, we typically record these investments using the equity method of accounting, where the cost is recorded as an investment in the fund. Adjustments to the carrying amount reflect our pro rata ownership percentage of the operating results as indicated by net asset value (NAV) in the investment fund financial statements, which can be on a lag of up to three months when investee information is not received in a timely manner.
We record our proportionate share of investment fund income within net investment income on the consolidated statements of income. Contributions paid or distributions received by the Company are recorded directly to the investment fund balance as an increase to carrying value or as a return of capital, thus reducing our carrying value.
Policy Loans – Policy loans are funds provided to policyholders in return for a claim on the policy’s account value. The funds provided are limited to a specified percentage of the account balance. The majority of policy loans do not have a stated maturity and the balances and accrued interest are repaid with proceeds from the policy account balance. Policy loans are reported at the unpaid principal balance. Interest income is recorded as earned using the contract interest rate and is reported in net investment income on the consolidated statements of income.
F-21
Table of Contents
ATHENE HOLDING LTD.
Notes to Consolidated Financial Statements
Funds Withheld at Interest – Funds withheld at interest represents a receivable for amounts contractually withheld by ceding companies in accordance with reinsurance agreements in which we act as reinsurer. Assets equal to statutory reserves are withheld and legally owned by the ceding company. We periodically settle interest accruing to those assets at rates defined by the terms of the agreement. The underlying agreements contain embedded derivatives as discussed below.
Real Estate – Real estate investments are stated at cost less accumulated depreciation. Depreciation is recorded on a straight-line basis over the estimated useful life of the asset, which is typically 40 years, and is included in net investment income on the consolidated statements of income. We periodically review our real estate investments for impairment and test for recoverability when events or changes in circumstances indicate the carrying value may not be recoverable and exceeds its estimated fair value. We recognize an impairment to fair value if the carrying amount of a property exceeds the expected undiscounted cash flows.
Real estate investments we commit to a plan to sell within one year and actively market are classified as held for sale. Real estate held for sale is stated at the lower of depreciated cost or estimated fair value less expected disposition costs and is not depreciated.
Short-term Investments – Short-term investments consists of financial instruments with maturities of greater than three months but less than twelve months when purchased. Short-term debt securities are accounted for as trading or available for sale consistent with our policies for those investments. Short-term loans are carried at amortized cost. Fair values are determined consistent with policies described in Note 7 – Fair Value, for the respective investment type.
Investment Income – We recognize investment income as it accrues or is legally due, net of investment management and custody fees. Investment income on fixed maturity securities includes coupon interest, as well as the amortization of any premiums and the accretion of any discount. Investment income on equity securities represents dividend income and preferred coupons. Realized gains and losses on sales of investments and other-than-temporary impairments are included on the consolidated statements of income in investment related gains (losses) and other comprehensive income (OCI). Realized gains and losses on investments sold are determined based on a first-in first-out method.
Other-Than-Temporary Impairment – We identify fixed maturity and equity securities that could potentially have impairments that are other-than-temporary by monitoring market events for changes in market interest rates, credit issues, changes in business climate, management changes, litigation, government actions, and other similar factors. Indicators of impairment may include changes in the issuers’ credit ratings, late payments, pricing levels, rating agency actions, key financial ratios, financial statements, revenue forecasts, and cash flow projections.
We review all securities on a case-by-case basis to determine whether an other-than-temporary decline in value exists and whether losses should be recognized. We consider relevant facts and circumstances in evaluating whether a credit or interest rate-related impairment of a security is other-than-temporary. Relevant facts and circumstances considered include: (1) the extent and length of time the fair value has been below cost; (2) the reasons for the decline in fair value; (3) the issuer’s financial position and access to capital; and (4) for fixed maturity securities, our ability and intent to sell a security or whether it is more likely than not we will be required to sell the security before the recovery of its amortized cost which, in some cases, may extend to maturity and for equity securities, our ability and intent to hold the security for a period of time that allows for the recovery in value. To the extent we determine that a security is other-than-temporarily impaired, an impairment loss is recognized.
We report impairment losses on equity securities in investment related gains (losses) on the consolidated statements of income. The recognition of impairment losses on fixed maturity securities on the consolidated
F-22
Table of Contents
ATHENE HOLDING LTD.
Notes to Consolidated Financial Statements
financial statements is dependent on the facts and circumstances related to the specific security. If we intend to sell a security or it is more likely than not that we would be required to sell a security before the recovery of its amortized cost less any recorded credit loss, we recognize an OTTI in investment related gains (losses) on the consolidated statements of income for the difference between amortized cost and fair value. If neither of these two conditions exists, then the recognition of the OTTI is bifurcated and we recognize the credit loss portion in investment related gains (losses) on the consolidated statements of income and the non-credit loss portion in AOCI on the consolidated balance sheets.
We estimate the amount of the credit loss component of a fixed maturity security impairment as the difference between amortized cost and the present value of the expected cash flows of the security. The present value is determined using the best estimate cash flows discounted at the effective interest rate implicit to the security at the date of purchase or the current yield to accrete an asset-backed or floating rate security. The techniques and assumptions for establishing the best estimate cash flows vary depending on the type of security. The structured security’s cash flow estimates are based on security-specific facts and circumstances that may include collateral characteristics, expectations of delinquency and default rates, loss severity, prepayments, and structural support, including subordination and guarantees. The non-structured security’s cash flow estimates are derived from scenario-based outcomes of expected corporate restructurings or the disposition of assets using security-specific facts and circumstances including timing, security interests, and loss severity.
In periods after an OTTI loss is recognized on a fixed maturity security, we report the impaired security as if it had been purchased on the date it was impaired and continue to estimate the present value of the estimated cash flows of the security. Accordingly, the discount (or reduced premium) based on the new cost basis is accreted into net investment income over the remaining term of the fixed maturity security in a prospective manner based on the amount and timing of estimated future cash flows.
For equity method investments, we consider financial and other information provided by the investee, other known information and inherent risks in the underlying investments, as well as future capital commitments, in determining whether an impairment has occurred. Declines in value of equity method investments not expected to be recovered are reflected through impairment in other investment related gains (losses) on the consolidated statements of income.
We impair a mortgage loan when it is probable we will not collect all amounts due under the agreement. We establish a general valuation allowance on mortgage loans based on loss history. Additionally, we establish a valuation allowance on individual loans based on expected losses from future dispositions or settlement, including foreclosures. We calculate the allowance based on how much the carrying value exceeds one of these values:
| • | the present value of expected future cash flows discounted at the loan’s original effective interest rate; |
| • | the value of the loan’s collateral if it is in the process of foreclosure or otherwise collateral dependent; or |
| • | the loan’s fair value if the loan is being sold. |
We first apply any interest accrued or received on the net carrying amount of the impaired loan to the principal of the loan, and once the principal is repaid, we include amounts received in net investment income. We limit accrued interest income on impaired loans to 90 days of interest. Once accrued interest on the impaired loan is received, we recognize interest income on a cash basis. Loans deemed uncollectible or in foreclosure are charged off against the valuation allowances, and subsequent recoveries, if any, are credited to the valuation allowances. Changes in valuation allowances are reported in investment related gains (losses) on the consolidated statements of income.
F-23
Table of Contents
ATHENE HOLDING LTD.
Notes to Consolidated Financial Statements
The cost of other invested assets is adjusted for impairments in value deemed to be other-than-temporary in the period in which the determination is made. These impairments are included within investment related gains (losses), and the cost basis of the investment securities is reduced accordingly. We do not change the revised cost basis for subsequent recoveries in value.
Derivative Instruments—We invest in derivatives to hedge the risks experienced in our ongoing operations, such as equity risk, interest rate risk, cash flow risks, or for other risk management purposes, which primarily involve managing liability risks associated with our indexed annuity products and reinsurance agreements. Derivatives are financial instruments whose values are derived from interest rates, foreign exchange rates, financial indices or other underlying notional amount. Derivatives are carried at fair value on the consolidated balance sheets in derivative assets and derivative liabilities. We elect to present any derivatives subject to master netting provisions as a gross asset or liability and gross of collateral. Disclosures regarding balance sheet presentation of derivatives subject to master netting agreements are discussed in Note 5 – Derivative Instruments. We may designate derivatives as cash flow hedges. Derivatives in cash flow hedge relationships are designated as hedges of interest rate, market, foreign currency, or credit risk. Derivatives designated as cash flow hedges receive specialized accounting treatment and are thus subject to additional documentation and support requirements.
Hedge Documentation and Hedge Effectiveness – To qualify for hedge accounting, at the inception of the hedging relationship, we formally document our risk management objective and strategy for undertaking the hedging transaction, as well as our designation of the hedge as a cash flow hedge. In this documentation, we set forth how the hedging instrument is expected to hedge the designated risks related to the hedged item, the method that will be used to retrospectively and prospectively assess the hedging instrument’s effectiveness, and the method which will be used to measure ineffectiveness. A derivative designated as a hedging instrument must be assessed as being highly effective in offsetting the designated risk of the hedged item. Hedge effectiveness is formally assessed at inception and periodically throughout the life of the designated hedging relationship.
Changes in the fair value of the hedging instrument measured as ineffective are reported within investment related gains (losses) on the consolidated statements of income.
For a cash flow hedge, changes in the fair value of the hedging derivative measured as effective are reported within AOCI, and the related gains or losses on the derivative are reclassified into the consolidated statements of income when the cash flows of the hedged item affect earnings. Any ineffectiveness is reported in investment related gains (losses) on the consolidated statements of income each reporting period as effectiveness is assessed.
For a derivative not designated as a hedge, changes in the derivative’s fair value are included in investment related gains (losses) on the consolidated statements of income. Any income received or paid on derivatives at the settlement dates is included in net investment income on the consolidated statements of income.
We discontinue hedge accounting prospectively when: (1) we determine the derivative is no longer highly effective in offsetting changes in the estimated cash flows of a hedged item; (2) the derivative expires, is sold, terminated, or exercised; or (3) the derivative is de-designated as a hedging instrument.
When hedge accounting is discontinued, the derivative continues to be carried on the consolidated balance sheets at fair value, with changes in fair value recognized in investment related gains (losses) on the consolidated statements of income.
Embedded Derivatives – We issue and reinsure products, primarily fixed indexed annuity products, or purchase investments that contain embedded derivatives. If we determine the embedded derivative has economic
F-24
Table of Contents
ATHENE HOLDING LTD.
Notes to Consolidated Financial Statements
characteristics not clearly and closely related to the economic characteristics of the host contract, and a separate instrument with the same terms would qualify as a derivative instrument, the embedded derivative is bifurcated from the host contract and accounted for separately. Embedded derivatives are carried on the consolidated balance sheets at fair value in the same line item as the host contract. Changes in the fair value of embedded derivatives associated with fixed indexed annuities are reflected in interest sensitive contract benefits on the consolidated statements of income. Embedded derivatives that are not clearly and closely related to the host contract within a financial asset are required to be bifurcated and recorded at fair value unless the fair value option is elected on the host contract. Under the fair value option, bifurcation of the embedded derivative is not necessary as all related gains and losses on the host contract and derivative will be reflected within investment related gains (losses) on the consolidated statements of income.
Fixed indexed annuity and universal life insurance contracts allow the policyholder to elect a fixed interest rate return or an equity market component where interest credited is based on the performance of common stock market indices. The equity market option is an embedded derivative, similar to a call option. The benefit reserve is equal to the sum of the fair value of the embedded derivative and the host (or guaranteed) component of the contracts. The fair value of the embedded derivative is computed as the present value of benefits attributable to the excess of the projected policy contract values over the projected minimum guaranteed contract values. The projections of policy contract values are based on assumptions for future policy growth, which include assumptions for expected index credits on the next policy anniversary date, future equity option costs, volatility, interest rates, and policyholder behavior. The projections of minimum guaranteed contract values include the same assumptions for policyholder behavior as were used to project policy contract values. For contracts we issue to policyholders, the embedded derivative cash flows are discounted using the Company’s own credit rating. For funds withheld reinsurance contracts, we do not use a credit spread as the funds are backed by the cedant’s collateral. The host contract is established at contract inception as the initial account value less the initial fair value of the embedded derivative and accreted over the policy’s life. The host contract accretion rate is updated each quarter so that the present value of actual and expected guaranteed cash flows is equal to the initial host value.
Additionally, reinsurance agreements written on a modco or funds withheld basis contain embedded derivatives. The fair value of the embedded derivatives on modco and funds withheld agreements is included in the funds withheld at interest and funds withheld liability lines on the consolidated balance sheets for assumed and ceded agreements, respectively. The change in the fair value of the embedded derivatives is recorded in investment related gains (losses) on the consolidated statements of income. Assumed and ceded earnings from funds withheld at interest, funds withheld liability, and changes in the fair value of embedded derivatives are reported in operating activities on the consolidated statements of cash flows. Contributions to and withdrawals from funds withheld at interest and funds withheld liability are reported in operating activities on the consolidated statements of cash flows.
Variable Interest Entities—An entity that does not have sufficient equity to finance its activities without additional financial support, or in which the equity investors, as a group, do not have the characteristics of a controlling financial interest is a VIE. The determination as to whether an entity qualifies as a VIE depends on the facts and circumstances surrounding each entity and may require significant judgment. Our investment funds generally qualify as VIEs and are evaluated for consolidation under the VIE model.
We are required to consolidate a VIE if we are the primary beneficiary, defined as the variable interest holder with both the power to direct the activities that most significantly impact the VIE’s economic performance and rights to receive benefits or obligations to absorb losses that could be potentially significant to the VIE. We determine whether we are the primary beneficiary of an entity based on a qualitative assessment of the VIE’s capital structure, contractual terms, nature of the VIE’s operations and purpose, and our relative exposure to the
F-25
Table of Contents
ATHENE HOLDING LTD.
Notes to Consolidated Financial Statements
related risks of the VIE. Since affiliates of Apollo Global Management, LLC (AGM and, together with its subsidiaries, Apollo), a related party, are the decision makers in certain of the investment funds, we and a member of our related party group may together have the characteristics of the primary beneficiary of an investment fund. In this situation, we have generally concluded we are not under common control, as defined by ASU 2015-02, with the related party, and therefore consolidate in the circumstances when substantially all of the activities of the VIE are conducted on our behalf. We reassess the VIE and primary beneficiary determinations on an ongoing basis.
If we are not the primary beneficiary, but are able to exert significant influence over the VIE’s operations, we record the VIE as an equity method investment. If we are not able to exercise significant influence, generally on investment funds in which we own a less than a 3% interest, we elect the fair value option.
See Note 6 – Variable Interest Entities for discussion of our interest in entities that meet the definition of a VIE.
Business Combinations and Goodwill—Business combination transactions are accounted for under the acquisition method. Accordingly, the purchase consideration is allocated to assets and liabilities based on their estimated fair value at the acquisition date. The consideration for the net assets acquired is determined prior to the assessment of the fair value of the net assets at the acquisition date. We have identified several intangible assets acquired in business combinations including VOBA, acquired distribution channels, and state licenses. We value VOBA as described below under Deferred Acquisition Costs, Deferred Sales Inducements, and Value of Business Acquired. We value distribution channels using the multi-period excess earnings method under the income approach and the state licenses using the market approach. Distribution channels and state licenses are included in other assets on the consolidated balance sheets.
Goodwill represents the excess of purchase consideration over the acquisition date fair value of net assets acquired and is included in the other assets on the consolidated balance sheets for direct acquisitions by the Company. Goodwill representing the excess purchase price paid by CoInvest VII for MidCap Financial Holdings, LLC (MidCap Holdings) over the fair value of the net assets acquired is included in assets of consolidated VIEs on the consolidated balance sheets. As of January 2015, our consolidated VIEs no longer report goodwill as our consolidated VIE, CoInvest VII, no longer consolidates MidCap Holdings as discussed in Note 6 – Variable Interest Entities. Goodwill is not amortized but reviewed for impairment annually or more frequently if events occur or circumstances change indicating potential impairment has occurred. Goodwill impairment is first assessed using qualitative factors. Where the qualitative assessment indicates a potential impairment of goodwill, we complete a quantitative goodwill impairment test.
The quantitative goodwill impairment test follows a two-step process. In the first step, the fair value of a reporting unit is compared to its carrying value. If the carrying value of a reporting unit exceeds its fair value, the second step of the impairment test is performed to measure the impairment. In the second step, the fair value of the reporting unit is allocated to all of the assets and liabilities of the reporting unit to determine an implied goodwill value. If the carrying amount of the reporting unit’s goodwill exceeds the implied goodwill value, an impairment loss is recognized in an amount equal to the excess.
An excess of the acquisition date fair value of the net assets acquired over the purchase consideration in a business combination is recorded as a bargain purchase gain in the consolidated statements of income. See Note 8 – Business Combinations for details of business combination transactions.
Reinsurance—We assume and cede insurance and investment contracts under coinsurance, funds withheld coinsurance (funds withheld), and modified coinsurance (modco). We follow reinsurance accounting for transactions that provide indemnification against loss or liability relating to insurance risk (risk transfer). To meet
F-26
Table of Contents
ATHENE HOLDING LTD.
Notes to Consolidated Financial Statements
risk transfer requirements, a reinsurance agreement must include insurance risk consisting of underwriting, investment, timing risk, and any other significant risks. Cessions under reinsurance do not discharge our obligations as the primary insurer, unless the requirements of assumption reinsurance have been met. We generally have the right of offset on reinsurance contracts, but have elected to present reinsurance settlement amounts due to and from the Company on a gross basis.
For investment contracts, assets and liabilities assumed or ceded under coinsurance, funds withheld, or modco are presented gross on the consolidated balance sheets. The change in assumed and ceded reserves, deposits, and withdrawals are presented net in the interest sensitive contract benefits line on the consolidated statements of income. For insurance contracts, assets and liabilities assumed or ceded are presented gross on the consolidated balance sheets. The change in assumed and ceded reserves and benefits are presented net in the future policy and other policy benefits line on the consolidated statements of income. Assumed or ceded premiums are included in the premiums line of the consolidated statements of income.
Accounting for reinsurance requires the use of assumptions upon agreement inception, particularly related to the future performance of the underlying business and the potential impact of counterparty credit risks. We attempt to minimize our counterparty credit risk through the structuring of the terms of our reinsurance agreements, including the use of trusts, and we monitor credit ratings of counterparties for signs of declining credit quality. When a ceding company does not report information on a timely basis, we record accruals based on the best available information at the time, which includes the reinsurance agreement terms and historical experience. We periodically compare actual and anticipated experience to the assumptions used to establish reinsurance assets and liabilities. Refer to Note 9 – Reinsurance for more information.
Funds Withheld – For business assumed or ceded on a funds withheld basis, a funds withheld segregated portfolio comprised of invested assets and other assets is maintained by the ceding entity, which are sufficient to support the current balance of policy benefit liabilities of the ceded business on a statutory basis. The fair value of the funds withheld account is recorded as a funds withheld asset or liability and accrues interest payable at rates as defined by the agreement terms and is settled periodically. The underlying agreements include embedded derivatives, as further discussed above in the accounting policy for Derivative Instruments and Note 7 – Fair Value.
Modified Coinsurance – Modco is similar to funds withheld, except that the policy benefit liabilities are also not transferred to the assuming entity. For business assumed or ceded on a modco basis, the fair value of the funds withheld is accounted for under the same method described for funds withheld reinsurance above. Assumed policy benefit liabilities are included in interest sensitive contract benefits and ceded policy benefit liabilities are included in reinsurance recoverable on the consolidated balance sheets. The underlying agreements include embedded derivatives, as further discussed above in the accounting policy for Derivative Instruments and Note 7 – Fair Value.
Cash and Cash Equivalents—Cash and cash equivalents include deposits and short-term highly liquid investments with a maturity of less than 90 days from the date of acquisition. Amounts included are readily convertible to known amounts of cash and are subject to an insignificant risk of change in value.
Restricted Cash—Restricted cash consists of cash and cash equivalents held in funds in trust as part of certain coinsurance agreements to secure all statutory reserves and liabilities of the coinsured parties, as well as assets pledged to secure the obligations under the funding agreements. Restricted cash within consolidated variable interest entities consisted of borrowers’ escrows and reserves required to be held in separate accounts with MidCap Holdings’ lenders and MidCap Holdings’ principal and interest collections pledged to certain credit facilities. As of January 2015, our consolidated VIEs no longer report restricted cash as our consolidated VIE,
F-27
Table of Contents
ATHENE HOLDING LTD.
Notes to Consolidated Financial Statements
CoInvest VII, no longer consolidates MidCap Holdings as discussed in Note 6 – Variable Interest Entities. Restricted cash is reported as a separate line item on the consolidated balance sheets. Changes in the restricted cash balance are reported in investing activities on the consolidated statements of cash flows.
Investments in Related Parties—Investments in related parties and associated earnings, other comprehensive income, and cash flows are separately identified on the consolidated financial statements and accounted for consistently with the policies described above for each category of investment.
Deferred Acquisition Costs, Deferred Sales Inducements, and Value of Business Acquired
Deferred Acquisition Costs and Deferred Sales Inducements – Costs related to direct and successful efforts of acquiring new business are deferred to the extent they are recoverable from future premiums or gross profits. These costs consist of commissions and policy issuance costs, as well as sales inducements credited to policyholder account balances. We adjust the DAC and DSI balances due to the OCI effects of net unrealized investment gains and losses on AFS securities. We perform periodic tests to determine if the deferred costs remain recoverable, including at issue. If financial performance significantly deteriorates to the point where a premium deficiency exists, then we record a cumulative charge to the current period. Each reporting period, we update estimated gross profits with actual gross profits as part of the amortization process for the interest sensitive policies. We also periodically revise the key assumptions used in the calculation of the amortization of DAC which results in revisions to the estimated future gross profits. The effects of changes in assumptions are recorded as unlocking in the period in which the changes are made.
Deferred costs related to interest sensitive life and investment-type policies, with significant revenue streams from sources other than investment of the policyholder funds, are amortized over the lives of the policies, in relation to the present value of gross profits including investment spread margins, surrender charge income, policy administration, changes in the guaranteed lifetime withdrawal benefit (GLWB) and guaranteed minimum death benefit (GMDB) reserves, and realized gains and losses on investments. Current period gross profits for fixed indexed annuities also include the impact of amounts for the change in fair value of the derivatives and the change in fair value of the embedded derivatives. Estimates of the future gross profits are based on assumptions using accepted actuarial methods. The balances associated with the preceding amortization methodology are recorded in deferred acquisition costs, deferred sales inducements, and value of business acquired on the consolidated balance sheets.
Deferred costs related to contracts with only investment related sources of revenues are amortized using the interest method. The interest method amortizes the deferred costs by discounting the future liability cash flows at a break-even rate. The break-even rate is solved such that the present value of future liability cash flows is equal to the net liability at the inception of the contract. The balances associated with this amortization methodology are recorded in deferred acquisition costs, deferred sales inducements, and value of business acquired on the consolidated balance sheets.
Value of Business Acquired – We establish VOBA for insurance contract blocks assumed with the acquisition of insurance entities. We record the fair value of the liabilities assumed in two components: reserves and VOBA. Reserves are established using our best estimate assumptions, and are further described in future policy benefits and interest sensitive contract liabilities. VOBA is the difference between the fair value and the reserves. VOBA can be either positive or negative. For interest sensitive life and investment-type contracts, any negative VOBA is recorded in interest sensitive contract liabilities on the consolidated balance sheets. For long duration and insurance contracts, any negative VOBA is recorded as part of future policy benefits on the consolidated balance sheets. Positive VOBA is recorded in deferred acquisition costs, deferred sales inducements, and value of business acquired on the consolidated balance sheets.
F-28
Table of Contents
ATHENE HOLDING LTD.
Notes to Consolidated Financial Statements
VOBA associated with funding agreements and immediate annuity contracts classified as investment contracts is amortized using the interest method. VOBA associated with immediate annuity contracts classified as long duration contracts is amortized at a constant rate in relation to net policyholder liabilities. For accumulation products, which include interest sensitive life and investment-type contracts with significant non-investment sources of revenue, VOBA is amortized in relation to the present value of estimated gross profits using methods consistent with those used to amortize DAC. Negative VOBA is amortized at a constant rate in relation to applicable net policyholder liabilities.
We adjust the VOBA balance due to the OCI effects of unrealized investment gains or losses on AFS securities. We perform periodic tests to determine if the VOBA remains recoverable. If financial performance significantly deteriorates to the point where a premium deficiency exists, then we record a cumulative charge to the current period. Each reporting period, we update estimated gross profits with actual gross profits as part of the amortization process for the interest sensitive policies. We also periodically revise the key assumptions used in the calculation of the amortization of the VOBA which results in updates to the estimated future gross profits. The effects of changes in estimated future gross profits are recorded in the period in which the changes are made.
See Note 10 – Deferred Acquisition Costs, Deferred Sales Inducements, and Value of Business Acquired for further discussion.
Loans Held for Investment—Loans presented within assets of consolidated variable interest entities on the consolidated balance sheets consisted of commercial, industrial, and commercial real estate loans originated by MidCap Holdings. These loans were held for investment and MidCap Holdings had the ability and intent to hold them for the foreseeable future. We elected the fair value option to account for the loans held for investment and thus were carried at fair value. As of January 2015, our consolidated VIEs no longer report loans held for investment as our consolidated VIE, CoInvest VII, no longer consolidates MidCap Holdings as discussed in Note 6 – Variable Interest Entities.
Interest Sensitive Contract Liabilities—Interest sensitive life and investment-type contracts include fixed indexed and traditional fixed annuities in the accumulation phase, funding agreements, universal life insurance, fixed indexed universal life insurance, unit-linked contracts, and immediate annuities without significant mortality risk. We carry liabilities for fixed annuities, universal life insurance, unit-linked contracts, and funding agreements at the account balances without reduction for potential surrender or withdrawal charges, except for a block of universal life business ceded to Global Atlantic Financial Group Limited (Global Atlantic) which we carry at fair value. Liabilities for immediate annuities without significant mortality risk are calculated as a present value of future liability cash flows at contractual interest rates.
Changes in the interest sensitive contract liabilities are recorded in interest sensitive contract benefits or product charges on the consolidated statements of income. Interest sensitive contract liabilities are not reduced for amounts ceded under coinsurance agreements which are reported as reinsurance recoverable on the consolidated balance sheets. See Note 9 – Reinsurance for more information on reinsurance.
Future Policy Benefits—We issue contracts classified as long-duration, which includes endowments, term and whole life, accident and health, disability, and deferred and immediate annuities with life contingencies. Liabilities for non-participating long-duration contracts are established using accepted actuarial valuation methods which require the use of assumptions related to expenses, investment yields, mortality, morbidity, and persistency, with a provision for adverse deviation, at the date of issue or acquisition. Liabilities for participating long-duration contracts are established using accepted actuarial valuation methods, which require the use of guaranteed interest and mortality assumptions. As of December 31, 2015, and 2014, the reserve investment yield assumptions range from 1.25% to 5.44% and are specific to our expected earned rate on the asset portfolio
F-29
Table of Contents
ATHENE HOLDING LTD.
Notes to Consolidated Financial Statements
supporting the reserves. We base other key assumptions, such as mortality and morbidity, on industry standard data adjusted to align with actual company experience, if necessary.
For long-duration contracts, the assumptions are locked in at contract inception and only modified if we deem the reserves to be inadequate. We periodically review actual and anticipated experience compared to the assumptions used to establish policy benefits. If the net GAAP liability (gross reserves less DAC, DSI, and VOBA) is less than the gross premium liability, impairment is deemed to have occurred, and the DAC, DSI, and VOBA asset balances are reduced until the net GAAP liability is equal to the gross premium liability. For deferred annuity policies classified as insurance contracts, if the DAC, DSI, and VOBA asset balances are completely written off and the net GAAP liability is still less than the gross premium liability, then an additional liability is posted to arrive at the gross premium liability.
We issue and reinsure deferred annuity contracts which contain GLWB and GMDB riders. We establish future policy benefits for GLWB and GMDB by estimating the expected value of withdrawal and death benefits in excess of the projected account balance. We recognize the excess proportionally over the accumulation period based on total expected assessments. The methods we use to estimate the liabilities have assumptions about policyholder behavior, mortality, and market conditions affecting the account balance growth.
Future policy benefits includes liabilities for no-lapse guarantees on universal life insurance and fixed indexed universal life insurance. We establish future policy benefits for no-lapse guarantees by estimating the expected value of death benefits paid after policyholder account balances have been exhausted. We recognize these benefits proportionally over the life of the contracts based on total expected assessments. The methods we use to estimate the liabilities have assumptions about policyholder behavior, mortality, and market conditions affecting the account balance growth.
Changes in future policy benefits are recorded in future policy and other policy benefits on the consolidated statements of income. Future policy benefits are not reduced for amounts ceded under coinsurance agreements which are reported as reinsurance recoverable on the consolidated balance sheets. See Note 9 – Reinsurance for more information on reinsurance.
Closed Block Business—Two closed blocks of policies were established in connection with the reorganization of two predecessor subsidiaries from mutual companies to stock companies (collectively referred to as the Closed Blocks and individually referred to as the AmerUs Closed Block and the ILICO Closed Block). Insurance policies which had a dividend scale in effect as of each closed block establishment date were included in the respective closed block. The Closed Blocks were designed to give reasonable assurance to owners of insurance policies included therein that, after the reorganization, assets would be available to maintain the dividend scales and interest credits in effect prior to the reorganization, if the experience underlying such scales and crediting continued. The assets, including related revenue, allocated to the Closed Blocks will accrue solely to the benefit of the policyholders included in the Closed Blocks until they no longer exist. A policyholder dividend obligation is required to be established for earnings in the Closed Blocks that are not available to the shareholders. See Note 11 – Closed Block for more information on the Closed Blocks.
Other Policy Claims and Benefits—Other policy claims and benefits include amounts payable relating to in course of settlements (ICOS) and incurred but not reported (IBNR) liabilities associated with interest sensitive contract liabilities and future policy benefits. For traditional life and universal life policies, ICOS claim liabilities are established when we are notified of the death of the policyholder but the claim has not been paid as of the reporting date. For immediate annuities and supplemental contracts, ICOS claim liabilities are established to accrue suspended benefit payments between the date of notification of death and the date of verification of death.
F-30
Table of Contents
ATHENE HOLDING LTD.
Notes to Consolidated Financial Statements
We determine IBNR claim liabilities using studies of past experience. The time that elapses from the death or claim date to when the claim is reported to us can vary significantly by product type, but generally ranges between one to six months for life business. We estimate IBNR claims on an undiscounted basis, using actuarial estimates of historical claims expense, adjusted for current trends and conditions. These estimates are continually reviewed and the ultimate liability may vary significantly from the amount recognized.
Dividends Payable to Policyholders—Participating policies entitle the policyholders to receive dividends based on actual interest, mortality, morbidity, and expense experience for the year. Dividends are distributed to the policyholders through annual or terminal dividends, which the Board of Directors of the applicable insurance subsidiary approves. As of December 31, 2015, and 2014, 78% and 49%, respectively, of traditional life policies inclusive of ceded policies were paying dividends, and the related liability is recorded in dividends payable to policyholders on the consolidated balance sheets. Premiums related to policies paying dividends represented 22%, 11%, and 10% of total life insurance direct premiums and deposits for the years ended December 31, 2015, 2014, and 2013, respectively. Traditional life policies inclusive of ceded policies represented 78% and 49% of the Company’s individual life policies in force as of December 31, 2015, and 2014, respectively.
As of December 31, 2015, all of the non-separate account unit-linked policies were paying dividends, and the related liability is recorded in dividends payable to policyholders on the consolidated balance sheets. There were no material deposits related to non-separate account unit-linked policies paying dividends for the year ended December 31, 2015. Non-separate account unit-linked policies represented 2% of the Company’s interest sensitive contracts in force as of December 31, 2015. We did not have non-separate account unit-linked policies as of December 31, 2014, or 2013, since we acquired them in connection with the acquisition of Delta Lloyd Deutschland AG (DLD) on October 1, 2015, as discussed in Note 8 – Business Combinations.
Policyholder dividend liabilities are recorded in dividends payable to policyholders on the consolidated balance sheets and policyholder dividends are recorded in dividends to policyholders on the consolidated statements of income. For participating policies issued by our German subsidiaries, dividends payable to policyholders includes an adjustment to recognize timing differences between GAAP and local statutory earnings that reverse and enter into future calculations of dividends to policyholders. Except for changes due to unrealized gains or losses on AFS securities, the change in this adjustment is recorded in dividends to policyholders on the consolidated statements of income. Changes in this adjustment due to unrealized gains or losses on AFS securities are recorded in OCI.
Stock-Based Compensation—We have stock-based compensation plans under which restricted, incentive compensation share awards may be granted to the Company’s employees and directors, and employees of Athene Asset Management, L.P. (AAM), an affiliated entity, as described in Note 14 – Stock-based Compensation. We recognize the fair value of stock-based compensation over a participant’s requisite service period through a charge to compensation expense and a corresponding entry to equity or a liability based on vesting criteria and other pertinent terms of the awards. Stock-based awards are accounted for as equity awards in instances where the awards’ vesting are linked to a market, performance, or service condition. Equity awards to employees are generally expensed based on the grant date fair value. For equity awards issued to non-employees, the fair value is remeasured through completion of counterparty performance. Employee and non-employee stock-based awards are accounted for as liabilities in instances where the awards’ vesting criteria are linked to a factor other than a market, performance, or service condition. Liability awards are remeasured until settlement. In the event that awards are reclassified from liability to equity due to modification or other changes in circumstances, they are remeasured at fair value through the date of reclassification.
Earnings Per Share—We compute basic earnings per share (EPS) by dividing unrounded net income available to Athene Holding Ltd. shareholders by the weighted average number of Class A and Class B common shares
F-31
Table of Contents
ATHENE HOLDING LTD.
Notes to Consolidated Financial Statements
outstanding for the period. As a result, it may not be possible to recalculate EPS as presented in our consolidated financial statements. Diluted earnings per share includes the effect of all potentially dilutive common shares outstanding during the period. See Note 15 – Earnings Per Share for further information.
Foreign Currency—The accounts of foreign-based subsidiaries are measured using the functional currency of the subsidiary. Revenue and expenses of these businesses are translated into United States dollars at the average exchange rate for the period. Assets and liabilities are translated at the exchange rate as of the end of the reporting period. The resulting translation adjustments are included in equity as a component of AOCI. Gains or losses arising from transactions denominated in a currency other than the functional currency of the entity that is party to the transaction are included in net income.
Recognition of Revenues and Related Expenses—Revenues for annuity and universal life-type products, including surrender and market value adjustments, costs of insurance, policy administration, GMDB, GLWB, and no-lapse guarantee charges, are earned when assessed against policyholder account balances during the period. Interest sensitive contract benefits related to annuity products include interest credited to policyholder account balances. In addition, the change in fair value of embedded derivatives within fixed indexed annuity contracts is included in interest sensitive contract benefits on the consolidated statements of income.
For certain assumed reinsurance transactions involving in force blocks of business, the ceding company may pay a premium equal to the initial required reserve (future policy benefit). In such transactions, we net the expense associated with the establishment of the reserve against the premiums from the transaction in interest sensitive contract benefits on the consolidated statements of income.
Premiums for traditional life insurance products, including products with fixed and guaranteed premiums and benefits, are recognized as revenues when due from policyholders.
All insurance related revenue is reported net of reinsurance ceded.
Income Taxes—We compute income taxes using the asset and liability method, under which deferred income taxes are provided for the temporary differences between the financial statement carrying amounts and the tax basis of our assets and liabilities using estimated tax rates expected to be in effect for the year in which the differences are expected to reverse. Changes in deferred tax assets and liabilities attributable to changes in enacted income tax rates are recorded in the period of enactment. Such temporary differences are primarily due to the tax basis of reserves, DAC, unrealized investment gains/losses, reinsurance related differences, embedded derivatives, and net operating loss carryforwards. Changes in deferred income tax assets and liabilities associated with components of OCI are recorded directly to OCI. We routinely evaluate the likelihood of realizing the benefit of our deferred tax assets and may record a valuation allowance if, based on all available evidence, we determine that it is more likely than not that some portion of the tax benefit will not be realized. We recognize the tax benefit from an uncertain tax position only if it is more likely than not that the tax position will be sustained on examination by the relevant taxing authorities, based on the technical merits of our position. We recognize any income tax interest and penalties in income tax expense.
See Note 17 – Income Taxes for discussion on withholding taxes for undistributed earnings of subsidiaries.
Adopted Accounting Pronouncements
Business Combinations – Measurement-Period Adjustments (ASU 2015-16)
This update eliminates the requirement that an acquirer in a business combination account for measurement-period adjustments retrospectively. Alternatively, an acquirer should recognize a measurement-period adjustment
F-32
Table of Contents
ATHENE HOLDING LTD.
Notes to Consolidated Financial Statements
during the period in which it determines the amount of the adjustment. We elected to early adopt this standard effective October 1, 2015, and the adoption did not have a material impact to our consolidated financial statements.
Debt Issuance Costs (ASU 2015-15 and 2015-03)
These updates require debt issuance costs related to a recognized debt liability or line of credit arrangement to be presented in the balance sheet as a direct deduction from the carrying amount of that debt liability and bring existing SEC guidance into conformity with this debt issuance cost guidance. We elected to early adopt this standard effective January 1, 2015, and the adoption did not have a material impact to our consolidated financial statements.
Consolidation Analysis (ASU 2015-02)
This update changes the analysis a reporting entity performs to determine whether it should consolidate certain types of legal entities. The Company elected to adopt this guidance effective July 1, 2015, using the full retrospective method. The Company’s consolidated financial statements for the year ended December 31, 2014, were reissued to reflect the results of the retrospective adoption.
The adoption of ASU 2015-02 resulted in the following changes to our consolidation assessment of certain variable interest entities (VIEs):
| • | Two real estate investment funds and one mortgage investment fund, which we previously consolidated, are deemed to be investment companies. Under the previous guidance, we were determined to be the primary beneficiary as we receive the majority of the rights to receive benefits or absorb losses. Upon adoption of ASU 2015-02, we concluded that substantially all of the activities of the VIE were not conducted on our behalf. Therefore, these VIEs are accounted for under the equity method of accounting upon adoption of ASU 2015-02. |
| • | AAA Investments (Co-Invest VI), L.P. (CoInvest VI), AAA Investments (Co-Invest VII), L.P. (CoInvest VII), AAA Investments (Other), L.P. (CoInvest Other), and London Prime Apartments Guernsey Holdings Limited (London Prime) were previously not consolidated as they did not meet the definition of an investment company and the general partners in each of these funds had been determined to be the primary beneficiary as they had met both the power and economics criteria, or had been determined to be the most closely associated with these investment funds upon application of the related party tiebreaker criteria. Upon adoption of ASU 2015-02, the Company concluded that fees paid to the decision maker were not deemed variable interests. Substantially all of the activities of these VIEs were being conducted on our behalf and, therefore, are consolidated upon adoption of ASU 2015-02. |
| • | The consolidation of CoInvest Fund VII also includes the consolidated financial results of its investee, MidCap Holdings, as of December 31, 2014. As of January 2015, MidCap Holdings is no longer consolidated by CoInvest VII as described in Note 6 – Variable Interest Entities. |
Transfers and Servicing (ASU 2014-11)
This update requires repurchase-to-maturity transactions and repurchase financing arrangements be accounted for as secured borrowings and provides for enhanced disclosures, including the nature of collateral pledged and the time to maturity. We fully adopted this standard effective January 1, 2015, and the adoption did not have a material impact to our consolidated financial statements.
F-33
Table of Contents
ATHENE HOLDING LTD.
Notes to Consolidated Financial Statements
Discontinued Operations (ASU 2014-08)
This update changes the criteria related to reporting discontinued operations and introduces new disclosures. We adopted this standard effective January 1, 2015, and the adoption did not have a material impact to our consolidated financial statements.
Troubled Debt Restructuring (ASU 2014-04)
This update clarifies when an in substance repossession or foreclosure occurs, and when a creditor is considered to have received physical possession of residential real estate property collateralizing a consumer mortgage loan. We adopted this standard effective January 1, 2015, and the adoption did not have a material impact to our consolidated financial statements.
Recently Issued Accounting Pronouncements
Revenue Recognition (ASU 2016-11, ASU 2016-10, ASU 2016-08, ASU 2015-14, and ASU 2014-09)
ASU 2014-09 indicates an entity should recognize revenue to depict the transfer of promised goods or services to customers in an amount that reflects the consideration to which the entity expects to be entitled in exchange for those goods or services. ASU 2015-14 provided for a one-year deferral of the effective date, which will require us to adopt this standard effective January 1, 2018. ASU 2016-08 amends the principal-versus-agent implementation guidance and illustrations in ASU 2014-09. ASU 2016-10 clarifies the identification of performance obligations as well as licensing implementation guidance. ASU 2016-11 brings existing SEC guidance into conformity with revenue recognition accounting guidance of ASU 2014-09 discussed above. We are currently evaluating the impact of this guidance on our consolidated financial statements.
Improvements to Employee Share-Based Payment Accounting (ASU 2016-09)
This update simplifies several aspects of the accounting for share-based payment award transactions, including income tax consequences, forfeitures, and classification on the statement of cash flows. We will be required to adopt this standard effective January 1, 2017. Early adoption is permitted. We are currently evaluating the impact of this guidance on our consolidated financial statements.
Equity Method and Joint Ventures (ASU 2016-07)
This update eliminates the retroactive adjustments to an investment upon it qualifying for the equity method of accounting as a result of an increase in the level of ownership interest or degree of influence by the investor. We will be required to adopt this standard effective January 1, 2017. Early adoption is permitted. We are currently evaluating the impact of this guidance on our consolidated financial statements.
Derivatives and Hedging – Contingent Put and Call Options (ASU 2016-06)
This update is intended to clarify the requirements for assessing whether contingent call (put) options that can accelerate the payment of principal on debt instruments are clearly and closely related to debt hosts. We will be required to adopt this standard effective January 1, 2017. Early adoption is permitted. We are currently evaluating the impact of this guidance on our consolidated financial statements.
Derivatives and Hedging – Effects of Derivative Contract Novation (ASU 2016-05)
This update is intended to clarify that a change in the counterparty to a derivative instrument that has been designated as the hedging instrument does not, in and of itself, require a de-designation of that hedging relationship provided all other hedge accounting criteria continue to be met. We will be required to adopt this standard effective January 1, 2017. Early adoption is permitted. We are currently evaluating the impact of this guidance on our consolidated financial statements.
F-34
Table of Contents
ATHENE HOLDING LTD.
Notes to Consolidated Financial Statements
Leases (ASU 2016-02)
This update is intended to increase transparency and comparability for lease transactions. A lessee is required to recognize an asset and a liability for all lease arrangements longer than 12 months. Lessor accounting is largely unchanged. We will be required to adopt this standard effective January 1, 2019. Early adoption is permitted. We are currently evaluating the impact of this guidance on our consolidated financial statements.
Financial Instruments – Recognition and Measurement (ASU 2016-01)
This update retains the current accounting for classifying and measuring investments in debt securities and loans, but requires equity investments to be measured at fair value with subsequent changes recognized in net income, except for those accounted for under the equity method or requiring consolidation. We will be required to adopt this standard effective January 1, 2018. We are currently evaluating the impact of this guidance on our consolidated financial statements.
Fair Value Measurement – Net Asset Value (ASU 2015-07)
This update has a disclosure-only impact for entities that measure investments using net asset value per share under the practical expedient in the fair value measurement guidance. We will be required to adopt this standard effective January 1, 2016. We do not expect the adoption of this update to have a material effect on our consolidated financial statements.
Cloud Computing Arrangements (ASU 2015-05)
This update clarifies whether a cloud computing arrangement is an intangible asset or a service contract. We will be required to adopt this standard effective January 1, 2016. We do not expect the adoption of this update to have a material effect on our consolidated financial statements.
Stock-Based Compensation (ASU 2014-12)
This update requires a performance target in a share-based payment arrangement that affects vesting and that could be achieved after the requisite service period to be treated as a performance condition. The requisite service period ends when the employee can cease rendering service and still be eligible to vest in the award if the performance target is achieved. We will be required to adopt this standard effective January 1, 2016. We do not expect the adoption of this update to have a material effect on our consolidated financial statements.
F-35
Table of Contents
ATHENE HOLDING LTD.
Notes to Consolidated Financial Statements
4. Investments
AFS Securities—The following table represents our AFS investments by asset type. Our AFS investment portfolio includes direct investments in affiliates of Apollo where Apollo can exercise significant influence over the affiliates. These investments are presented as investments in related parties on the consolidated balance sheets, and are separately disclosed below.
| December 31, 2015 | ||||||||||||||||||||
| (In millions) | Amortized Cost |
Gross Unrealized Gains |
Gross Unrealized Losses |
Fair Value | OTTI in AOCI |
|||||||||||||||
| Fixed maturity securities |
||||||||||||||||||||
| U.S. government and agencies |
$ | 44 | $ | 1 | $ | — | $ | 45 | $ | — | ||||||||||
| U.S. state, municipals, and political subdivisions |
1,075 | 100 | (10) | 1,165 | 7 | |||||||||||||||
| Foreign governments |
2,467 | 17 | (20) | 2,464 | — | |||||||||||||||
| Corporate |
26,979 | 523 | (566) | 26,936 | 2 | |||||||||||||||
| CLO |
4,943 | 4 | (392) | 4,555 | — | |||||||||||||||
| ABS |
2,944 | 33 | (59) | 2,918 | — | |||||||||||||||
| CMBS |
1,725 | 33 | (20) | 1,738 | — | |||||||||||||||
| RMBS |
8,050 | 128 | (183) | 7,995 | 6 | |||||||||||||||
|
|
|
|
|
|
|
|
|
|
|
|||||||||||
| Total fixed maturity securities |
48,227 | 839 | (1,250) | 47,816 | 15 | |||||||||||||||
| Equity securities |
367 | 40 | — | 407 | — | |||||||||||||||
|
|
|
|
|
|
|
|
|
|
|
|||||||||||
| Total AFS securities |
48,594 | 879 | (1,250) | 48,223 | 15 | |||||||||||||||
|
|
|
|
|
|
|
|
|
|
|
|||||||||||
| Fixed maturity securities – related party |
||||||||||||||||||||
| CLO |
271 | — | (23) | 248 | — | |||||||||||||||
| ABS |
61 | — | (1) | 60 | — | |||||||||||||||
|
|
|
|
|
|
|
|
|
|
|
|||||||||||
| Total AFS securities – related party |
332 | — | (24) | 308 | — | |||||||||||||||
|
|
|
|
|
|
|
|
|
|
|
|||||||||||
| Total AFS securities including related party |
$ | 48,926 | $ | 879 | $ | (1,274) | $ | 48,531 | $ | 15 | ||||||||||
|
|
|
|
|
|
|
|
|
|
|
|||||||||||
| December 31, 2014 | ||||||||||||||||||||
| (In millions) | Amortized Cost |
Gross Unrealized Gains |
Gross Unrealized Losses |
Fair Value | OTTI in AOCI |
|||||||||||||||
| Fixed maturity securities |
||||||||||||||||||||
| U.S. government and agencies |
$ | 68 | $ | 3 | $ | — | $ | 71 | $ | — | ||||||||||
| U.S. state, municipals, and political subdivisions |
1,304 | 168 | (1) | 1,471 | — | |||||||||||||||
| Corporate |
26,750 | 1,062 | (90) | 27,722 | — | |||||||||||||||
| CLO |
3,719 | 16 | (115) | 3,620 | 1 | |||||||||||||||
| ABS |
2,636 | 48 | (18) | 2,666 | — | |||||||||||||||
| CMBS |
2,890 | 54 | (14) | 2,930 | — | |||||||||||||||
| RMBS |
6,040 | 221 | (38) | 6,223 | 4 | |||||||||||||||
|
|
|
|
|
|
|
|
|
|
|
|||||||||||
| Total fixed maturity securities |
43,407 | 1,572 | (276) | 44,703 | 5 | |||||||||||||||
| Equity securities |
142 | 48 | — | 190 | — | |||||||||||||||
|
|
|
|
|
|
|
|
|
|
|
|||||||||||
| Total AFS securities |
43,549 | 1,620 | (276) | 44,893 | 5 | |||||||||||||||
|
|
|
|
|
|
|
|
|
|
|
|||||||||||
| Fixed maturity securities – related party |
||||||||||||||||||||
| CLO |
270 | — | (10) | 260 | — | |||||||||||||||
| ABS |
66 | — | — | 66 | — | |||||||||||||||
|
|
|
|
|
|
|
|
|
|
|
|||||||||||
| Total fixed maturity securities – related party |
336 | — | (10) | 326 | — | |||||||||||||||
|
|
|
|
|
|
|
|
|
|
|
|||||||||||
| Total AFS securities including related party |
$ | 43,885 | $ | 1,620 | $ | (286) | $ | 45,219 | $ | 5 | ||||||||||
|
|
|
|
|
|
|
|
|
|
|
|||||||||||
F-36
Table of Contents
ATHENE HOLDING LTD.
Notes to Consolidated Financial Statements
The amortized cost and fair value of fixed maturity AFS securities, including related party fixed maturity AFS securities, are shown by contractual maturity below.
| December 31, 2015 | ||||||||
| (In millions) | Amortized Cost | Fair Value | ||||||
| Due in one year or less |
$ | 1,167 | $ | 1,165 | ||||
| Due after one year through five years |
6,441 | 6,464 | ||||||
| Due after five years through ten years |
11,579 | 11,532 | ||||||
| Due after ten years |
11,378 | 11,449 | ||||||
| ABS, CLO, CMBS, and RMBS |
17,662 | 17,206 | ||||||
|
|
|
|
|
|||||
| Total fixed maturity securities |
48,227 | 47,816 | ||||||
| Fixed maturity securities – related party, ABS and CLO |
332 | 308 | ||||||
|
|
|
|
|
|||||
| Total fixed maturity securities including related party |
$ | 48,559 | $ | 48,124 | ||||
|
|
|
|
|
|||||
Actual maturities can differ from contractual maturities as borrowers may have the right to call or prepay obligations with or without call or prepayment penalties.
Unrealized Losses on AFS Securities—The following summarizes the fair value and gross unrealized losses for AFS securities, including related party AFS securities, aggregated by class of security and length of time the fair value has remained below amortized cost:
| December 31, 2015 | ||||||||||||||||||||||||
| Less than 12 months | 12 months or greater | Total | ||||||||||||||||||||||
| (In millions) | Fair Value | Gross Unrealized Losses |
Fair Value | Gross Unrealized Losses |
Fair Value | Gross Unrealized Losses |
||||||||||||||||||
| Fixed maturity securities |
||||||||||||||||||||||||
| U.S. government and agencies |
$ | 4 | $ | — | $ | 2 | $ | — | $ | 6 | $ | — | ||||||||||||
| U.S. state, municipals, and political subdivisions |
63 | (9) | 8 | (1) | 71 | (10) | ||||||||||||||||||
| Foreign governments |
711 | (20) | — | — | 711 | (20) | ||||||||||||||||||
| Corporate |
7,810 | (450) | 554 | (116) | 8,364 | (566) | ||||||||||||||||||
| CLO |
2,934 | (169) | 1,555 | (223) | 4,489 | (392) | ||||||||||||||||||
| ABS |
1,484 | (37) | 371 | (22) | 1,855 | (59) | ||||||||||||||||||
| CMBS |
577 | (11) | 119 | (9) | 696 | (20) | ||||||||||||||||||
| RMBS |
4,672 | (128) | 995 | (55) | 5,667 | (183) | ||||||||||||||||||
|
|
|
|
|
|
|
|
|
|
|
|
|
|||||||||||||
| Total AFS securities |
18,255 | (824) | 3,604 | (426) | 21,859 | (1,250) | ||||||||||||||||||
|
|
|
|
|
|
|
|
|
|
|
|
|
|||||||||||||
| Fixed maturity securities – related party |
||||||||||||||||||||||||
| CLO |
139 | (14) | 72 | (9) | 211 | (23) | ||||||||||||||||||
| ABS |
60 | (1) | — | — | 60 | (1) | ||||||||||||||||||
|
|
|
|
|
|
|
|
|
|
|
|
|
|||||||||||||
| Total fixed maturity securities – related party |
199 | (15) | 72 | (9) | 271 | (24) | ||||||||||||||||||
|
|
|
|
|
|
|
|
|
|
|
|
|
|||||||||||||
| Total AFS securities including related party |
$ | 18,454 | $ | (839) | $ | 3,676 | $ | (435) | $ | 22,130 | $ | (1,274) | ||||||||||||
|
|
|
|
|
|
|
|
|
|
|
|
|
|||||||||||||
F-37
Table of Contents
ATHENE HOLDING LTD.
Notes to Consolidated Financial Statements
| December 31, 2014 | ||||||||||||||||||||||||
| Less than 12 months | 12 months or greater | Total | ||||||||||||||||||||||
| (In millions) | Fair Value | Gross Unrealized Losses |
Fair Value | Gross Unrealized Losses |
Fair Value | Gross Unrealized Losses |
||||||||||||||||||
| Fixed maturity securities |
||||||||||||||||||||||||
| U.S. state, municipals, and political subdivisions |
$ | 51 | $ | (1) | $ | — | $ | — | $ | 51 | $ | (1) | ||||||||||||
| Corporate |
3,237 | (80) | 294 | (10) | 3,531 | (90) | ||||||||||||||||||
| CLO |
2,875 | (109) | 153 | (6) | 3,028 | (115) | ||||||||||||||||||
| ABS |
1,125 | (9) | 167 | (9) | 1,292 | (18) | ||||||||||||||||||
| CMBS |
974 | (9) | 109 | (5) | 1,083 | (14) | ||||||||||||||||||
| RMBS |
2,220 | (32) | 76 | (6) | 2,296 | (38) | ||||||||||||||||||
|
|
|
|
|
|
|
|
|
|
|
|
|
|||||||||||||
| Total AFS securities |
10,482 | (240) | 799 | (36) | 11,281 | (276) | ||||||||||||||||||
| Fixed maturity securities – related party, CLO |
239 | (10) | — | — | 239 | (10) | ||||||||||||||||||
|
|
|
|
|
|
|
|
|
|
|
|
|
|||||||||||||
| Total AFS securities including related party |
$ | 10,721 | $ | (250) | $ | 799 | $ | (36) | $ | 11,520 | $ | (286) | ||||||||||||
|
|
|
|
|
|
|
|
|
|
|
|
|
|||||||||||||
At December 31, 2015, we held 2,855 AFS securities that were in an unrealized loss position. Of this total, 614 were in an unrealized loss position longer than 12 months. At December 31, 2015, we held 21 related party AFS securities that were in an unrealized loss position. Of this total, eight were in an unrealized loss position longer than 12 months. We did not recognize the unrealized losses in income because we have the intent and ability to hold these securities until sale or maturity, and believe the securities will recover the amortized cost basis prior to sale or maturity.
Other-Than-Temporary Impairments on AFS Securities—For the year ended December 31, 2015, on total AFS securities including related party of $48,531 million, we incurred $30 million of net OTTI losses, of which $9 million related to intent-to-sell impairments. These securities were impaired to fair value as of the impairment date. The remainder of net OTTI losses of $21 million related to credit impairments, of which $1 million related to credit loss impairments that we impaired to fair value and did not bifurcate a portion of the impairment in AOCI, and is also excluded from the rollforward below.
The following table represents a rollforward of the cumulative amounts recognized on the consolidated statements of income for OTTI related to pre-tax credit loss impairments on AFS fixed maturity securities, for which a portion of the securities’ total OTTI was recognized in AOCI:
| Years ended December 31, | ||||||||||||
| (In millions) | 2015 | 2014 | 2013 | |||||||||
| Beginning balance |
$ | 8 | $ | 3 | $ | 10 | ||||||
| Initial impairments – credit loss OTTI recognized on securities not previously impaired |
19 | 3 | — | |||||||||
| Additional impairments – credit loss OTTI recognized on securities previously impaired |
1 | 2 | — | |||||||||
| Reduction in impairments from securities sold |
(2) | — | (7) | |||||||||
| Reduction for credit loss that no longer has a portion of the OTTI loss recognized in AOCI |
(4) | — | — | |||||||||
|
|
|
|
|
|
|
|||||||
| Ending balance |
$ | 22 | $ | 8 | $ | 3 | ||||||
|
|
|
|
|
|
|
|||||||
F-38
Table of Contents
ATHENE HOLDING LTD.
Notes to Consolidated Financial Statements
Net Investment Income—Net investment income by asset type consists of the following:
| Years ended December 31, | ||||||||||||
| (In millions) | 2015 | 2014 | 2013 | |||||||||
| AFS securities |
||||||||||||
| Fixed maturity securities |
$ | 2,051 | $ | 1,868 | $ | 811 | ||||||
| Equity securities |
7 | 6 | 4 | |||||||||
| Trading securities |
196 | 136 | 82 | |||||||||
| Mortgage loans, net of allowances |
320 | 347 | 128 | |||||||||
| Investment funds |
109 | 177 | 112 | |||||||||
| Cash and cash equivalents |
2 | 5 | 1 | |||||||||
| Funds withheld at interest and modco |
54 | 46 | 47 | |||||||||
| Policy loans |
21 | 16 | 6 | |||||||||
| Other investments |
21 | 3 | 7 | |||||||||
|
|
|
|
|
|
|
|||||||
| Investment revenue |
2,781 | 2,604 | 1,198 | |||||||||
| Investment expenses |
(273) | (271) | (124) | |||||||||
|
|
|
|
|
|
|
|||||||
| Net investment income |
$ | 2,508 | $ | 2,333 | $ | 1,074 | ||||||
|
|
|
|
|
|
|
|||||||
Investment Related Gains (Losses)—Investment related gains (losses) by asset type consist of the following:
| Years ended December 31, | ||||||||||||
| (In millions) | 2015 | 2014 | 2013 | |||||||||
| AFS fixed maturity securities |
||||||||||||
| Gross realized gain on investment activity |
$ | 150 | $ | 203 | $ | 130 | ||||||
| Gross realized loss on investment activity |
(86) | (22) | (44) | |||||||||
|
|
|
|
|
|
|
|||||||
| Net realized investment gains on fixed maturity securities |
64 | 181 | 86 | |||||||||
|
|
|
|
|
|
|
|||||||
| AFS equity securities |
||||||||||||
| Gross realized gain on investment activity |
1 | 1 | 8 | |||||||||
| Gross realized loss on investment activity |
— | — | (1) | |||||||||
|
|
|
|
|
|
|
|||||||
| Net realized investment gains on equity securities |
1 | 1 | 7 | |||||||||
|
|
|
|
|
|
|
|||||||
| Net realized investment gains (losses) on trading securities |
(228) | 242 | 130 | |||||||||
| Derivative gains (losses) |
(277) | 792 | 707 | |||||||||
| Other gains (losses) |
10 | (6) | (3) | |||||||||
|
|
|
|
|
|
|
|||||||
| Investment related gains (losses) |
$ | (430) | $ | 1,210 | $ | 927 | ||||||
|
|
|
|
|
|
|
|||||||
Proceeds from sales of AFS securities were $6,899 million, $6,391 million, and $6,788 million, for the years ended December 31, 2015, 2014, and 2013, respectively.
Included in net realized investment gains (losses) on trading securities are losses of $133 million, gains of $258 million, and losses of $73 million resulting from the change in unrealized gains or losses for the underlying bonds we still held as of December 31, 2015, 2014, and 2013, respectively. Also included in net realized investment gains (losses) on trading securities are related party losses of $10 million, gains of $13 million, and gains of $22 million resulting from the change in unrealized gains or losses for the underlying bonds we still held as of December 31, 2015, 2014, and 2013, respectively.
F-39
Table of Contents
ATHENE HOLDING LTD.
Notes to Consolidated Financial Statements
Purchased Credit Impaired (PCI) Securities—The following table summarizes our PCI securities, which are included in AFS fixed maturity securities:
| December 31, | ||||||||
| (In millions) | 2015 | 2014 | ||||||
| Contractually required payments1 |
$ | 7,291 | $ | 6,624 | ||||
| Less: Cash flows expected to be collected2 |
(4,986) | (4,632) | ||||||
|
|
|
|
|
|||||
| Non-accretable difference |
$ | 2,305 | $ | 1,992 | ||||
|
|
|
|
|
|||||
| Cash flows expected to be collected |
$ | 4,986 | $ | 4,632 | ||||
| Less: Amortized cost |
(3,673) | (3,302) | ||||||
|
|
|
|
|
|||||
| Accretable difference |
$ | 1,313 | $ | 1,330 | ||||
|
|
|
|
|
|||||
| Fair value |
$ | 3,647 | $ | 3,432 | ||||
| 1 | Includes principal and accrued interest. |
| 2 | Represents the acquisition date undiscounted principal and interest cash flows expected. |
We acquired PCI investments with the following amounts at the time of purchase:
| December 31, | ||||||||
| (In millions) | 2015 | 2014 | ||||||
| Contractually required principal and interest |
$ | 1,999 | $ | 4,167 | ||||
| Expected cash flows |
1,277 | 2,400 | ||||||
| Estimated fair value |
937 | 2,375 | ||||||
The following tables summarize the activity for the accretable yield on PCI securities:
| Years ended December 31, | ||||||||||||
| (In millions) | 2015 | 2014 | 2013 | |||||||||
| Beginning balance |
$ | 1,330 | $ | 1,254 | $ | 636 | ||||||
| Purchases of PCI securities, net |
243 | 513 | 683 | |||||||||
| Accretion |
(113) | (117) | (72) | |||||||||
| Changes in expected cash flows |
(147) | (320) | 7 | |||||||||
|
|
|
|
|
|
|
|||||||
| Ending balance |
$ | 1,313 | $ | 1,330 | $ | 1,254 | ||||||
|
|
|
|
|
|
|
|||||||
Mortgage Loans—Mortgage loans, net of allowances, consist of the following:
| December 31, | ||||||||
| (In millions) | 2015 | 2014 | ||||||
| Commercial mortgage loans |
$ | 5,400 | $ | 5,465 | ||||
| Residential mortgage loans |
100 | — | ||||||
|
|
|
|
|
|||||
| Mortgage loans, net of allowances |
$ | 5,500 | $ | 5,465 | ||||
|
|
|
|
|
|||||
We primarily make commercial mortgage loans on income producing properties including hotels, industrial properties, retail buildings, and office buildings. We diversify the commercial mortgage loan portfolio by
F-40
Table of Contents
ATHENE HOLDING LTD.
Notes to Consolidated Financial Statements
geographic region and property type to reduce concentration risk. Typically, we only lend up to 75% of the estimated fair value of the underlying real estate to manage risk in origination of a commercial mortgage loan. Subsequent to origination, we evaluate mortgage loans based on relevant current information to confirm if properties are performing at a consistent and acceptable level to secure the related debt.
The distribution of commercial mortgage loans, net of valuation allowances, by property type and geographic region is as follows:
| December 31, | ||||||||||||||||
| 2015 | 2014 | |||||||||||||||
| (In millions) | Net Carrying Value |
Percentage of Total |
Net Carrying Value |
Percentage of Total |
||||||||||||
| Property type |
||||||||||||||||
| Hotels |
$ | 877 | 16.2% | $ | 705 | 12.9% | ||||||||||
| Retail |
1,230 | 22.8% | 1,338 | 24.5% | ||||||||||||
| Office building |
1,274 | 23.6% | 1,301 | 23.8% | ||||||||||||
| Industrial |
821 | 15.2% | 936 | 17.1% | ||||||||||||
| Apartment |
907 | 16.8% | 809 | 14.8% | ||||||||||||
| Other commercial |
291 | 5.4% | 376 | 6.9% | ||||||||||||
|
|
|
|
|
|
|
|
|
|||||||||
| Total commercial mortgage loans |
$ | 5,400 | 100.0% | $ | 5,465 | 100.0% | ||||||||||
|
|
|
|
|
|
|
|
|
|||||||||
| U.S. Region |
||||||||||||||||
| East North Central |
$ | 443 | 8.2% | $ | 494 | 9.0% | ||||||||||
| East South Central |
129 | 2.4% | 151 | 2.8% | ||||||||||||
| Middle Atlantic |
804 | 14.9% | 786 | 14.4% | ||||||||||||
| Mountain |
583 | 10.8% | 692 | 12.7% | ||||||||||||
| New England |
181 | 3.3% | 142 | 2.6% | ||||||||||||
| Pacific |
838 | 15.5% | 836 | 15.3% | ||||||||||||
| South Atlantic |
1,231 | 22.8% | 1,228 | 22.5% | ||||||||||||
| West North Central |
291 | 5.4% | 320 | 5.8% | ||||||||||||
| West South Central |
792 | 14.7% | 816 | 14.9% | ||||||||||||
|
|
|
|
|
|
|
|
|
|||||||||
| Total U.S. Region |
5,292 | 98.0% | 5,465 | 100.0% | ||||||||||||
| International Region |
108 | 2.0% | — | —% | ||||||||||||
|
|
|
|
|
|
|
|
|
|||||||||
| Total commercial mortgage loans |
$ | 5,400 | 100.0% | $ | 5,465 | 100.0% | ||||||||||
|
|
|
|
|
|
|
|
|
|||||||||
Mortgage Loan Valuation Allowance—We have a high quality, well performing commercial mortgage loan portfolio with the majority of mortgage loans classified as performing at December 31, 2015, and 2014. We have established a valuation allowance for collection loss on the mortgage loan portfolio. The valuation allowance was $2 million and $1 million at December 31, 2015, and 2014, respectively. There were no material impairments recorded or significant activity in the valuation allowance during the years ended December 31, 2015, 2014, and 2013.
F-41
Table of Contents
ATHENE HOLDING LTD.
Notes to Consolidated Financial Statements
The following provides the aging of our commercial mortgage loan portfolio, net of valuation allowances:
| December 31, | ||||||||
| (In millions) | 2015 | 2014 | ||||||
| Current (less than 30 days past due) |
$ | 5,360 | $ | 5,461 | ||||
| 30 to 60 days past due |
1 | 4 | ||||||
| Over 90 days past due |
39 | — | ||||||
|
|
|
|
|
|||||
| Total commercial mortgage loans |
$ | 5,400 | $ | 5,465 | ||||
|
|
|
|
|
|||||
Loan-to-value and debt service coverage ratios are measures we use to assess the risk and quality of mortgage loans.
The loan-to-value ratio is expressed as a percentage of the amount of the loan relative to the value of the underlying property. A loan-to-value ratio in excess of 100% indicates the unpaid loan amount exceeds the underlying collateral. The following represents the loan-to-value ratio of the commercial mortgage loan portfolio, net of valuation allowances:
| December 31, | ||||||||
| (In millions) | 2015 | 2014 | ||||||
| Less than 50% |
$ | 2,159 | $ | 2,156 | ||||
| 50% to 60% |
1,173 | 1,579 | ||||||
| 61% to 70% |
1,299 | 910 | ||||||
| 71% to 100% |
698 | 820 | ||||||
| Greater than 100% |
71 | — | ||||||
|
|
|
|
|
|||||
| Total commercial mortgage loans |
$ | 5,400 | $ | 5,465 | ||||
|
|
|
|
|
|||||
The debt service coverage ratio, based upon the most recent financial statements, is expressed as a percentage of a property’s net income to its debt service payments. A debt service ratio of less than 1.0 indicates a property’s operations do not generate enough income to cover debt payments. The following represents the debt service coverage ratio of the commercial mortgage loan portfolio, net of valuation allowances:
| December 31, | ||||||||
| (In millions) | 2015 | 2014 | ||||||
| Greater than 1.20x |
$ | 4,455 | $ | 4,446 | ||||
| 1.00x – 1.20x |
471 | 474 | ||||||
| Less than 1.00x |
474 | 545 | ||||||
|
|
|
|
|
|||||
| Total commercial mortgage loans |
$ | 5,400 | $ | 5,465 | ||||
|
|
|
|
|
|||||
Real Estate—We did not record any material depreciation expense or accumulated depreciation on real estate during the year ended December 31, 2015. We acquired real estate investments in connection with the acquisition of DLD on October 1, 2015, as discussed in Note 8 – Business Combinations.
Funds Withheld at Interest—For reinsurance agreements written on a coinsurance funds withheld basis, assets equal to the net statutory reserves are withheld and legally owned by the ceding company. These are reflected as funds withheld at interest on the consolidated balance sheets. In the event of a ceding company’s insolvency, we would need to assert a claim on the assets supporting our reserve liabilities. However, we have the ability to
F-42
Table of Contents
ATHENE HOLDING LTD.
Notes to Consolidated Financial Statements
offset amounts we owe to the ceding company, which reduces our risk of loss. The embedded derivative of the funds withheld is separated from the host contract. See Note 5 – Derivative Instruments for further discussion.
Interest accrues at a risk free rate and the weighted average yield across all cedants was 1.8% and 2.1% as of December 31, 2015, and 2014, respectively. The return on the underlying assets directly impacts the host contract and the embedded derivative. The Company is subject to the investment performance on the withheld assets, although it does not directly control them. However, in each case, the ceding company has hired AAM, a related party investment management company, to manage the withheld assets in accordance with investment guidelines agreed to among the Company, the ceding company, and AAM. AAM manages these portfolios in accordance with such guidelines, taking into account the investment objectives of the Company given the applicable reinsurance relationship, and these portfolios remain subject to oversight of the applicable ceding company.
Investment Funds—Our investment fund portfolio consists of funds that employ various strategies and include investments in mortgage and real estate, credit, private equity, natural resources, and hedge funds. Investment funds meet the definition of variable interest entities and are discussed further in Note 6 – Variable Interest Entities.
5. Derivative Instruments
We use a variety of derivative instruments to manage equity risk, interest rate risk, credit risk, foreign currency risk, and market volatility. See Note 3 – Summary of Significant Accounting Policies for a description of our accounting policies for derivatives and Note 7 – Fair Value for information about the fair value hierarchy for derivatives.
The following table presents the notional amount and fair value of derivative instruments:
| December 31, | ||||||||||||||||||||||||
| 2015 | 2014 | |||||||||||||||||||||||
| Notional Amount |
Fair Value | Notional Amount |
Fair Value | |||||||||||||||||||||
| (In millions) | Assets | Liabilities | Assets | Liabilities | ||||||||||||||||||||
| Derivatives designated as hedges |
||||||||||||||||||||||||
| Foreign currency swaps |
177 | $ | 14 | $ | — | 223 | $ | 9 | $ | — | ||||||||||||||
| Derivatives not designated as hedges |
||||||||||||||||||||||||
| Equity options |
25,176 | 831 | — | 27,402 | 1,792 | 108 | ||||||||||||||||||
| Futures |
— | 9 | 1 | — | 15 | — | ||||||||||||||||||
| Total return swaps |
54 | — | — | 84 | 3 | 1 | ||||||||||||||||||
| Foreign currency swaps |
47 | 5 | — | 58 | 10 | — | ||||||||||||||||||
| Interest rate swaps |
859 | 2 | 8 | 1,184 | 2 | 14 | ||||||||||||||||||
| Credit default swaps |
10 | — | 7 | 10 | — | 7 | ||||||||||||||||||
| Variance swaps |
— | 5 | — | 2 | 5 | 13 | ||||||||||||||||||
| Foreign currency forwards |
367 | 5 | 1 | 223 | 6 | — | ||||||||||||||||||
| Embedded derivatives |
||||||||||||||||||||||||
| Funds withheld and modco |
— | 36 | 35 | — | 127 | 394 | ||||||||||||||||||
| Interest sensitive contract liabilities |
— | — | 4,477 | — | — | 4,437 | ||||||||||||||||||
|
|
|
|
|
|
|
|
|
|
|
|
| |||||||||||||
| Total non-hedging derivatives |
893 | 4,529 | 1,960 | 4,974 | ||||||||||||||||||||
|
|
|
|
|
|
|
|
|
|
|
|
| |||||||||||||
| Total derivatives |
$ | 907 | $ | 4,529 | $ | 1,969 | $ | 4,974 | ||||||||||||||||
|
|
|
|
|
|
|
|
|
|
|
|
| |||||||||||||
F-43
Table of Contents
ATHENE HOLDING LTD.
Notes to Consolidated Financial Statements
Derivatives are included in derivative assets or liabilities on the consolidated balance sheets, with the exception of embedded derivatives. Funds withheld or modco embedded derivatives are included in funds withheld at interest or funds withheld liability on the consolidated balance sheets. Indexed annuity products embedded derivatives are included in interest sensitive contract liabilities on the consolidated balance sheets.
Derivative gains (losses) included in investment related gains (losses) on the consolidated statements of income are as follows:
| Years ended December 31, | ||||||||||||
| (In millions) | 2015 | 2014 | 2013 | |||||||||
| Cash flow hedges |
$ | — | $ | — | $ | 1 | ||||||
| Derivatives not designated as hedges |
(277) | 792 | 706 | |||||||||
|
|
|
|
|
|
|
|||||||
| Total derivative gains (losses) |
$ | (277) | $ | 792 | $ | 707 | ||||||
|
|
|
|
|
|
|
|||||||
Derivatives Designated as Hedges
Cash flow hedges – We use foreign currency swaps to convert foreign currency denominated cash flows of an investment to U.S. dollars to reduce cash flow fluctuations due to changes in currency exchange rates. As of December 31, 2015, and 2014, we had five foreign currency swaps designated and accounted for as cash flow hedges. The foreign currency swaps will expire by June 25, 2027. There were no amounts deemed ineffective for the years ended December 31, 2015, 2014, and 2013. The following represents foreign currency swap gains (losses):
| Years ended December 31, | ||||||||||||
| (In millions) | 2015 | 2014 | 2013 | |||||||||
| Gains (losses) recorded in AOCI |
$ | 9 | $ | (7) | $ | (9) | ||||||
| Amounts reclassified to income in investment related gains (losses) |
— | — | 1 | |||||||||
|
|
|
|
|
|
|
|||||||
| Total foreign currency swap gains (losses) |
$ | 9 | $ | (7) | $ | (8) | ||||||
|
|
|
|
|
|
|
|||||||
Derivatives Not Designated as Hedges
Equity options – We use equity indexed options to economically hedge fixed indexed annuity products that guarantee the return of principal to the policyholder and credit interest based on a percentage of the gain in a specified market index, primarily the S&P 500. To hedge against adverse changes in equity indices, we enter into contracts to buy the equity indexed options within a limited time at a contracted price. The contracts are net settled in cash based on differentials in the indices at the time of exercise and the strike price.
Equity swaps – We entered into an equity swap transaction with Apollo in connection with the termination of the quarterly monitoring fee under the Transaction Advisory Services Agreement (TASA). See Note 19 – Related Parties for additional information.
Futures – Futures contracts are purchased to hedge the growth in interest credited to the customer as a direct result of increases in the related indicies. We enter into exchange-traded futures with regulated futures commission clearing brokers who are members of a trading exchange. Under exchange-traded futures contracts, we agree to purchase a specified number of contracts with other parties and to post variation margin on a daily basis in an amount equal to the difference in the daily fair values of those contracts.
Total return swaps – We purchase total rate of return swaps to gain exposure and benefit from a reference asset without ownership. Total rate of return swaps are contracts in which one party makes payments based on a set
F-44
Table of Contents
ATHENE HOLDING LTD.
Notes to Consolidated Financial Statements
rate, either fixed or variable, while the other party makes payments based on the return of the underlying asset, which includes both the income it generates and any capital gains.
Interest rate swaps – We use interest rate swaps to reduce market risks from interest rate changes and to alter interest rate exposure arising from mismatches between assets and liabilities. With an interest rate swap, we agree with another party to exchange the difference between fixed-rate and floating-rate interest amounts tied to an agreed-upon notional principal amount at specified intervals.
Certain of our consolidated VIE investment funds use interest rate swaps to manage exposure to variable cash flows on portions of their borrowings under repurchase agreements (see Note 6 – Variable Interest Entities).
Credit default swaps – Credit default swaps provide a measure of protection against the default of an issuer or allow us to gain credit exposure to an issuer or traded index. We use credit default swaps coupled with a bond to synthetically create the characteristics of a bond and to hedge credit risk. These transactions have a lower cost and are more liquid relative to the cash market. We receive a periodic premium for these transactions as compensation for accepting credit risk.
Hedging credit risk involves buying protection for existing credit risk. The exposure resulting from the agreements, which is usually the notional amount, is equal to the maximum proceeds that must be paid by a counterparty for a defaulted security. If a credit event occurs on a reference entity, then a counterparty who sold protection is required to pay the buyer the trade notional amount less any recovery value of the security.
Variance swaps – We have variance swaps to hedge the growth in interest credited to the customer as a direct result of changes in the volatility. In a variance swap transaction, we agree to exchange future realized volatility for current implied volatility. This type of forward contract pays the difference between the realized variance and a predefined strike multiplied by a notional value.
Swaptions – To achieve protection against a rapid and sustained rise in interest rates, we have entered into payor swaptions. Swaptions are options to enter into an interest rate swap arrangement with a counterparty at a specified future date. At expiration, the counterparty is required to pay us the present value of the difference between the fixed interest rate and a specified strike rate multiplied by the notional amount of the swap agreement. These transactions would lessen the negative impact to us of a significant and prolonged increase in interest rates.
Foreign currency forwards – We use foreign currency forward contracts to hedge certain invested assets against movement in foreign currency. The price is agreed upon at the time of the contract and payment is made at a specified future date.
Embedded derivatives – We have embedded derivatives which are required to be separated from their host contracts and reported as derivatives. Host contracts include reinsurance agreements structured on a modco or funds withheld basis and indexed annuity products.
F-45
Table of Contents
ATHENE HOLDING LTD.
Notes to Consolidated Financial Statements
The following is a summary of the gains (losses) related to derivatives not designated as hedges:
| Years ended December 31, | ||||||||||||
| (In millions) | 2015 | 2014 | 2013 | |||||||||
| Equity options |
$ | (372) | $ | 955 | $ | 807 | ||||||
| Total return swaps |
— | 11 | (136) | |||||||||
| Futures |
(3) | 52 | 51 | |||||||||
| Interest rate swaps |
(4) | (4) | 35 | |||||||||
| Interest rate caps |
— | — | (10) | |||||||||
| Credit default swaps |
— | 1 | — | |||||||||
| Variance swaps |
— | (1) | (1) | |||||||||
| Foreign currency swaps |
12 | 3 | 1 | |||||||||
| Foreign currency forwards |
21 | 21 | (6) | |||||||||
| Swaptions |
— | — | (69) | |||||||||
| Embedded derivatives in modco or funds withheld |
69 | (246) | 34 | |||||||||
|
|
|
|
|
|
|
|||||||
| Amounts recognized in investment related gains (losses) |
(277) | 792 | 706 | |||||||||
| Embedded derivatives in indexed annuity products1 |
158 | (976) | (544) | |||||||||
| Equity swaps2 |
— | — | (131) | |||||||||
|
|
|
|
|
|
|
|||||||
| Total gains (losses) for derivatives not designated as hedges |
$ | (119) | $ | (184) | $ | 31 | ||||||
|
|
|
|
|
|
|
|||||||
| 1 | Included in interest sensitive contract benefits |
| 2 | Included in policy and other operating expenses |
Credit Risk—We may be exposed to credit-related losses in the event of counterparty nonperformance on derivative financial instruments. Generally, the current credit exposure of our derivative contracts is the fair value at the reporting date less any collateral received from the counterparty.
We manage credit risk related to over-the-counter derivatives by entering into transactions with creditworthy counterparties. Where possible, we maintain collateral arrangements and use master agreements that provide for a single net payment from one counterparty to another at each due date and upon termination. We have also established counterparty exposure limits, where possible, in order to evaluate if there is sufficient collateral to support the net exposure.
Collateral arrangements typically require the posting of collateral in connection with its derivative instruments. Collateral agreements often contain posting thresholds, some of which may vary depending on the posting party’s financial strength ratings. Additionally, a decrease in our financial strength rating to a specified level can result in settlement of the derivative position. As of December 31, 2015, and 2014, we had $9 million and $8 million, respectively, of collateral pledged to counterparties. The securities pledged as collateral are included in AFS fixed maturity securities on the consolidated balance sheets.
F-46
Table of Contents
ATHENE HOLDING LTD.
Notes to Consolidated Financial Statements
The estimated fair value of our net derivative and other financial assets and liabilities after the application of master netting agreements and collateral were as follows:
| Gross amounts not offset on the consolidated balance sheets |
||||||||||||||||||||||||
| (In millions) | Gross amount recognized1 |
Financial instruments2 |
Collateral received/pledged |
Net amount | Off-balance sheet securities collateral3 |
Net amount after securities collateral |
||||||||||||||||||
| December 31, 2015 |
||||||||||||||||||||||||
| Derivative assets |
$ | 871 | $ | (7) | $ | (867) | $ | (3) | $ | (57) | $ | (60) | ||||||||||||
| Derivative liabilities |
(17) | 7 | 9 | (1) | — | (1) | ||||||||||||||||||
| December 31, 2014 |
||||||||||||||||||||||||
| Derivative assets |
$ | 1,794 | $ | (132) | $ | (1,402) | $ | 260 | $ | (351) | $ | (91) | ||||||||||||
| Derivative liabilities |
(143) | 132 | 8 | (3) | — | (3) | ||||||||||||||||||
| 1 | The gross amounts of recognized derivative assets and derivative liabilities are reported on the consolidated balance sheets. The above excludes $0 million and $48 million of derivative assets as of December 31, 2015 and December 31, 2014, respectively, that are not subject to master netting agreements or similar agreements. The gross amounts of the derivative assets and derivative liabilities are not netted against each other for presentation on the consolidated balance sheets. |
| 2 | Represents amounts offsetting derivative assets and derivative liabilities that are subject to an enforceable master netting agreement or similar agreement that are not netted against the gross derivative assets or gross derivative liabilities for presentation on the consolidated balance sheets. |
| 3 | For securities collateral received, we do not have the right to sell or re-pledge the collateral. As such, we do not record the securities on the balance sheet. |
Certain derivative instruments contain provisions for credit related events, such as downgrades in our credit ratings or for a negative credit event of a credit default swap’s reference entity. If a credit event were to occur, we may be required to post additional collateral or settle an outstanding liability. The following is a summary of our exposure to credit related events:
| December 31, | ||||||||
| (In millions) | 2015 | 2014 | ||||||
| Fair value of derivative liabilities with credit related provisions |
$ | 7 | $ | 7 | ||||
| Maximum exposure for credit default swaps |
10 | 10 | ||||||
There was no additional collateral required for default or termination event as of December 31, 2015, or 2014.
We also have invested in a fixed maturity security classified as trading that contains credit default swaps. This security is subject to the credit risk of the issuer, which consists of the underlying credit default swaps and high quality fixed maturities that serve as collateral. A default event occurs if the cumulative losses exceed a specified attachment point, which is typically not the first loss of the portfolio. If a default event occurs that exceeds the specified attachment point, our investment may not be fully returned. We would have no future potential payments under this investment. As of December 31, 2015, the amortized cost of the investment is $42 million, the carrying value is $43 million, and the weighted average expected life is six years.
F-47
Table of Contents
ATHENE HOLDING LTD.
Notes to Consolidated Financial Statements
6. Variable Interest Entities
Our investment funds generally meet the definition of a VIE, and in certain cases these investment funds are consolidated in our financial statements because we meet the criteria of the primary beneficiary.
Consolidated VIEs—We consolidate CoInvest VI, CoInvest VII, CoInvest Other, London Prime, and CMBS Funds, which are investment funds. We are the only limited partner in these investment funds and receive all of the economic benefits and losses, other than management fees and carried interest, as applicable, paid to the general partner in each entity, which are related parties. We do not have any voting rights as limited partner and do not solely satisfy the power criteria to direct the activities that significantly impact the economics of the VIE. However, the criteria for the primary beneficiary are satisfied by our related party group and because substantially all of the activities are conducted on our behalf, we consolidate the investment funds.
No arrangement exists requiring us to provide additional funding in excess of our committed capital investment, liquidity, or the funding of losses or an increase to our loss exposure in excess of our investment in the VIEs. We elected the fair value option for loans held for investment, investment funds, and borrowings, which are reported in the consolidated variable interest entity sections on the consolidate balance sheets. We elected the fair value option to maintain consistency with our previous fair value option election for these VIEs prior to consolidating them under ASU 2015-02.
CoInvest VI, CoInvest VII, and CoInvest Other were formed to make investments, including co-investments alongside private equity funds sponsored by Apollo. We received our interests in CoInvest VI, CoInvest VII, and CoInvest Other in connection with the Contribution Agreement discussed in Note 19 – Related Parties, in order to provide a capital base to support future acquisitions. London Prime was formed for the purpose of investing in Prime London Ventures Limited, a Guernsey limited company, which purchases rental residential assets across prime central London. The CMBS Funds were formed with the objective of generating high risk-adjusted investment returns by investing primarily in a portfolio of eligible CMBS and using leverage through repurchase agreements treated as collateralized financing.
ALRe formed Highland Re Ltd. (HRL), a Bermuda special purpose insurer, as its direct subsidiary. ALRe entered into two non-proportional reinsurance agreements with HRL to cede claims risk associated with an affiliate reinsurance deal. HRL issued voting common shares, all owned by ALRe, and one non-voting preferred share, owned by a third party, in order to capitalize HRL. The initial investment of HRL, using the cash received from the sale of the preferred share, was the purchase of a note from the buyer of the preferred share. HRL was restricted from selling or transferring the note absent the occurrence of defined trigger events. The preferred share supported the reinsurance transaction of HRL only, and that capital was not available to the Company for any other purpose. The preferred share was issued in connection with over collateralization provided by the preferred share buyer in a transaction with an affiliate of HRL. The preferred share buyer was entitled to request redemption of all or fractional portions of the preferred share under certain conditions during the term of the note. The note was repaid during 2014 and HRL was dissolved in the fourth quarter of 2014.
In January 2015, CoInvest VII contributed its primary investment, MidCap Holdings, valued at $551 million, to a newly formed entity, MidCap FinCo Limited (MidCap FinCo) in exchange for subordinated notes issued by MidCap FinCo and shares in MidCap FinCo’s parent company. Concurrent with this restructuring, CoInvest VII distributed to its general partner, an affiliate of Apollo, $30 million of the MidCap FinCo notes, in satisfaction of the carried interest that had been earned by the general partner under the previous MidCap Holdings structure through the date of the restructuring. Additionally, unrelated investors made cash contributions to MidCap FinCo of $1,017 million through December 31, 2015. Following the restructuring and the funding by unrelated investors, CoInvest VII owned 32% of the outstanding economic interests of MidCap FinCo. Also, CoInvest VII
F-48
Table of Contents
ATHENE HOLDING LTD.
Notes to Consolidated Financial Statements
agreed to certain transfer restrictions and has foregone certain rights associated with its investment in MidCap FinCo for a period of two years, resulting in a discount applied to the value of the notes held by CoInvest VII as described above, equal to 7% as of December 31, 2015.
In addition, MidCap FinCo and one of its subsidiaries succeeded as borrower under the credit facilities we had previously advanced to MidCap Holdings in the amount of $300 million at December 31, 2015.
As a result of this restructuring, CoInvest VII owns the MidCap Holdings investment indirectly through MidCap FinCo. The significant investment by the new, unrelated investors, and a qualitative assessment of the impact of the restructuring resulted in a determination that substantially all of the activities of MidCap Finco are not being conducted on behalf of CoInvest VII, but are being conducted for the benefit of all investors. Therefore, CoInvest VII is not the primary beneficiary of MidCap FinCo and accounts for it as an equity method investment at fair value as of December 31, 2015, resulting in MidCap Holdings no longer being consolidated in our financial statements after the restructuring.
Prior to the restructuring, in conjunction with certain of MidCap Holdings’ borrowing facilities, MidCap Holdings established and contributed loans to separate single-purpose entities, structured to be legally isolated, and bankruptcy-remote. We determined these entities were VIEs. As a result of MidCap Holdings’ power to direct the activities that most significantly impact the economic performance and its economic interest in these VIEs, we concluded MidCap Holdings is the primary beneficiary, and therefore the assets and liabilities of the entities are reported in our consolidated financial statements through December 31, 2014. As of December 31, 2014, $1,224 million of the assets of MidCap Holdings, consisting of loans, accrued interest and fees, and restricted cash, can only be used to settle the obligations of its consolidated VIEs. In addition, $855 million of MidCap Holdings’ liabilities as of December 31, 2014, represent obligations of its consolidated VIEs, for which there is no recourse to general credit of MidCap Holdings. Upon the MidCap Holdings restructuring described above, these VIEs are no longer consolidated by CoInvest VII, or, therefore, by the Company.
Trading securities – including related party – Trading securities represents investments in fixed maturity and equity securities with changes in fair value recognized in investment related gains (losses) within revenues of consolidated variable interest entities on the consolidated statements of income. For the years ending December 31, 2015, 2014, and 2013, investment related gains (losses) included losses of $23 million, losses of $74 million, and gains of $380 million, respectively, resulting from the change in unrealized gains and losses underlying trading securities we still held as of the respective year end date. Trading securities held by CoInvest VI and CoInvest VII are considered related party investments because Apollo affiliates exercise significant influence over the operations of these investees.
Loans held for investment – MidCap Holdings’ primary operations are to originate loans to middle market healthcare companies. We elected the fair value option to account for MidCap Holdings’ loans. The loan portfolio, by type, recorded at fair value is as follows:
| (In millions) | December 31, 2014 | |||
| Commercial and industrial loans |
$ | 1,486 | ||
| Commercial real estate loans |
585 | |||
|
|
|
|||
| Total loans held for investment |
$ | 2,071 | ||
|
|
|
|||
Investment funds – including related party – Investment funds include non-fixed income, alternative investments in the form of limited partnerships or similar legal structures that meet the definition of VIEs; however, our consolidated VIEs are not considered the primary beneficiary of these investment funds. Changes in fair value of
F-49
Table of Contents
ATHENE HOLDING LTD.
Notes to Consolidated Financial Statements
these investment funds are included in investment related gains (losses) within revenues of consolidated variable interest entities on the consolidated statements of income. Investment funds held by CoInvest VII and CoInvest Other are considered related party investments as they are sponsored or managed by Apollo affiliates.
Borrowings – CMBS-I and II Funds each entered into individual repurchase agreements with UBS to borrow up to $250 million each, on a non-recourse basis, to finance the acquisition of AAA rated CMBS. Both UBS facilities have four-year terms and one one-year extension available with the mutual agreement of the parties. Upon extension, each security purchased with funds from UBS facilities will be assigned a spread in line with the current market rates, to be determined by UBS. Advances under the facilities accrue interest at an annual rate of three-month LIBOR plus a pricing margin of 2.5% – 2.9%. The CMBS purchase price is determined on a per asset basis by applying an advance rate schedule, as agreed upon by the funds and UBS.
All of the repurchase facility agreements contain customary affirmative and negative covenants and provisions regarding events of default at the investment fund level. At December 31, 2015, and 2014, the CMBS Funds were in compliance with all debt covenants under these facilities.
The CMBS Funds’ repurchase agreements included borrowings with the following maturities and weighted average interest rates:
| December 31, 2015 | December 31, 2014 | |||||||||||||||||||||||
| (In millions) | Balance | Remaining Maturity1 |
Weighted Average Interest Rate2 |
Balance | Remaining Maturity1 |
Weighted Average Interest Rate2 |
||||||||||||||||||
| 2012 CMBS-I Fund L.P. |
$ | 250 | 1.7 years | 3.2% | $ | 250 | 2.7 years | 3.0% | ||||||||||||||||
| 2012 CMBS-II Fund L.P. |
250 | 1.7 years | 3.2% | 250 | 2.7 years | 3.0% | ||||||||||||||||||
|
|
|
|
|
|
|
|
|
|
|
|
|
|||||||||||||
| Total |
$ | 500 | $ | 500 | ||||||||||||||||||||
|
|
|
|
|
|||||||||||||||||||||
| 1 | Assumes extension options on borrowing repurchase agreement are exercised. |
| 2 | The borrowings are on a floating rate basis; however, the CMBS Funds have entered into an interest rate swap to convert these borrowings to fixed rate. |
F-50
Table of Contents
ATHENE HOLDING LTD.
Notes to Consolidated Financial Statements
MidCap Holdings had the following borrowing capacity and outstanding borrowings:
| December 31, 2014 | ||||||||||||||||||||||||
| (In millions) | Total Commitment |
Borrowing Capacity1 |
Outstanding Balance |
Outstanding Principal of Loans Pledged |
Interest Rate(s)2 | Maturity Date(s) | ||||||||||||||||||
| Capital One Facility3 |
$ | 75 | $ | 66 | $ | 66 | $ | 103 | 3.75% | September 5, 2017 | ||||||||||||||
| Capital Source Facility |
75 | 46 | 46 | 58 | 3.92% | October 30, 2019 | ||||||||||||||||||
| City National |
85 | 83 | 74 | 127 | 3.17% | November 1, 2017 | ||||||||||||||||||
| Fortress Facilities |
270 | 253 | 253 | 302 | 5.21% |
|
July 9, 2017 – July 1, 2019 |
| ||||||||||||||||
| Real Estate Participants |
302 | 302 | 302 | 370 | 4.01% |
|
January 31, 2015 – April 22, 2019 |
| ||||||||||||||||
| Private Bank Facility |
35 | 13 | 13 | 16 | 5.00% – 5.50% |
|
June 13, 2016 – February 20, 2019 |
| ||||||||||||||||
| Silicon Valley Bank Facility |
45 | 27 | 27 | 45 | 3.53% | October 3, 2016 | ||||||||||||||||||
| Wells Fargo Health Care Asset-Backed Facility |
795 | 624 | 584 | 791 | 2.85% | January 1, 2017 | ||||||||||||||||||
| Wells Fargo Leveraged Loan Facility |
250 | 140 | 140 | 210 | 2.76% | November 8, 2018 | ||||||||||||||||||
| Wells Fargo General Asset-Backed Facility |
110 | 20 | 12 | 54 | 2.41% | September 26, 2019 | ||||||||||||||||||
|
|
|
|
|
|
|
|
|
|||||||||||||||||
| Total |
$ | 2,042 | $ | 1,574 | $ | 1,517 | $ | 2,076 | ||||||||||||||||
|
|
|
|
|
|
|
|
|
|||||||||||||||||
| 1 | Represents the amount MidCap Holdings is able to draw based on collateral pledged according to each agreement. |
| 2 | Interest rates are variable rates. The interest rate disclosed represents the interest rate as of December 31, 2014. |
| 3 | No loan may collateralize in the credit facility for a period in excess of 120 days. |
Fair Value – See Note 7 – Fair Value for a description of the levels of our fair value hierarchy and our process for determining the level to which we assign our assets and liabilities carried at fair value.
The following represents the hierarchy for assets and liabilities of our consolidated VIEs measured at fair value on a recurring basis:
| December 31, 2015 | ||||||||||||||||
| (In millions) | Total | Level 1 | Level 2 | Level 3 | ||||||||||||
| Assets of consolidated variable interest entities |
||||||||||||||||
| Investments |
||||||||||||||||
| Trading securities |
||||||||||||||||
| Fixed maturity securities |
$ | 722 | $ | — | $ | 669 | $ | 53 | ||||||||
| Equity securities |
309 | 271 | — | 38 | ||||||||||||
| Investment funds |
516 | — | — | 516 | ||||||||||||
| Cash and cash equivalents |
6 | 6 | — | — | ||||||||||||
|
|
|
|
|
|
|
|
|
|||||||||
| Total assets of consolidated variable interest entities measured at fair value |
$ | 1,553 | $ | 277 | $ | 669 | $ | 607 | ||||||||
|
|
|
|
|
|
|
|
|
|||||||||
F-51
Table of Contents
ATHENE HOLDING LTD.
Notes to Consolidated Financial Statements
| December 31, 2014 | ||||||||||||||||
| (In millions) | Total | Level 1 | Level 2 | Level 3 | ||||||||||||
| Assets of consolidated variable interest entities |
||||||||||||||||
| Investments |
||||||||||||||||
| Trading securities |
||||||||||||||||
| Fixed maturity securities |
$ | 763 | $ | — | $ | 706 | $ | 57 | ||||||||
| Equity securities |
510 | 448 | — | 62 | ||||||||||||
| Loans held for investment |
2,071 | — | — | 2,071 | ||||||||||||
| Investment funds |
40 | — | — | 40 | ||||||||||||
| Cash and cash equivalents |
10 | 10 | — | — | ||||||||||||
| Restricted cash |
43 | 43 | — | — | ||||||||||||
|
|
|
|
|
|
|
|
|
|||||||||
| Total assets of consolidated variable interest entities measured at fair value |
$ | 3,437 | $ | 501 | $ | 706 | $ | 2,230 | ||||||||
|
|
|
|
|
|
|
|
|
|||||||||
| Liabilities of consolidated variable interest entities |
||||||||||||||||
| Borrowings |
$ | 1,517 | $ | — | $ | — | $ | 1,517 | ||||||||
|
|
|
|
|
|
|
|
|
|||||||||
| Total liabilities of consolidated variable interest entities measured at fair value |
$ | 1,517 | $ | — | $ | — | $ | 1,517 | ||||||||
|
|
|
|
|
|
|
|
|
|||||||||
Fair Value Valuation Methods—Refer to Note 7 – Fair Value for the valuation methods used to determine the fair value of trading securities, investment funds, and cash and cash equivalents.
Loans held for investment – The fair value of loans held for investment is determined by reference to current market pricing and credit factors compared to market pricing and credit factors during the original underwriting, as well as any changes to the underlying collateral, if applicable. The loans’ fair values are estimated using discounted cash flow techniques.
Borrowings – The fair value of borrowings is estimated based on consideration of the current market interest rates for similar debt instruments. The fair value is estimated using discounted cash flow techniques.
F-52
Table of Contents
ATHENE HOLDING LTD.
Notes to Consolidated Financial Statements
Level 3 Financial Instruments – The following is a reconciliation for all VIE Level 3 assets and liabilities measured at fair value on a recurring basis:
| December 31, 2015 | ||||||||||||||||||||||||||||||||
| (In millions) | Beginning Balance |
Total realized and unrealized gains (losses) included in income |
Purchases/ Borrowings |
Sales/ Repayments |
Transfers in (out) |
Other2 | Ending Balance |
Total gains (losses) included in earnings1 |
||||||||||||||||||||||||
| Assets of consolidated variable interest entities |
||||||||||||||||||||||||||||||||
| Trading securities |
||||||||||||||||||||||||||||||||
| Fixed maturity securities |
$ | 57 | $ | (6) | $ | 2 | $ | — | $ | — | $ | — | $ | 53 | $ | (6) | ||||||||||||||||
| Equity securities |
62 | (15) | — | — | — | (9) | 38 | (15) | ||||||||||||||||||||||||
| Loans held for investment |
2,071 | — | — | — | — | (2,071) | — | — | ||||||||||||||||||||||||
| Investment funds |
40 | 3 | 15 | (15) | — | 473 | 516 | (7) | ||||||||||||||||||||||||
|
|
|
|
|
|
|
|
|
|
|
|
|
|
|
|
|
|||||||||||||||||
| Total Level 3 assets of consolidated variable interest entities |
$ | 2,230 | $ | (18) | $ | 17 | $ | (15) | $ | — | $ | (1,607) | $ | 607 | $ | (28) | ||||||||||||||||
|
|
|
|
|
|
|
|
|
|
|
|
|
|
|
|
|
|||||||||||||||||
| Liabilities of consolidated variable interest entities |
||||||||||||||||||||||||||||||||
| Borrowings |
$ | (1,517) | $ | — | $ | — | $ | — | $ | — | $ | 1,517 | $ | — | $ | — | ||||||||||||||||
|
|
|
|
|
|
|
|
|
|
|
|
|
|
|
|
|
|||||||||||||||||
| Total Level 3 liabilities of consolidated variable interest entities |
$ | (1,517) | $ | — | $ | — | $ | — | $ | — | $ | 1,517 | $ | — | $ | — | ||||||||||||||||
|
|
|
|
|
|
|
|
|
|
|
|
|
|
|
|
|
|||||||||||||||||
| 1 | Related to instruments held at end of year. |
| 2 | Other activity primarily relates to the deconsolidation of MidCap Holdings due to the restructuring described above. |
F-53
Table of Contents
ATHENE HOLDING LTD.
Notes to Consolidated Financial Statements
| December 31, 2014 | ||||||||||||||||||||||||||||||||
| (In millions) | Beginning Balance |
Total realized and unrealized gains (losses) included in income |
Purchases/ Borrowings |
Sales/ Repayments |
Transfers in (out) |
Other | Ending Balance |
Total gains (losses) included in earnings1 |
||||||||||||||||||||||||
| Assets of consolidated variable interest entities |
||||||||||||||||||||||||||||||||
| Trading securities |
||||||||||||||||||||||||||||||||
| Fixed maturity securities |
$ | 74 | $ | — | $ | — | $ | (17) | $ | — | $ | — | $ | 57 | $ | (1) | ||||||||||||||||
| Equity securities |
145 | 32 | — | (115) | — | — | 62 | (26) | ||||||||||||||||||||||||
| Loans held for investment |
1,563 | 26 | 482 | — | — | — | 2,071 | 11 | ||||||||||||||||||||||||
| Investment funds |
78 | 22 | 8 | (68) | — | — | 40 | 14 | ||||||||||||||||||||||||
|
|
|
|
|
|
|
|
|
|
|
|
|
|
|
|
|
|||||||||||||||||
| Total Level 3 assets of consolidated variable interest entities |
$ | 1,860 | $ | 80 | $ | 490 | $ | (200) | $ | — | $ | — | $ | 2,230 | $ | (2) | ||||||||||||||||
|
|
|
|
|
|
|
|
|
|
|
|
|
|
|
|
|
|||||||||||||||||
| Liabilities of consolidated variable interest entities |
||||||||||||||||||||||||||||||||
| Borrowings |
$ | (1,194) | $ | (8) | $ | (319) | $ | 4 | $ | — | $ | — | $ | (1,517) | $ | — | ||||||||||||||||
|
|
|
|
|
|
|
|
|
|
|
|
|
|
|
|
|
|||||||||||||||||
| Total Level 3 liabilities of consolidated variable interest entities |
$ | (1,194) | $ | (8) | $ | (319) | $ | 4 | $ | — | $ | — | $ | (1,517) | $ | — | ||||||||||||||||
|
|
|
|
|
|
|
|
|
|
|
|
|
|
|
|
|
|||||||||||||||||
| 1 | Related to instruments held at end of year. |
There were no transfers between Level 1, Level 2, or Level 3 during the years ended December 31, 2015, and 2014.
Significant Unobservable Inputs – For certain Level 3 trading securities and investment funds, the valuations have significant unobservable inputs for comparable multiples and weighed average cost of capital rates applied in the valuation models. These inputs in isolation can cause significant increases or decreases in fair value. Specifically, the comparable multiples are multiplied by the underlying investment’s earnings before interest, tax, depreciation, and amortization to establish the total enterprise value of the underlying investments. We use a comparable multiple consistent with the implied trading multiple of public industry peers.
For other Level 3 trading securities, investment funds, loans held for investment, and borrowings, valuations are performed using a discounted cash flow model. For a discounted cash flow model, the significant input is the discount rate applied to present value the projected cash flows. An increase in the discount rate can significantly lower the fair value; a decrease in the discount rate can significantly increase the fair value. The discount rate is determined by considering the weighted average cost of capital calculation of companies in similar industries with comparable debt to equity ratios.
We apply a discount to the values reported by the investment funds for certain Level 3 trading securities and investment funds held within consolidated VIEs related to the lack of marketability of the underlying investment. As the degree of marketability increases, the related discount applied to the underlying investment is decreased. The weighted average of the discount rates applied to each individual investment was 34% and 35% as of December 31, 2015, and 2014, respectively.
F-54
Table of Contents
ATHENE HOLDING LTD.
Notes to Consolidated Financial Statements
Fair Value Option – The following represents the gains (losses) recorded for instruments within the consolidated VIEs for which we have elected the fair value option:
| Years ended December 31, | ||||||||||||
| (In millions) | 2015 | 2014 | 2013 | |||||||||
| Trading securities | ||||||||||||
| Fixed maturity securities |
$ | (5) | $ | (2) | $ | 7 | ||||||
| Equity securities |
(4) | 27 | 540 | |||||||||
| Loans held for investment |
— | 4 | — | |||||||||
| Investment funds |
12 | 20 | 53 | |||||||||
|
|
|
|
|
|
|
|||||||
| Total gains |
$ | 3 | $ | 49 | $ | 600 | ||||||
|
|
|
|
|
|
|
|||||||
For fair value option loans held for investment, we record interest income in net investment income within revenues of consolidated variable interest entities on the consolidated statements of income. Gains or losses from initial measurement, and subsequent changes in fair value, are recorded in investment related gains (losses) within revenues of consolidated variable interest entities on the consolidated statements of income. Gains and losses on borrowings are recorded in interest expense within operating expenses of consolidated variable interest entities on the consolidated statements of income.
Fair Value of Financial Instruments Not Held at Fair Value – Assets includes $18 million and $25 million of investment funds accounted for under the equity method and, therefore, not carried at fair value as of December 31, 2015, and 2014, respectively; however, the carrying amount approximates fair value. Liabilities includes $500 million of borrowings held at cost as of December 31, 2015, and 2014. The unpaid principal balance of borrowings approximates fair value.
Commitments and Contingencies – MidCap Holdings had unfunded commitments to extend credit to its borrowers of $525 million as of December 31, 2014. As of December 31, 2014, for $270 million of the unfunded commitments, there were no prerequisites for future funding by MidCap Holdings, and its borrowers were able to draw on these unfunded commitments at any time. For the remaining $255 million of the unfunded commitments as of December 31, 2014, MidCap Holdings’ obligations to fund these unfunded commitments were subject to its borrowers’ ability to meet certain requirements (i.e. provide collateral to secure the requested additional funding), as well as to comply with all provisions of the loan agreements.
Included in assets of CoInvest VI, one of our consolidated VIEs on the consolidated balance sheets as of December 31, 2015, are equity investments in publicly traded shares of Caesars Entertainment Corporation (CEC) and Caesars Acquisition Company (CAC), which are carried at their fair value of $25 million and $23 million, respectively. We received the CEC and CAC positions as part of the Contribution Agreement discussed in Note 19 – Related Parties, in order to provide a capital base to support the Aviva USA transaction. There are several pending actions against CEC and CAC and other defendants, related to certain restructuring activities and transactions involving Caesars Entertainment Operating Company, a subsidiary of CEC. The general partner of the VIE which holds the equity investments in CEC and CAC has reported that the outcome of the disputes cannot be ascertained but that it believes the resolution will not have a material effect on the VIE. It also reports that the disputes may have a material effect on the operating results of the VIE in future periods. Given the uncertainty associated with the litigation, we are uncertain as to whether our VIE’s equity investments in CEC or CAC could be negatively impacted in the event of an adverse outcome in the disputes.
F-55
Table of Contents
ATHENE HOLDING LTD.
Notes to Consolidated Financial Statements
Non-Consolidated VIEs—We invest in other entities meeting the definition of a VIE. We do not consolidate these investments because we do not meet the criteria of primary beneficiary as described below.
Fixed Maturity Securities – We invest in securitization entities as a debt holder or an investor in the residual interest of the securitization vehicle, which are included in fixed maturity securities on the consolidated balance sheets. These entities are deemed VIEs due to insufficient equity within the structure and lack of control by the equity investors over the activities that significantly impact the economics of the entity. In general, we are a debt investor within these entities and, as such, hold a variable interest; however, due to the debt holders’ lack of ability to control the decisions within the trust that significantly impact the entity, and the fact the debt holders are protected from losses due to the subordination by the equity tranche, the debt holders are not deemed the primary beneficiary. Securitization vehicles in which we hold the residual tranche are not consolidated because we do not unilaterally have substantive rights to remove the general partner, or when assessing related party interests, we are not under common control, as defined by ASU 2015-02, with the related party, nor are substantially all of the activities conducted on our behalf; therefore, we are not deemed the primary beneficiary. Debt investments and investments in the residual tranche of securitization entities are considered debt instruments under US GAAP and are held at fair value on the balance sheet and classified as AFS or trading.
Investment funds – Investment funds include non-fixed income, alternative investments in the form of limited partnerships or similar legal structures that meet the definition of VIEs.
A portion of these investment funds are sponsored and managed by unrelated parties in which we, as limited partner, do not have the power to direct the activities that most significantly impact the economic performance of the fund, nor do we unilaterally have substantive rights to remove the general partner or dissolve the entity without cause. As a result, we do not meet the power criterion to be considered the primary beneficiary and do not consolidate these VIEs in our financial statements.
We also have equity interests in investment funds where the general partner or investment manager is a related party. We have determined we are not under common control, as defined by ASU 2015-02, with the related party, nor are we deemed to be the primary beneficiary. As a result, investments in these VIEs are not consolidated.
We account for non-consolidated investment funds where we are able to exercise significant influence over the entity under the equity method or by electing the fair value option, in which NAV is used as a practical expedient for fair value.
The Company’s investments in investment funds are generally passive in nature as we do not take an active role in the investment fund’s management. Our risk of loss is limited and depends on the investment as follows: (1) investment funds accounted for under the equity method are limited to the Company’s initial investment plus unfunded commitments; (2) investment funds under the fair value option are limited to the fair value plus unfunded commitments; (3) available-for-sale securities and other investments are limited to amortized cost; and (4) trading securities are limited to carrying value.
F-56
Table of Contents
ATHENE HOLDING LTD.
Notes to Consolidated Financial Statements
The following summarizes the carrying value and maximum loss exposure of these non-consolidated VIEs:
| December 31, | ||||||||||||||||
| 2015 | 2014 | |||||||||||||||
| (In millions) | Carrying Value | Maximum Loss Exposure |
Carrying Value |
Maximum Loss Exposure |
||||||||||||
| Investment funds |
$ | 733 | $ | 878 | $ | 832 | $ | 928 | ||||||||
| Investment in related parties – investment funds |
997 | 1,454 | 585 | 1,067 | ||||||||||||
| Assets of consolidated variable interest entities, investment funds |
534 | 558 | 65 | 101 | ||||||||||||
| Investment in fixed maturity securities |
17,673 | 18,146 | 15,724 | 15,554 | ||||||||||||
| Investment in related parties – fixed maturity securities |
525 | 554 | 585 | 597 | ||||||||||||
|
|
|
|
|
|
|
|
|
|||||||||
| Total assets |
$ | 20,462 | $ | 21,590 | $ | 17,791 | $ | 18,247 | ||||||||
|
|
|
|
|
|
|
|
|
|||||||||
The following summarizes the Company’s investment funds, including related party investment funds and investment funds owned by consolidated VIEs:
| December 31, | ||||||||||||||||||||||||
| 2015 | 2014 | |||||||||||||||||||||||
| (In millions) | Carrying value |
Percent of total |
Weighted average life in years |
Carrying value |
Percent of total |
Weighted average life in years |
||||||||||||||||||
| Investment funds |
||||||||||||||||||||||||
| Private equity |
$ | 263 | 35.9% | 3 | $ | 205 | 24.6% | 3 | ||||||||||||||||
| Mortgage and real estate |
101 | 13.8% | 5 | 99 | 11.9% | 5 | ||||||||||||||||||
| Natural resources |
6 | 0.8% | 1 | 9 | 1.1% | 1 | ||||||||||||||||||
| Hedge funds |
86 | 11.7% | 4 | 239 | 28.7% | 4 | ||||||||||||||||||
| Credit funds |
277 | 37.8% | 2 | 280 | 33.7% | 2 | ||||||||||||||||||
|
|
|
|
|
|
|
|
|
|||||||||||||||||
| Total investment funds |
733 | 100.0% | 832 | 100.0% | ||||||||||||||||||||
|
|
|
|
|
|
|
|
|
|||||||||||||||||
| Investment funds – related parties |
||||||||||||||||||||||||
| Private equity – A-A Mortgage1 |
225 | 22.6% | 6 | 52 | 8.9% | 8 | ||||||||||||||||||
| Private equity – other |
36 | 3.6% | 7 | 29 | 4.9% | 8 | ||||||||||||||||||
| Mortgage and real estate |
234 | 23.5% | 4 | 163 | 27.9% | 5 | ||||||||||||||||||
| Natural resources |
46 | 4.6% | 6 | 45 | 7.7% | 6 | ||||||||||||||||||
| Hedge funds |
256 | 25.6% | 6 | 186 | 31.8% | 6 | ||||||||||||||||||
| Credit funds |
200 | 20.1% | 5 | 110 | 18.8% | 5 | ||||||||||||||||||
|
|
|
|
|
|
|
|
|
|||||||||||||||||
| Total investment funds – related parties |
997 | 100.0% | 585 | 100.0% | ||||||||||||||||||||
|
|
|
|
|
|
|
|
|
|||||||||||||||||
| Investment funds – assets of consolidated variable interest entities |
||||||||||||||||||||||||
| Private equity – MidCap FinCo2 |
482 | 90.3% | N/A | — | —% | 0 | ||||||||||||||||||
| Credit funds |
34 | 6.3% | 4 | 40 | 61.5% | 5 | ||||||||||||||||||
| Mortgage and real assets |
18 | 3.4% | 4 | 25 | 38.5% | 5 | ||||||||||||||||||
|
|
|
|
|
|
|
|
|
|||||||||||||||||
| Total investment funds – assets of consolidated variable interest entities |
534 | 100.0% | 65 | 100.0% | ||||||||||||||||||||
|
|
|
|
|
|
|
|
|
|||||||||||||||||
| Total investment funds including related parties and assets of consolidated variable interest entities |
$ | 2,264 | $ | 1,482 | ||||||||||||||||||||
|
|
|
|
|
|||||||||||||||||||||
| 1 | A-A Mortgage Opportunities, LP (A-A Mortgage) is a platform to originate residential mortgage loans and mortgage servicing rights. |
| 2 | Our total investment in MidCap FinCo, including amounts advanced under the credit facilities, totaled $782 million at December 31, 2015, which is greater than 10% of total AHL shareholders’ equity. |
F-57
Table of Contents
ATHENE HOLDING LTD.
Notes to Consolidated Financial Statements
Summarized Financial Information of Investment Funds—The following is the aggregated summarized financial information of equity method investees, including those where we elected the fair value option, and may be presented on a lag due to the availability of financial information from the investee:
| December 31, | ||||||||
| (In millions) | 2015 | 2014 | ||||||
| Assets |
$ | 51,649 | $ | 97,961 | ||||
| Liabilities |
6,990 | 22,298 | ||||||
| Equity |
44,659 | 75,663 | ||||||
| Years ended December 31, | ||||||||||||
| (In millions) | 2015 | 2014 | 2013 | |||||||||
| Net income |
$ | 5,945 | $ | 8,418 | $ | 11,962 | ||||||
The following table presents the carrying value by ownership percentage of equity method investment funds, including related party investment funds and consolidated VIE investment funds:
| December 31, | ||||||||
| (In millions) | 2015 | 2014 | ||||||
| Ownership Percentage |
||||||||
| 100% |
$ | 49 | $ | 50 | ||||
| 50% – 99% |
322 | 108 | ||||||
| Greater than 3% – 49% |
1,225 | 1,070 | ||||||
|
|
|
|
|
|||||
| Equity method investment funds |
$ | 1,596 | $ | 1,228 | ||||
|
|
|
|
|
|||||
The following table presents the carrying value by ownership percentage of investment funds where we elected the fair value option, including related party investment funds and investment funds owned by consolidated VIEs:
| December 31, | ||||||||
| (In millions) | 2015 | 2014 | ||||||
| Ownership Percentage |
||||||||
| Greater than 3% – 49% |
$ | 516 | $ | 40 | ||||
| 3% or less |
152 | 214 | ||||||
|
|
|
|
|
|||||
| Fair value option investment funds |
$ | 668 | $ | 254 | ||||
|
|
|
|
|
|||||
F-58
Table of Contents
ATHENE HOLDING LTD.
Notes to Consolidated Financial Statements
7. Fair Value
Fair value is the price we would receive to sell an asset or pay to transfer a liability (exit price) in an orderly transaction between market participants. We determine fair value based on the following fair value hierarchy:
Level 1 – Unadjusted quoted prices for identical assets or liabilities in an active market.
Level 2 – Quoted prices for inactive markets or valuation techniques that require observable direct or indirect inputs for substantially the full term of the asset or liability. Level 2 inputs include the following:
| • | Quoted prices for similar assets or liabilities in active markets, |
| • | Observable inputs other than quoted market prices, and |
| • | Observable inputs derived principally from market data through correlation or other means. |
Level 3 – Prices or valuation techniques with unobservable inputs significant to the overall fair value estimate. These valuations use critical assumptions not readily available to market participants. Level 3 valuations are based on market standard valuation methodologies, including discounted cash flows, matrix pricing, or other similar techniques.
The fair value hierarchy gives the highest priority to quoted prices in active markets for identical assets or liabilities (Level 1) and the lowest priority to unobservable inputs (Level 3). If the inputs used to measure fair value fall within different levels of the hierarchy, the category level is based on the lowest priority level input that is significant to the instrument’s fair value measurement.
We use a number of valuation sources to determine fair values. Valuation sources can include quoted market prices; third-party commercial pricing services; third-party brokers; industry-standard, vendor modeling software that uses market observable inputs; and other internal modeling techniques based on projected cash flows. We periodically review the assumptions and inputs of third-party commercial pricing services through internal valuation price variance reviews, comparisons to internal pricing models, back testing to recent trades, or monitoring trading volumes.
F-59
Table of Contents
ATHENE HOLDING LTD.
Notes to Consolidated Financial Statements
The following represents the Company’s hierarchy for its assets and liabilities measured at fair value on a recurring basis:
| December 31, 2015 | ||||||||||||||||
| (In millions) | Total | Level 1 | Level 2 | Level 3 | ||||||||||||
| Assets |
||||||||||||||||
| AFS securities |
||||||||||||||||
| Fixed maturity securities |
||||||||||||||||
| U.S. government and agencies |
$ | 45 | $ | 41 | $ | 4 | $ | — | ||||||||
| U.S. state, municipals, and political subdivisions |
1,165 | — | 1,165 | — | ||||||||||||
| Foreign governments |
2,464 | — | 2,447 | 17 | ||||||||||||
| Corporate |
26,936 | — | 26,300 | 636 | ||||||||||||
| CLO |
4,555 | — | 4,038 | 517 | ||||||||||||
| ABS |
2,918 | — | 1,105 | 1,813 | ||||||||||||
| CMBS |
1,738 | — | 1,671 | 67 | ||||||||||||
| RMBS |
7,995 | — | 7,237 | 758 | ||||||||||||
|
|
|
|
|
|
|
|
|
|
|
|
| |||||
| Total fixed maturity securities |
47,816 | 41 | 43,967 | 3,808 | ||||||||||||
| Equity securities |
407 | 82 | 316 | 9 | ||||||||||||
|
|
|
|
|
|
|
|
|
|
|
|
| |||||
| Total AFS securities |
48,223 | 123 | 44,283 | 3,817 | ||||||||||||
|
|
|
|
|
|
|
|
|
|
|
|
| |||||
| Trading securities |
||||||||||||||||
| Fixed maturity securities |
||||||||||||||||
| U.S. government and agencies |
1 | 1 | — | — | ||||||||||||
| U.S. state, municipals, and political subdivisions |
133 | — | 116 | 17 | ||||||||||||
| Corporate |
1,450 | — | 1,434 | 16 | ||||||||||||
| CLO |
108 | — | — | 108 | ||||||||||||
| ABS |
98 | — | — | 98 | ||||||||||||
| CMBS |
99 | — | 99 | — | ||||||||||||
| RMBS |
161 | — | 132 | 29 | ||||||||||||
|
|
|
|
|
|
|
|
|
|
|
|
| |||||
| Total fixed maturity securities |
2,050 | 1 | 1,781 | 268 | ||||||||||||
| Equity securities |
418 | — | 418 | — | ||||||||||||
|
|
|
|
|
|
|
|
|
|
|
|
| |||||
| Total trading securities |
2,468 | 1 | 2,199 | 268 | ||||||||||||
|
|
|
|
|
|
|
|
|
|
|
|
| |||||
| Mortgage loans |
48 | — | — | 48 | ||||||||||||
| Investment funds |
152 | — | — | 152 | ||||||||||||
| Funds withheld at interest – embedded derivative |
36 | — | — | 36 | ||||||||||||
| Derivative assets |
871 | 9 | 862 | — | ||||||||||||
| Short-term investments |
135 | 4 | 131 | — | ||||||||||||
| Cash and cash equivalents |
2,714 | 2,714 | — | — | ||||||||||||
| Restricted cash |
116 | 116 | — | — | ||||||||||||
| Investments in related parties |
||||||||||||||||
| AFS, fixed maturity securities |
||||||||||||||||
| CLO |
248 | — | 241 | 7 | ||||||||||||
| ABS |
60 | — | — | 60 | ||||||||||||
|
|
|
|
|
|
|
|
|
|
|
|
| |||||
| Total fixed maturity securities – related party |
308 | — | 241 | 67 | ||||||||||||
| Trading securities, CLO |
217 | — | 26 | 191 | ||||||||||||
| Reinsurance recoverable |
2,377 | — | — | 2,377 | ||||||||||||
|
|
|
|
|
|
|
|
|
|
|
|
| |||||
| Total assets measured at fair value |
$ | 57,665 | $ | 2,967 | $ | 47,742 | $ | 6,956 | ||||||||
|
|
|
|
|
|
|
|
|
|
|
|
| |||||
(Continued)
F-60
Table of Contents
ATHENE HOLDING LTD.
Notes to Consolidated Financial Statements
| December 31, 2015 | ||||||||||||||||
| (In millions) | Total | Level 1 | Level 2 | Level 3 | ||||||||||||
| Liabilities |
||||||||||||||||
| Interest sensitive contract liabilities |
||||||||||||||||
| Embedded derivative |
$ | 4,477 | $ | — | $ | — | $ | 4,477 | ||||||||
| Universal life benefits |
1,464 | — | — | 1,464 | ||||||||||||
| Unit-linked contracts |
418 | — | 418 | — | ||||||||||||
| Future policy benefits |
||||||||||||||||
| AmerUs Closed Block |
1,581 | — | — | 1,581 | ||||||||||||
| ILICO Closed Block and life benefits |
897 | — | — | 897 | ||||||||||||
| Derivative liabilities |
17 | 1 | 9 | 7 | ||||||||||||
| Funds withheld liability – embedded derivative |
35 | — | 35 | — | ||||||||||||
|
|
|
|
|
|
|
|
|
|
|
|
| |||||
| Total liabilities measured at fair value |
$ | 8,889 | $ | 1 | $ | 462 | $ | 8,426 | ||||||||
|
|
|
|
|
|
|
|
|
|
|
|
| |||||
(Concluded)
The following represents the Company’s hierarchy for its assets and liabilities measured at fair value on a recurring basis:
| December 31, 2014 | ||||||||||||||||
| (In millions) | Total | Level 1 | Level 2 | Level 3 | ||||||||||||
| Assets |
||||||||||||||||
| AFS securities |
||||||||||||||||
| Fixed maturity securities |
||||||||||||||||
| U.S. government and agencies |
$ | 71 | $ | 61 | $ | 10 | $ | — | ||||||||
| U.S. state, municipals, and political subdivisions |
1,471 | — | 1,419 | 52 | ||||||||||||
| Corporate |
27,722 | — | 27,514 | 208 | ||||||||||||
| CLO |
3,620 | — | 3,438 | 182 | ||||||||||||
| ABS |
2,666 | — | 1,742 | 924 | ||||||||||||
| CMBS |
2,930 | — | 2,861 | 69 | ||||||||||||
| RMBS |
6,223 | — | 5,569 | 654 | ||||||||||||
|
|
|
|
|
|
|
|
|
|
|
|
| |||||
| Total fixed maturity securities |
44,703 | 61 | 42,553 | 2,089 | ||||||||||||
| Equity securities |
190 | 76 | 114 | — | ||||||||||||
|
|
|
|
|
|
|
|
|
|
|
|
| |||||
| Total AFS securities |
44,893 | 137 | 42,667 | 2,089 | ||||||||||||
|
|
|
|
|
|
|
|
|
|
|
|
| |||||
| Trading securities |
||||||||||||||||
| Fixed maturity securities |
||||||||||||||||
| U.S. government and agencies |
3 | 3 | — | — | ||||||||||||
| U.S. state, municipals, and political subdivisions |
276 | — | 276 | — | ||||||||||||
| Corporate |
2,230 | — | 2,230 | — | ||||||||||||
| CLO |
146 | — | — | 146 | ||||||||||||
| CMBS |
116 | — | 116 | — | ||||||||||||
| RMBS |
22 | — | 22 | — | ||||||||||||
|
|
|
|
|
|
|
|
|
|
|
|
| |||||
| Total fixed maturity securities |
2,793 | 3 | 2,644 | 146 | ||||||||||||
| Equity securities |
2 | 2 | — | — | ||||||||||||
|
|
|
|
|
|
|
|
|
|
|
|
| |||||
| Total trading securities |
2,795 | 5 | 2,644 | 146 | ||||||||||||
|
|
|
|
|
|
|
|
|
|
|
|
| |||||
(Continued)
F-61
Table of Contents
ATHENE HOLDING LTD.
Notes to Consolidated Financial Statements
| December 31, 2014 | ||||||||||||||||
| (In millions) | Total | Level 1 | Level 2 | Level 3 | ||||||||||||
| Mortgage loans |
73 | — | — | 73 | ||||||||||||
| Investment funds |
214 | — | — | 214 | ||||||||||||
| Funds withheld at interest – embedded derivative |
127 | — | — | 127 | ||||||||||||
| Derivative assets |
1,842 | 15 | 1,827 | — | ||||||||||||
| Short-term investments |
17 | — | 17 | — | ||||||||||||
| Cash and cash equivalents |
2,628 | 2,628 | — | — | ||||||||||||
| Restricted cash |
77 | 77 | — | — | ||||||||||||
| Investments in related parties |
||||||||||||||||
| AFS, fixed maturity securities |
||||||||||||||||
| CLO |
260 | — | 245 | 15 | ||||||||||||
| ABS |
66 | — | — | 66 | ||||||||||||
|
|
|
|
|
|
|
|
|
|||||||||
| Total fixed maturity securities – related party |
326 | — | 245 | 81 | ||||||||||||
| Trading securities, CLO |
268 | — | — | 268 | ||||||||||||
| Reinsurance recoverable |
2,460 | — | — | 2,460 | ||||||||||||
|
|
|
|
|
|
|
|
|
|||||||||
| Total assets measured at fair value |
$ | 55,720 | $ | 2,862 | $ | 47,400 | $ | 5,458 | ||||||||
|
|
|
|
|
|
|
|
|
|||||||||
| Liabilities |
||||||||||||||||
| Interest sensitive contract liabilities |
||||||||||||||||
| Embedded derivative |
$ | 4,437 | $ | — | $ | — | $ | 4,437 | ||||||||
| Universal life benefits |
1,417 | — | — | 1,417 | ||||||||||||
| Future policy benefits |
||||||||||||||||
| AmerUs Closed Block |
1,715 | — | — | 1,715 | ||||||||||||
| ILICO Closed Block and life benefits |
1,026 | — | — | 1,026 | ||||||||||||
| Derivative liabilities |
143 | — | 135 | 8 | ||||||||||||
| Funds withheld liability – embedded derivative |
394 | — | 394 | — | ||||||||||||
|
|
|
|
|
|
|
|
|
|||||||||
| Total liabilities measured at fair value |
$ | 9,132 | $ | — | $ | 529 | $ | 8,603 | ||||||||
|
|
|
|
|
|
|
|
|
|||||||||
(Concluded)
Refer to Note 6 – Variable Interest Entities for fair value disclosures associated with consolidated VIEs.
Fair Value Valuation Methods—We used the following valuation methods and assumptions to estimate fair value:
AFS and trading securities
Fixed maturity – We obtain the fair value for most marketable bonds without an active market from several commercial pricing services. These are classified as Level 2 assets. The pricing services incorporate a variety of market observable information in their valuation techniques, including benchmark yields, broker-dealer quotes, credit quality, issuer spreads, bids, offers, and other reference data. This category typically includes U.S. and non-U.S. corporate bonds, U.S. agency and government guaranteed securities, ABS, CMBS, and RMBS.
We value privately placed fixed maturity securities based on the credit quality and duration of comparable marketable securities, which may be securities of another issuer with similar characteristics. In some instances, we use a matrix-based pricing model. These models consider the current level of risk-free interest rates, corporate
F-62
Table of Contents
ATHENE HOLDING LTD.
Notes to Consolidated Financial Statements
spreads, credit quality of the issuer, and cash flow characteristics of the security. We also consider additional factors such as net worth of the borrower, value of collateral, capital structure of the borrower, presence of guarantees, and our evaluation of the borrower’s ability to compete in its relevant market. Privately placed fixed maturity securities are classified as Level 2 or 3.
Equity securities – Fair values of publicly traded equity securities are based on quoted market prices and classified as Level 1. Other equity securities, typically private equities or equity securities not traded on an exchange, we value based on other sources, such as analytics or brokers and are classified as Level 2 or 3.
Mortgage loans – Mortgage loans for which we have elected the fair value option or those held for sale are carried at fair value. We estimate fair value on a monthly basis using discounted cash flow analysis and rates being offered for similar loans to borrowers with similar credit ratings. Loans with similar characteristics are aggregated for purposes of the calculations. The discounted cash flow model uses unobservable inputs, including estimates of discount rates and loan prepayments. Mortgage loans are classified as Level 3.
Investment funds – Investment funds are valued based on NAV information provided by the general partner or related asset manager. These partnership interests usually include multiple underlying investments for which either observable market prices or other valuation methods are used to determine the fair value. These investments are classified as Level 3 due to the limited market activity and price transparency inherent in the market for such investments.
Funds withheld (embedded derivative) – We estimate the fair value of the embedded derivative based on the change in the fair value of the assets supporting the funds withheld payable under the combined coinsurance, modco and coinsurance funds withheld reinsurance agreements. As a result, the fair value of the embedded derivative is classified as Level 2 or 3 based on the valuation methods used for the assets held in trust supporting the reinsurance agreements.
Derivatives – Derivative contracts can be exchange traded or over-the-counter. Exchange-traded derivatives typically fall within Level 1 of the fair value hierarchy depending on trading activity. Over-the-counter derivatives are valued using valuation models or an income approach using third-party broker valuations. Valuation models require a variety of inputs, including contractual terms, market prices, yield curves, credit curves, measures of volatility, prepayment rates, and correlation of the inputs. We consider and incorporate counterparty credit risk in the valuation process through counterparty credit rating requirements and monitoring of overall exposure. We also evaluate and include our own nonperformance risk in valuing derivatives. The majority of our derivatives trade in liquid markets; therefore, we can verify model inputs and model selection does not involve significant management judgment. These are typically classified within Level 2 of the fair value hierarchy.
Cash and cash equivalents – The carrying amount for cash equals fair value. We estimate the fair value for cash equivalents based on quoted market prices. These assets are classified as Level 1.
Interest sensitive contract liabilities (embedded derivative) – Embedded derivatives related to interest sensitive contract liabilities with fixed indexed annuity products are classified as Level 3. The valuations include significant unobservable inputs associated with actuarial assumptions for policyholder behavior.
Unit-linked contracts – Unit-linked contracts are valued based on the fair value of the investments supporting the contract. The underlying investments are trading securities comprised primarily of mutual funds. The valuations of these are based on quoted market prices for similar assets and are classified in Level 2, resulting in a corresponding classification for the unit-linked contracts.
AmerUs Closed Block – We elected the fair value option for the future policy benefits liability in the AmerUs Closed Block, as discussed in Note 11 – Closed Block. Our valuation technique is to set the fair value of policyholder liabilities equal to the fair value of assets. There is an additional component which captures the fair value of the open block’s cost to hold capital in excess of existing liabilities on the closed block. This component
F-63
Table of Contents
ATHENE HOLDING LTD.
Notes to Consolidated Financial Statements
uses a present value of future cash flows, which includes investment earnings and policyholder liability movements. Unobservable inputs include estimates for these items. The target surplus as a percentage of statutory reserves is 3.89% based on the statutory risk-based capital ratio applicable to this block of business. The AmerUs Closed Block policyholder liabilities and any corresponding reinsurance recoverable are classified as Level 3.
ILICO Closed Block – We elected the fair value option for the ILICO Closed Block, as discussed in Note 9 –Reinsurance. Our valuation technique is to set the fair value of policyholder liabilities equal to the fair value of assets. There is an additional component which captures the fair value of the open block’s obligations to the closed block business. This component uses the present value of future cash flows. The cash flows include commissions, administrative expenses, reinsurance premiums and benefits, and an explicit cost of capital. Unobservable inputs include estimates for these items. The explicit cost of capital assumption is 9% of required capital, post tax. A margin of 6.11% is included in the discount rates to reflect the business risk. An additional 0.31% is included to reflect non-performance risk. The ILICO Closed Block policyholder liabilities and corresponding reinsurance recoverable are classified as Level 3.
Universal life liabilities and other life benefits – We elected the fair value option for certain blocks of universal and other life business ceded to Global Atlantic, as discussed in Note 9 – Reinsurance. We use a present value of liability cash flows. Unobservable inputs include estimates of mortality, persistency, expenses, premium payments, and a risk margin used in the discount rates that reflects the riskiness of the business. The risk margin was 0.09%. These universal life policyholder liabilities and corresponding reinsurance recoverable are classified as Level 3.
Fair Value Option—The following represents the gains or losses recorded for instruments we have elected the fair value option:
| Years ended December 31, | ||||||||||||
| (In millions) | 2015 | 2014 | 2013 | |||||||||
| Trading securities |
$ | (313) | $ | 254 | $ | 25 | ||||||
| Mortgage loans |
— | 5 | (3) | |||||||||
| Investment funds |
(8) | 31 | 41 | |||||||||
| Future policy benefits |
134 | (102) | 8 | |||||||||
|
|
|
|
|
|
|
|||||||
| Total gains (losses) |
$ | (187) | $ | 188 | $ | 71 | ||||||
|
|
|
|
|
|
|
|||||||
For fair value option mortgage loans, we record interest income, gains or losses from initial measurement, and subsequent changes in fair value in net investment income on the consolidated statements of income. Investment funds and related parties investment funds gains and losses are recorded in net investment income on the consolidated statements of income. We record the change in fair value of future policy benefits to future policy and other policy benefits on the consolidated statements of income.
The following summarizes information for fair value option mortgage loans:
| December 31, | ||||||||
| (In millions) | 2015 | 2014 | ||||||
| Unpaid principal balance |
$ | 46 | $ | 68 | ||||
| Mark to fair value |
2 | 5 | ||||||
|
|
|
|
|
|||||
| Fair value |
$ | 48 | $ | 73 | ||||
|
|
|
|
|
|||||
There were no fair value option mortgage loans 90 days or more past due as of December 31, 2015, and 2014.
F-64
Table of Contents
ATHENE HOLDING LTD.
Notes to Consolidated Financial Statements
Transfers Between Levels—Transfers into Level 3 represent securities that were valued using pricing sources which, due to changing market conditions, were less observable than in prior periods as indicated by the lack of commercially available vendor prices with observable inputs. Additionally, changes in pricing sources also led to securities transferring into Level 3.
Transfers out of Level 3 represent securities that were valued using pricing sources which, due to changing market conditions, were more observable than in prior periods as indicated by commercially available vendor prices with observable inputs. Additionally, changes in pricing sources also led to securities transferring into Level 2.
Transfers into or out of any level are assumed to occur at the end of the period. For the years ended December 31, 2015, and 2014, there were no transfers between Level 1 and Level 2.
F-65
Table of Contents
ATHENE HOLDING LTD.
Notes to Consolidated Financial Statements
Level 3 Financial Instruments—The following is a reconciliation for all Level 3 assets and liabilities measured at fair value on a recurring basis:
| Year ended December 31, 2015 | ||||||||||||||||||||||||||||||||||||||||
| Total realized and unrealized gains (losses) |
Transfers | |||||||||||||||||||||||||||||||||||||||
| (In millions) | Beginning Balance |
Included in income |
Included in OCI |
Purchases | Sales | In | (Out) | Other | Ending Balance |
Total gains (losses) included in earnings1 |
||||||||||||||||||||||||||||||
| Assets |
||||||||||||||||||||||||||||||||||||||||
| AFS securities |
||||||||||||||||||||||||||||||||||||||||
| Fixed maturity |
||||||||||||||||||||||||||||||||||||||||
| U.S. state, municipal, and political subdivisions |
$ | 52 | $ | (1) | $ | 1 | $ | — | $ | (35) | $ | — | $ | — | $ | (17) | $ | — | $ |
— |
| |||||||||||||||||||
| Foreign governments |
— | — | — | — | — | — | — | 17 | 17 | — | ||||||||||||||||||||||||||||||
| Corporate |
208 | (1) | (13) | 311 | (81) | 225 | (13) | — | 636 | — | ||||||||||||||||||||||||||||||
| CLO |
182 | 3 | (9) | 112 | — | 337 | (108) | — | 517 | — | ||||||||||||||||||||||||||||||
| ABS |
924 | 18 | (35) | 367 | (146) | 703 | (18) | — | 1,813 | — | ||||||||||||||||||||||||||||||
| CMBS |
69 | 1 | (2) | 25 | (2) | 23 | (47) | — | 67 | — | ||||||||||||||||||||||||||||||
| RMBS |
654 | 11 | (15) | 91 | (138) | 155 | — | — | 758 | — | ||||||||||||||||||||||||||||||
| Equity securities |
— | — | — | 10 | — | — | — | (1) | 9 | — | ||||||||||||||||||||||||||||||
| Trading securities |
||||||||||||||||||||||||||||||||||||||||
| Fixed maturity |
||||||||||||||||||||||||||||||||||||||||
| U.S. state, municipal, and political subdivisions |
— | — | — | — | — | 17 | — | — | 17 | — | ||||||||||||||||||||||||||||||
| Corporate |
— | — | — | — | — | 16 | — | — | 16 | — | ||||||||||||||||||||||||||||||
| CLO |
146 | (16) | — | 26 | (48) | — | — | — | 108 | (15) | ||||||||||||||||||||||||||||||
| ABS |
— | (2) | — | 100 | — | — | — | — | 98 | (1) | ||||||||||||||||||||||||||||||
| RMBS |
— | (1) | — | 30 | — | — | — | — | 29 | — | ||||||||||||||||||||||||||||||
| Mortgage loans |
73 | (3) | — | — | (4) | — | — | (18) | 48 | (3) | ||||||||||||||||||||||||||||||
| Investment funds |
214 | (20) | — | 20 | (34) | — | — | (28) | 152 | 8 | ||||||||||||||||||||||||||||||
| Funds withheld at interest—embedded derivative |
127 | (91) | — | — | — | — | — | — | 36 | — | ||||||||||||||||||||||||||||||
| Investments in related parties |
||||||||||||||||||||||||||||||||||||||||
| AFS securities |
||||||||||||||||||||||||||||||||||||||||
| Fixed maturity |
||||||||||||||||||||||||||||||||||||||||
| CLO |
15 | (1) | (2) | 9 | (8) | — | (6) | — | 7 | — | ||||||||||||||||||||||||||||||
| ABS |
66 | — | (1) | — | (5) | — | — | — | 60 | — | ||||||||||||||||||||||||||||||
| Trading securities, CLO |
268 | (29) | — | 51 | (73) | — | (26) | — | 191 | (17) | ||||||||||||||||||||||||||||||
| Reinsurance recoverable |
2,460 | (83) | — | — | — | — | — | — | 2,377 | — | ||||||||||||||||||||||||||||||
|
|
|
|
|
|
|
|
|
|
|
|
|
|
|
|
|
|
|
|
|
|||||||||||||||||||||
| Total Level 3 assets |
$ | 5,458 | $ | (215) | $ | (76) | $ | 1,152 | $ | (574) | $ | 1,476 | $ | (218) | $ | (47) | $ | 6,956 | $ | (28) | ||||||||||||||||||||
|
|
|
|
|
|
|
|
|
|
|
|
|
|
|
|
|
|
|
|
|
|||||||||||||||||||||
(Continued)
F-66
Table of Contents
ATHENE HOLDING LTD.
Notes to Consolidated Financial Statements
| Year ended December 31, 2015 | ||||||||||||||||||||||||||||||||||||||||
| Total realized and unrealized gains (losses) |
Transfers | |||||||||||||||||||||||||||||||||||||||
| (In millions) | Beginning Balance |
Included in income |
Included in OCI |
Purchases | Sales | In | (Out) | Other | Ending Balance |
Total gains (losses) included in earnings1 |
||||||||||||||||||||||||||||||
| Liabilities |
||||||||||||||||||||||||||||||||||||||||
| Interest sensitive contract liabilities |
||||||||||||||||||||||||||||||||||||||||
| Embedded derivative2 |
$ | (4,437) | $ | 158 | $ | — | $ | — | $ | — | $ | — | $ | — | $ | (198) | $ | (4,477) | $ | — | ||||||||||||||||||||
| Universal life liabilities |
(1,417) | (47) | — | — | — | — | — | — | (1,464) | — | ||||||||||||||||||||||||||||||
| Future policy benefits |
||||||||||||||||||||||||||||||||||||||||
| AmerUs Closed Block |
(1,715) | 134 | — | — | — | — | — | — | (1,581) | — | ||||||||||||||||||||||||||||||
| ILICO Closed Block and life benefits |
(1,026) | 129 | — | — | — | — | — | — | (897) | — | ||||||||||||||||||||||||||||||
| Derivative liabilities |
||||||||||||||||||||||||||||||||||||||||
| Total return swap |
(1) | 1 | — | — | — | — | — | — | — | — | ||||||||||||||||||||||||||||||
| Credit default swap |
(7) | — | — | — | — | — | — | — | (7) | — | ||||||||||||||||||||||||||||||
|
|
|
|
|
|
|
|
|
|
|
|
|
|
|
|
|
|
|
|
|
|||||||||||||||||||||
| Total Level 3 liabilities |
$ | (8,603) | $ | 375 | $ | — | $ | — | $ | — | $ | — | $ | — | $ | (198) | $ | (8,426) | $ | — | ||||||||||||||||||||
|
|
|
|
|
|
|
|
|
|
|
|
|
|
|
|
|
|
|
|
|
|||||||||||||||||||||
| 1 | Related to instruments held at end of year. |
| 2 | Other activity represents the change in fair value due to issuances of $341 million, offset by settlements of $143 million. |
(Concluded)
F-67
Table of Contents
ATHENE HOLDING LTD.
Notes to Consolidated Financial Statements
The following is a reconciliation for all Level 3 assets and liabilities measured at fair value on a recurring basis:
| Year ended December 31, 2014 | ||||||||||||||||||||||||||||||||||||||||
| Total realized and unrealized gains (losses) |
Transfers | |||||||||||||||||||||||||||||||||||||||
| (In millions) | Beginning balance |
Included in income |
Included in OCI |
Purchases | Sales | In | Out | Other | Ending balance |
Total gains (losses) included in earnings1 |
||||||||||||||||||||||||||||||
| Assets |
||||||||||||||||||||||||||||||||||||||||
| AFS securities |
||||||||||||||||||||||||||||||||||||||||
| Fixed maturity |
||||||||||||||||||||||||||||||||||||||||
| U.S. state, municipal, and political subdivisions |
$ | — | $ | — | $ | (3) | $ | 55 | $ | — | $ | — | $ | — | $ | — | $ | 52 | $ | — | ||||||||||||||||||||
| Corporate |
352 | 1 | (5) | 105 | (128) | 72 | (114) | (75) | 208 | — | ||||||||||||||||||||||||||||||
| CLO |
34 | — | (1) | 111 | — | 38 | — | — | 182 | — | ||||||||||||||||||||||||||||||
| ABS |
33 | — | 1 | 322 | (16) | 518 | (9) | 75 | 924 | — | ||||||||||||||||||||||||||||||
| CMBS |
— | — | — | 17 | — | 52 | — | — | 69 | — | ||||||||||||||||||||||||||||||
| RMBS |
516 | — | 8 | 586 | (187) | — | (269) | — | 654 | — | ||||||||||||||||||||||||||||||
| Trading securities, CLO |
117 | 5 | — | 87 | (53) | — | — | (10) | 146 | 14 | ||||||||||||||||||||||||||||||
| Mortgage loans |
70 | 3 | — | — | — | — | — | — | 73 | 5 | ||||||||||||||||||||||||||||||
| Investment funds |
511 | 17 | — | 9 | (196) | — | — | (127 | ) | 214 | 27 | |||||||||||||||||||||||||||||
| Funds withheld at interest—embedded derivative |
138 | (11 | ) | — | — | — | — | — | — | 127 | — | |||||||||||||||||||||||||||||
| Investments in related parties |
||||||||||||||||||||||||||||||||||||||||
| AFS securities |
||||||||||||||||||||||||||||||||||||||||
| Fixed maturity |
||||||||||||||||||||||||||||||||||||||||
| CLO |
12 | — | (1) | — | (3) | 14 | (7) | — | 15 | — | ||||||||||||||||||||||||||||||
| ABS |
— | — | — | 68 | (2) | — | — | — | 66 | — | ||||||||||||||||||||||||||||||
| Trading securities, CLO |
171 | (13) | — | 357 | (247) | — | — | — | 268 | 14 | ||||||||||||||||||||||||||||||
| Investment funds |
18 | 1 | — | — | (17) | — | — | (2) | — | 102 | ||||||||||||||||||||||||||||||
| Reinsurance recoverable |
1,718 | 742 | — | — | — | — | — | — | 2,460 | — | ||||||||||||||||||||||||||||||
|
|
|
|
|
|
|
|
|
|
|
|
|
|
|
|
|
|
|
|
|
|||||||||||||||||||||
| Total Level 3 assets |
$ | 3,690 | $ | 745 | $ | (1) | $ | 1,717 | $ | (849) | $ | 694 | $ | (399) | $ | (139) | $ | 5,458 | $ | 162 | ||||||||||||||||||||
|
|
|
|
|
|
|
|
|
|
|
|
|
|
|
|
|
|
|
|
|
|||||||||||||||||||||
| Liabilities |
||||||||||||||||||||||||||||||||||||||||
| Interest sensitive contract liabilities |
||||||||||||||||||||||||||||||||||||||||
| Embedded derivative2 |
$ | (3,240) | $ | (976) | $ | — | $ | — | $ | — | $ | — | $ | — | $ | (221) | $ | (4,437) | $ | — | ||||||||||||||||||||
| Universal life liabilities |
(813) | (604) | — | — | — | — | — | — | (1,417) | — | ||||||||||||||||||||||||||||||
| Future policy benefits |
||||||||||||||||||||||||||||||||||||||||
| AmerUs Closed Block |
(1,613) | (102) | — | — | — | — | — | — | (1,715) | — | ||||||||||||||||||||||||||||||
| ILICO Closed Block and life benefits |
(889) | (137) | — | — | — | — | — | — | (1,026) | — | ||||||||||||||||||||||||||||||
| Derivative liabilities |
||||||||||||||||||||||||||||||||||||||||
| Total return swap |
(11) | 1 | — | — | 9 | — | — | — | (1) | (1) | ||||||||||||||||||||||||||||||
| Credit default swap |
(8) | 1 | — | — | — | — | — | — | (7) | (1) | ||||||||||||||||||||||||||||||
| Equity swap |
(131) | — | — | — | 131 | — | — | — | — | — | ||||||||||||||||||||||||||||||
|
|
|
|
|
|
|
|
|
|
|
|
|
|
|
|
|
|
|
|
|
|||||||||||||||||||||
| Total Level 3 liabilities |
$ | (6,705) | $ | (1,817) | $ | — | $ | — | $ | 140 | $ | — | $ | — | $ | (221) | $ | (8,603) | $ | (2) | ||||||||||||||||||||
|
|
|
|
|
|
|
|
|
|
|
|
|
|
|
|
|
|
|
|
|
|||||||||||||||||||||
| 1 | Related to instruments held at end of year. |
| 2 | Other activity represents the change in fair value due to issuances of $325 million, offset by settlements of $104 million. |
F-68
Table of Contents
ATHENE HOLDING LTD.
Notes to Consolidated Financial Statements
Significant Unobservable Inputs—Significant unobservable inputs occur when we could not obtain or corroborate the quantitative detail of the inputs. This applies to AFS fixed maturity securities, mortgage loans, total return swaps, and credit default swaps. Additional significant unobservable inputs are described below.
Fixed maturity securities – For certain fixed maturity securities, internal models are used to calculate the fair value. A discounted cash flow approach is utilized. The discount rate is the significant unobservable input due to the determined credit spread being internally developed, illiquid, or other adjustments made to the base rate. The base rate represents a market comparable rate for securities with similar characteristics. Discounts ranged from 4% to 10%. This excludes assets for which significant unobservable inputs are not developed internally, primarily consisting of broker quotes.
Investment funds – The underlying investments may have significant unobservable inputs for comparable multiples and weighted average cost of capital rates applied in the valuation models. These inputs in isolation can cause significant increases or decreases in fair value. Specifically, the comparable multiples are multiplied by the underlying investment’s earnings before interest, tax, depreciation, and amortization to establish the total enterprise value of the underlying investments. We use a comparable multiple consistent with the implied trading multiple of public industry peers.
Similarly, for certain underlying investments we may use a discounted cash flow model. When we use a discounted cash flow model, the significant input is the discount rate applied to present value the projected cash flows. An increase in the discount rate can significantly lower the fair value; a decrease in the discount rate can significantly increase the fair value. We determine the discount rate considering the weighted average cost of capital calculation of companies in similar industries with comparable debt to equity ratios.
Interest sensitive contract liabilities – embedded derivative – Significant unobservable inputs we use in the fixed indexed annuities embedded derivative of the interest sensitive contract liabilities valuation include:
| 1. | Non-performance risk – For contracts we issue, we use the credit spread from the U.S. treasury curve based on our public credit rating as of the valuation date. This represents our credit risk for use in the estimate of the fair value of embedded derivatives. For contracts reinsured through funds withheld reinsurance, the cedant company holds collateral against its exposure; therefore, immaterial non-performance risk is ascribed to these contracts. |
| 2. | Option budget – The Company assumes future hedge costs in the derivative’s fair value estimate. The level of option budgets determines the future costs of the options and impacts future policyholder account value growth. |
| 3. | Policyholder behavior – We regularly review the lapse and withdrawal assumptions. These are based on the Company’s initial pricing assumptions updated for actual experience. Actual Company experience may be limited for recently issued products. |
F-69
Table of Contents
ATHENE HOLDING LTD.
Notes to Consolidated Financial Statements
The following summarizes the unobservable inputs for the embedded derivative of interest sensitive contract liabilities:
| December 31, 2015 | ||||||||||||||||||||||||
| (In millions) | Fair value | Valuation technique | Unobservable inputs | Input/range of inputs |
Impact of an input | |||||||||||||||||||
| Fixed indexed annuities embedded derivatives |
$ | 4,477 | Option budget method | Non-performance risk | 0.6 | % | – | 1.8% | Decrease | |||||||||||||||
| Option budget | 0.8 | % | – | 3.8% | Increase | |||||||||||||||||||
| Surrender rate | 0.0 | % | – | 10.7% | Decrease | |||||||||||||||||||
Fair Value of Financial Instruments Not Carried at Fair Value—The following represents the Company’s financial instruments not carried at fair value on the consolidated balance sheets:
| December 31, 2015 | December 31, 2014 | |||||||||||||||||||
| (In millions) | Fair Value Level |
Carrying Value |
Fair Value | Carrying Value |
Fair Value | |||||||||||||||
| Assets |
||||||||||||||||||||
| Mortgage loans |
3 | $ | 5,452 | $ | 5,567 | $ | 5,392 | $ | 5,638 | |||||||||||
| Investment funds |
3 | 581 | 581 | 618 | 618 | |||||||||||||||
| Policy loans |
2 | 642 | 642 | 778 | 778 | |||||||||||||||
| Funds withheld at interest |
3 | 3,446 | 3,446 | 2,647 | 2,647 | |||||||||||||||
| Other investments |
3 | 83 | 83 | 56 | 56 | |||||||||||||||
| Investments in related parties |
||||||||||||||||||||
| Investment funds |
3 | 997 | 997 | 585 | 585 | |||||||||||||||
| Short-term investments |
2 | 55 | 55 | — | — | |||||||||||||||
| Other investments |
3 | 245 | 256 | — | — | |||||||||||||||
|
|
|
|
|
|
|
|
|
|||||||||||||
| Total assets not carried at fair value |
$ | 11,501 | $ | 11,627 | $ | 10,076 | $ | 10,322 | ||||||||||||
|
|
|
|
|
|
|
|
|
|||||||||||||
| Liabilities |
||||||||||||||||||||
| Interest sensitive contract liabilities |
3 | 50,937 | 50,755 | 54,787 | 55,471 | |||||||||||||||
| Funds withheld liability |
2 | 353 | 353 | 1,201 | 1,201 | |||||||||||||||
|
|
|
|
|
|
|
|
|
|||||||||||||
| Total liabilities not carried at fair value |
$ | 51,290 | $ | 51,108 | $ | 55,988 | $ | 56,672 | ||||||||||||
|
|
|
|
|
|
|
|
|
|||||||||||||
We estimate the fair value for financial instruments not carried at fair value using the same methods and assumptions as those we do carry at fair value. The financial instruments presented above are reported at carrying value on the consolidated balance sheets; however, in the case of policy loans, funds withheld at interest and liability, other investments, and investments in related parties – short-term investments, the carrying amount approximates or equals fair value.
Investment in related parties – Other investments – The fair value of investment in related party – other investments is determined using a discounted cash flow model using discount rates for similar investments.
Interest sensitive contract liabilities – The carrying and fair value of interest sensitive contract liabilities above excludes embedded derivatives and certain universal life liabilities, which are held at fair value. We consider the
F-70
Table of Contents
ATHENE HOLDING LTD.
Notes to Consolidated Financial Statements
embedded value, which is an appraisal valuation of the in force business using internal assumptions and discount the distributable earnings using market participant rate of return. We then reduce the fair value of the assets by the total embedded value of the Company to determine the fair value of the total liabilities. This amount represents what the Company would need to pay to transfer all the liabilities to another party. All non-interest sensitive liabilities are then subtracted from the fair value of the total liabilities to arrive at the fair value of the interest sensitive liabilities.
8. Business Combinations
Delta Lloyd Deutschland—Effective October 1, 2015, we acquired 100% of the voting equity interests of DLD and $50 million of intercompany loans from Delta Lloyd N.V. for a cash purchase price of $74 million. DLD was a Germany-domiciled insurance group with an in force book of business primarily made up of participating long-duration savings products. We acquired DLD to strategically expand our core business into Germany. Following the acquisition, DLD was renamed Athene Deutschland GmbH.
Aviva USA—Effective October 2, 2013, we acquired 100% of the common shares of Aviva USA Corporation (Aviva USA) from Aviva plc. Upon close, we ceded the majority of Aviva USA’s life insurance business to affiliates of Global Atlantic. The Company paid $529 million, of which $368 million was cash, $170 million was a surplus note, and $9 million settled existing debt between Aviva plc and Aviva USA. Following the acquisition, Aviva USA was renamed Athene USA.
During 2014, we finalized our purchase accounting for the Aviva USA acquisition. We recorded measurement period adjustments for the final valuation of interest sensitive contract benefits, deferred tax assets, and final purchase price adjustment.
The acquisition resulted in VOBA of $1,696 million. It also created $638 million of negative VOBA, of which $411 million is related to investment-type contracts and $227 million is related to insurance contracts. We recorded a bargain purchase gain of $152 million during the year ended December 31, 2013. We believe three main factors created this bargain purchase gain:
| • | The Company was able to acquire the entire business since we had a partner to reinsure the life business, |
| • | Anticipated future regulatory capital requirements motivated the seller to divest the business, and |
| • | The value of business acquired as determined by a market participant calculation was greater than the consideration paid. This was mostly due to better assumed investment earned rates going forward, partially offset by a higher required rate of return and a higher ratio of required capital to reserves than Aviva plc held against the business. |
To preserve the economics of the transaction, prior to closing the Company entered into a series of interest rate swaptions to hedge the value of the embedded gains in the investment portfolio until the acquisition was complete. The loss on these derivatives including embedded cost was $69 million in 2013.
F-71
Table of Contents
ATHENE HOLDING LTD.
Notes to Consolidated Financial Statements
The following summarizes the fair values of the assets acquired and liabilities assumed in the DLD and Aviva USA acquisitions.
| October 1, 2015 | October 2, 2013 | |||||||
| (In millions) | DLD | Aviva USA | ||||||
| Investments |
$ | 5,539 | $ | 51,627 | ||||
| Cash and cash equivalents |
236 | 1,948 | ||||||
| Accrued investment income |
67 | 550 | ||||||
| Reinsurance recoverable |
4 | 1,079 | ||||||
| Deferred tax assets |
— | 536 | ||||||
| Value of business acquired |
— | 1,696 | ||||||
| Other assets |
83 | 764 | ||||||
|
|
|
|
|
|||||
| Total identifiable assets acquired |
5,929 | 58,200 | ||||||
|
|
|
|
|
|||||
| Interest sensitive contract liabilities |
403 | 47,629 | ||||||
| Future policy benefits |
4,519 | 7,795 | ||||||
| Other policy claims and benefits |
55 | 116 | ||||||
| Dividends payable to policyholders |
771 | 202 | ||||||
| Income taxes payable |
— | 46 | ||||||
| Derivative liabilities |
— | 194 | ||||||
| Other liabilities |
107 | 1,537 | ||||||
|
|
|
|
|
|||||
| Total identifiable liabilities assumed |
5,855 | 57,519 | ||||||
|
|
|
|
|
|||||
| Net identifiable assets acquired |
74 | 681 | ||||||
| Goodwill (Bargain purchase gain) |
— | (152) | ||||||
|
|
|
|
|
|||||
| Net assets acquired |
$ | 74 | $ | 529 | ||||
|
|
|
|
|
|||||
DLD contributed $129 million of revenue and $6 million of net income during the year ended December 31, 2015. Aviva USA contributed $(7) million of revenue and $180 million of net income during the year ended December 31, 2013. Transaction costs incurred during the years ended December 31, 2015, 2014, and 2013, for these acquisitions were $15 million, $7 million, and $13 million, respectively, and are included in policy and other operating expenses on the consolidated statements of income.
The following unaudited pro forma revenue and net income assumes a January 1, 2014, acquisition date for DLD and January 1, 2012, acquisition date for Aviva USA:
| Years ended December 31, | ||||||||||||
| (In millions) | 2015 | 2014 | 2013 | |||||||||
| Revenue |
$ | 3,002 | $ | 4,622 | $ | 6,001 | ||||||
| Net income |
579 | 473 | 1,896 | |||||||||
F-72
Table of Contents
ATHENE HOLDING LTD.
Notes to Consolidated Financial Statements
9. Reinsurance
The following summarizes the effect of reinsurance on premiums and future policy and other policy benefits on the consolidated statements of income:
| Years ended December 31, | ||||||||||||
| (In millions) | 2015 | 2014 | 2013 | |||||||||
| Premiums |
||||||||||||
| Direct |
$ | 445 | $ | 387 | $ | 282 | ||||||
| Reinsurance assumed |
24 | 28 | 12 | |||||||||
| Reinsurance ceded |
(274) | (315) | (1,431) | |||||||||
|
|
|
|
|
|
|
|||||||
| Total premiums |
$ | 195 | $ | 100 | $ | (1,137) | ||||||
|
|
|
|
|
|
|
|||||||
| Future policy and other policy benefits |
||||||||||||
| Direct |
$ | 1,041 | $ | 1,320 | $ | 577 | ||||||
| Reinsurance assumed |
30 | (134) | 21 | |||||||||
| Reinsurance ceded |
(554) | (490) | (1,548) | |||||||||
|
|
|
|
|
|
|
|||||||
| Total future policy and other policy benefits |
$ | 517 | $ | 696 | $ | (950) | ||||||
|
|
|
|
|
|
|
|||||||
Reinsurance typically provides for recapture rights on the part of the ceding company for certain events of default. Additionally, some agreements require us to place assets in trust accounts for the benefit of the ceding entity. As of December 31, 2015, and 2014, we held assets in trusts of $1,314 million and $1,545 million, respectively. While we own assets placed in trust, their use is restricted based on the trust agreement terms. If the statutory book value of the assets, or in certain cases fair value, in a trust declines because of impairments or other reasons, we may be required to contribute additional assets to the trust. In addition, the assets within a trust may be subject to a pledge in favor of the applicable reinsurance company.
Global Atlantic ceded reinsurance transactions—We entered into a series of reinsurance agreements with affiliates of Global Atlantic to cede the majority of the Aviva USA acquired life business for a combined ceding commission of $112 million during the year ended December 31, 2013.
In conjunction with the Company’s business combination with Aviva USA, we elected the fair value option for the ILICO Closed Block and certain blocks of universal and other life business ceded to Global Atlantic whereby the Aviva USA acquired life business was adjusted to fair value at the acquisition date of October 2, 2013, and is measured at fair value each reporting period.
We have a 100% coinsurance and assumption agreement with Accordia Life and Annuity Company (Accordia), an affiliate of Global Atlantic. The agreement ceded all existing open block life insurance business issued by Athene Annuity and Life Company (AAIA), with the exception of enhanced guarantee universal life insurance products. We also entered into a 100% coinsurance agreement with Accordia to cede all policy liabilities of the ILICO Closed Block. The ILICO Closed Block consists primarily of participating whole life insurance policies. We also have an excess of loss arrangement with Accordia to reimburse the Company for any payments required from the Company’s general assets to meet the contractual obligations of the AmerUs Closed Block not covered by existing reinsurance through Athene Re USA IV. The AmerUs Closed Block consists primarily of participating whole life insurance policies. Since all liabilities were covered by the existing reinsurance at close, no reinsurance premiums were ceded. The assets backing the AmerUs Closed Block are managed, on AAIA’s behalf, by Goldman Sachs Asset Management, an affiliate of Global Atlantic.
During the third quarter of 2015, AAIA agreed to novate certain open blocks of business ceded to Accordia, that were in force as of August 1, 2015, in accordance with the terms of the coinsurance and assumption
F-73
Table of Contents
ATHENE HOLDING LTD.
Notes to Consolidated Financial Statements
agreement. As a result of the novation, interest sensitive contract liabilities decreased $4,179 million, future policy benefits decreased $67 million, policy loans decreased $129 million, and reinsurance recoverable decreased $4,117 million.
We also have reinsurance agreements with First Allmerica Financial Life Insurance Company (FAFLIC), an affiliate of Global Atlantic. These agreements, comprising funds withheld coinsurance and coinsurance and assumption reinsurance, ceded existing life business. The assets backing the funds withheld liabilities are managed, on our behalf, by Goldman Sachs Asset Management.
During the third quarter of 2015, portions of the reinsurance agreements between us and FAFLIC were amended to change the reinsurance agreements from funds withheld coinsurance to coinsurance, which resulted in a $930 million decrease to funds withheld liability, and a corresponding decrease to assets, primarily consisting of investments.
At December 31, 2015, and 2014, Global Atlantic maintained a series of trust and custody accounts under the terms of these agreements with assets having a fair value of $4,614 million and $6,743 million, respectively.
Protective Life ceded reinsurance transactions—We reinsured substantially all of the existing life and health business of Athene Annuity & Life Assurance Company (AADE) to Protective Life under a coinsurance agreement in 2011. At December 31, 2015, and 2014, Protective Life maintained a trust for our benefit with assets having a fair value of $1,616 million and $1,753 million, respectively.
Ceded Reinsurance Transactions—The following summarizes our reinsurance recoverable from the following:
| December 31, | ||||||||
| (In millions) | 2015 | 2014 | ||||||
| Global Atlantic |
$ | 5,090 | $ | 9,306 | ||||
| Protective Life |
1,760 | 1,798 | ||||||
| Other1 |
407 | 480 | ||||||
|
|
|
|
|
|||||
| Reinsurance recoverable |
$ | 7,257 | $ | 11,584 | ||||
|
|
|
|
|
|||||
| 1 | Represents all other reinsurers, with no single reinsurer having a carrying value in excess of 5% of total recoverable. |
Assumed Coinsurance Transactions—We have coinsurance agreements with Transamerica Life Insurance Corporation (Transamerica) and Liberty Bankers Life Insurance Company, under which we assumed fixed annuities. The following summarizes our assumed coinsurance reserves:
| December 31, | ||||||||
| (In millions) | 2015 | 2014 | ||||||
| Transamerica Life Insurance Corporation |
$ | 1,122 | $ | 1,343 | ||||
| Liberty Bankers Life Insurance Company |
371 | 445 | ||||||
F-74
Table of Contents
ATHENE HOLDING LTD.
Notes to Consolidated Financial Statements
10. Deferred Acquisition Costs, Deferred Sales Inducements, and Value of Business Acquired
The following represents a rollforward of DAC, DSI, and VOBA:
| (In millions) | DAC | DSI | VOBA | Total | ||||||||||||
| Balance at December 31, 2012 |
$ | 117 | $ | 70 | $ | 177 | $ | 364 | ||||||||
| Additions |
125 | 37 | 1,727 | 1,889 | ||||||||||||
| Unlocking |
9 | 3 | 2 | 14 | ||||||||||||
| Amortization |
(32) | (19) | (123) | (174) | ||||||||||||
| Impact of unrealized investment (gains) losses |
(9) | — | 51 | 42 | ||||||||||||
|
|
|
|
|
|
|
|
|
|
|
|
| |||||
| Balance at December 31, 2013 |
210 | 91 | 1,834 | 2,135 | ||||||||||||
| Additions |
250 | 113 | — | 363 | ||||||||||||
| Unlocking |
2 | 6 | 28 | 36 | ||||||||||||
| Amortization |
(20) | (10) | (129) | (159) | ||||||||||||
| Impact of unrealized investment (gains) losses |
(17) | (12) | (117) | (146) | ||||||||||||
|
|
|
|
|
|
|
|
|
|
|
|
| |||||
| Balance at December 31, 2014 |
425 | 188 | 1,616 | 2,229 | ||||||||||||
| Additions |
288 | 136 | — | 424 | ||||||||||||
| Unlocking |
(6) | (2) | (27) | (35) | ||||||||||||
| Amortization |
(34) | (18) | (136) | (188) | ||||||||||||
| Impact of unrealized investment (gains) losses |
34 | 17 | 182 | 233 | ||||||||||||
|
|
|
|
|
|
|
|
|
|
|
|
| |||||
| Balance at December 31, 2015 |
$ | 707 | $ | 321 | $ | 1,635 | $ | 2,663 | ||||||||
|
|
|
|
|
|
|
|
|
|
|
|
| |||||
The unlocking impact in 2015 was primarily driven by a decrease in expected long term net investment earned rates. In 2014, the unlocking impact was primarily driven by an increase in expected long term net investment earned rates. The unlocking impact in 2013 was primarily the result of lowering lapse rates on one of the fixed indexed annuity products to better reflect actual experience, offset by lowering the future hedge budget on the same product.
We did not make any adjustments to DAC recoverability during the years ended December 31, 2015, 2014, or 2013.
The expected amortization of VOBA for the next five years is as follows:
| (In millions) | Expected Amortization |
|||
| 2016 |
$ | 161 | ||
| 2017 |
152 | |||
| 2018 |
144 | |||
| 2019 |
131 | |||
| 2020 |
121 | |||
11. Closed Block
The Company pays guaranteed benefits under all policies included in the Closed Blocks. In the event the Closed Blocks’ assets are insufficient to meet the benefits of the Closed Blocks’ guaranteed benefits, we would use general assets to meet the contractual benefits of the Closed Blocks’ policyholders. We ceded the ILICO Closed Block of policies to Global Atlantic. In addition, Global Atlantic is responsible for managing the dividend scale of the AmerUs Closed Block.
F-75
Table of Contents
ATHENE HOLDING LTD.
Notes to Consolidated Financial Statements
In conjunction with the Company’s business combination with Aviva USA, the fair value option was elected for the AmerUs Closed Block, whereby all assets and liabilities of the AmerUs Closed Block were adjusted to fair value at the acquisition date of October 2, 2013. The fair value of liabilities of the AmerUs Closed Block was derived as the sum of the fair value of the AmerUs Closed Block assets plus our cost of capital in the AmerUs Closed Block. The cost of capital was determined to be the present value of the projected future after tax earnings on the required capital of the AmerUs Closed Block, discounted at a rate which represents a market participant’s required rate of return.
The election of the fair value option on the AmerUs Closed Block results in the change in liabilities, exclusive of the cost of capital, to be equal to the change in the assets in periods subsequent to the acquisition date. We do not record additional policyholder dividend obligations, as there are no future GAAP earnings available to the policyholders.
The excess of the fair value of the liabilities over the fair value of the assets represents our cost of capital in the AmerUs Closed Block. The maximum amount of future earnings from the assets and liabilities of the AmerUs Closed Block is represented by the reduction in the cost of capital in future years based on the operations of the AmerUs Closed Block and recalculation of the cost of capital each reporting period.
Summarized financial information of the AmerUs Closed Block is presented below.
| December 31, | ||||||||
| (In millions) | 2015 | 2014 | ||||||
| Liabilities |
||||||||
| Future policy benefits |
$ | 1,581 | $ | 1,715 | ||||
| Other policy claims and benefits |
12 | 15 | ||||||
| Dividends payable to policyholders |
94 | 96 | ||||||
| Other liabilities |
10 | 11 | ||||||
|
|
|
|
|
|||||
| Total liabilities |
1,697 | 1,837 | ||||||
|
|
|
|
|
|||||
| Assets |
||||||||
| Trading securities |
1,316 | 1,470 | ||||||
| Mortgage loans, net of allowances |
48 | 55 | ||||||
| Policy loans |
181 | 186 | ||||||
|
|
|
|
|
|||||
| Total investments |
1,545 | 1,711 | ||||||
| Cash and cash equivalents |
45 | 12 | ||||||
| Accrued investment income |
18 | 18 | ||||||
| Reinsurance recoverable |
22 | 31 | ||||||
| Other assets |
3 | 3 | ||||||
|
|
|
|
|
|||||
| Total assets |
1,633 | 1,775 | ||||||
|
|
|
|
|
|||||
| Maximum future earnings to be recognized from AmerUs Closed Block |
$ | 64 | $ | 62 | ||||
|
|
|
|
|
|||||
F-76
Table of Contents
ATHENE HOLDING LTD.
Notes to Consolidated Financial Statements
The following represents the contribution from AmerUs Closed Block.
| Years ended December 31, | ||||||||||||
| (In millions) | 2015 | 2014 | 2013 | |||||||||
| Revenues |
||||||||||||
| Premiums |
$ | 58 | $ | 64 | $ | 17 | ||||||
| Net investment income |
86 | 86 | 21 | |||||||||
| Investment related gains (losses) |
(124) | 110 | (6) | |||||||||
|
|
|
|
|
|
|
|||||||
| Total revenues |
20 | 260 | 32 | |||||||||
|
|
|
|
|
|
|
|||||||
| Benefits and expenses |
||||||||||||
| Future policy and other policy benefits |
(24) | 212 | 20 | |||||||||
| Dividends to policyholders |
45 | 45 | 11 | |||||||||
|
|
|
|
|
|
|
|||||||
| Total benefits and expenses |
21 | 257 | 31 | |||||||||
|
|
|
|
|
|
|
|||||||
| Contribution (to) from AmerUs Closed Block before income taxes |
(1) | 3 | 1 | |||||||||
| Federal income taxes funded by the Closed Block |
1 | 6 | — | |||||||||
|
|
|
|
|
|
|
|||||||
| Contribution (to) from AmerUs Closed Block, net of income taxes |
$ | (2) | $ | (3) | $ | 1 | ||||||
|
|
|
|
|
|
|
|||||||
12. Debt
Refer to Note 6 – Variable Interest Entities for disclosures regarding borrowings of the Company’s consolidated VIEs.
Revolving Credit Facility—In 2013, AHL and ALRe entered into a three-year revolving credit agreement (Credit Facility) with Citibank, N.A., as administrative agent. Beginning in 2014, Athene USA was added as a borrower. The amount available under the Credit Facility was $500 million. In connection with the Credit Facility, AHL guaranteed all of the obligations of ALRe and Athene USA, ALRe guaranteed certain of the obligations of AHL and Athene USA, and Athene USA guaranteed the obligations of AHL and ALRe. The agreement contained various standard covenants with which we had to comply. The following are significant covenants we were required to meet:
| 1. | Consolidated debt to capitalization ratio of less than 35%, or in certain circumstances 25%, |
| 2. | Minimum consolidated net worth of no less than 70% of the Company’s consolidated net worth on the date of the Company’s acquisition of Aviva USA plus 50% of the cash received in any subsequent equity issuances and 50% of the Company’s positive consolidated net income for each subsequent fiscal year, |
| 3. | The Company’s material U.S. insurance subsidiaries to maintain a ratio of total adjusted capital to authorized control level risk-based capital (each as defined by the National Association of Insurance Commissioners (NAIC)) of no less than 400%, |
| 4. | ALRe to maintain capital and surplus of no less than 70% of ALRe’s capital and surplus on the date of the Company’s acquisition of Aviva USA plus 50% of ALRe’s positive net income for each fiscal year, and |
| 5. | Restrictions on our ability to incur debt and liens and to declare or pay dividends, in each case with certain exceptions. |
As of December 31, 2015, we had no amounts outstanding under the Credit Facility and were in compliance with all covenants.
F-77
Table of Contents
ATHENE HOLDING LTD.
Notes to Consolidated Financial Statements
Interest accrued on outstanding borrowings at LIBOR plus a margin based on the debt to capitalization ratio of the Company. Total interest expense was not material during the years ended December 31, 2015, 2014, or 2013. The Credit Facility had a commitment fee of 0.50% of the unused commitment. We incurred $8 million of loan origination fees which were amortized to interest expense over the term of the facility using the straight line method.
On January 22, 2016, we terminated the Credit Facility and entered into a five-year revolving credit agreement (Revolving Credit Facility) with Citibank, N.A., as administrative agent. The amount available under the Revolving Credit Facility is $1 billion, with AHL, ALRe, and Athene USA as borrowers on the agreement. Interest will accrue on outstanding borrowings at LIBOR plus a margin or a base rate plus a margin, based on the credit rating of AHL. The Revolving Credit Facility has a commitment fee on the unused commitment, based on the credit rating of AHL.
13. Common Stock
We have six classes of common stock: Class A, Class B, Class M-1, Class M-2, Class M-3, and Class M-4. The Class M-1, Class M-2, Class M-3, and Class M-4 shares are collectively referred to as Class M shares.
Class A shares collectively represent 55% of the total voting power of the Company. Class B shares represent the remaining 45% of the total voting power of the Company, and are beneficially owned by shareholders who are members of the Apollo Group, as defined in our bye-laws. Class M shares are restricted, non-voting shares issued under equity incentive plans. See additional discussion of incentive compensation in Note 14 – Stock-based Compensation. Our bye-laws place certain restrictions on Class A shares such that (1) a holder of Class A shares, including its affiliates, cannot control greater than 9.9% of the total outstanding vote and if a holder of Class A shares were to control greater than 9.9%, then a holder’s voting power is automatically reduced to 9.9% and the other holders of Class A shares would vote the remainder on a prorated basis, (2) the total voting power held by members of our management and employees of the Apollo Shareholder Group is limited to 3%, and (3) Class A shares may be deemed non-voting when owned by a shareholder who owns Class B shares, has an equity interest in certain Apollo entities, or is a member of the Apollo Shareholder Group.
Share Activities
2015
| • | We received $1,038 million to settle remaining capital commitments executed on April 4, 2014 in connection with a private placement offered to accredited investors. As a result, we issued 31,564,339 Class A Shares and 8,369,230 Class B Shares at $26.00 per share. |
| • | We received commitments and issued an additional 2,315,113 Class A Shares at $26.02 per share, resulting in proceeds received of $60 million. |
| • | In satisfaction of our final obligations under the TASA earned by Apollo in 2014, we issued 2,311,853 Class B shares. See Note 19 – Related Parties for further information on the TASA. |
2014
| • | We received commitments for 41,201,578 Class A shares and 8,730,769 Class B shares as a result of a private placement offered to accredited investors launched in late 2013. Of that commitment, 8,240,316 Class A shares and 1,746,154 Class B shares were issued at $26.00 per share in April 2014, which represented a drawdown of 20% of the committed capital in the private placement at the time. The commitment for the remaining 39,945,877 shares was recorded as common shares subscribed but unissued, with an offsetting subscription receivable as described under Subscriptions Receivable below. |
F-78
Table of Contents
ATHENE HOLDING LTD.
Notes to Consolidated Financial Statements
| • | To encourage significant investment by key employees, we issued 3,693,730 Class A shares at a discounted price of $13.46 pursuant to our equity incentive plan. |
| • | We issued a total of 11,426,883 Class B shares in satisfaction of certain of our obligations under the TASA. This agreement is further described in Note 19 – Related Parties. |
| • | The convertible note issued in 2012 as part of the Contribution Agreement was converted to shares, resulting in the issuance of 3,808,626 Class B shares. This agreement is further described in Note 19 –Related Parties. |
| • | We authorized the following additional shares at a par value of $0.001 per share: (1) 87,110,662 Class A shares, (2) 175,000,000 Class B shares, (3) two new classes of incentive compensation shares consisting of 7,500,000 Class M-3 shares and 7,500,000 Class M-4 shares, and (4) 149,998,898 shares of capital stock, which remain undesignated. |
2013
| • | We issued shares totaling 8,869,562 upon the satisfaction of previous share purchase commitments. |
Subscriptions Receivable – As of December 31, 2015, we had no subscriptions receivable. At December 31, 2014, we had 39,933,569 common shares subscribed but unissued and an offsetting subscription receivable of $1,038 million as a result of the 2014 private placement discussed above. There were no subscriptions receivable at December 31, 2013.
F-79
Table of Contents
ATHENE HOLDING LTD.
Notes to Consolidated Financial Statements
The table below shows the changes in each class of shares issued and outstanding:
| 2015 | 2014 | 2013 | ||||||||||
| Class A |
||||||||||||
| Beginning balance |
15,752,736 | 494,200 | 494,200 | |||||||||
| Issued shares |
34,498,220 | 11,950,844 | — | |||||||||
| Repurchased shares |
(99,691) | — | — | |||||||||
| Transferred from Class B shares, net |
— | 3,307,692 | — | |||||||||
|
|
|
|
|
|
|
|||||||
| Ending balance |
50,151,265 | 15,752,736 | 494,200 | |||||||||
|
|
|
|
|
|
|
|||||||
| Class B |
||||||||||||
| Beginning balance |
125,282,892 | 114,605,747 | 111,594,479 | |||||||||
| Issued shares |
10,681,083 | 16,981,664 | 8,869,562 | |||||||||
| Repurchased shares |
— | (2,996,827) | (5,858,294) | |||||||||
| Transferred to Class A shares, net |
— | (3,307,692) | — | |||||||||
|
|
|
|
|
|
|
|||||||
| Ending balance |
135,963,975 | 125,282,892 | 114,605,747 | |||||||||
|
|
|
|
|
|
|
|||||||
| Class M-1 |
||||||||||||
| Beginning balance |
5,198,273 | 5,198,273 | 5,198,273 | |||||||||
|
|
|
|
|
|
|
|||||||
| Ending balance |
5,198,273 | 5,198,273 | 5,198,273 | |||||||||
|
|
|
|
|
|
|
|||||||
| Class M-2 |
||||||||||||
| Beginning balance |
3,125,869 | 3,226,792 | 3,125,870 | |||||||||
| Issued shares |
— | — | 100,922 | |||||||||
| Forfeited shares |
— | (80,738) | — | |||||||||
| Repurchased shares |
— | (20,185) | — | |||||||||
|
|
|
|
|
|
|
|||||||
| Ending balance |
3,125,869 | 3,125,869 | 3,226,792 | |||||||||
|
|
|
|
|
|
|
|||||||
| Class M-3 |
||||||||||||
| Beginning balance |
3,350,000 | — | — | |||||||||
| Issued shares |
— | 3,390,000 | — | |||||||||
| Forfeited shares |
(216,000) | (32,000) | — | |||||||||
| Repurchased shares |
(24,000) | (8,000) | — | |||||||||
|
|
|
|
|
|
|
|||||||
| Ending balance |
3,110,000 | 3,350,000 | — | |||||||||
|
|
|
|
|
|
|
|||||||
| Class M-4 |
||||||||||||
| Beginning balance |
— | — | — | |||||||||
| Issued shares |
5,316,751 | — | — | |||||||||
| Forfeited shares |
(242,050) | — | — | |||||||||
| Repurchased shares |
(36,258) | — | — | |||||||||
|
|
|
|
|
|
|
|||||||
| Ending balance |
5,038,443 | — | — | |||||||||
|
|
|
|
|
|
|
|||||||
14. Stock-based Compensation
We adopted share incentive plans in 2009, 2012, and 2014 (Share Incentive Plans). The 2009 and 2012 Share Incentive Plans were amended and restated in 2014 (2014 Modification), along with the adoption of the 2014 Share Incentive Plan (2014 Plan). The purpose of the Share Incentive Plans is to provide an incentive to achieve
F-80
Table of Contents
ATHENE HOLDING LTD.
Notes to Consolidated Financial Statements
long-term company goals and align the interests of our employees and directors, and AAM employees, with those of shareholders. See Note 19 – Related Parties regarding our relationship with AAM. Under the Share Incentive Plans, we may issue nonqualified share options, rights to purchase shares, restricted shares, restricted stock units (RSUs), and other awards which may be settled in, or based upon, our common shares.
The aggregate number of shares authorized for issuance under the Share Incentive Plans includes:
| • | 7,109,560 Class M-1 shares |
| • | 5,000,000 Class M-2 shares |
| • | 7,500,000 Class M-3 shares |
| • | 7,500,000 Class M-4 shares |
| • | 8,000,000 Class A common shares |
Through the Share Incentive Plans, we have issued the following two categories of stock-based compensation: Class M awards and Class A awards.
Class M awards—We have issued Class M shares and RSUs concurrently with the timing of capital raises, in order to align management incentives with shareholder investments.
Class M shares function similarly to options in that they are exchangeable into Class A shares upon payment of a conversion price and other conditions being met. The settlement value of the RSUs is based upon the value of the Class A shares at the time of settlement after deducting the conversion price of the RSUs. RSUs may be settled either in cash or Class A shares at the Company’s election. One portion of the Class M shares and RSUs is subject to time vesting conditions (Tranche 1), and the other portion is subject to certain performance-based vesting conditions (Tranche 2). Both Tranche 1 and Tranche 2 RSUs require an initial public offering (IPO) as an additional vesting condition. Vesting conditions are further described below.
The nature and terms of the Class M shares are generally consistent across each class. In October 2015, we issued Class M-4 shares with a different Tranche 2 performance condition than the original Class M-4 award. These shares are referred to as Class M-4 Prime. This vesting condition and any other significant differences between classes will be separately discussed throughout the following discussion.
Class M share vesting – Tranche 1 shares generally vest in 20% increments on the first through fifth anniversaries of the earlier of the date of grant or vesting inception date. Tranche 1 shares also automatically vest upon the sale of the Company or change in control, prior to the participant’s termination or within six months following a qualifying termination. Unvested Tranche 1 shares are forfeited upon a participant’s termination.
Tranche 2 awards vest if certain performance hurdles are met, described as follows:
| • | Class M (excluding M-4 Prime) – The vesting performance hurdle is based on the rate of return and realized cash received by certain holders of our shares (Relevant Investors), as defined in each incentive plan, upon sale of their shares prior to or during an IPO or within a 15 month period thereafter (Lock-Up End Date). Vesting may also occur if the performance hurdles are met based on a deemed sale by a Relevant Investor on the dates 7.5, 12, and 15 months after an IPO, and on each trading day thereafter, through the Contractual Term of each M share class, at a price equal to the volume weighted average closing trading price during the 90 day period prior to such date. Based on the results of the performance hurdle calculations, the vesting percentages of the Tranche 2 awards can range from 0% to 100%. Upon a participant’s qualifying termination, unvested Tranche 2 awards remain outstanding and eligible to vest for a period of 18 months following the later of the IPO date or date of a qualifying termination. Any unvested Tranche 2 shares remaining at the end of this 18 month period are forfeited. |
F-81
Table of Contents
ATHENE HOLDING LTD.
Notes to Consolidated Financial Statements
| • | Class M-4 Prime – The vesting performance hurdle is based on the attainment of a specified Class A share price following an IPO. Vesting will also occur upon a sale of the Company or change in control in which Class A Shares are valued at the respective hurdle share price. Any unvested Tranche 2 shares remaining as of the tenth anniversary of the grant date are forfeited. |
Upon a participant’s termination, vested Class M shares and converted Class A shares are eligible to be repurchased, at the Company’s option, for a price determined based on the reason for termination.
Contractual Terms – Unvested Class M share are forfeited as of the following dates:
| • | Class M-1 – 10 years from the grant date |
| • | Class M-2 – 10 years from the grant date |
| • | Class M-3 – 4.25 years following an IPO (three years after Lock-Up End Date) |
| • | Class M-4 – 5.25 years following an IPO (four years after Lock-Up End Date) |
Although the Class M shares function similarly to options, they are equity shares, and have dividend rights and no expiration date once vested. Prior to vesting, Class M shares generally do not participate in the Company’s dividends, if any.
Conversion to Class A shares – Vested Class M shares become eligible for conversion to Class A shares upon the occurrence of the following events:
| • | Class M (excluding M-4 Prime) – The earlier of (1) the realization by Relevant Investors of cash proceeds equal to their investment in the Company or (2) the effective date of an IPO. |
| • | Class M-4 Prime – The earlier of (1) a sale of the Company or change in control or (2) the effective date of an IPO. |
Following this date, a holder of vested Class M shares may elect to exchange vested shares for an equivalent number of Class A shares upon payment to the Company, in cash or in shares, of the conversion price less the amount of certain dividends paid by the Company on Class A shares subsequent to the granting of Class M shares. Following a conversion to Class A shares, shares can be sold subject to contractual transfer or legal restrictions, such as lockups, blackout periods, or affiliate sale volume caps.
As of December 31, 2015, no Class M shares were exchangeable into Class A shares.
2014 Modification – During 2014, we adopted amendments to the terms of the existing Class M-1 and M-2 shares to conform the vesting and repurchase terms of the Class M-1 and M-2 shares to those of the Class M-3 and M-4 shares, described above. Twenty-nine individuals were impacted by the modification.
Under the terms of the original plans for the Class M-1 and M-2 shares, we had the right to repurchase vested shares at the lower of purchase cost or fair value if an employee resigned without good reason, either before an IPO or under other conditions as defined in the original plans. As a result of this repurchase option, the expense associated with vested incentive shares would not be recognized on the consolidated statements of income until the date on which such shares would have been converted to Class A shares. Therefore, no expense had been recorded related to the Class M-1 or M-2 shares prior to the 2014 Modification, which revised the terms to generally call for a repurchase price equal to the fair market value of a Class A share less the conversion price of the respective Class M share.
Upon modification of a share award, the share awards are revalued and remeasured as if a new share award was issued. The 2014 Modification of the Class M-1 and M-2 shares resulted in non-recurring additional stock based compensation expense of $81 million.
F-82
Table of Contents
ATHENE HOLDING LTD.
Notes to Consolidated Financial Statements
Class A awards—The 2014 Plan also allows for the purchase of Class A shares by certain employees and directors of the Company and its affiliates. In 2015, we issued an aggregate of 442,590 fully-paid Class A shares for total proceeds of $12 million under the 2014 Plan. In April 2014, we issued an aggregate of 3,693,730 fully-paid Class A shares for total proceeds of $50 million under the 2014 Plan. For the years ended December 31, 2015, and 2014, we recognized $2 million and $46 million, respectively, of stock-based compensation expense associated with the Class A shares to the extent shares were purchased at a discounted price from fair value on the issuance date.
Additionally, we may issue restricted Class A shares to management of the Company and its affiliates. In 2015, we issued 160,754 restricted Class A shares to management of the Company and its affiliates. These awards had a grant date fair value of $26.02 per share. The restricted Class A shares had a service commencement date of January 1, 2015, and vest ratably over three years. No shares were legally vested at grant date. The restricted Class A shares are classified as equity awards measured using fair value of Class A shares on grant date.
A new annual bonus plan began in 2015 under which certain employees are eligible to receive a percentage of their bonus in restricted Class A shares which generally vest over three years. Employees receiving equity under this plan for the 2015 bonus period only will have one third of their awards vested at time of grant in February 2016. As the service inception date for these awards occurred in 2015 and precedes the grant date, compensation expense for the portion to be vested at grant date was recognized in 2015 at the current period fair value.
Compensation expense—Class M shares with Tranche 1 vesting requirements are accounted for as equity awards and related compensation expense is recognized ratably over the vesting period. The expense for Tranche 1 shares issued to employees is calculated based on grant date fair value multiplied by the number of shares awarded. The expense for Tranche 1 shares issued to non-employees (i.e. AAM participants) is recognized initially at the grant date fair value multiplied by the number of shares. However, the fair value of the awards are revalued each reporting period through completion of counterparty performance to coincide with the fair value of the services provided by the non-employees. The result of the revaluation is recognized in the period in which the revaluation occurs.
Employee and non-employee Tranche 2 shares, excluding M-4 Prime, are accounted for as liability awards. Compensation expense for all participants is remeasured each reporting period through settlement at the fair value of the awards, factoring in the probability of achieving the vesting targets described above. Upon vesting of Tranche 2 shares, the liability is reclassified to equity, because the vesting condition which resulted in liability classification is no longer present, and measured at fair value on the date of reclassification.
Tranche 2 M-4 Prime shares are accounted for as equity awards with expense recognition commencing upon completion of an IPO by the Company and calculated based on the grant date fair value of such awards multiplied by the number of shares awarded.
We also issued a net of 181,050 Class M-4 RSUs during the year ended December 31, 2015. Since there is no vesting of the RSUs prior to an IPO, there is no current period expense associated with these awards.
Class A shares are accounted for as equity awards and related compensation expense is recognized ratably over the vesting period, if any. The compensation expense for Class A shares is calculated based on the grant date fair value of the Class A common shares, less the purchase price, multiplied by the number of shares awarded.
F-83
Table of Contents
ATHENE HOLDING LTD.
Notes to Consolidated Financial Statements
Components of stock compensation expense recorded on the consolidated statements of income are as follows:
| Years ended December 31, | ||||||||
| (In millions) | 2015 | 2014 | ||||||
| Class M – Tranche 1 |
$ | 12 | $ | 54 | ||||
| Class M – Tranche 2 |
50 | 47 | ||||||
| Class A |
5 | 47 | ||||||
|
|
|
|
|
|||||
| Stock-based compensation expense |
$ | 67 | $ | 148 | ||||
|
|
|
|
|
|||||
Of the total compensation expense amount in 2014, $131 million represents a non-recurring expense that was primarily the result of the 2014 Modification and the purchase of discounted Class A shares under the 2014 Plan as previously discussed. There was no compensation expense recognized in connection with the stock-based compensation plans in 2013. No compensation costs were capitalized as part of the cost of an asset during any of the reported years.
As of December 31, 2015, the Class M shares had unrecognized compensation expense of $23 million associated with the Tranche 1 vesting awards and $62 million associated with the Tranche 2 vesting awards. The cost is expected to be recognized over a weighted-average period of 1.7 years and 1.2 years, associated with the Tranche 1 vesting awards and Tranche 2 vesting awards, respectively. There was no unrecognized compensation expense associated with discounted Class A shares.
Valuation Assumptions—The fair value of the Class M shares issued prior to 2014 was estimated on the date of grant using a lattice-based valuation model. Beginning in 2014, we determined the fair value of the Class M shares using the Black-Scholes option pricing model, with application of a Monte-Carlo simulation to determine the value of the Tranche 2 Class M shares. Assumptions used for valuation of all Class M shares are as follows:
| Assumptions used |
December 31, 2015 | December 31, 2014 | 2014 Modification Date | |||
| Athene Class A and B share value |
$34.23 | $26.02 | $26.00 | |||
| Risk-free interest rate |
0.9% –1.1% | 0.6% | 0.3% | |||
| Expected dividend yield |
—% | —% | —% | |||
| Volatility |
25.9% | 17.5% | 20.0% | |||
| Expected term |
2.42 years | 2.39 years | 2.27 years |
The fair value of the Class A and B shares at December 31, 2015 is determined based on GAAP book value multiple approach. Under this approach we utilized a comparable peer set of public companies and their share price to book value ratio, less applicable discounts for lack of marketability of AHL in order to determine the AHL Class A and B share price. The fair value of Class A shares on December 31, 2014 was determined using the embedded value method which is based on the present value of the future expected regulatory distributable income generated by the net assets plus the excess capital. The fair value of Class A shares on the modification date of the Class M-1 shares and M-2 shares was determined to be $26.00 per share as the modification date coincided with a private placement of our Class A shares at a price of $26.00 per share.
The risk-free interest rates are derived from U.S. Constant Maturity Treasury yield at the valuation date, with maturity corresponding to weighted-average expected term. The expected dividend yields are based on our historical and expected dividend payments, which have been zero to date. Absent a public market for our shares, we have historically estimated volatility of our share price based on the published historical volatilities of comparable publicly-traded companies over a period consistent with the expected life of the award being valued.
F-84
Table of Contents
ATHENE HOLDING LTD.
Notes to Consolidated Financial Statements
We estimate the weighted-average expected term of the Class M shares based on the weighted-average time to an expected liquidity event, such as an IPO or other Relevant Investor sale, according to the terms of the Class M shares and including an assumption as to expected employee exercise behavior after such liquidity event. The weighted-average expected term is determined from the 2014 modification date, the grant date, or the period end date depending on the accounting treatment for each award.
In addition, the Tranche 2 Class M share assumptions include an estimate of the probability of the vesting conditions being met. This assumption is developed by using a Monte-Carlo simulation to generate the possible future value of the Company’s equity at a liquidity event to determine the percentage of Tranche 2 Class M shares that vest for each simulated path. The fair value of the Tranche 2 Class M shares is then estimated by averaging the value for all simulated paths and discounting the results at the risk-free interest rate to the valuation date.
Award activity—A rollforward of award activity for the year ended December 31, 2015, of the Class M shares is as follows:
| Tranche 1 | Tranche 2 | Total | ||||||||||||||||||||||||||||||
| (In millions, except share and per share data) |
Class M Shares |
Weighted Average Conversion Price |
Aggregate Intrinsic Value |
Class M Shares |
Weighted Average Conversion Price |
Aggregate Intrinsic Value |
Class M Shares |
Weighted Average Conversion Price |
||||||||||||||||||||||||
| Outstanding at the beginning of the year |
5,144,481 | $ | 11.36 | 6,529,661 | $ | 11.07 | 11,674,142 | $ | 11.20 | |||||||||||||||||||||||
| Granted during the year |
1,925,600 | 26.96 | 2,868,934 | 27.29 | 4,794,534 | 27.16 | ||||||||||||||||||||||||||
| Forfeited during the year |
(203,675) | 20.09 | (254,375) | 20.08 | (458,050) | 20.09 | ||||||||||||||||||||||||||
| Repurchased during the year |
(50,902) | 20.09 | — | — | (50,902) | 20.09 | ||||||||||||||||||||||||||
|
|
|
|
|
|
|
|||||||||||||||||||||||||||
| Outstanding at the end of the year |
6,815,504 | $ | 15.44 | 9,144,220 | $ | 15.91 | 15,959,724 | $ | 15.71 | |||||||||||||||||||||||
|
|
|
|
|
|
|
|
|
|
|
|
|
|||||||||||||||||||||
| Vested and expected to vest at December 31, 2015 |
6,712,794 | $ | 13.79 | $ | 127 | 8,882,321 | $ | 14.66 | $ | 163 | ||||||||||||||||||||||
|
|
|
|
|
|
|
|
|
|
|
|
|
|||||||||||||||||||||
There were no convertible, converted, or expired shares during the years ended December 31, 2015, 2014, and 2013.
The following represents the activity of nonvested Class M shares for the year ended December 31, 2015:
| Tranche 1 | Tranche 2 | Total | ||||||||||||||||||||||
| Class M Shares |
Weighted Average Grant Date Fair Value |
Class M Shares |
Weighted Average Grant Date Fair Value |
Class M Shares |
Weighted Average Grant Date Fair Value |
|||||||||||||||||||
| Nonvested at the beginning of the year |
1,743,777 | $ | 7.36 | 5,421,995 | $ | 2.25 | 7,165,772 | $ | 3.50 | |||||||||||||||
| Granted during the year |
1,925,600 | 7.06 | 2,868,934 | 9.74 | 4,794,534 | 8.66 | ||||||||||||||||||
| Vested during the year |
(804,411) | 5.35 | — | — | (804,411) | 5.35 | ||||||||||||||||||
| Forfeited during the year |
(203,675) | 7.60 | (254,375) | 3.49 | (458,050) | 5.32 | ||||||||||||||||||
|
|
|
|
|
|
|
|||||||||||||||||||
| Nonvested at the end of the year |
2,661,291 | $ | 7.74 | 8,036,554 | $ | 4.88 | 10,697,845 | $ | 5.59 | |||||||||||||||
|
|
|
|
|
|
|
|
|
|
|
|
|
|||||||||||||
The weighted average grant date fair value of Class M share awards granted during the years ended December 31, 2014, and 2013, was $9.31 and $0.16, respectively.
F-85
Table of Contents
ATHENE HOLDING LTD.
Notes to Consolidated Financial Statements
The total fair value of vested Tranche 1 Class M shares was $98 million, $49 million, and zero as of December 31, 2015, 2014, and 2013, respectively. The total fair value of vested Tranche 2 Class M shares was $28 million, $17 million, and zero as of December 31, 2015, 2014, and 2013, respectively.
In 2014, we issued 6,184,948 of our Class B shares to Apollo in satisfaction of settlement amounts earned in 2014 by Apollo under the TASA discussed in Note 19 – Related Parties. In 2014, we also settled the equity swap transaction related to the TASA through the issuance of 5,241,935 Class B shares to Apollo.
15. Earnings Per Share
The following table represents basic and diluted earnings per share calculation:
| Years ended December 31, | ||||||||||||
| (In millions, except share and per share data) | 2015 | 2014 | 2013 | |||||||||
| Net income available to AHL shareholders |
$ | 562 | $ | 463 | $ | 916 | ||||||
|
|
|
|
|
|
|
|||||||
| Basic weighted average shares outstanding |
175,091,802 | 129,519,108 | 113,506,457 | |||||||||
| Dilutive effect of stock compensation plans |
86,846 | 11 | 9 | |||||||||
| Dilutive effect of equity swap1 |
— | 2,089,345 | 1,603,564 | |||||||||
|
|
|
|
|
|
|
|||||||
| Diluted weighted average shares outstanding |
175,178,648 | 131,608,464 | 115,110,030 | |||||||||
|
|
|
|
|
|
|
|||||||
| Earnings per share2 |
||||||||||||
| Basic |
$ | 3.21 | $ | 3.58 | $ | 8.07 | ||||||
| Diluted |
$ | 3.21 | $ | 3.52 | $ | 7.96 | ||||||
| 1 | Equity swap relates to TASA. See Note 18 – Related Parties for additional information. |
| 2 | Calculated using whole figures. |
Dilutive shares are calculated using the treasury stock method. Earnings per share for all Class M shares is zero, as no earnings are attributable to these classes of shares.
The number of shares and RSUs excluded from diluted shares outstanding were 16,653,624 shares, 11,674,141 shares, and 8,425,063 shares for the years ended December 31, 2015, 2014, and 2013, respectively. These are related to Class M shares and RSUs, as the issuance restrictions had not been satisfied as of each year end.
16. Accumulated Other Comprehensive Income
The following is a detail of AOCI, net of offsets:
| December 31, | ||||||||
| (In millions) | 2015 | 2014 | ||||||
| AFS securities |
$ | (405) | $ | 1,328 | ||||
| DAC, DSI, VOBA, and future policy benefit adjustment on AFS securities |
91 | (328) | ||||||
| Noncredit component of other-than-temporary impairment losses on AFS securities |
(15) | (5) | ||||||
| Hedging instruments |
15 | 4 | ||||||
| Pension adjustments |
(4) | (16) | ||||||
| Foreign currency translation adjustments |
(4) | — | ||||||
|
|
|
|
|
|||||
| Accumulated other comprehensive income (loss), before taxes |
(322) | 983 | ||||||
| Deferred income tax asset (liability) |
85 | (339) | ||||||
|
|
|
|
|
|||||
| Accumulated other comprehensive income (loss) |
$ | (237) | $ | 644 | ||||
|
|
|
|
|
|||||
F-86
Table of Contents
ATHENE HOLDING LTD.
Notes to Consolidated Financial Statements
Changes in AOCI are presented below.
| Years ended December 31, | ||||||||||||
| (In millions) | 2015 | 2014 | 2013 | |||||||||
| Unrealized gains (losses) on AFS securities |
||||||||||||
| Unrealized holding gains (losses) arising during the year |
$ | (1,661) | $ | 1,225 | $ | (221) | ||||||
| Change in DAC, DSI, VOBA, and future policy benefits |
419 | (317) | 66 | |||||||||
| Less: Reclassification adjustment for gains (losses) realized in net income1 |
72 | 9 | 69 | |||||||||
| Less: Income tax expense (benefit) |
(428) | 318 | (73) | |||||||||
|
|
|
|
|
|
|
|||||||
| Change in unrealized gains (losses) on AFS securities |
(886) | 581 | (151) | |||||||||
|
|
|
|
|
|
|
|||||||
| Noncredit component of other-than-temporary impairment losses on AFS securities |
||||||||||||
| Noncredit component of other-than-temporary impairment losses on AFS securities recognized during the year |
(13) | (1) | 1 | |||||||||
| Less: Reclassification adjustment for losses realized in net income1 |
(3) | — | (4) | |||||||||
| Less: Income tax expense (benefit) |
(4) | 1 | 2 | |||||||||
|
|
|
|
|
|
|
|||||||
| Change in noncredit component of other-than-temporary impairment losses on AFS securities |
(6) | (2) | 3 | |||||||||
|
|
|
|
|
|
|
|||||||
| Unrealized gain (loss) on hedging instruments |
||||||||||||
| Change in hedging instruments during the year |
11 | 10 | (2) | |||||||||
| Less: Income tax expense |
4 | 4 | — | |||||||||
|
|
|
|
|
|
|
|||||||
| Change in hedging instruments |
7 | 6 | (2) | |||||||||
|
|
|
|
|
|
|
|||||||
| Pension adjustments |
||||||||||||
| Pension adjustments during the year |
12 | (17) | 1 | |||||||||
| Less: Income tax expense (benefit) |
4 | (6) | — | |||||||||
|
|
|
|
|
|
|
|||||||
| Change in pension adjustments |
8 | (11) | 1 | |||||||||
|
|
|
|
|
|
|
|||||||
| Foreign currency translation adjustments |
||||||||||||
| Foreign currency translation adjustments during the year |
(4) | — | — | |||||||||
|
|
|
|
|
|
|
|||||||
| Change in AOCI |
$ | (881) | $ | 574 | $ | (149) | ||||||
|
|
|
|
|
|
|
|||||||
| 1 | Recognized in investment related gains (losses) on the consolidated statements of income |
17. Income Taxes
Income tax expense consists of the following:
| Years ended December 31, | ||||||||||||
| (In millions) | 2015 | 2014 | 2013 | |||||||||
| Current |
$ | (19) | $ | (84) | $ | 81 | ||||||
| Deferred |
33 | 138 | (89) | |||||||||
|
|
|
|
|
|
|
|||||||
| Income tax expense (benefit) |
$ | 14 | $ | 54 | $ | (8) | ||||||
|
|
|
|
|
|
|
|||||||
F-87
Table of Contents
ATHENE HOLDING LTD.
Notes to Consolidated Financial Statements
Income tax expense was calculated based on the following components of income before income taxes:
| Years ended December 31, | ||||||||||||
| (In millions) | 2015 | 2014 | 2013 | |||||||||
| Pre-tax income – Bermuda |
$ | 510 | $ | 271 | $ | 1,040 | ||||||
| Pre-tax income – Germany |
8 | — | — | |||||||||
| Pre-tax income (loss) – U.S. |
74 | 261 | (51) | |||||||||
|
|
|
|
|
|
|
|||||||
| Income before income taxes |
$ | 592 | $ | 532 | $ | 989 | ||||||
|
|
|
|
|
|
|
|||||||
The expected tax provision computed on pre-tax income at the weighted average tax rate has been calculated as the sum of the pre-tax income in each jurisdiction multiplied by that jurisdiction’s applicable statutory tax rate. Statutory tax rates of 0%, 31%, and 35% have been used for Bermuda, Germany, and the United States, respectively. A reconciliation of the difference between the provision for income taxes and the expected tax provision at the weighted average tax rate is as follows:
| Years ended December 31, | ||||||||||||
| (In millions) | 2015 | 2014 | 2013 | |||||||||
| Expected tax provision computed on pre-tax income at weighted average income tax rate |
$ | 28 | $ | 91 | $ | (18) | ||||||
| (Decrease) increase in income taxes resulting from: |
||||||||||||
| Deferred tax valuation allowance |
(6 | ) | (22 | ) | 8 | |||||||
| Prior year true-up |
2 | (12 | ) | 5 | ||||||||
| Interest expense on surplus notes |
— | — | (1) | |||||||||
| Corporate owned life insurance |
(7 | ) | (6 | ) | (2) | |||||||
| State taxes and other |
(3 | ) | 3 | — | ||||||||
|
|
|
|
|
|
|
|
||||||
| Total income tax expense (benefit) |
$ | 14 | $ | 54 | $ | (8) | ||||||
|
|
|
|
|
|
|
|
||||||
| Effective tax rate |
2 | % | 10% | (1)% | ||||||||
Total income taxes were as follows:
| Years ended December 31, | ||||||||||||
| (In millions) | 2015 | 2014 | 2013 | |||||||||
| Income tax expense (benefit) |
$ | 14 | $ | 54 | $ | (8) | ||||||
| Income tax from OCI |
(424) | 317 | (71) | |||||||||
|
|
|
|
|
|
|
|||||||
| Total income taxes |
$ | (410) | $ | 371 | $ | (79) | ||||||
|
|
|
|
|
|
|
|||||||
F-88
Table of Contents
ATHENE HOLDING LTD.
Notes to Consolidated Financial Statements
Deferred income tax assets and liabilities consisted of the following:
| December 31, | ||||||||
| (In millions) | 2015 | 2014 | ||||||
| Deferred tax assets |
||||||||
| Insurance liabilities |
$ | 1,351 | $ | 2,075 | ||||
| Investments, including derivatives |
144 | 8 | ||||||
| Net unrealized losses on AFS |
84 | — | ||||||
| Net operating and capital loss carryforwards |
160 | 162 | ||||||
| VOBA |
72 | — | ||||||
| Employee benefits |
57 | 50 | ||||||
| Other |
20 | 27 | ||||||
|
|
|
|
|
|||||
| Total deferred tax assets |
1,888 | 2,322 | ||||||
| Valuation allowance |
(193) | (133) | ||||||
|
|
|
|
|
|||||
| Deferred tax asset, after valuation allowance |
1,695 | 2,189 | ||||||
| Deferred tax liabilities |
||||||||
| Investments, including derivatives |
573 | 1,166 | ||||||
| Net unrealized gains on AFS |
— | 339 | ||||||
| VOBA |
372 | 354 | ||||||
| Deferred acquisition costs |
98 | 81 | ||||||
| Other |
46 | 29 | ||||||
|
|
|
|
|
|||||
| Total deferred tax liability |
1,089 | 1,969 | ||||||
|
|
|
|
|
|||||
| Net deferred tax asset |
$ | 606 | $ | 220 | ||||
|
|
|
|
|
|||||
At December 31, 2015, we have gross deferred tax assets associated with U.S. federal and state net operating losses of $448 million, which will begin to expire in 2022.
The valuation allowance consists of the following:
| December 31, | ||||||||
| (In millions) | 2015 | 2014 | ||||||
| U.S. federal and state net operating losses |
$ | 100 | $ | 92 | ||||
| U.S. other deferred tax assets |
27 | 41 | ||||||
| German other deferred tax assets |
66 | — | ||||||
|
|
|
|
|
|||||
| Total valuation allowance |
$ | 193 | $ | 133 | ||||
|
|
|
|
|
|||||
AHL and its Bermuda subsidiaries file protective U.S. income tax returns and its U.S. subsidiaries file income tax returns with the U.S. federal government and various U.S. state governments. AADE is not subject to U.S. federal and state examinations by tax authorities for years prior to 2007, while Athene Annuity & Life Assurance Company of New York (AANY) and Athene Life Insurance Company (ALIC) are not subject to examinations for years prior to 2012. IRS examinations for Aviva USA and subsidiaries have been completed for all tax years prior to 2011. We have protested certain unfavorable adjustments related to tax years 2008 through 2010 for
F-89
Table of Contents
ATHENE HOLDING LTD.
Notes to Consolidated Financial Statements
Aviva USA. We do not believe any tax payments resulting from these examinations will materially impact the Company’s effective tax rate or net income. Additionally, Aviva plc, the former parent company of Aviva USA, would be obligated to pay any additional tax. The IRS is currently auditing the 2011 through 2013 consolidated tax returns filed by Aviva USA. The burden of any proposed adjustments for tax periods, or portions thereof, ending on or prior to the acquisition would be borne by Aviva plc. No material proposed adjustments have been issued with respect to this exam.
Under current Bermuda law, we are not required to pay any taxes in Bermuda on either income or capital gains. We have received an undertaking from the Minister of Finance in Bermuda that, in the event of any such taxes being imposed, the Company will be exempted from taxation until the year 2035.
Withholding taxes have not been provided on undistributed earnings of AHL’s U.S. and German subsidiaries as of December 31, 2015, or 2014. Although withholding taxes may apply in the event a dividend is paid by AHL’s U.S. or German subsidiaries, we have not accrued withholding taxes as we do not intend to remit these earnings. The cumulative amount subject to withholding tax, if distributed, as well as the determination of the associated tax liability, is not practicable to compute; however, it may be material to the Company’s financial position and results of operations. Any dividends remitted to AHL from ALRe are not subject to withholding tax.
18. Statutory Requirements
AHL’s insurance and reinsurance subsidiaries are subject to insurance laws and regulations in the jurisdictions in which they operate including Bermuda, all 50 states in the United States, and the District of Columbia. Certain regulations include restrictions that limit the dividends or other distributions, such as loans or cash advances, available to shareholders without prior approval of the insurance regulatory authorities. The differences between financial statements prepared for insurance regulatory authorities and GAAP financial statements vary by jurisdiction.
Bermuda statutory requirements—ALRe is licensed by the Bermuda Monetary Authority (BMA) as a long term insurer and is subject to the Insurance Act 1978, as amended (Bermuda Insurance Act) and regulations promulgated thereunder. The statutory financial statements of ALRe are prepared in accordance with the Bermuda Insurance Act, as well as directions issued by the BMA. Under the Bermuda Insurance Act, ALRe is required to maintain minimum statutory capital and surplus equal to the greater of a minimum solvency margin (MSM) and the Enhanced Capital Requirement (ECR). The MSM is equal to the greater of $8 million or 2% of the first $500 million of assets plus 1.5% of assets above $500 million and the ECR is calculated based on either an internally developed risk-based capital model or a standard risk-based capital model developed by the BMA. At December 31, 2015, the MSM and ECR were $723 million and $1,751 million, respectively.
Under the Bermuda Insurance Act, ALRe is prohibited from paying a dividend in an amount exceeding 25% of the prior year’s statutory capital and surplus, unless at least two members of ALRe’s board of directors sign and submit to the BMA, an affidavit attesting that a dividend in excess of this amount would not cause ALRe to fail to meet its relevant margins. In certain instances, ALRe would also be required to provide prior notice to the BMA in advance of the payment of dividends. In the event that such an affidavit is submitted to the BMA in accordance with the Bermuda Insurance Act, and further subject to ALRe meeting its MSM and ECR, ALRe is permitted to distribute up to the sum of 100% of statutory surplus and an amount less than 15% of statutory capital. Distributions in excess of this amount require the approval of the BMA. As of December 31, 2015, and 2014, the maximum distribution ALRe was permitted to pay AHL without the need for prior approval was $3,529 million and $3,068 million, respectively.
F-90
Table of Contents
ATHENE HOLDING LTD.
Notes to Consolidated Financial Statements
The BMA has granted ALRe permission to use amortized cost instead of fair value as the basis for non-equity securities, including investments underlying funds withheld and modco reinsurance agreements. Excluded from ALRe’s statutory returns were $162 million of unrealized losses and $1,255 million of unrealized gains as of December 31, 2015, and 2014, respectively.
Germany statutory requirements—Athene Lebensversicherung AG (ALV) and Athene Pensionskasse AG (APK) (collectively, the life entities of ADKG) are regulated by the Federal Financial Supervisory Authority of Germany (BaFin) as private insurance undertakings and are subject to the Insurance Supervision Act and regulations promulgated thereunder. The life entities of ADKG are required to maintain minimum statutory capital as calculated against reserves; however, we are permitted to use dividend payable balances held for policyholder participation in determining the total capital of the respective life entity. The following table demonstrates the capital requirements of each life entity:
| December 31, 2015 | ||||||||
| (In millions) | Required Capital (Solvency I) |
Solvency I Ratio | ||||||
| ALV |
$ | 195 | 166.8 | % | ||||
| APK |
3 | 138.6 | % | |||||
The life entities of ADKG are restricted as to the payment of dividends pursuant to calculations, which are based upon the analysis of current euro swap rates against existing policyholder guarantees. As of December 31, 2015, the life entities of ADKG individually and collectively did not exceed this threshold and no amounts were available for distribution.
U.S. statutory requirements—AHL’s regulated U.S. subsidiaries and the corresponding insurance regulatory authorities are as follows:
| Subsidiary | Regulatory Authority | |
| AADE | Delaware Department of Insurance | |
| ALIC | Delaware Department of Insurance | |
| AANY | New York Department of Financial Services | |
| Athene Life Insurance Company of New York (ALICNY) | New York Department of Financial Services | |
| AAIA | Iowa Insurance Division | |
| Structured Annuity Reinsurance Company (STAR) | Iowa Insurance Division | |
| Athene Re USA IV | State of Vermont Department of Financial Regulation |
Each entity’s statutory statements are presented on the basis of accounting practices determined by the respective regulatory authority. The regulatory authority recognizes only statutory accounting practices prescribed or permitted by the corresponding state for determining and reporting the financial condition and results of operations of an insurance company and for determining its solvency under insurance law.
The maximum dividend these subsidiaries can pay to shareholders, without prior approval of the respective state insurance department, is subject to restrictions relating to statutory surplus or net gain from operations. The maximum dividend payment over a twelve-month period may not, without prior approval, be paid from a source other than earned surplus and may not exceed the greater of (1) the prior year’s net gain from operations or (2) 10% of policyholders’ surplus. Based on these restrictions, the maximum dividend AADE could pay to Athene USA, and ultimately to AHL’s shareholders, absent regulatory approval was $125 million as of December 31, 2015. Other requirements limit the amount that could be withdrawn from AADE and the
F-91
Table of Contents
ATHENE HOLDING LTD.
Notes to Consolidated Financial Statements
maximum AADE could dividend while staying in compliance with these state regulations was $65 million as of December 31, 2015. No other subsidiaries could pay a dividend to AHL as of December 31, 2015, without prior regulatory approval.
As of December 31, 2015, AHL’s U.S. subsidiaries’ solvency, liquidity, and risk-based capital amounts were significantly in excess of the minimum levels required.
In some instances, the states of domicile of our U.S. subsidiaries have adopted prescribed accounting practices that differ from the required accounting outlined in NAIC Statutory Accounting Principles (SAP). These subsidiaries also have certain accounting practices permitted by the states of domicile that differ from those found in NAIC SAP. These prescribed and permitted practices are described as follows:
AAIA – Among the products issued by AAIA are indexed universal life insurance and fixed indexed annuities. These products allow a portion of the premium to earn interest based on certain indices, primarily the S&P 500. We purchase call options, futures, and variance swaps to hedge the growth in interest credited to the customer as a direct result of increases in the related index. The Iowa Insurance Division allows an insurer to elect to recognize changes in the fair value of derivative instruments purchased to hedge indexed products in the statutory statement of operations. AAIA has elected this option for its futures and variance swaps. Application of this option does not impact AAIA’s statutory surplus.
Additionally, the Iowa Insurance Division allows an insurer to elect (1) to use an amortized cost method to account for certain derivative instruments, such as call options, purchased to hedge the growth in interest credited to the customer on indexed insurance products and (2) to use an indexed annuity reserve calculation methodology under which call options associated with the current index interest crediting term are valued at zero. AAIA has elected to apply this option to its over-the-counter call options and reserve liabilities. As a result, AAIA’s statutory surplus increased by $14 million and $85 million as of December 31, 2015, and 2014, respectively.
The NAIC requires annuities issued by life insurance companies on or after January 1, 2015, to use the 2012 Individual Annuity reserving (IAR) Mortality Table. During 2015, the Iowa Insurance Division set an alternative effective date of January 1, 2016 for adoption of the 2012 IAR Mortality Table. AAIA has chosen to use the Annuity 2000 Mortality Table for annuities issued between January 1, 2015, and December, 31, 2015. As a result, AAIA’s statutory surplus increased by $3 million as of December 31, 2015. This prescribed practice had no impact to any period prior to 2015.
Athene Re USA IV – AAIA has ceded the AmerUs Closed Block to Athene Re USA IV on a 100% funds withheld basis. A permitted practice in the State of Vermont allows Athene Re USA IV to include as admitted assets the face amount of all issued and outstanding letters of credit used to fund its reinsurance obligations to AAIA in its statutory financial statements. If Athene Re USA IV had not followed this permitted practice, then it would not have exceeded authorized control level risk based capital requirements. At December 31, 2015, the face amount of the letters of credit is $153 million.
F-92
Table of Contents
ATHENE HOLDING LTD.
Notes to Consolidated Financial Statements
Statutory capital and surplus and net income (loss)—The following table presents, for each of the our insurance subsidiaries, the statutory capital and surplus and the statutory net income (loss), based on the most recently filed statutory financial statements filed with insurance regulators:
| Statutory Capital & Surplus | Statutory Net Income (Loss) | |||||||||||||||||||
| December 31, | Years ended December 31, | |||||||||||||||||||
| (In millions) | 2015 | 2014 | 2015 | 2014 | 2013 | |||||||||||||||
| ALRe |
$ | 5,650 | $ | 4,048 | $ | 461 | $ | 632 | $ | 2,704 | ||||||||||
| AADE |
1,251 | 1,154 | 68 | 116 | 50 | |||||||||||||||
| ALIC |
77 | 76 | 1 | 1 | 1 | |||||||||||||||
| AANY |
208 | 168 | 8 | 7 | 12 | |||||||||||||||
| ALICNY |
73 | 55 | 14 | 88 | (108) | |||||||||||||||
| AAIA |
1,109 | 1,040 | 597 | 263 | 43 | |||||||||||||||
| STAR |
76 | 74 | 4 | 35 | (56) | |||||||||||||||
| Athene Re USA IV |
38 | 39 | 1 | 6 | 18 | |||||||||||||||
| ALV1 |
325 | N/A | 8 | N/A | N/A | |||||||||||||||
| APK1 |
4 | N/A | 1 | N/A | N/A | |||||||||||||||
N/A – Not applicable due to acquisition in 2015.
| 1 | Note that capital includes dividend balances accrued for policyholder participation. |
19. Related Parties
Athene Asset Management
Investment related expenses – Substantially all of our investments, with the exception of ADKG, are managed by AAM, a subsidiary of AGM. AAM provides direct investment management, asset allocation, mergers and acquisition asset diligence, and certain operational support services for our investment portfolio, including investment compliance, tax, legal, and risk management support. As of December 31, 2015, AAM directly manages $47,441 million of our investment portfolio assets, of which 82.7% are rated one or two by the NAIC. For certain assets which require specialized sourcing and underwriting capabilities, AAM has chosen to mandate sub-advisors rather than building out in-house capabilities. For the services related to these investments, AAM earns a fee of 0.40% per annum on all assets managed in accounts owned by or related to the Company, including sub-advised assets but excluding assets of ADKG and certain other limited exceptions. Additionally, AAM recharges the sub-advisory fees to the Company.
AAM has entered into a Master Sub-Advisory Agreement (MSAA) with certain Apollo affiliates to sub-advise AAM with respect to a portion of our assets, with the fees recharged to us, in addition to the gross fee of 0.40% per annum paid to AAM as described above. The MSAA covers services rendered by Apollo-affiliated sub-advisors relating to investments in certain asset classes, primarily CLO, CMBS, and ABS.
F-93
Table of Contents
ATHENE HOLDING LTD.
Notes to Consolidated Financial Statements
The following represents the assets sub-advised by Apollo affiliates:
| December 31, | ||||||||
| (In millions, except for percentages) | 2015 | 2014 | ||||||
| Fixed maturity securities |
||||||||
| U.S. state, municipals, and political subdivisions |
$ | 10 | $ | 147 | ||||
| Foreign governments |
107 | — | ||||||
| Corporate |
1,435 | 1,146 | ||||||
| CLO |
4,339 | 3,431 | ||||||
| ABS |
1,746 | 1,478 | ||||||
| CMBS |
1,010 | 845 | ||||||
| RMBS |
21 | 21 | ||||||
| Mortgage loans |
1,594 | 1,329 | ||||||
| Investment funds |
21 | 19 | ||||||
| Trading securities |
207 | 146 | ||||||
| Funds withheld at interest |
1,182 | 1,136 | ||||||
| Other investments |
83 | 56 | ||||||
|
|
|
|
|
|||||
| Total assets |
$ | 11,755 | $ | 9,754 | ||||
|
|
|
|
|
|||||
| Percent of total AAM managed Company assets |
20% | 16% | ||||||
Apollo Asset Management Europe
Investments of ADKG are managed internally. In addition, ADKG has entered into an investment advisory agreement with Apollo Asset Management Europe (AAME), also a subsidiary of AGM, pursuant to which AAME provides advisory services for a significant portion of our ADKG investment portfolio. In providing these services, AAME has access to Apollo’s European expertise and capabilities. The ADKG investments sub-advised by AAME consist primarily of corporate and sovereign bonds, as opposed to the more diverse range of securities managed by AAM. As compensation for the investment advisory services rendered, AAME receives a fee of 0.10% per year on the assets it sub-advises.
Pursuant to a new advisory agreement dated March 1, 2016, certain ADKG asset categories are no longer sub-advised by AAME. The new agreement has the same fee rate but excludes certain assets. These excluded assets are operating cash, mortgage loans secured by residential and commercial properties that are not identified and advised by AAME, assets related to unit-linked policies, and assets held in German special investment funds managed or advised by Apollo, AAME, AAM, or any of their respective affiliates, to the extent that such entity receives a management or advisory fee in connection with the fund. The previous advisory agreement excluded only assets related to unit-linked policies.
The following represents the assets sub-advised by AAME:
| (In millions) | December 31, 2015 | |||
| Fixed maturity securities |
||||
| Foreign governments |
$ | 2,349 | ||
| Corporate |
1,607 | |||
| Mortgage loans |
139 | |||
| Other investments |
961 | |||
|
|
|
|||
| Total assets |
$ | 5,056 | ||
|
|
|
|||
F-94
Table of Contents
ATHENE HOLDING LTD.
Notes to Consolidated Financial Statements
The following summarizes the asset management fees and sub-advisory fees we have incurred related to AAM, AAME, and other Apollo affiliates:
| Years ended December 31, | ||||||||||||
| (In millions) | 2015 | 2014 | 2013 | |||||||||
| Asset management fees |
$ | 226 | $ | 222 | $ | 103 | ||||||
| Sub-advisory fees |
42 | 36 | 20 | |||||||||
The management and sub-advisory fees are included within the net investment income line on the consolidated statements of income. The management fees payable as of December 31, 2015, and 2014, were $35 million and $30 million, respectively. The sub-advisory fees payable as of December 31, 2015, and 2014, were $24 million and $35 million, respectively.
In addition, we have invested in various investment funds managed by related parties, as discussed in Note 6 –Variable Interest Entities, that pay management fees and carried interest, as applicable, to Apollo entities. To the extent these investment funds have been consolidated, fees are included in net investment income on the consolidated statements of income. Allocations of carried interest to the general partner were made based on unrealized gains and losses within the fund and are reflected in net income attributable to noncontrolling interests on the consolidated statements of income. The following summarizes the management fees and carried interest reported:
| Years ended December 31, | ||||||||||||
| (In millions) | 2015 | 2014 | 2013 | |||||||||
| Management fees of consolidated investment funds |
$ | 6 | $ | 10 | $ | 15 | ||||||
| Carried interest allocation |
16 | 8 | 81 | |||||||||
The investment management or advisory agreements with AAM or AAME have no stated term and any party can terminate upon notice. However, our bye-laws provide that we will not exercise our termination rights under the agreements, except that any agreement may only be terminated on October 31, 2018, or any third anniversary thereafter. Any termination on that date without cause requires (1) approval of our board of directors and the holders of our common shares that hold a majority of total voting power (giving effect to the voting allocation provisions set forth in our bye-laws) and (2) six months’ prior written notice to AAM or AAME of termination. We may terminate the investment management agreement for cause, with the approval of our board of directors.
Because the Apollo Group has a significant voting interest in us, in order to protect against potential conflicts of interest resulting from transactions that we have entered, and will continue to enter into with the Apollo Group, our board of directors has formed a conflicts committee, consisting of five of our directors who are not officers or employees of any member of the Apollo Group, other than us. The conflicts committee reviews and a majority of the committee members must approve certain material transactions between us and the Apollo Group, subject to certain exceptions.
Service fees – We have entered into shared services agreements with AAM. Under these agreements, we and AAM make available to each other certain personnel and services. Expenses for the services are based on the amount of time spent on the affairs of the other party, in addition to actual expenses incurred and certain cost reimbursements. For the years ended December 31, 2015, 2014, and 2013, net expenses allocated from (to) AAM under these agreements were $2 million, $(13) million, and $16 million, respectively. The Company had $2 million of net expenses payable to AAM as of December 31, 2015, and $4 million of net expenses receivable from AAM as of December 31, 2014.
F-95
Table of Contents
ATHENE HOLDING LTD.
Notes to Consolidated Financial Statements
Other AGM Affiliates
Contribution agreement – In 2012, in order to provide pre-funding for and increase certainty to close future acquisitions, AAA Guarantor – Athene, L.P. and its subsidiary, Apollo Life Re Ltd. (collectively, the AAA Investor), together the largest single investor in the Company at the time, and certain other parties entered into a Contribution Agreement. The AAA Investor contributed investment assets to the Company in exchange for our Class B shares, a promissory note, and cash. A portion of the purchase price for 1,509,091 Class B shares was initially held back pending the transfer of certain assets requiring regulatory approval; and, these shares were subsequently issued in 2013 after the required approvals were received. The Company partially repaid $62 million of the promissory note in cash. The Company paid the note in full during the third quarter of 2014 through the issuance of Class B shares.
Transaction Advisory Services Agreement (TASA) – Since our founding, Apollo has provided a diverse array of services in order to grow our balance sheet, source, underwrite, and integrate transactions and has provided us access to their infrastructure. Through October 30, 2012, we had a standard 10-year monitoring contract with Apollo Alternative Assets, L.P., Apollo Management Holdings, L.P. and Apollo Global Securities, LLC (collectively, the Apollo TASA Parties) for these services that required cash payment of a quarterly monitoring fee of 0.50% of our capital and surplus, as defined, plus out of pocket expenses, with a termination date of July 15, 2019.
As we began to implement public company readiness initiatives in late 2012, both parties voluntarily agreed to an early termination of the monitoring contract. In exchange for early termination of the monitoring contract, Apollo received settlement fees on a quarterly basis from January 1, 2013, to December 31, 2014. Also, to promote alignment between Apollo and Athene’s shareholders and to preserve cash to support Athene’s growth plan, Apollo elected to receive its settlement fees under the agreement in shares of Athene rather than cash.
On January 1, 2013, we entered into an equity swap transaction with Apollo in connection with the termination of the quarterly monitoring fee discussed above. Pursuant to this swap, the quarterly settlement amount continued to accrue to Apollo, but the payment of those amounts (whether in stock or cash) would not be made to Apollo until the earlier of the time when Apollo was no longer deemed to control the Company within the meaning of the derivative instrument delivered pursuant to the TASA and October 31, 2017.
In April 2014, as a result of the external capital raise, Apollo was no longer deemed to control the Company (as defined under the swap) and, as a result, the swap was settled in stock for settlement amounts owed through that date.
Additionally, in April 2014, we further amended the TASA to exclude from capital and surplus, on which the quarterly monitoring fee was calculated, the capital received in the April 2014 capital raise, and any capital raised in connection with certain potential future acquisitions as defined in the amended TASA.
The total costs incurred pursuant to the TASA, including direct expenses, were $228 million and $134 million for the years ended December 31, 2014, and 2013, respectively, and are recorded in policy and other operating expenses on the consolidated statements of income. The total liability outstanding was fully settled as of December 31, 2014, and no additional fees will accrue under TASA.
Other related party transactions—In 2015, we entered into a loan purchase agreement with AmeriHome Mortgage Company, LLC (AmeriHome), an investee of A-A Mortgage, an equity method investee. The agreement allows us to purchase certain residential mortgage loans which they have purchased from correspondent sellers and pooled for sale in the secondary market. AmeriHome retains the servicing rights to the sold loans. We have purchased $83 million of residential mortgage loans under this agreement during the year ended December 31, 2015.
F-96
Table of Contents
ATHENE HOLDING LTD.
Notes to Consolidated Financial Statements
20. Commitments and Contingencies
Contingent Commitments—The Company had commitments to make additional capital contributions to certain investment funds of $825 million and $833 million as of December 31, 2015, and 2014, respectively. The Company expects most of its current commitments will be invested over the next five years; however, these commitments could become due any time upon counterparty request.
Funding Agreements—ALIC and AAIA are members of the Federal Home Loan Bank (FHLB) of Indianapolis and Des Moines, respectively. Through membership, we have issued funding agreements with a carrying value of $1,112 million and $1,271 million as of December 31, 2015, and 2014, respectively, to the FHLB in exchange for cash advances. We are required to provide collateral equal to the funding agreements, considering any discounts to the securities posted and prepayment penalties. See below detail of assets restricted under these agreements.
In the second quarter of 2015, AAIA and AADE entered into a purchase agreement, pursuant to which Athene Global Funding, a special purpose, non-affiliated statutory-trust may offer up to $5 billion of its senior secured medium-term notes, under a funding agreement backed notes (FABN) program. Athene Global Funding uses the net proceeds from each sale to purchase one or more funding agreements from either AAIA or AADE. Funding agreements issued under this program have a carrying value of $250 million as of December 31, 2015.
Pledged Assets and Funds in Trust (Restricted Assets)—The total restricted assets included on the consolidated balance sheets are as follows:
| December 31, | ||||||||
| (In millions) | 2015 | 2014 | ||||||
| AFS securities |
||||||||
| Fixed maturity |
$ | 1,865 | $ | 2,136 | ||||
| Equity |
56 | 62 | ||||||
| Investment funds |
27 | 25 | ||||||
| Mortgage loans |
1,134 | 1,261 | ||||||
| Restricted cash |
116 | 77 | ||||||
|
|
|
|
|
|||||
| Total restricted assets |
$ | 3,198 | $ | 3,561 | ||||
|
|
|
|
|
|||||
The restricted assets are primarily a result of the FHLB funding agreements described above. Additionally, AADE has established reinsurance trusts of assets equal to statutory reserves, plus an additional amount of assets, as a result of coinsurance agreements with Transamerica described in Note 9 – Reinsurance.
Litigation, Claims, and Assessments—On June 12, 2015, a putative class action complaint was filed in the United States District Court, Northern District of California against the Company, AAM, and AGM. The complaint, which is similar to complaints recently filed against other large insurance companies, primarily alleges that captive reinsurance and other transactions had the effect of misrepresenting the financial condition of AAIA. The complaint purports to be brought on behalf of a class of purchasers of annuity products issued by AAIA between 2007 and the present. There are also various allegations related to the purchase of Aviva USA and concerning entry into a modified coinsurance transaction with ALRe in October 2013. The suit asserts claims of violation of the Racketeer Influenced and Corrupt Organizations Act and seeks compensatory damages, trebled, in an amount to be determined, costs, and attorneys’ fees. On March 25, 2016, our motion to transfer to the United States District Court, Southern District of Iowa was granted. We believe that we have meritorious defenses to the claims set forth in the complaint and intend to vigorously defend the litigation. In light of the inherent uncertainties involved in this matter, reasonably possible losses, if any, cannot be estimated at this time.
F-97
Table of Contents
ATHENE HOLDING LTD.
Notes to Consolidated Financial Statements
On July 27, 2015, a putative class action complaint was filed in the United States District Court, District of Massachusetts, against us. An amended complaint was filed on December 18, 2015. The complaint alleges a putative class action on behalf of all persons who are the beneficial owners of assets which were used to purchase structured settlement annuities that Aviva London Assignment Corporation, Aviva Life Insurance Company, and CGU International Insurance, plc (Aviva Entities) or their predecessors, as applicable, delivered to purchasers on or after April 1, 2003. The complaint alleges that the Aviva Entities sold structured settlement annuities to the public on the basis that such products were backed by a capital maintenance agreement by CGU International Insurance, plc, which was alleged as a source of great financial strength. The complaint further alleges that the Aviva Entities used this capital maintenance agreement to enhance the sales volume and raise the price of the annuities. The complaint claims that, as a result of Aviva USA’s sale to AHL, the capital maintenance agreement terminated. According to the complaint, no notice was provided to the owners of the structured settlement annuities and the termination of the capital maintenance agreement constituted a breach of contract and the plaintiffs further assert other causes of action. AHL is a named defendant due to its purchase of Aviva USA, and AAIA and Athene London Assignment are named as successors to Aviva Life Insurance Company and Aviva London Assignment Corporation, respectively. We believe that we have meritorious defenses to the claims set forth in the complaint and intend to vigorously defend the litigation. In light of the inherent uncertainties involved in this matter, reasonably possible losses, if any, cannot be estimated at this time.
21. Segment Information
We operate our core business strategies out of one reportable segment, Retirement Services. In addition to Retirement Services, we report certain other operations in Corporate and Other.
Retirement Services—Retirement Services is comprised of our United States and Bermuda operations which issue and reinsure retirement savings products and institutional products. Retirement Services has retail operations, which provide annuity retirement solutions to our policyholders. Retirement Services also has reinsurance operations, which reinsure multi-year guaranteed annuities, fixed indexed annuities, traditional one-year guarantee fixed deferred annuities, immediate annuities, and institutional products from our reinsurance partners. In addition, our FABN program is included in our Retirement Services segment.
Corporate and Other—Corporate and Other includes certain other operations related to our corporate activities and our German operations, which is primarily comprised of participating long-duration savings products. In addition to our German operations, included in Corporate and Other are corporate allocated expenses, merger and acquisition costs, debt costs, certain integration and restructuring costs, certain stock-based compensation, and intersegment eliminations. In Corporate and Other, we also hold the capital in excess of the level of capital we hold in Retirement Services to support our operating strategy.
Financial Measures—Segment operating income, net of tax, and net investment income are internal measures used by the chief operating decision maker to evaluate and assess the results of our segments.
F-98
Table of Contents
ATHENE HOLDING LTD.
Notes to Consolidated Financial Statements
Operating revenue is a component of operating income, net of tax, and excludes market volatility and adjustments for other non-operating activity. Our operating revenue equals the total revenue of the Company, adjusted to eliminate the impact of the following non-operating adjustments:
| • | Investment gains (losses), net of offsets; |
| • | Change in fair values of derivatives and embedded derivatives – index annuities, net of offsets; |
| • | VIE expenses and noncontrolling interest |
| • | Bargain purchase gain; and |
| • | Other adjustments to revenues. |
The table below reconciles segment operating revenues to total revenues presented on the consolidated statements of income:
| Years ended December 31, | ||||||||||||
| (In millions) | 2015 | 2014 | 2013 | |||||||||
| Operating revenue by segment |
||||||||||||
| Retirement Services |
$ | 2,977 | $ | 2,834 | $ | 315 | ||||||
| Corporate and Other |
112 | 55 | 367 | |||||||||
|
|
|
|
|
|
|
|||||||
| Total segment operating revenues |
3,089 | 2,889 | 682 | |||||||||
|
|
|
|
|
|
|
|||||||
| Non-operating adjustments |
||||||||||||
| Investment gains (losses), net of offsets |
(132) | 298 | 20 | |||||||||
| Change in fair values of derivatives and embedded derivatives – index annuities, net of offsets |
(390) | 814 | 772 | |||||||||
| VIE expenses and noncontrolling interest |
33 | 79 | 117 | |||||||||
| Bargain purchase gain |
— | — | 152 | |||||||||
| Other adjustments to revenues |
16 | 20 | 6 | |||||||||
|
|
|
|
|
|
|
|||||||
| Total non-operating adjustments |
(473) | 1,211 | 1,067 | |||||||||
|
|
|
|
|
|
|
|||||||
| Total revenues |
$ | 2,616 | $ | 4,100 | $ | 1,749 | ||||||
|
|
|
|
|
|
|
|||||||
Operating income, net of tax, is an internal measure used to evaluate our financial performance excluding market volatility and expenses related to integration, restructuring, stock compensation, and other expenses. Our operating income, net of tax, equals net income available to AHL’s shareholders adjusted to eliminate the impact of the following non-operating adjustments:
| • | Investment gains (losses), net of offsets; |
| • | Change in fair values of derivatives and embedded derivatives – index annuities, net of offsets; |
| • | Integration, restructuring and other non-operating expenses; |
| • | Stock compensation expense; |
| • | Bargain purchase gain; and |
| • | Provision for income taxes – non-operating. |
F-99
Table of Contents
ATHENE HOLDING LTD.
Notes to Consolidated Financial Statements
The table below reconciles segment operating income, net of tax, to net income available to Athene Holding Ltd. shareholders presented on the consolidated statements of income:
| Years ended December 31, | ||||||||||||
| (In millions) | 2015 | 2014 | 2013 | |||||||||
| Operating income, net of tax by segment |
||||||||||||
| Retirement Services |
$ | 769 | $ | 764 | $ | 416 | ||||||
| Corporate and other |
(29) | 29 | 361 | |||||||||
|
|
|
|
|
|
|
|||||||
| Total segment operating income, net of tax |
740 | 793 | 777 | |||||||||
|
|
|
|
|
|
|
|||||||
| Non-operating adjustments |
||||||||||||
| Investment gains (losses), net of offsets |
(56) | 151 | (4) | |||||||||
| Change in fair values of derivatives and embedded derivatives – index annuities, net of offsets |
(27) | (30) | 154 | |||||||||
| Integration, restructuring and other non-operating expenses |
(58) | (279) | (184) | |||||||||
| Stock compensation expense |
(67) | (148) | — | |||||||||
| Bargain purchase gain |
— | — | 152 | |||||||||
| Provision for income taxes – non-operating |
30 | (24) | 21 | |||||||||
|
|
|
|
|
|
|
|||||||
| Total non-operating adjustments |
(178) | (330) | 139 | |||||||||
|
|
|
|
|
|
|
|||||||
| Net income available to AHL shareholders |
$ | 562 | $ | 463 | $ | 916 | ||||||
|
|
|
|
|
|
|
|||||||
F-100
Table of Contents
ATHENE HOLDING LTD.
Notes to Consolidated Financial Statements
Net investment income used to evaluate the performance of our segments is an internal measure that does not correspond to GAAP net investment income. Adjustments are made to GAAP net investment income to arrive at a net investment income measure that reflects the profitability of our core deferred annuities business. Accordingly, we adjust net investment income to include earnings from our consolidated VIEs and earnings on certain alternative investments (primarily CLOs) classified in investment related gains (losses) on the consolidated statements of income. Additionally, impacts of reinsurance embedded derivatives on net investment income are removed. The table below reconciles segment net investment income to net investment income presented on the consolidated statements of income:
| Years ended December 31, | ||||||||||||
| (In millions) | 2015 | 2014 | 2013 | |||||||||
| Net investment income by segment |
||||||||||||
| Retirement Services |
$ | 2,572 | $ | 2,483 | $ | 1,363 | ||||||
| Corporate and Other |
36 | 55 | 367 | |||||||||
|
|
|
|
|
|
|
|||||||
| Total segment net investment income |
2,608 | 2,538 | 1,730 | |||||||||
| Adjustments to net investment income |
||||||||||||
| Reinsurance embedded derivative impacts |
(84) | (67) | (156) | |||||||||
| Net VIE earnings |
(67) | (146) | (535) | |||||||||
| Alternative income gain (loss) |
42 | 4 | 22 | |||||||||
| Other |
9 | 12 | 13 | |||||||||
|
|
|
|
|
|
|
|||||||
| Total adjustments to arrive at net investment income |
(100) | (205) | (656) | |||||||||
|
|
|
|
|
|
|
|||||||
| Net investment income |
$ | 2,508 | $ | 2,333 | $ | 1,074 | ||||||
|
|
|
|
|
|
|
|||||||
Operating income, net of tax, excludes the tax impact of the taxable non-operating adjustments presented above. The tax impact of non-operating income adjustments is 35% of the non-operating adjustments subject to income tax. The table below reconciles segment provision for income taxes – operating to income tax expense presented on the consolidated statements of income:
| Years ended December 31, | ||||||||||||
| (In millions) | 2015 | 2014 | 2013 | |||||||||
| Provision for income taxes – operating by segment |
||||||||||||
| Retirement Services |
$ | 41 | $ | 30 | $ | 13 | ||||||
| Corporate and Other |
3 | — | — | |||||||||
|
|
|
|
|
|
|
|||||||
| Total segment income tax expense – operating |
44 | 30 | 13 | |||||||||
| Provision for income taxes – non-operating |
(30) | 24 | (21) | |||||||||
|
|
|
|
|
|
|
|||||||
| Income tax expense (benefit) |
$ | 14 | $ | 54 | $ | (8) | ||||||
|
|
|
|
|
|
|
|||||||
The following represents total assets by segment:
| December 31, | ||||||||||||
| (In millions) | 2015 | 2014 | 2013 | |||||||||
| Total assets by segment |
||||||||||||
| Retirement Services |
$ | 73,710 | $ | 81,606 | $ | 80,058 | ||||||
| Corporate and Other |
7,144 | 1,104 | 749 | |||||||||
|
|
|
|
|
|
|
|||||||
| Total assets |
$ | 80,854 | $ | 82,710 | $ | 80,807 | ||||||
|
|
|
|
|
|
|
|||||||
F-101
Table of Contents
ATHENE HOLDING LTD.
Notes to Consolidated Financial Statements
We market annuity products, primarily fixed rate and fixed indexed annuities. Deposits, which are generally not included in revenues on the consolidated statements of income, and premiums collected are as follows:
| Years ended December 31, | ||||||||||||
| (In millions) | 2015 | 2014 | 2013 | |||||||||
| Fixed indexed annuities |
$ | 2,808 | $ | 2,560 | $ | 1,148 | ||||||
| Fixed rate annuities |
883 | 323 | 362 | |||||||||
| Payouts without life contingencies |
166 | 163 | 68 | |||||||||
| Funding agreements |
250 | — | — | |||||||||
| Life and other deposits |
11 | 15 | 3 | |||||||||
|
|
|
|
|
|
|
|||||||
| Total deposits |
4,118 | 3,061 | 1,581 | |||||||||
|
|
|
|
|
|
|
|||||||
| Payouts with life contingencies |
53 | 32 | 25 | |||||||||
| Life and other premiums |
142 | 68 | (1,162) | |||||||||
|
|
|
|
|
|
|
|||||||
| Total premiums |
195 | 100 | (1,137) | |||||||||
|
|
|
|
|
|
|
|||||||
| Total premiums and deposits, net of ceded |
$ | 4,313 | $ | 3,161 | $ | 444 | ||||||
|
|
|
|
|
|
|
|||||||
Deposits and premiums collected by the geographical location are as follows:
| Years ended December 31, | ||||||||||||
| (In millions) | 2015 | 2014 | 2013 | |||||||||
| United States |
$ | 3,097 | $ | 2,810 | $ | 275 | ||||||
| Bermuda |
1,135 | 351 | 169 | |||||||||
| Germany |
81 | — | — | |||||||||
|
|
|
|
|
|
|
|||||||
| Total premiums and deposits, net of ceded |
$ | 4,313 | $ | 3,161 | $ | 444 | ||||||
|
|
|
|
|
|
|
|||||||
22. Subsequent Events
In connection with the reissuance of the consolidated financial statements, we have evaluated subsequent events through October 25, 2016, the date the consolidated financial statements were available to be reissued.
In January 2016, AAIA agreed to novate certain open blocks of business ceded to Accordia, that were in force as of January 1, 2016, in accordance with the terms of the coinsurance and assumption agreement. As a result of the novation, interest sensitive contract liabilities decreased $716 million, future policy benefits decreased $93 million, and reinsurance recoverable decreased $809 million.
In January 2016, we purchased a pool of loans sourced by MidCap FinCo and contemporaneously sold participation interests in the loans to a subsidiary of MidCap FinCo, receiving aggregate consideration of $24 million. The participation does not meet transfer requirements and, therefore, the full amount of the purchased loans are reflected in mortgage loans, and no gain or loss was recognized upon transfer. Amounts due to MidCap FinCo under the subordinated participation agreement are reflected as a secured borrowing in other liabilities on the consolidated balance sheets.
Events Subsequent to the Original Issuance of the Consolidated Financial Statements (Unaudited)—During 2016, we novated additional open blocks of business ceded to affiliates of Global Atlantic, that were in force as of January 1, 2016, in accordance with the terms of the coinsurance and assumption agreement. As a result of the additional novation, interest sensitive contract liabilities decreased $290 million, future policy benefits decreased $95 million, policy loans decreased $8 million, and reinsurance recoverable decreased $377 million.
F-102
Table of Contents
ATHENE HOLDING LTD.
Notes to Consolidated Financial Statements
On August 31, 2016, we completed a series of transactions with Apollo Commercial Real Estate Finance, Inc. (ARI), a related party managed by an affiliate of Apollo. Pursuant to an agreement between ARI and Apollo Residential Mortgage, Inc. (AMTG), another related party managed by an Apollo affiliate, AMTG merged with and into ARI, effective as of August 31, 2016. In accordance with an Asset Purchase and Sale Agreement between us and ARI, we purchased $1,090 million of primarily non-agency RMBS from ARI subsequent to its merger with AMTG. We also provided ARI with a secured short-term $175 million loan to consummate the merger, which was subsequently repaid with the proceeds of the sale of such RMBS. Finally, subsequent to the merger, we purchased $20 million of ARI shares of common stock pursuant to a stock purchase agreement that required such purchase if ARI’s common stock price fell below the per share price at which such shares were issued to AMTG stockholders during the 30 trading days following the closing of the merger, which provided for additional liquidity to ARI stockholders.
During the third quarter of 2016, we modified Class M-1, M-2, and M-3 share agreements to vest all Tranche 2 awards as of September 30, 2016; whereas, under the original agreement, Tranche 2 awards vested only when certain performance hurdles were met. We also amended the conversion option, which previously only allowed conversion subsequent to an Initial Public Offering (IPO). Under the modified conversion terms, individuals can elect one of three options including conversion at a specified date prior to an IPO, on the date of an IPO, or ratably each month for six months after an IPO. The modifications impacted 28 individuals. As a result of the modifications, as of September 30, 2016, we recorded an $83 million increase to additional paid-in capital, due to the reclassification from liability awards to equity awards. We also recorded an additional $42 million charge to stock-based compensation expense and additional paid-in capital for the vesting of Tranche 2 shares, primarily related to the acceleration of previously unrecognized compensation expense.
During the third quarter of 2016, the CMBS Funds each sold invested assets to fully settle the borrowings under their respective repurchase agreements. The remaining invested assets were distributed directly to the Company.
F-103
Table of Contents
Schedule I
Summary of Investments — Other Than Investments in Related Parties
| December 31, 2015 | ||||||||||||
| (In millions) | Cost | Fair Value | Amount Shown on Consolidated Balance Sheet |
|||||||||
| Fixed maturity securities: |
||||||||||||
| U.S government and agencies |
$ | 44 | $ | 45 | $ | 45 | ||||||
| U.S. state, municipals, and political subdivisions |
1,075 | 1,165 | 1,165 | |||||||||
| Foreign governments |
2,467 | 2,464 | 2,464 | |||||||||
| Public utilities |
4,234 | 4,221 | 4,221 | |||||||||
| Other corporate |
22,713 | 22,682 | 22,682 | |||||||||
| Collateralized loan obligations |
4,943 | 4,555 | 4,555 | |||||||||
| Asset-backed securities |
2,944 | 2,918 | 2,918 | |||||||||
| Commercial mortgage-backed securities |
1,725 | 1,738 | 1,738 | |||||||||
| Residential mortgage-backed securities |
8,050 | 7,995 | 7,995 | |||||||||
| Redeemable preferred stock |
32 | 33 | 33 | |||||||||
|
|
|
|
|
|
|
|||||||
| Total fixed maturity securities |
48,227 | 47,816 | 47,816 | |||||||||
| Equity securities: |
||||||||||||
| Banks, trust and insurance companies common stock |
30 | 62 | 62 | |||||||||
| Industrial, miscellaneous and all other common stock |
273 | 276 | 276 | |||||||||
| Nonredeemable preferred stocks |
64 | 69 | 69 | |||||||||
|
|
|
|
|
|
|
|||||||
| Total equity securities |
367 | 407 | 407 | |||||||||
|
|
|
|
|
|
|
|||||||
| Total available-for-sale securities |
48,594 | $ | 48,223 | 48,223 | ||||||||
|
|
|
|
|
|
|
|||||||
| Trading securities, at fair value |
2,457 | 2,468 | ||||||||||
| Mortgage loans, net of allowances |
5,498 | 5,500 | ||||||||||
| Investment funds |
629 | 733 | ||||||||||
| Policy loans |
642 | 642 | ||||||||||
| Funds withheld at interest |
3,482 | 3,482 | ||||||||||
| Derivative assets |
889 | 871 | ||||||||||
| Real estate |
569 | 566 | ||||||||||
| Short-term investments |
135 | 135 | ||||||||||
| Other investments |
83 | 83 | ||||||||||
|
|
|
|
|
|||||||||
| Total investments |
$ | 62,978 | $ | 62,703 | ||||||||
|
|
|
|
|
|||||||||
F-104
Table of Contents
Schedule II
Condensed Financial Information of Registrant
Balance Sheets — Parent Company Only
| December 31, | ||||||||
| (In millions, except share and per share data) | 2015 | 2014 | ||||||
| Assets |
||||||||
| Investments |
||||||||
| Available-for-sale, fixed maturity securities, at fair value (amortized cost: 2015 – $29 and 2014 – $293) |
$ | 31 | $ | 295 | ||||
| Cash and cash equivalents |
260 | 61 | ||||||
| Investments in related parties |
||||||||
| Available-for-sale, fixed maturity securities, at fair value (amortized cost: 2015 – $0 and 2014 – $38) |
— | 37 | ||||||
| Other assets |
11 | 20 | ||||||
| Note receivable from subsidiary |
20 | 100 | ||||||
| Intercompany receivable |
— | 19 | ||||||
| Investments in subsidiaries |
5,137 | 4,115 | ||||||
|
|
|
|
|
|||||
| Total assets |
$ | 5,459 | $ | 4,647 | ||||
|
|
|
|
|
|||||
| Liabilities |
||||||||
| Other liabilities |
$ | 97 | $ | 92 | ||||
|
|
|
|
|
|||||
| Total liabilities |
97 | 92 | ||||||
|
|
|
|
|
|||||
| Equity |
||||||||
| Common stock |
||||||||
| Class A – par value $0.001 per share; authorized: 2015 – 425,000,000 and 2014 – 425,000,000 shares; issued and outstanding: 2015 – 50,151,265 and 2014 – 15,752,736 shares |
— | — | ||||||
| Class B – par value $0.001 per share; authorized: 2015 – 325,000,000 and 2014 – 325,000,000 shares; issued and outstanding: 2015 – 135,963,975 and 2014 – 125,282,892 shares |
— | — | ||||||
| Class M-1 – par value $0.001 per share; authorized: 2015 – 7,109,560 and 2014 – 7,109,560 shares; issued and outstanding: 2015 – 5,198,273 and 2014 – 5,198,273 shares |
— | — | ||||||
| Class M-2 – par value $0.001 per share; authorized: 2015 – 5,000,000 and 2014 – 5,000,000 shares; issued and outstanding: 2015 – 3,125,869 and 2014 – 3,125,869 shares |
— | — | ||||||
| Class M-3 – par value $0.001 per share; authorized: 2015 – 7,500,000 and 2014 – 7,500,000 shares; issued and outstanding: 2015 – 3,110,000 and 2014 – 3,350,000 shares |
— | — | ||||||
| Class M-4 – par value $0.001 per share; authorized: 2015 – 7,500,000 and 2014 – 7,500,000 shares; issued and outstanding: 2015 – 5,038,443 and 2014 – 0 shares |
— | — | ||||||
| Additional paid-in capital |
3,281 | 2,153 | ||||||
| Retained earnings |
2,318 | 1,758 | ||||||
| Accumulated other comprehensive income (loss) (related party: 2015 – $(24) and |
(237) | 644 | ||||||
|
|
|
|
|
|||||
| Total Athene Holding Ltd. Shareholders’ equity |
5,362 | 4,555 | ||||||
|
|
|
|
|
|||||
| Total liabilities and equity |
$ | 5,459 | $ | 4,647 | ||||
|
|
|
|
|
|||||
See accompanying notes to the condensed financial statements
F-105
Table of Contents
Schedule II
Condensed Financial Information of Registrant
Statements of Income — Parent Company Only
| Years ended December 31, | ||||||||||||
| (In millions) | 2015 | 2014 | 2013 | |||||||||
| Revenue |
||||||||||||
| Net investment income (related party: 2015 - $(5), 2014 - $0 and 2013 - $(1) |
$ | — | $ | 8 | $ | 3 | ||||||
| Investment related gains (losses) |
— | — | 3 | |||||||||
| Bargain purchase gain |
— | — | 152 | |||||||||
|
|
|
|
|
|
|
|||||||
| Total revenues |
— | 8 | 158 | |||||||||
| Benefits and Expenses |
||||||||||||
| Other operating expenses (related party: 2015 – $16, 2014 – $253 and 2013 – $131) |
130 | 450 | 144 | |||||||||
| Interest expense |
— | 1 | 2 | |||||||||
|
|
|
|
|
|
|
|||||||
| Total benefits and expenses |
130 | 451 | 146 | |||||||||
|
|
|
|
|
|
|
|||||||
| Income (loss) before income taxes and equity earnings in subsidiaries |
(130) | (443) | 12 | |||||||||
| Provision for income taxes |
— | — | — | |||||||||
| Equity earnings in subsidiaries |
692 | 906 | 904 | |||||||||
|
|
|
|
|
|
|
|||||||
| Net income available to Athene Holding Ltd. shareholders |
562 | 463 | 916 | |||||||||
| Other comprehensive income (loss), after tax |
(881) | 574 | (149) | |||||||||
|
|
|
|
|
|
|
|||||||
| Comprehensive income available to Athene Holding Ltd. shareholders |
$ | (319) | $ | 1,037 | $ | 767 | ||||||
|
|
|
|
|
|
|
|||||||
See accompanying notes to the condensed financial statements
F-106
Table of Contents
Schedule II
Condensed Financial Information of Registrant
Statements of Cash Flows — Parent Company Only
| Years ended December 31, | ||||||||||||
| (In millions) | 2015 | 2014 | 2013 | |||||||||
| Net cash provided by operating activities |
$ | (82) | $ | 319 | $ | 648 | ||||||
|
|
|
|
|
|
|
|||||||
| Cash flows from investing activities |
||||||||||||
| Capital contributions to subsidiary |
(506) | (232) | (72) | |||||||||
| Acquisition of subsidiaries, net of cash acquired |
— | 33 | (570) | |||||||||
| Receipts on loans to subsidiaries |
188 | — | — | |||||||||
| Issuances of loans to subsidiaries |
(103) | (100) | — | |||||||||
| Investment in note receivable |
(5) | — | — | |||||||||
| Sales, maturities, and repayments of: |
||||||||||||
| Available-for-sale, fixed maturity securities |
17 | 9 | 74 | |||||||||
| Investment funds |
— | — | 9 | |||||||||
| Purchases of: |
||||||||||||
| Available-for-sale, fixed maturity securities (related party: 2015 – $0, 2014 – $(38) and 2013 – $0) |
(423) | (294) | (15) | |||||||||
| Investment funds |
— | — | — | |||||||||
|
|
|
|
|
|
|
|||||||
| Net cash used in investing activities |
(832) | (584) | (574) | |||||||||
|
|
|
|
|
|
|
|||||||
| Cash flows from financing activities |
||||||||||||
| Capital contributions |
1,116 | 305 | 82 | |||||||||
| Proceeds from note payables |
— | — | 500 | |||||||||
| Repayment of note payables |
— | (300) | (262) | |||||||||
| Repurchase of common stock |
(3) | (78) | — | |||||||||
| Deferred financing costs |
— | — | (9) | |||||||||
|
|
|
|
|
|
|
|||||||
| Net cash (used in) provided by financing activities |
1,113 | (73) | 311 | |||||||||
|
|
|
|
|
|
|
|||||||
| Net (decrease) increase in cash and cash equivalents |
199 | (338) | 385 | |||||||||
| Cash and cash equivalents at beginning of year |
61 | 399 | 14 | |||||||||
|
|
|
|
|
|
|
|||||||
| Cash and cash equivalents at end of year |
$ | 260 | $ | 61 | $ | 399 | ||||||
|
|
|
|
|
|
|
|||||||
| Supplementary information |
||||||||||||
| Cash paid for interest |
— | 1 | 1 | |||||||||
| Non-cash transactions |
||||||||||||
| Non-cash capital contribution to ALRe |
708 | — | — | |||||||||
| Issuance of capital for payment of liabilities |
2 | 199 | — | |||||||||
| Issuance of capital for purchase of investment funds |
— | — | 50 | |||||||||
See accompanying notes to the condensed financial statements
F-107
Table of Contents
Schedule II
Notes to Condensed Financial Information of Registrant
1. Basis of Presentation
The accompanying condensed financial statements of Athene Holding Ltd. (AHL) should be read in conjunction with the consolidated financial statements and the notes thereto (Consolidated Financial Statements) of AHL and its subsidiaries.
For purposes of these condensed financial statements, AHL’s wholly owned and majority owned subsidiaries are presented under the equity method of accounting. Under this method, the assets and liabilities of subsidiaries are not consolidated. The investments in subsidiaries are recorded on the condensed balance sheets. The income from subsidiaries is reported on a net basis as equity earnings of subsidiaries on the condensed statements of income.
2. Revisions
As discussed in Note 2 – Change in Accounting Policy and Revisions to the Consolidated Financial Statements, revisions were made to the Consolidated Financial Statements as a result of correcting immaterial misstatements. AHL revised its bargain purchase gain recorded during the year ended December 31, 2013 from $146 million to $152 million. The remaining revisions related to AHL’s subsidiaries. As the assets and liabilities of subsidiaries are not consolidated for purposes of these condensed financial statements, the adjustments to equity are consistent with those disclosed in Note 2 – Change in Accounting Policy and Revisions to the Consolidated Financial Statements, with the offset of these adjustments recorded to investments in subsidiaries. The total net income impact of these revisions was adjusted to equity earnings of subsidiaries on the condensed statements of income, and the adjustments to other comprehensive income are consistent with those disclosed in Note 2 –Change in Accounting Policy and Revisions to the Consolidated Financial Statements.
3. Intercompany Transactions
On December 15, 2014, Athene USA Corporation (Athene USA) issued an unsecured promissory note to AHL totaling $100 million due in June 2015, or earlier at AHL’s request. The loan was used by Athene USA to fund the restructuring of a wholly owned investment fund and carries an interest rate of 0.35% per annum. Interest was payable on a quarterly basis. In June 2015, the promissory note was amended to extend the due date to June 1, 2020, or earlier at AHL’s request. During 2015, a total of $80 million was repaid by Athene USA. As of December 31, 2015, $20 million remained outstanding on the loan. This loan was fully repaid by Athene USA on January 20, 2016. This intercompany transaction was eliminated upon consolidation.
On January 14, 2015, AHL entered into a facility agreement with Delta Lloyd Deutschland AG (DLD) whereby AHL agreed to make available to DLD a loan facility without a fixed term in the maximum principal amount of EUR 5 million. Interest accrues under the facility at a rate of 6-month Euribor. DLD withdrew EUR 5 million prior to the October 1, 2015 acquisition of DLD by AHL, and full payment was made on October 9, 2015. DLD’s withdrawal of the facility was not eliminated upon consolidation since it was prior to the acquisition, but the repayment of the loan was an intercompany transaction that eliminated upon consolidation.
On September 22, 2015, AHL entered into a loan agreement with Athene Deutschland Gmbh & Co. KG (ADKG), whereby AHL agreed to lend ADKG EUR 51 million to be used for the DLD acquisition. Interest accrued at a fixed rate of 1.5%, which was due and payable on the maturity date of the loan. The loan and interest accrued were due and fully repaid on October 9, 2015. This intercompany transaction was eliminated upon consolidation.
Certain costs were allocated between AHL and its subsidiaries. Total intercompany receivables arising from these allocations were $0 million and $19 million as of December 31, 2015 and 2014, respectively. This intercompany transaction was eliminated upon consolidation.
F-108
Table of Contents
Schedule II
Notes to Condensed Financial Information of Registrant
4. Debt and Guarantees
In 2013, AHL entered into a three-year revolving credit agreement (Credit Facility) with Citibank, N.A. as administrative agent. The amount available under the Credit Facility was $500 million. In connection with the Credit Facility, AHL guaranteed all of the obligations of ALRe and Athene USA. On January 22, 2016, we terminated the Credit Facility and entered into a five-year revolving credit agreement (Revolving Credit Facility) with Citibank, N.A., as administrative agent. The amount available under the Revolving Credit Facility is $1 billion. See Note 12 – Debt to our consolidated financial statements for further information.
5. Related parties
AHL pays investment management fees to Athene Asset Management (AAM), a related party, in relation to its portfolio of assets managed by AAM and assets held in certain subsidiary portfolios. In addition, AHL also pays service fees pursuant to a shared service agreement between AAM and AHL for various internal expenses AAM allocates to AHL. See Note 19 – Related Parties of the Consolidated Financial Statements for further information.
AHL entered into a Transaction Advisory Services Agreement (TASA) with Apollo, a related party until December 31, 2014. TASA required AHL to pay Apollo a quarterly monitoring fee. See Note 5 – Derivative Instruments and Note 19 – Related Parties of the Consolidated Financial Statements for further information.
6. Dividends and Return of Capital
AHL received cash dividends and returns of capital from the following subsidiaries:
| Years ended December 31, | ||||||||||||
| (In millions) | 2015 | 2014 | 2013 | |||||||||
| Athene Life Re Ltd. |
$ | — | $ | 350 | $ | 655 | ||||||
| Athene USA |
— | — | 3 | |||||||||
|
|
|
|
|
|
|
|||||||
| Total |
$ | — | $ | 350 | $ | 658 | ||||||
|
|
|
|
|
|
|
|||||||
F-109
Table of Contents
Schedule III
Supplementary Insurance Information
| DAC, DSI, and VOBA |
Future policy benefits, losses, claims and loss expenses(1) |
Other policy claims and benefits |
Premiums | Net investment income |
Benefits, claims, losses, and settlement expenses(2) |
Amortization of DAC and VOBA |
Policy and other operating expenses |
|||||||||||||||||||||||||
| 2015 | ||||||||||||||||||||||||||||||||
| Retirement Services |
$ | 2,663 | $ | 67,211 | $ | 167 | $ | 121 | $ | 2,473 | $ | 1,149 | $ | 203 | $ | 386 | ||||||||||||||||
| Corporate and other |
— | 4,625 | 67 | 74 | 35 | 106 | — | 146 | ||||||||||||||||||||||||
|
|
|
|
|
|
|
|
|
|
|
|
|
|
|
|
|
|||||||||||||||||
| Total |
$ | 2,663 | $ | 71,836 | $ | 234 | $ | 195 | $ | 2,508 | $ | 1,255 | $ | 203 | $ | 532 | ||||||||||||||||
|
|
|
|
|
|
|
|
|
|
|
|
|
|
|
|
|
|||||||||||||||||
| 2014 | ||||||||||||||||||||||||||||||||
| Retirement Services |
$ | 2,229 | $ | 71,778 | $ | 195 | $ | 100 | $ | 2,278 | $ | 2,566 | $ | 119 | $ | 380 | ||||||||||||||||
| Corporate and other |
— | — | — | — | 55 | — | — | 417 | ||||||||||||||||||||||||
|
|
|
|
|
|
|
|
|
|
|
|
|
|
|
|
|
|||||||||||||||||
| Total |
$ | 2,229 | $ | 71,778 | $ | 195 | $ | 100 | $ | 2,333 | $ | 2,566 | $ | 119 | $ | 797 | ||||||||||||||||
|
|
|
|
|
|
|
|
|
|
|
|
|
|
|
|
|
|||||||||||||||||
| 2013 | ||||||||||||||||||||||||||||||||
| Retirement Services |
$ | (1,137) | $ | 707 | $ | 141 | $ | 144 | $ | 287 | ||||||||||||||||||||||
| Corporate and other |
— | 367 | — | — | 144 | |||||||||||||||||||||||||||
|
|
|
|
|
|
|
|
|
|
|
|||||||||||||||||||||||
| Total |
$ | (1,137) | $ | 1,074 | $ | 141 | $ | 144 | $ | 431 | ||||||||||||||||||||||
|
|
|
|
|
|
|
|
|
|
|
|||||||||||||||||||||||
| (1) | Represents interest sensitive contract liabilities and future policy benefits on the consolidated balance sheets. |
| (2) | Represents interest sensitive contract benefits, amortization of deferred sales inducements, future policy and other policy benefits, and dividends to policyholders on the consolidated statements of income. |
F-110
Table of Contents
Schedule IV
| (In millions) | Gross amount |
Ceded to other companies |
Assumed from other companies |
Net amount | Percentage of amount assumed to net |
|||||||||||||||
| Year ended December 31, 2015 |
||||||||||||||||||||
| Life insurance in force at end of year |
$ | 77,994 | $ | 83,548 | $ | 10,123 | $ | 4,569 | 221.6 % | |||||||||||
| Premiums |
445 | 274 | 24 | 195 | 12.3 % | |||||||||||||||
| Year ended December 31, 2014 |
||||||||||||||||||||
| Life insurance in force at end of year |
132,755 | 142,660 | 10,748 | 843 | 1,275.0 % | |||||||||||||||
| Premiums |
387 | 315 | 28 | 100 | 28.0 % | |||||||||||||||
| Year ended December 31, 2013 |
||||||||||||||||||||
| Life insurance in force at end of year |
140,480 | 151,045 | 11,489 | 924 | 1,243.4 % | |||||||||||||||
| Premiums |
282 | 1,431 | 12 | (1,137) | (1.1)% | |||||||||||||||
F-111
Table of Contents
Schedule V
Valuation and Qualifying Accounts
| (In millions) | Additions | |||||||||||||||||||
| Description |
Balance at beginning of year |
Charged to costs and expenses |
Assumed through acquisitions(1) |
Deductions | Balance at end of year |
|||||||||||||||
| Reserves deducted from assets to which they apply |
||||||||||||||||||||
| Year ended December 31, 2015 |
||||||||||||||||||||
| Valuation allowance on deferred tax assets |
$ | 133 | $ | 7 | $ | 66 | $ | (13) | $ | 193 | ||||||||||
| Valuation allowance on mortgage loans |
1 | — | 1 | — | 2 | |||||||||||||||
| Year ended December 31, 2014 |
||||||||||||||||||||
| Valuation allowance on deferred tax assets |
155 | — | — | (22) | 133 | |||||||||||||||
| Valuation allowance on mortgage loans |
1 | 1 | — | (1) | 1 | |||||||||||||||
| Year ended December 31, 2013 |
||||||||||||||||||||
| Valuation allowance on deferred tax assets |
5 | 10 | 142 | (2) | 155 | |||||||||||||||
| Valuation allowance on mortgage loans |
— | 1 | — | — | 1 | |||||||||||||||
| (1) | Assumed through acquisitions represents the valuation allowances recorded related to the acquisitions of DLD in October 2015 and Aviva USA in October 2013. |
F-112
Table of Contents
Condensed Consolidated Balance Sheets (Unaudited)
| (In millions) | September 30, 2016 | December 31, 2015 | ||||||
| Assets |
||||||||
| Investments |
||||||||
| Available-for-sale securities, at fair value |
||||||||
| Fixed maturity securities (amortized cost: 2016 – $50,670 and 2015 – $48,227) |
$ | 52,923 | $ | 47,816 | ||||
| Equity securities (cost: 2016 – $311 and 2015 – $367) |
335 | 407 | ||||||
| Trading securities, at fair value |
2,721 | 2,468 | ||||||
| Mortgage loans, net of allowances (portion at fair value: 2016 – $45 and 2015 – $48) |
5,518 | 5,500 | ||||||
| Investment funds (portion at fair value: 2016 – $135 and 2015 – $152) |
725 | 733 | ||||||
| Policy loans |
606 | 642 | ||||||
| Funds withheld at interest (portion at fair value: 2016 – $205
and |
6,375 | 3,482 | ||||||
| Derivative assets |
1,169 | 871 | ||||||
| Real estate (portion held for sale: 2016 – $54 and 2015 – $0) |
603 | 566 | ||||||
| Short-term investments, at fair value (cost: 2016 – $164 and 2015 – $135) |
164 | 135 | ||||||
| Other investments |
84 | 83 | ||||||
|
|
|
|
|
|||||
| Total investments |
71,223 | 62,703 | ||||||
| Cash and cash equivalents |
2,556 | 2,714 | ||||||
| Restricted cash |
63 | 116 | ||||||
| Investments in related parties |
||||||||
| Available-for-sale securities, at fair value |
||||||||
| Fixed maturity securities (amortized cost: 2016 – $322
and |
313 | 308 | ||||||
| Equity securities (cost: 2016 – $20 and 2015 – $0) |
20 | — | ||||||
| Trading securities, at fair value |
211 | 217 | ||||||
| Investment funds |
1,073 | 997 | ||||||
| Short-term investments |
— | 55 | ||||||
| Other investments |
237 | 245 | ||||||
| Accrued investment income (related party: 2016 – $8 and 2015 – $9) |
543 | 520 | ||||||
| Reinsurance recoverable (portion at fair value: 2016 – $1,878
and |
6,174 | 7,257 | ||||||
| Deferred acquisition costs, deferred sales inducements, and value of business acquired |
2,707 | 2,663 | ||||||
| Current income tax recoverable |
105 | 113 | ||||||
| Deferred tax assets |
126 | 606 | ||||||
| Other assets |
802 | 749 | ||||||
| Assets of consolidated variable interest entities |
||||||||
| Investments |
||||||||
| Available-for-sale securities, at fair value |
||||||||
| Equity securities – related party (cost: 2016 – $143
and |
143 | — | ||||||
| Trading securities, at fair value |
||||||||
| Fixed maturity securities (related party: 2016 – $51 and 2015 – $53) |
51 | 722 | ||||||
| Equity securities – related party |
90 | 309 | ||||||
| Investment funds (related party, at fair value: 2016 – $541 and 2015 – $516) |
553 | 534 | ||||||
| Cash and cash equivalents |
4 | 6 | ||||||
| Other assets |
6 | 20 | ||||||
|
|
|
|
|
|||||
| Total assets |
$ | 87,000 | $ | 80,854 | ||||
|
|
|
|
|
|||||
(Continued)
See accompanying notes to the unaudited condensed consolidated financial statements
F-113
Table of Contents
ATHENE HOLDING LTD.
Condensed Consolidated Balance Sheets (Unaudited)
| (In millions) | September 30, 2016 | December 31, 2015 | ||||||
| Liabilities and Equity |
||||||||
| Liabilities |
||||||||
| Interest sensitive contract liabilities (portion at fair value: 2016 – $6,754 and 2015 – $6,359) |
$ | 60,901 | $ | 57,296 | ||||
| Future policy benefits (portion at fair value: 2016 – $2,522
and |
15,087 | 14,540 | ||||||
| Other policy claims and benefits |
197 | 234 | ||||||
| Dividends payable to policyholders |
1,225 | 856 | ||||||
| Derivative liabilities |
29 | 17 | ||||||
| Payables for collateral on derivatives |
1,121 | 867 | ||||||
| Funds withheld liability (portion at fair value: 2016 – $30
and |
394 | 388 | ||||||
| Other liabilities (related party: 2016 – $82 and 2015 – $63) |
963 | 776 | ||||||
| Liabilities of consolidated variable interest entities |
||||||||
| Borrowings |
— | 500 | ||||||
| Other liabilities |
9 | 17 | ||||||
|
|
|
|
|
|||||
| Total liabilities |
79,926 | 75,491 | ||||||
|
|
|
|
|
|||||
| Equity |
||||||||
| Common stock |
— | — | ||||||
| Additional paid-in capital |
3,403 | 3,281 | ||||||
| Retained earnings |
2,750 | 2,318 | ||||||
| Accumulated other comprehensive income (loss) (related party: 2016 – $(10) and 2015 – $(24)) |
920 | (237) | ||||||
|
|
|
|
|
|||||
| Total Athene Holding Ltd. shareholders’ equity |
7,073 | 5,362 | ||||||
| Noncontrolling interest |
1 | 1 | ||||||
|
|
|
|
|
|||||
| Total equity |
7,074 | 5,363 | ||||||
|
|
|
|
|
|||||
| Total liabilities and equity |
$ | 87,000 | $ | 80,854 | ||||
|
|
|
|
|
|||||
(Concluded)
See accompanying notes to the unaudited condensed consolidated financial statements
F-114
Table of Contents
Condensed Consolidated Statements of Income (Unaudited)
| Nine months ended September 30, | ||||||||
| (In millions, except per share data) | 2016 | 2015 | ||||||
| Revenue |
||||||||
| Premiums |
$ | 205 | $ | 99 | ||||
| Product charges |
206 | 184 | ||||||
| Net investment income (related party investment income: 2016 – $166 and 2015 – $112; and related party investment expense: 2016 – $226 and 2015 – $206) |
2,143 | 1,830 | ||||||
| Investment related gains (losses) (related party: 2016 – $(32) and 2015 – $4) |
523 | (609) | ||||||
| Other-than-temporary impairment investment losses |
||||||||
| Other-than-temporary impairment losses |
(31) | (27) | ||||||
| Other-than-temporary impairment losses recognized in other comprehensive income |
4 | 8 | ||||||
|
|
|
|
|
|||||
| Net other-than-temporary impairment losses |
(27) | (19) | ||||||
| Other revenues |
25 | 16 | ||||||
| Revenues of consolidated variable interest entities |
||||||||
| Net investment income (related party: 2016 – $17 and 2015 – $19) |
40 | 37 | ||||||
| Investment related gains (losses) (related party: 2016 – $(48) and 2015 – $38) |
(70) | 33 | ||||||
|
|
|
|
|
|||||
| Total revenues |
3,045 | 1,571 | ||||||
|
|
|
|
|
|||||
| Benefits and Expenses |
||||||||
| Interest sensitive contract benefits |
1,068 | 273 | ||||||
| Amortization of deferred sales inducements |
20 | 14 | ||||||
| Future policy and other policy benefits |
862 | 339 | ||||||
| Amortization of deferred acquisition costs and value of business acquired |
203 | 144 | ||||||
| Interest expense |
6 | 15 | ||||||
| Dividends to policyholders |
65 | 33 | ||||||
| Policy and other operating expenses (related party: 2016 – $18 and 2015 – $12) |
441 | 368 | ||||||
| Operating expenses of consolidated variable interest entities |
13 | 13 | ||||||
|
|
|
|
|
|||||
| Total benefits and expenses |
2,678 | 1,199 | ||||||
|
|
|
|
|
|||||
| Income before income taxes |
367 | 372 | ||||||
| Income tax expense (benefit) |
(70) | 36 | ||||||
|
|
|
|
|
|||||
| Net income |
437 | 336 | ||||||
| Less: Net income attributable to noncontrolling interests |
— | 16 | ||||||
|
|
|
|
|
|||||
| Net income available to Athene Holding Ltd. shareholders |
$ | 437 | $ | 320 | ||||
|
|
|
|
|
|||||
| Earnings per share on Class A and B shares |
||||||||
| Basic |
$ | 2.35 | $ | 1.87 | ||||
| Diluted |
$ | 2.35 | $ | 1.87 | ||||
See accompanying notes to the unaudited condensed consolidated financial statements
F-115
Table of Contents
Condensed Consolidated Statements of Comprehensive Income (Loss) (Unaudited)
| Nine months ended September 30, | ||||||||
| (In millions) | 2016 | 2015 | ||||||
| Net income |
$ | 437 | $ | 336 | ||||
|
|
|
|
|
|||||
| Other comprehensive income (loss), before tax |
||||||||
| Change in unrealized investment gains (losses) on available-for-sale securities, net of offsets |
1,705 | (724) | ||||||
| Change in noncredit component of other-than-temporary impairment losses, available-for-sale |
(4) | (8) | ||||||
| Comprehensive income (loss) on hedging instruments |
(13) | 9 | ||||||
| Comprehensive income (loss) on pension adjustments |
(1) | — | ||||||
| Comprehensive income (loss) on foreign currency translation adjustments |
1 | (2) | ||||||
|
|
|
|
|
|||||
| Other comprehensive income (loss), before tax |
1,688 | (725) | ||||||
| Income tax expense (benefit) related to other comprehensive income |
531 | (242) | ||||||
|
|
|
|
|
|||||
| Other comprehensive income (loss), after tax |
1,157 | (483) | ||||||
|
|
|
|
|
|||||
| Comprehensive income (loss) |
1,594 | (147) | ||||||
| Less: comprehensive income attributable to noncontrolling interests |
— | 16 | ||||||
|
|
|
|
|
|||||
| Comprehensive income (loss) available to Athene Holding Ltd. shareholders |
$ | 1,594 | $ | (163) | ||||
|
|
|
|
|
|||||
See accompanying notes to the unaudited condensed consolidated financial statements
F-116
Table of Contents
Condensed Consolidated Statements of Equity (Unaudited)
| (In millions) | Common stock |
Additional paid-in capital |
Retained earnings |
Accumulated other comprehensive income (loss) |
Total Athene Holding Ltd. shareholders’ equity |
Non controlling interest |
Total equity |
|||||||||||||||||||||
| Balance at December 31, 2014 |
$ | — | $ | 2,153 | $ | 1,758 | $ | 644 | $ | 4,555 | $ | 33 | $ | 4,588 | ||||||||||||||
| Net income |
— | — | 320 | — | 320 | 16 | 336 | |||||||||||||||||||||
| Other comprehensive loss |
— | — | — | (483) | (483) | — | (483) | |||||||||||||||||||||
| Issuance of shares, net of |
— | 1,109 | — | — | 1,109 | — | 1,109 | |||||||||||||||||||||
| Stock-based compensation |
— | 12 | — | — | 12 | — | 12 | |||||||||||||||||||||
| Retirement or repurchase of |
— | (1) | (1) | — | (2) | — | (2) | |||||||||||||||||||||
| Change in equity of |
— | — | — | — | — | (48) | (48) | |||||||||||||||||||||
|
|
|
|
|
|
|
|
|
|
|
|
|
|
|
|||||||||||||||
| Balance at September 30, 2015 |
$ | — | $ | 3,273 | $ | 2,077 | $ | 161 | $ | 5,511 | $ | 1 | $ | 5,512 | ||||||||||||||
|
|
|
|
|
|
|
|
|
|
|
|
|
|
|
|||||||||||||||
| (In millions) | Common stock |
Additional paid-in capital |
Retained earnings |
Accumulated other comprehensive income (loss) |
Total Athene Holding Ltd. shareholders’ equity |
Non controlling interest |
Total equity |
|||||||||||||||||||||
| Balance at December 31, 2015 |
$ | — | $ | 3,281 | $ | 2,318 | $ | (237) | $ | 5,362 | $ | 1 | $ | 5,363 | ||||||||||||||
| Net income |
— | — | 437 | — | 437 | — | 437 | |||||||||||||||||||||
| Other comprehensive income |
— | — | — | 1,157 | 1,157 | — | 1,157 | |||||||||||||||||||||
| Issuance of shares, net of |
— | 1 | — | — | 1 | — | 1 | |||||||||||||||||||||
| Stock-based compensation |
— | 135 | — | — | 135 | — | 135 | |||||||||||||||||||||
| Retirement or repurchase of |
— | (14) | (5) | — | (19) | — | (19) | |||||||||||||||||||||
|
|
|
|
|
|
|
|
|
|
|
|
|
|
|
|||||||||||||||
| Balance at September 30, 2016 |
$ | — | $ | 3,403 | $ | 2,750 | $ | 920 | $ | 7,073 | $ | 1 | $ | 7,074 | ||||||||||||||
|
|
|
|
|
|
|
|
|
|
|
|
|
|
|
|||||||||||||||
See accompanying notes to the unaudited condensed consolidated financial statements
F-117
Table of Contents
Condensed Consolidated Statements of Cash Flows (Unaudited)
| Nine months ended September 30, | ||||||||
| (In millions) | 2016 | 2015 | ||||||
| Cash flows from operating activities |
||||||||
| Net income |
$ | 437 | $ | 336 | ||||
| Adjustments to reconcile net income to net cash provided by operating activities: |
||||||||
| Amortization of deferred acquisition costs and value of business acquired |
203 | 144 | ||||||
| Amortization of deferred sales inducements |
20 | 14 | ||||||
| Amortization (accretion) of net investment premiums, discounts, and other (related party: 2016 – $(3) and 2015 – $(5)) |
(136) | (43) | ||||||
| Payment at inception of coinsurance agreement |
— | (10) | ||||||
| Stock-based compensation |
61 | 51 | ||||||
| Net investment income (related party: 2016 – $(30) and 2015 – $(3)) |
(4) | (10) | ||||||
| Net recognized (gains) losses on investments and derivatives (related party: 2016 – $23 and 2015 – $6) |
(226) | 714 | ||||||
| Policy acquisition costs deferred |
(449) | (211) | ||||||
| Deferred income tax expense (benefit) |
(42) | 100 | ||||||
| Changes in operating assets and liabilities: |
||||||||
| Accrued investment income |
(20) | 27 | ||||||
| Interest sensitive contract liabilities |
982 | 526 | ||||||
| Future policy benefits, other policy claims and benefits, dividends payable to policyholders, and reinsurance recoverable |
211 | (313) | ||||||
| Current income tax recoverable |
10 | (39) | ||||||
| Funds withheld assets and liabilities |
(133) | (339) | ||||||
| Other assets and liabilities |
(23) | (181) | ||||||
| Consolidated variable interest entities related: |
||||||||
| Amortization (accretion) of net investment premiums, discounts, and other |
3 | 3 | ||||||
| Net investment (income) loss |
4 | (3) | ||||||
| Net recognized (gains) losses on investments and derivatives (related party: 2016 – $48 and 2015 – $(45)) |
70 | (30) | ||||||
| Change in other assets and liabilities |
— | 1 | ||||||
|
|
|
|
|
|||||
| Net cash provided by operating activities |
968 | 737 | ||||||
|
|
|
|
|
|||||
(Continued)
See accompanying notes to the unaudited condensed consolidated financial statements
F-118
Table of Contents
ATHENE HOLDING LTD.
Condensed Consolidated Statements of Cash Flows (Unaudited)
| Nine months ended September 30, | ||||||||
| (In millions) | 2016 | 2015 | ||||||
| Cash flows from investing activities |
||||||||
| Sales, maturities, and repayments of: |
||||||||
| Available-for-sale securities |
||||||||
| Fixed maturity securities (related party: 2016 – $12 and 2015 – $31) |
$ | 6,401 | $ | 7,013 | ||||
| Equity securities |
295 | 11 | ||||||
| Trading securities (related party: 2016 – $16 and 2015 – $72) |
557 | 201 | ||||||
| Mortgage loans |
615 | 469 | ||||||
| Investment funds (related party: 2016 – $215 and 2015 – $44) |
277 | 248 | ||||||
| Derivative instruments and other invested assets (related party: 2016 – $8 and 2015 – $0) |
226 | 1,012 | ||||||
| Real estate |
7 | — | ||||||
| Short-term investments (related party: 2016 – $55 and 2015 – $52) |
720 | 102 | ||||||
| Purchases of: |
||||||||
| Available-for-sale securities |
||||||||
| Fixed maturity securities (related party: 2016 – $0 and 2015 – $(61)) |
(8,306) | (8,377) | ||||||
| Equity securities (related party: 2016 – $(20) and 2015 – $0) |
(244) | (20) | ||||||
| Trading securities (related party: 2016 – $(33) and 2015 – $(40)) |
(698) | (348) | ||||||
| Mortgage loans |
(633) | (493) | ||||||
| Investment funds (related party: 2016 – $(258) and 2015 – $(295)) |
(322) | (383) | ||||||
| Derivative instruments and other invested assets |
(447) | (521) | ||||||
| Real estate |
(32) | — | ||||||
| Short-term investments (related party: 2016 – $0 and 2015 – $(52)) |
(699) | (142) | ||||||
| Consolidated variable interest entities related: |
||||||||
| Sales, maturities, and repayments of investments (related party: 2016 – $15 and 2015 – $211) |
497 | 224 | ||||||
| Purchases of investments (related party: 2016 – $(10) and 2015 – $(11)) |
(10) | (11) | ||||||
| Cash settlement of derivatives |
29 | 22 | ||||||
| Change in restricted cash |
53 | (14) | ||||||
| Other investing activities, net |
28 | 213 | ||||||
|
|
|
|
|
|||||
| Net cash used in investing activities |
(1,686) | (794) | ||||||
|
|
|
|
|
|||||
(Continued)
See accompanying notes to the unaudited condensed consolidated financial statements
F-119
Table of Contents
ATHENE HOLDING LTD.
Condensed Consolidated Statements of Cash Flows (Unaudited)
| Nine months ended September 30, | ||||||||
| (In millions) | 2016 | 2015 | ||||||
| Cash flows from financing activities |
||||||||
| Capital contributions |
$ | 1 | $ | 1,106 | ||||
| Deposits on investment-type policies and contracts |
4,189 | 2,513 | ||||||
| Withdrawals on investment-type policies and contracts |
(3,516) | (3,601) | ||||||
| Payments for coinsurance agreements on investment-type contracts, net |
(66) | (140) | ||||||
| Consolidated variable interest entities related: |
||||||||
| Repayment on borrowings |
(500) | — | ||||||
| Capital distributions to noncontrolling interests |
— | (30) | ||||||
| Net change in cash collateral posted for derivative transactions |
254 | (924) | ||||||
| Repurchase of common stock |
(2) | (2) | ||||||
| Other financing activities, net |
200 | 68 | ||||||
|
|
|
|
|
|||||
| Net cash provided by (used in) financing activities |
560 | (1,010) | ||||||
|
|
|
|
|
|||||
| Effect of exchange rate changes on cash and cash equivalents |
(2) | — | ||||||
|
|
|
|
|
|||||
| Net decrease in cash and cash equivalents |
(160) | (1,067) | ||||||
| Cash and cash equivalents at beginning of year1 |
2,720 | 2,638 | ||||||
|
|
|
|
|
|||||
| Cash and cash equivalents at end of period1 |
$ | 2,560 | $ | 1,571 | ||||
|
|
|
|
|
|||||
| Supplementary information |
||||||||
| Non-cash transactions |
||||||||
| Deposits on investment-type policies and contracts through reinsurance agreements |
$ | 3,089 | $ | 704 | ||||
| Withdrawals on investment-type policies and contracts through reinsurance agreements |
281 | 283 | ||||||
| Investments received from settlements on reinsurance agreements |
47 | — | ||||||
| Investment funds acquired in exchange for non-cash assets and liabilities |
— | 473 | ||||||
| Reduction in investments and other assets and liabilities relating to reinsurance |
— | 920 | ||||||
| 1 Includes cash and cash equivalents of consolidated variable interest entities | ||||||||
(Concluded)
See accompanying notes to the unaudited condensed consolidated financial statements
F-120
Table of Contents
Notes to Condensed Consolidated Financial Statements (Unaudited)
1. Business, Basis of Presentation, and Significant Accounting Policies
Athene Holding Ltd. (AHL), a Bermuda exempted company, together with its subsidiaries (collectively, Athene, we, our, us, or the Company), is a leading retirement services company that issues, reinsures, and acquires retirement savings products in all 50 U.S. states, the District of Columbia, and Germany.
We conduct business primarily through the following consolidated subsidiaries:
| • | Athene Life Re Ltd., a Bermuda exempted company to which AHL’s other insurance subsidiaries and third party ceding companies directly and indirectly reinsure a portion of their liabilities (ALRe); |
| • | Athene USA Corporation, an Iowa corporation and its subsidiaries (Athene USA); and |
| • | Athene Deutschland GmbH & Co. KG, a German partnership and its subsidiaries (ADKG). |
In addition, we consolidate the following variable interest entities (VIE), for which we have determined that we are the primary beneficiary:
| • | AAA Investments (Co-Invest VI), L.P., a Delaware limited partnership (CoInvest VI); |
| • | AAA Investments (Co-Invest VII), L.P., a Delaware limited partnership (CoInvest VII); |
| • | AAA Investments (Other), L.P., a Marshall Islands limited partnership (CoInvest Other); |
| • | London Prime Apartments Guernsey Holdings Limited, a Guernsey limited company (London Prime); |
| • | NCL Athene, LLC (NCL LLC); and |
| • | 2012 CMBS-I Fund L.P., a Delaware limited partnership, and 2012 CMBS-II Fund L.P., a Delaware limited partnership (collectively, CMBS Funds). |
Basis of Presentation—We have prepared the accompanying condensed consolidated financial statements in accordance with accounting principles generally accepted in the United States of America (GAAP) for interim financial information. The accompanying condensed consolidated financial statements are unaudited and reflect all adjustments, consisting only of normal recurring items, considered necessary for fair statement of the periods presented. All significant intercompany accounts and transactions have been eliminated. Interim operating results are not necessarily indicative of the results expected for the entire year.
The accompanying condensed consolidated balance sheet as of December 31, 2015, has been derived from the audited financial statements, but does not include all of the information and footnotes required by GAAP for complete financial statements. Therefore, these condensed consolidated financial statements should be read in conjunction with the audited consolidated financial statements and related notes. The preparation of financial statements requires the use of management estimates. Actual results may differ from estimates used in preparing the condensed consolidated financial statements.
Adopted Accounting Pronouncements—We adopted the following Accounting Standards Updates (ASUs) during the reporting period:
Fair Value Measurement – Net Asset Value (ASU 2015-07)
This update has a disclosure-only impact for entities that measure investments using net asset value per share (NAV) under the practical expedient in the fair value measurement guidance. We adopted this standard effective January 1, 2016, and have removed investments that are measured at NAV as a practical expedient from the fair value hierarchy in all periods presented in the notes to the condensed consolidated financial statements.
F-121
Table of Contents
ATHENE HOLDING LTD.
Notes to Condensed Consolidated Financial Statements (Unaudited)
Cloud Computing Arrangements (ASU 2015-05)
This update clarifies whether a cloud computing arrangement is an intangible asset or a service contract. We adopted this standard effective January 1, 2016, and the adoption of this update did not have a material effect on our condensed consolidated financial statements.
Stock-Based Compensation (ASU 2014-12)
This update requires a performance target in a share-based payment arrangement that affects vesting and that could be achieved after the requisite service period to be treated as a performance condition. The requisite service period ends when the employee can cease rendering service and still be eligible to vest in the award if the performance target is achieved. We adopted this standard effective January 1, 2016, and the adoption of this update did not have a material effect on our condensed consolidated financial statements.
Recently Issued Accounting Pronouncements
Consolidation – Interest Held through Related Parties under Common Control (ASU 2016-17)
This update amends the consolidation guidance to change how indirect interests in VIEs are evaluated by a reporting entity when determining whether or not it is the primary beneficiary of that VIE. The primary beneficiary of a VIE is the reporting entity that has a controlling financial interest in a VIE and, therefore, consolidates the VIE. A reporting entity has an indirect interest in a VIE if it has a direct interest in a related party that, in turn, has a direct interest in the VIE. Currently, if a single decision maker and its related parties are under common control, the single decision maker is required to consider indirect interests held through related parties to be the equivalent of direct interests in their entirety. The amendments change the evaluation of indirect interests to be considered on a proportionate basis. We will be required to adopt this standard effective January 1, 2017. Early adoption is permitted. We are currently evaluating the impact of this guidance on our consolidated financial statements.
Income Taxes – Intra-Entity Transfers (ASU 2016-16)
This update requires the immediate recognition of current and deferred income tax effects of intra-entity transfers of assets, other than inventory. Currently, recognition of the income tax consequence was not recognized until the asset was sold to an outside party. We will be required to adopt this standard effective January 1, 2018. Early adoption is permitted. We are currently evaluating the impact of this guidance on our consolidated financial statements.
Statement of Cash Flows (ASU 2016-15)
This update provides specific guidance to clarify how entities should classify certain cash receipts and cash payments on the statement of cash flows. The update also clarifies the application of the predominance principle when cash receipts and cash payments have aspects of more than one class of cash flows. We will be required to adopt this standard effective January 1, 2018. We are currently evaluating the impact of this guidance on our consolidated financial statements.
Financial Instruments – Credit Losses (ASU 2016-13)
This update is designed to reduce complexity by limiting the number of credit impairment models used for different assets. The resulting model will result in accelerated credit loss recognition on assets held at amortized cost, which includes our commercial and residential mortgage investments. Available-for-sale fixed maturity securities are not in scope of the new credit loss model, but will undergo targeted improvements to the current reporting model including the establishment of a valuation allowance for credit losses versus the current direct write down approach. We will be required to adopt this standard effective January 1, 2020. Early adoption is permitted effective January 1, 2019. We are currently evaluating the impact of this guidance on our consolidated financial statements.
F-122
Table of Contents
ATHENE HOLDING LTD.
Notes to Condensed Consolidated Financial Statements (Unaudited)
Revenue Recognition (ASU 2016-12, ASU 2016-11, ASU 2016-10, ASU 2016-08, ASU 2015-14, and ASU 2014-09)
ASU 2014-09 indicates an entity should recognize revenue to depict the transfer of promised goods or services to customers in an amount that reflects the consideration to which the entity expects to be entitled in exchange for those goods or services. ASU 2015-14 provided for a one-year deferral of the effective date, which will require us to adopt this standard effective January 1, 2018. ASU 2016-08 amends the principal-versus-agent implementation guidance and illustrations in ASU 2014-09. ASU 2016-10 clarifies the identification of performance obligations as well as licensing implementation guidance. ASU 2016-11 brings existing SEC guidance into conformity with revenue recognition accounting guidance of ASU 2014-09 discussed above. ASU 2016-12 provides clarification on assessing collectability, presentation of sales tax, non-cash consideration, and transition. We are currently evaluating the impact of this guidance on our consolidated financial statements.
Improvements to Employee Share-Based Payment Accounting (ASU 2016-09)
This update simplifies several aspects of the accounting for share-based payment award transactions, including income tax consequences, forfeitures, and classification on the statement of cash flows. We will be required to adopt this standard effective January 1, 2017. Early adoption is permitted. We are currently evaluating the impact of this guidance on our consolidated financial statements.
Equity Method and Joint Ventures (ASU 2016-07)
This update eliminates the retroactive adjustments to an investment upon it qualifying for the equity method of accounting as a result of an increase in the level of ownership interest or degree of influence by the investor. We will be required to adopt this standard effective January 1, 2017. Early adoption is permitted. We are currently evaluating the impact of this guidance on our consolidated financial statements.
Derivatives and Hedging – Contingent Put and Call Options (ASU 2016-06)
This update is intended to clarify the requirements for assessing whether contingent call (put) options that can accelerate the payment of principal on debt instruments are clearly and closely related to debt hosts. We will be required to adopt this standard effective January 1, 2017. Early adoption is permitted. We are currently evaluating the impact of this guidance on our consolidated financial statements.
Derivatives and Hedging – Effects of Derivative Contract Novation (ASU 2016-05)
This update is intended to clarify that a change in the counterparty to a derivative instrument that has been designated as the hedging instrument does not, in and of itself, require a de-designation of that hedging relationship provided all other hedge accounting criteria continue to be met. We will be required to adopt this standard effective January 1, 2017. Early adoption is permitted. We are currently evaluating the impact of this guidance on our consolidated financial statements.
Leases (ASU 2016-02)
This update is intended to increase transparency and comparability for lease transactions. A lessee is required to recognize an asset and a liability for all lease arrangements longer than 12 months. Lessor accounting is largely unchanged. We will be required to adopt this standard effective January 1, 2019. Early adoption is permitted. We are currently evaluating the impact of this guidance on our consolidated financial statements.
Financial Instruments – Recognition and Measurement (ASU 2016-01)
This update retains the current accounting for classifying and measuring investments in debt securities and loans, but requires equity investments to be measured at fair value with subsequent changes recognized in net income,
F-123
Table of Contents
ATHENE HOLDING LTD.
Notes to Condensed Consolidated Financial Statements (Unaudited)
except for those accounted for under the equity method or requiring consolidation. We will be required to adopt this standard effective January 1, 2018. We are currently evaluating the impact of this guidance on our consolidated financial statements.
2. Investments
Available-for-sale Securities—Our available-for-sale (AFS) investment portfolio includes bonds, collateralized loan obligations (CLO), asset-backed securities (ABS), commercial mortgage-backed securities (CMBS), residential mortgage-backed securities (RMBS), redeemable preferred stock, and equity securities. Additionally, it includes direct investments in affiliates of Apollo Global Management, LLC (AGM and, together with its subsidiaries, Apollo) where Apollo can exercise significant influence over the affiliates. These investments are presented as investments in related parties on the condensed consolidated balance sheets, and are separately disclosed below.
The following table represents the cost or amortized cost, gross unrealized gains and losses, fair value, and other-than-temporary impairments (OTTI) in accumulated other comprehensive income (AOCI) of our AFS investments by asset type:
| September 30, 2016 | ||||||||||||||||||||
| (In millions) | Cost or Amortized Cost |
Gross Unrealized Gains |
Gross Unrealized Losses |
Fair Value | OTTI in AOCI | |||||||||||||||
| Fixed maturity securities |
||||||||||||||||||||
| U.S. government and agencies |
$ | 71 | $ | 2 | $ | — | $ | 73 | $ | — | ||||||||||
| U.S. state, municipal, and political subdivisions |
1,026 | 204 | — | 1,230 | — | |||||||||||||||
| Foreign governments |
2,284 | 264 | (6) | 2,542 | — | |||||||||||||||
| Corporate |
28,883 | 1,874 | (138) | 30,619 | 4 | |||||||||||||||
| CLO |
5,078 | 14 | (213) | 4,879 | — | |||||||||||||||
| ABS |
2,726 | 45 | (59) | 2,712 | — | |||||||||||||||
| CMBS |
1,946 | 77 | (10) | 2,013 | — | |||||||||||||||
| RMBS |
8,656 | 292 | (93) | 8,855 | 15 | |||||||||||||||
|
|
|
|
|
|
|
|
|
|
|
|
|
|
|
| ||||||
| Total fixed maturity securities |
50,670 | 2,772 | (519) | 52,923 | 19 | |||||||||||||||
| Equity securities |
311 | 25 | (1) | 335 | — | |||||||||||||||
|
|
|
|
|
|
|
|
|
|
|
|
|
|
|
| ||||||
| Total AFS securities |
50,981 | 2,797 | (520) | 53,258 | 19 | |||||||||||||||
|
|
|
|
|
|
|
|
|
|
|
|
|
|
|
| ||||||
| Fixed maturity securities – related party |
||||||||||||||||||||
| CLO |
264 | 2 | (10) | 256 | — | |||||||||||||||
| ABS |
58 | — | (1) | 57 | — | |||||||||||||||
|
|
|
|
|
|
|
|
|
|
|
|
|
|
|
| ||||||
| Total fixed maturity securities – related party |
322 | 2 | (11) | 313 | — | |||||||||||||||
| Equity securities – related party |
20 | — | — | 20 | — | |||||||||||||||
|
|
|
|
|
|
|
|
|
|
|
|
|
|
|
| ||||||
| Total AFS securities – related party |
342 | 2 | (11) | 333 | — | |||||||||||||||
|
|
|
|
|
|
|
|
|
|
|
|
|
|
|
| ||||||
| Total AFS securities including related party |
$ | 51,323 | $ | 2,799 | $ | (531) | $ | 53,591 | $ | 19 | ||||||||||
|
|
|
|
|
|
|
|
|
|
|
|
|
|
|
| ||||||
F-124
Table of Contents
ATHENE HOLDING LTD.
Notes to Condensed Consolidated Financial Statements (Unaudited)
| December 31, 2015 | ||||||||||||||||||||
| (In millions) | Cost or Amortized Cost |
Gross Unrealized Gains |
Gross Unrealized Losses |
Fair Value | OTTI in AOCI | |||||||||||||||
| Fixed maturity securities |
||||||||||||||||||||
| U.S. government and agencies |
$ | 44 | $ | 1 | $ | — | $ | 45 | $ | — | ||||||||||
| U.S. state, municipal, and political subdivisions |
1,075 | 100 | (10) | 1,165 | 7 | |||||||||||||||
| Foreign governments |
2,467 | 17 | (20) | 2,464 | — | |||||||||||||||
| Corporate |
26,979 | 523 | (566) | 26,936 | 2 | |||||||||||||||
| CLO |
4,943 | 4 | (392) | 4,555 | — | |||||||||||||||
| ABS |
2,944 | 33 | (59) | 2,918 | — | |||||||||||||||
| CMBS |
1,725 | 33 | (20) | 1,738 | — | |||||||||||||||
| RMBS |
8,050 | 128 | (183) | 7,995 | 6 | |||||||||||||||
|
|
|
|
|
|
|
|
|
|
|
|
|
|
|
| ||||||
| Total fixed maturity securities |
48,227 | 839 | (1,250) | 47,816 | 15 | |||||||||||||||
| Equity securities |
367 | 40 | — | 407 | — | |||||||||||||||
|
|
|
|
|
|
|
|
|
|
|
|
|
|
|
| ||||||
| Total AFS securities |
48,594 | 879 | (1,250) | 48,223 | 15 | |||||||||||||||
|
|
|
|
|
|
|
|
|
|
|
|
|
|
|
| ||||||
| Fixed maturity securities – related party |
||||||||||||||||||||
| CLO |
271 | — | (23) | 248 | — | |||||||||||||||
| ABS |
61 | — | (1) | 60 | — | |||||||||||||||
|
|
|
|
|
|
|
|
|
|
|
|
|
|
|
| ||||||
| Total AFS securities – related party |
332 | — | (24) | 308 | — | |||||||||||||||
|
|
|
|
|
|
|
|
|
|
|
|
|
|
|
| ||||||
| Total AFS securities including related party |
$ | 48,926 | $ | 879 | $ | (1,274) | $ | 48,531 | $ | 15 | ||||||||||
|
|
|
|
|
|
|
|
|
|
|
|
|
|
|
| ||||||
The amortized cost and fair value of fixed maturity AFS securities, including related party, are shown by contractual maturity below:
| September 30, 2016 | ||||||||
| (In millions) | Amortized Cost |
Fair Value | ||||||
| Due in one year or less |
$ | 986 | $ | 991 | ||||
| Due after one year through five years |
7,101 | 7,317 | ||||||
| Due after five years through ten years |
11,357 | 11,988 | ||||||
| Due after ten years |
12,820 | 14,168 | ||||||
| ABS, CLO, CMBS, and RMBS |
18,406 | 18,459 | ||||||
|
|
|
|
|
|||||
| Total AFS fixed maturity securities |
50,670 | 52,923 | ||||||
| Fixed maturity securities – related party, ABS and CLO |
322 | 313 | ||||||
|
|
|
|
|
|||||
| Total AFS fixed maturity securities including related party |
$ | 50,992 | $ | 53,236 | ||||
|
|
|
|
|
|||||
Actual maturities can differ from contractual maturities as borrowers may have the right to call or prepay obligations with or without call or prepayment penalties.
F-125
Table of Contents
ATHENE HOLDING LTD.
Notes to Condensed Consolidated Financial Statements (Unaudited)
Unrealized Losses on AFS Securities—The following summarizes the fair value and gross unrealized losses for AFS securities, including related party, aggregated by class of security and length of time the fair value has remained below cost or amortized cost:
| September 30, 2016 | ||||||||||||||||||||||||
| Less than 12 months | 12 months or greater | Total | ||||||||||||||||||||||
| (In millions) | Fair Value | Gross Unrealized Losses |
Fair Value | Gross Unrealized Losses |
Fair Value | Gross Unrealized Losses | ||||||||||||||||||
| Fixed maturity securities |
||||||||||||||||||||||||
| U.S. government and agencies |
$ | 17 | $ | — | $ | 1 | $ | — | $ | 18 | $ | — | ||||||||||||
| U.S. state, municipal, and political subdivisions |
1 | — | 2 | — | 3 | — | ||||||||||||||||||
| Foreign governments |
51 | (6) | 10 | — | 61 | (6) | ||||||||||||||||||
| Corporate |
1,901 | (34) | 1,209 | (104) | 3,110 | (138) | ||||||||||||||||||
| CLO |
269 | (4) | 3,341 | (209) | 3,610 | (213) | ||||||||||||||||||
| ABS |
504 | (14) | 656 | (45) | 1,160 | (59) | ||||||||||||||||||
| CMBS |
427 | (6) | 110 | (4) | 537 | (10) | ||||||||||||||||||
| RMBS |
1,230 | (35) | 1,839 | (58) | 3,069 | (93) | ||||||||||||||||||
|
|
|
|
|
|
|
|
|
|
|
|
|
|
|
|
|
|
| |||||||
| Total fixed maturity securities |
4,400 | (99) | 7,168 | (420) | 11,568 | (519) | ||||||||||||||||||
| Equity securities |
21 | (1) | — | — | 21 | (1) | ||||||||||||||||||
|
|
|
|
|
|
|
|
|
|
|
|
|
|
|
|
|
|
| |||||||
| Total AFS securities |
4,421 | (100) | 7,168 | (420) | 11,589 | (520) | ||||||||||||||||||
|
|
|
|
|
|
|
|
|
|
|
|
|
|
|
|
|
|
| |||||||
| Fixed maturity securities – related party |
||||||||||||||||||||||||
| CLO |
— | — | 157 | (10) | 157 | (10) | ||||||||||||||||||
| ABS |
57 | (1) | — | — | 57 | (1) | ||||||||||||||||||
|
|
|
|
|
|
|
|
|
|
|
|
|
|
|
|
|
|
| |||||||
| Total fixed maturity securities – related party |
57 | (1) | 157 | (10) | 214 | (11) | ||||||||||||||||||
| Equity securities – related party |
20 | — | — | — | 20 | — | ||||||||||||||||||
|
|
|
|
|
|
|
|
|
|
|
|
|
|
|
|
|
|
| |||||||
| Total AFS securities – related party |
77 | (1) | 157 | (10) | 234 | (11) | ||||||||||||||||||
|
|
|
|
|
|
|
|
|
|
|
|
|
|
|
|
|
|
| |||||||
| Total AFS securities including related party |
$ | 4,498 | $ | (101) | $ | 7,325 | $ | (430) | $ | 11,823 | $ | (531) | ||||||||||||
|
|
|
|
|
|
|
|
|
|
|
|
|
|
|
|
|
|
| |||||||
F-126
Table of Contents
ATHENE HOLDING LTD.
Notes to Condensed Consolidated Financial Statements (Unaudited)
| December 31, 2015 | ||||||||||||||||||||||||
| Less than 12 months | 12 months or greater | Total | ||||||||||||||||||||||
| (In millions) | Fair Value | Gross Unrealized Losses |
Fair Value | Gross Unrealized Losses |
Fair Value | Gross Unrealized Losses | ||||||||||||||||||
| Fixed maturity securities |
||||||||||||||||||||||||
| U.S. government and agencies |
$ | 4 | $ | — | $ | 2 | $ | — | $ | 6 | $ | — | ||||||||||||
| U.S. state, municipal, and political subdivisions |
63 | (9) | 8 | (1) | 71 | (10) | ||||||||||||||||||
| Foreign governments |
711 | (20) | — | — | 711 | (20) | ||||||||||||||||||
| Corporate |
7,810 | (450) | 554 | (116) | 8,364 | (566) | ||||||||||||||||||
| CLO |
2,934 | (169) | 1,555 | (223) | 4,489 | (392) | ||||||||||||||||||
| ABS |
1,484 | (37) | 371 | (22) | 1,855 | (59) | ||||||||||||||||||
| CMBS |
577 | (11) | 119 | (9) | 696 | (20) | ||||||||||||||||||
| RMBS |
4,672 | (128) | 995 | (55) | 5,667 | (183) | ||||||||||||||||||
|
|
|
|
|
|
|
|
|
|
|
|
|
|
|
|
|
|
| |||||||
| Total AFS securities |
18,255 | (824) | 3,604 | (426) | 21,859 | (1,250) | ||||||||||||||||||
|
|
|
|
|
|
|
|
|
|
|
|
|
|
|
|
|
|
| |||||||
| Fixed maturity securities – related party |
||||||||||||||||||||||||
| CLO |
139 | (14) | 72 | (9) | 211 | (23) | ||||||||||||||||||
| ABS |
60 | (1) | — | — | 60 | (1) | ||||||||||||||||||
|
|
|
|
|
|
|
|
|
|
|
|
|
|
|
|
|
|
| |||||||
| Total AFS securities – related party |
199 | (15) | 72 | (9) | 271 | (24) | ||||||||||||||||||
|
|
|
|
|
|
|
|
|
|
|
|
|
|
|
|
|
|
| |||||||
| Total AFS securities including related party |
$ | 18,454 | $ | (839) | $ | 3,676 | $ | (435) | $ | 22,130 | $ | (1,274) | ||||||||||||
|
|
|
|
|
|
|
|
|
|
|
|
|
|
|
|
|
|
| |||||||
As of September 30, 2016, we held 1,688 AFS securities that were in an unrealized loss position. Of this total, 951 were in an unrealized loss position longer than 12 months. As of September 30, 2016, we held 14 related party AFS securities that were in an unrealized loss position. Of this total, 12 were in an unrealized loss position longer than 12 months. The unrealized losses on AFS securities can primarily be attributed to changes in market interest rates and credit spreads since acquisition. We did not recognize the unrealized losses in income as we intend to hold these securities and it is not more likely than not we will be required to sell a security before the recovery of its amortized cost.
Other-Than-Temporary Impairments on AFS Securities—For the nine months ended September 30, 2016, on total AFS securities including related party of $53,591 million, we incurred $27 million of net OTTI, of which $4 million related to intent-to-sell impairments. These securities were impaired to fair value as of the impairment date. The remainder of net OTTI of $23 million related to credit impairments, of which $12 million related to credit loss impairments that we impaired to fair value and did not bifurcate a portion of the impairment in AOCI. The credit loss impairments not bifurcated in AOCI are excluded from the rollforward below.
F-127
Table of Contents
ATHENE HOLDING LTD.
Notes to Condensed Consolidated Financial Statements (Unaudited)
The following table represents a rollforward of the cumulative amounts recognized on the condensed consolidated statements of income for OTTI related to pre-tax credit loss impairments on AFS fixed maturity securities, for which a portion of the securities’ total OTTI was recognized in AOCI:
| Nine months ended September 30, | ||||||||
| (In millions) | 2016 | 2015 | ||||||
| Beginning balance |
$ | 22 | $ | 8 | ||||
| Initial impairments – credit loss OTTI recognized on securities not previously impaired |
8 | 14 | ||||||
| Additional impairments – credit loss OTTI recognized on securities previously impaired |
3 | — | ||||||
| Reduction in impairments from securities sold |
(9) | (2) | ||||||
| Reduction for credit loss that no longer has a portion of the OTTI loss recognized in AOCI |
— | (4) | ||||||
|
|
|
|
|
|||||
| Ending balance |
$ | 24 | $ | 16 | ||||
|
|
|
|
|
|||||
Net Investment Income—Net investment income by asset type consists of the following:
| Nine months ended September 30, | ||||||||
| (In millions) | 2016 | 2015 | ||||||
| AFS securities |
||||||||
| Fixed maturity securities |
$ | 1,707 | $ | 1,517 | ||||
| Equity securities |
6 | 5 | ||||||
| Trading securities |
184 | 129 | ||||||
| Mortgage loans, net of allowances |
264 | 241 | ||||||
| Investment funds |
124 | 87 | ||||||
| Funds withheld at interest |
47 | 43 | ||||||
| Other |
43 | 16 | ||||||
|
|
|
|
|
|||||
| Investment revenue |
2,375 | 2,038 | ||||||
| Investment expenses |
(232) | (208) | ||||||
|
|
|
|
|
|||||
| Net investment income |
$ | 2,143 | $ | 1,830 | ||||
|
|
|
|
|
|||||
Investment Related Gains (Losses)—Investment related gains (losses) by asset type consist of the following:
| Nine months ended September 30, | ||||||||
| (In millions) | 2016 | 2015 | ||||||
| AFS fixed maturity securities |
||||||||
| Gross realized gain on investment activity |
$ | 102 | $ | 102 | ||||
| Gross realized loss on investment activity |
(51) | (39) | ||||||
|
|
|
|
|
|
| |||
| Net realized investment gains on fixed maturity securities |
51 | 63 | ||||||
|
|
|
|
|
|
| |||
| Net realized investment gains (losses) on trading securities |
93 | (173) | ||||||
| Derivative gains (losses) |
387 | (506) | ||||||
| Other gains (losses) |
(8) | 7 | ||||||
|
|
|
|
|
|
| |||
| Investment related gains (losses) |
$ | 523 | $ | (609) | ||||
|
|
|
|
|
|
| |||
F-128
Table of Contents
ATHENE HOLDING LTD.
Notes to Condensed Consolidated Financial Statements (Unaudited)
Proceeds from sales of AFS securities were $3,202 million and $4,108 million for the nine months ended September 30, 2016, and 2015, respectively.
Included in net realized investment gains (losses) on trading securities are gains of $143 million and losses of $107 million resulting from the change in unrealized gains or losses for the underlying bonds we still held as of September 30, 2016, and 2015, respectively. Also included in net realized investment gains (losses) on trading securities are related party losses of $23 million and gains of $2 million resulting from the change in unrealized gains or losses for the underlying bonds we still held as of September 30, 2016, and 2015, respectively.
Purchased Credit Impaired (PCI) Securities—The following table summarizes our PCI securities, which are included in AFS fixed maturity securities:
| (In millions) | September 30, 2016 | December 31, 2015 | ||||||
| Contractually required payments1 |
$ | 7,133 | $ | 7,291 | ||||
| Less: Cash flows expected to be collected2 |
(5,009) | (4,986) | ||||||
|
|
|
|
|
|||||
| Non-accretable difference |
$ | 2,124 | $ | 2,305 | ||||
|
|
|
|
|
|||||
| Cash flows expected to be collected |
$ | 5,009 | $ | 4,986 | ||||
| Less: Amortized cost |
(3,865) | (3,673) | ||||||
|
|
|
|
|
|||||
| Accretable difference |
$ | 1,144 | $ | 1,313 | ||||
|
|
|
|
|
|||||
| Fair value |
$ | 3,998 | $ | 3,647 | ||||
| 1 | Includes principal and accrued interest. |
| 2 | Represents the acquisition date undiscounted principal and interest cash flows expected. |
We acquired PCI securities with the following amounts at the time of purchase:
| (In millions) | September 30, 2016 | |||
| Contractually required principal and interest |
$ | 1,190 | ||
| Expected cash flows |
744 | |||
| Estimated fair value |
566 | |||
The following tables summarize the activity for the accretable yield on PCI securities:
| (In millions) | Nine months ended September 30, 2016 |
|||
| Beginning balance |
$ | 1,313 | ||
| Purchases of PCI securities, net of sales |
155 | |||
| Accretion |
(76) | |||
| Changes in expected cash flows |
(248) | |||
|
|
|
|||
| Ending balance |
$ | 1,144 | ||
|
|
|
|||
F-129
Table of Contents
ATHENE HOLDING LTD.
Notes to Condensed Consolidated Financial Statements (Unaudited)
PCI Loans—During the third quarter of 2016, we acquired a pool of residential mortgage loans which had evidence of a deterioration in credit quality from their original issuance. We determined, based on our expectations as to the timing and amount of cash flows expected to be received, that it was probable at acquisition that we would not collect all contractually required payments, and have classified these investments as PCI loans. The following table summarizes our PCI loans, which are included in mortgage loans on the condensed consolidated balance sheets:
| (In millions) | September 30, 20161 | |||
| Contractually required payments2 |
$ | 184 | ||
| Less: Cash flows expected to be collected3 |
(124) | |||
|
|
|
|||
| Non-accretable difference |
$ | 60 | ||
|
|
|
|||
| Cash flows expected to be collected |
$ | 124 | ||
| Less: Amortized cost |
(98) | |||
|
|
|
|||
| Accretable difference |
$ | 26 | ||
|
|
|
|||
| Fair value |
$ | 98 | ||
| 1 | Amounts also represent the values at the time of purchase. |
| 2 | Includes principal and accrued interest. |
| 3 | Represents the acquisition date undiscounted principal and interest cash flows expected. |
Mortgage Loans—Mortgage loans, net of allowances, consist of the following:
| (In millions) | September 30, 2016 | December 31, 2015 | ||||||
| Commercial mortgage loans |
$ | 5,151 | $ | 5,178 | ||||
| Commercial mortgage loans under development |
172 | 222 | ||||||
|
|
|
|
|
|||||
| Total commercial mortgage loans |
5,323 | 5,400 | ||||||
| Residential mortgage loans |
195 | 100 | ||||||
|
|
|
|
|
|||||
| Mortgage loans, net of allowances |
$ | 5,518 | $ | 5,500 | ||||
|
|
|
|
|
|||||
We primarily make commercial mortgage loans on income producing properties including hotels, industrial properties, retail buildings, and office buildings. We diversify the commercial mortgage loan portfolio by geographic region and property type to reduce concentration risk. Typically, we only lend up to 75% of the estimated fair value of the underlying real estate to manage risk in origination of a commercial mortgage loan. Subsequent to origination, we evaluate mortgage loans based on relevant current information to confirm if properties are performing at a consistent and acceptable level to secure the related debt.
F-130
Table of Contents
ATHENE HOLDING LTD.
Notes to Condensed Consolidated Financial Statements (Unaudited)
The distribution of commercial mortgage loans, including those under development, net of valuation allowances, by property type and geographic region, is as follows:
| September 30, 2016 | December 31, 2015 | |||||||||||||||
| (In millions, except for percentages) | Net Carrying Value |
Percentage of Total |
Net Carrying Value |
Percentage of Total |
||||||||||||
| Property type |
||||||||||||||||
| Hotels |
$ | 937 | 17.6% | $ | 877 | 16.2% | ||||||||||
| Retail |
1,257 | 23.6% | 1,230 | 22.8% | ||||||||||||
| Office building |
1,229 | 23.0% | 1,274 | 23.6% | ||||||||||||
| Industrial |
748 | 14.1% | 821 | 15.2% | ||||||||||||
| Apartment |
728 | 13.7% | 907 | 16.8% | ||||||||||||
| Other commercial |
424 | 8.0% | 291 | 5.4% | ||||||||||||
|
|
|
|
|
|
|
|
|
|||||||||
| Total commercial mortgage loans |
$ | 5,323 | 100.0% | $ | 5,400 | 100.0% | ||||||||||
|
|
|
|
|
|
|
|
|
|||||||||
| U.S. Region |
||||||||||||||||
| East North Central |
$ | 477 | 9.0% | $ | 443 | 8.2% | ||||||||||
| East South Central |
121 | 2.3% | 129 | 2.4% | ||||||||||||
| Middle Atlantic |
694 | 13.0% | 804 | 14.9% | ||||||||||||
| Mountain |
591 | 11.1% | 583 | 10.8% | ||||||||||||
| New England |
203 | 3.8% | 181 | 3.3% | ||||||||||||
| Pacific |
873 | 16.4% | 838 | 15.5% | ||||||||||||
| South Atlantic |
1,300 | 24.4% | 1,231 | 22.8% | ||||||||||||
| West North Central |
264 | 5.0% | 291 | 5.4% | ||||||||||||
| West South Central |
717 | 13.4% | 792 | 14.7% | ||||||||||||
|
|
|
|
|
|
|
|
|
|||||||||
| Total U.S. Region |
5,240 | 98.4% | 5,292 | 98.0% | ||||||||||||
| International Region |
83 | 1.6% | 108 | 2.0% | ||||||||||||
|
|
|
|
|
|
|
|
|
|||||||||
| Total commercial mortgage loans |
$ | 5,323 | 100.0% | $ | 5,400 | 100.0% | ||||||||||
|
|
|
|
|
|
|
|
|
|||||||||
Our residential mortgage loan portfolio is comprised mostly of non-agency, first lien residential mortgage loans, collateralized by properties located in the U.S, primarily in California and Texas.
Mortgage Loan Valuation Allowance—We have a high-quality, well-performing mortgage loan portfolio, for which we have established a valuation allowance for collection losses. The assessment of mortgage loan impairments and valuation allowances is substantially the same for residential and commercial mortgage loans. The valuation allowance was $2 million as of September 30, 2016, and December 31, 2015. There were no material impairments recorded or significant activity in the valuation allowance during the nine months ended September 30, 2016, or 2015.
Residential mortgage loans—The primary credit quality indicator of residential mortgage loans is loan performance. Nonperforming residential mortgage loans are 90 days or more past due or in non-accrual status. All of our residential mortgage loans were performing as of September 30, 2016, and December 31, 2015, respectively.
F-131
Table of Contents
ATHENE HOLDING LTD.
Notes to Condensed Consolidated Financial Statements (Unaudited)
Commercial mortgage loans—The following provides the aging of our commercial mortgage loan portfolio, including those under development, net of valuation allowances:
| (In millions) | September 30, 2016 | December 31, 2015 | ||||||
| Current (less than 30 days past due) |
$ | 5,301 | $ | 5,360 | ||||
| 30 to 60 days past due |
— | 1 | ||||||
| Over 90 days past due |
22 | 39 | ||||||
|
|
|
|
|
|||||
| Total commercial mortgage loans |
$ | 5,323 | $ | 5,400 | ||||
|
|
|
|
|
|||||
Loan-to-value and debt service coverage ratios are measures we use to assess the risk and quality of commercial mortgage loans other than those under development. Loans under development are not evaluated using these ratios as they are generally not yet income-producing and the value of the underlying property significantly fluctuates based on the progress of construction. Therefore, the risk and quality of loans under development are evaluated based on the aging and geographical distribution of such loans as shown above.
The loan-to-value ratio is expressed as a percentage of the amount of the loan relative to the value of the underlying property. A loan-to-value ratio in excess of 100% indicates the unpaid loan amount exceeds the underlying collateral. The following represents the loan-to-value ratio of the commercial mortgage loan portfolio, excluding those under development, net of valuation allowances:
| (In millions) | September 30, 2016 | December 31, 2015 | ||||||
| Less than 50% |
$ | 1,801 | $ | 2,087 | ||||
| 50% to 60% |
1,380 | 1,024 | ||||||
| 61% to 70% |
1,314 | 1,299 | ||||||
| 71% to 100% |
568 | 697 | ||||||
| Greater than 100% |
88 | 71 | ||||||
|
|
|
|
|
|||||
| Commercial mortgage loans |
$ | 5,151 | $ | 5,178 | ||||
|
|
|
|
|
|||||
The debt service coverage ratio, based upon the most recent financial statements, is expressed as a percentage of a property’s net income to its debt service payments. A debt service ratio of less than 1.0 indicates a property’s operations do not generate enough income to cover debt payments. The following represents the debt service coverage ratio of the commercial mortgage loan portfolio, excluding those under development, net of valuation allowances:
| (In millions) | September 30, 2016 | December 31, 2015 | ||||||
| Greater than 1.20x |
$ | 4,437 | $ | 4,455 | ||||
| 1.00x – 1.20x |
446 | 471 | ||||||
| Less than 1.00x |
268 | 252 | ||||||
|
|
|
|
|
|||||
| Commercial mortgage loans |
$ | 5,151 | $ | 5,178 | ||||
|
|
|
|
|
|||||
Real Estate—Depreciation expense on invested real estate was $8 million and zero during the nine months ended September 30, 2016, and 2015, respectively. Accumulated depreciation was $10 million and $2 million as of September 30, 2016, and December 31, 2015, respectively.
Investment Funds—Our investment fund portfolio consists of funds that employ various strategies and include investments in mortgage and real estate, credit, private equity, natural resources, and hedge funds. Investment funds meet the definition of variable interest entities and are discussed further in Note 4 – Variable Interest Entities.
F-132
Table of Contents
ATHENE HOLDING LTD.
Notes to Condensed Consolidated Financial Statements (Unaudited)
3. Derivative Instruments
We use a variety of derivative instruments to manage equity risk, interest rate risk, credit risk, foreign currency risk, and market volatility. There have been no significant changes in our accounting policies related to derivatives during the nine months ended September 30, 2016. See Note 5 – Fair Value for information about the fair value hierarchy for derivatives.
The following table presents the notional amount and fair value of derivative instruments:
| September 30, 2016 | December 31, 2015 | |||||||||||||||||||||||
| Notional Amount |
Fair Value | Notional Amount |
Fair Value | |||||||||||||||||||||
| (In millions) | Assets | Liabilities | Assets | Liabilities | ||||||||||||||||||||
| Derivatives designated as hedges |
||||||||||||||||||||||||
| Foreign currency swaps |
206 | $ | 7 | $ | 10 | 177 | $ | 14 | $ | — | ||||||||||||||
| Derivatives not designated as hedges |
||||||||||||||||||||||||
| Equity options |
26,119 | 1,143 | — | 25,176 | 831 | — | ||||||||||||||||||
| Futures |
— | 7 | — | — | 9 | 1 | ||||||||||||||||||
| Total return swaps |
41 | — | — | 54 | — | — | ||||||||||||||||||
| Foreign currency swaps |
78 | 4 | 1 | 47 | 5 | — | ||||||||||||||||||
| Interest rate swaps |
591 | 2 | 10 | 859 | 2 | 8 | ||||||||||||||||||
| Credit default swaps |
10 | — | 8 | 10 | — | 7 | ||||||||||||||||||
| Variance swaps |
— | 1 | — | — | 5 | — | ||||||||||||||||||
| Foreign currency forwards |
851 | 5 | — | 367 | 5 | 1 | ||||||||||||||||||
| Embedded derivatives |
||||||||||||||||||||||||
| Funds withheld |
— | 205 | 30 | — | 36 | 35 | ||||||||||||||||||
| Interest sensitive contract liabilities |
— | — | 5,273 | — | — | 4,477 | ||||||||||||||||||
|
|
|
|
|
|
|
|
|
|
|
|
| |||||||||||||
| Total non-hedging derivatives |
1,367 | 5,322 | 893 | 4,529 | ||||||||||||||||||||
|
|
|
|
|
|
|
|
|
|
|
|
| |||||||||||||
| Total derivatives |
$ | 1,374 | $ | 5,332 | $ | 907 | $ | 4,529 | ||||||||||||||||
|
|
|
|
|
|
|
|
|
|
|
|
| |||||||||||||
Derivatives are included in derivative assets or liabilities on the condensed consolidated balance sheets, with the exception of embedded derivatives. Funds withheld embedded derivatives are included in funds withheld at interest or funds withheld liability on the condensed consolidated balance sheets. Indexed annuity products embedded derivatives are included in interest sensitive contract liabilities on the condensed consolidated balance sheets.
Derivatives Designated as Hedges
Foreign currency swaps – We use foreign currency swaps to convert foreign currency denominated cash flows of an investment to U.S. dollars to reduce cash flow fluctuations due to changes in currency exchange rates. Certain of these swaps are designated as hedges. As of September 30, 2016, and December 31, 2015, we had 34 and five, respectively, foreign currency swaps designated and accounted for as cash flow hedges. The foreign currency swaps will expire by June 2043. During the nine months ended September 30, 2016, and 2015, we had foreign currency swap losses of $13 million and gains of $9 million, respectively, recorded in AOCI. No amounts were reclassified to income. There were no amounts deemed ineffective for the nine months ended September 30, 2016, and 2015.
F-133
Table of Contents
ATHENE HOLDING LTD.
Notes to Condensed Consolidated Financial Statements (Unaudited)
Derivatives Not Designated as Hedges
Equity options – We use equity indexed options to economically hedge fixed indexed annuity products that guarantee the return of principal to the policyholder and credit interest based on a percentage of the gain in a specified market index, primarily the S&P 500. To hedge against adverse changes in equity indices, we enter into contracts to buy the equity indexed options within a limited time at a contracted price. The contracts are net settled in cash based on differentials in the indices at the time of exercise and the strike price.
Futures – Futures contracts are purchased to hedge the growth in interest credited to the customer as a direct result of increases in the related indices. We enter into exchange-traded futures with regulated futures commission clearing brokers who are members of a trading exchange. Under exchange-traded futures contracts, we agree to purchase a specified number of contracts with other parties and to post variation margin on a daily basis in an amount equal to the difference in the daily fair values of those contracts.
Total return swaps – We purchase total rate of return swaps to gain exposure and benefit from a reference asset without ownership. Total rate of return swaps are contracts in which one party makes payments based on a set rate, either fixed or variable, while the other party makes payments based on the return of the underlying asset, which includes both the income it generates and any capital gains.
Interest rate swaps – We use interest rate swaps to reduce market risks from interest rate changes and to alter interest rate exposure arising from mismatches between assets and liabilities. With an interest rate swap, we agree with another party to exchange the difference between fixed-rate and floating-rate interest amounts tied to an agreed-upon notional principal amount at specified intervals.
Credit default swaps – Credit default swaps provide a measure of protection against the default of an issuer or allow us to gain credit exposure to an issuer or traded index. We use credit default swaps coupled with a bond to synthetically create the characteristics of a bond and to hedge credit risk. These transactions have a lower cost and are more liquid relative to the cash market. We receive a periodic premium for these transactions as compensation for accepting credit risk.
Hedging credit risk involves buying protection for existing credit risk. The exposure resulting from the agreements, which is usually the notional amount, is equal to the maximum proceeds that must be paid by a counterparty for a defaulted security. If a credit event occurs on a reference entity, then a counterparty who sold protection is required to pay the buyer the trade notional amount less any recovery value of the security.
Variance swaps – We have variance swaps to hedge the growth in interest credited to the customer as a direct result of changes in the volatility of the specified market index, primarily the S&P 500. In a variance swap transaction, we agree to exchange future realized volatility for current implied volatility. This type of forward contract pays the difference between the realized variance and a predefined strike multiplied by a notional value.
Foreign currency forwards – We use foreign currency forward contracts to hedge certain invested assets against movement in foreign currency. The price is agreed upon at the time of the contract and payment is made at a specified future date.
Embedded derivatives – We have embedded derivatives which are required to be separated from their host contracts and reported as derivatives. Host contracts include reinsurance agreements structured on a modified coinsurance (modco) or funds withheld basis and indexed annuity products.
F-134
Table of Contents
ATHENE HOLDING LTD.
Notes to Condensed Consolidated Financial Statements (Unaudited)
The following is a summary of the gains (losses) related to derivatives not designated as hedges:
| Nine months ended September 30, | ||||||||
| (In millions) | 2016 | 2015 | ||||||
| Equity options |
$ | 105 | $ | (599) | ||||
| Futures |
(14) | (12) | ||||||
| Total return swaps |
4 | (4) | ||||||
| Credit default swaps |
— | 1 | ||||||
| Foreign currency swaps |
10 | 10 | ||||||
| Interest rate swaps |
(5) | (5) | ||||||
| Foreign currency forwards |
16 | 14 | ||||||
| Embedded derivatives on funds withheld |
271 | 89 | ||||||
|
|
|
|
|
|||||
| Amounts recognized in investment related gains (losses) |
387 | (506) | ||||||
| Embedded derivatives in indexed annuity products1 |
(391) | 314 | ||||||
|
|
|
|
|
|||||
| Total gains (losses) for derivatives not designated as hedges |
$ | (4) | $ | (192) | ||||
|
|
|
|
|
|||||
| 1 | Included in interest sensitive contract benefits. |
Credit Risk—We may be exposed to credit-related losses in the event of counterparty nonperformance on derivative financial instruments. Generally, the current credit exposure of our derivative contracts is the fair value at the reporting date less any collateral received from the counterparty.
We manage credit risk related to over-the-counter derivatives by entering into transactions with creditworthy counterparties. Where possible, we maintain collateral arrangements and use master agreements that provide for a single net payment from one counterparty to another at each due date and upon termination. We have also established counterparty exposure limits, where possible, in order to evaluate if there is sufficient collateral to support the net exposure.
Collateral arrangements typically require the posting of collateral in connection with its derivative instruments. Collateral agreements often contain posting thresholds, some of which may vary depending on the posting party’s financial strength ratings. Additionally, a decrease in our financial strength rating to a specified level can result in settlement of the derivative position. As of September 30, 2016, and December 31, 2015, we had $19 million and $9 million, respectively, of collateral pledged to counterparties. The securities pledged as collateral are included in AFS fixed maturity securities on the condensed consolidated balance sheets.
F-135
Table of Contents
ATHENE HOLDING LTD.
Notes to Condensed Consolidated Financial Statements (Unaudited)
The estimated fair value of our net derivative and other financial assets and liabilities after the application of master netting agreements and collateral were as follows:
| Gross amounts not offset on the condensed consolidated balance sheets |
||||||||||||||||||||||||
| (In millions) | Gross amount recognized1 |
Financial instruments2 |
Collateral received/pledged |
Net amount | Off-balance sheet securities collateral3 |
Net amount after securities collateral |
||||||||||||||||||
| September 30, 2016 |
||||||||||||||||||||||||
| Derivative assets |
$ | 1,169 | $ | (7) | $ | (1,121) | $ | 41 | $ | (35) | $ | 6 | ||||||||||||
| Derivative liabilities |
(29) | 7 | 19 | (3) | — | (3) | ||||||||||||||||||
| December 31, 2015 |
||||||||||||||||||||||||
| Derivative assets |
$ | 871 | $ | (7) | $ | (867) | $ | (3) | $ | (57) | $ | (60) | ||||||||||||
| Derivative liabilities |
(17) | 7 | 9 | (1) | — | (1) | ||||||||||||||||||
| 1 | The gross amounts of recognized derivative assets and derivative liabilities are reported on the condensed consolidated balance sheets. As of September 30, 2016, and December 31, 2015, amounts that are not subject to master netting agreements or similar agreements were immaterial. |
| 2 | Represents amounts offsetting derivative assets and derivative liabilities that are subject to an enforceable master netting agreement or similar agreement that are not netted against the gross derivative assets or gross derivative liabilities for presentation on the condensed consolidated balance sheets. |
| 3 | For securities collateral received, we do not have the right to sell or re-pledge the collateral. As such, we do not record the securities on the condensed consolidated balance sheets. |
Certain derivative instruments contain provisions for credit related events, such as downgrades in our credit ratings or for a negative credit event of a credit default swap’s reference entity. If a credit event were to occur, we may be required to post additional collateral or settle an outstanding liability. The following is a summary of our exposure to credit related events:
| (In millions) | September 30, 2016 | December 31, 2015 | ||||||
| Fair value of derivative liabilities with credit related provisions |
$ | 8 | $ | 7 | ||||
| Maximum exposure for credit default swaps |
10 | 10 | ||||||
There was no additional collateral required for default or termination events as of September 30, 2016, or December 31, 2015.
4. Variable Interest Entities
Our investment funds meet the definition of a VIE, and in certain cases these investment funds are consolidated in our financial statements because we meet the criteria of the primary beneficiary.
Consolidated VIEs—We consolidate CoInvest VI, CoInvest VII, CoInvest Other, London Prime, and CMBS Funds, which are investment funds. We are the only limited partner in these investment funds and receive all of the economic benefits and losses, other than management fees and carried interest, as applicable, paid to the general partner in each entity, which are related parties. We do not have any voting rights as limited partner and do not solely satisfy the power criteria to direct the activities that significantly impact the economics of the VIE. However, the criteria for the primary beneficiary are satisfied by our related party group and because substantially all of the activities are conducted on our behalf, we consolidate the investment funds.
F-136
Table of Contents
ATHENE HOLDING LTD.
Notes to Condensed Consolidated Financial Statements (Unaudited)
No arrangement exists requiring us to provide additional funding in excess of our committed capital investment, liquidity, or the funding of losses or an increase to our loss exposure in excess of our investment in the VIEs. We elected the fair value option for fixed maturity and equity securities and investment funds, which are reported in the consolidated variable interest entity sections on the condensed consolidated balance sheets.
CoInvest VI, CoInvest VII, and CoInvest Other were formed to make investments, including co-investments alongside private equity funds sponsored by Apollo. We received our interests in CoInvest VI, CoInvest VII, and CoInvest Other as part of a contribution agreement in 2012 with AAA Guarantor – Athene, L.P. and its subsidiary, Apollo Life Re Ltd., in order to provide a capital base to support future acquisitions. London Prime was formed for the purpose of investing in Prime London Ventures Limited, a Guernsey limited company, which purchases rental residential assets across prime central London.
The CMBS Funds were formed with the objective of generating high risk-adjusted investment returns by investing primarily in a portfolio of eligible CMBS and using leverage through repurchase agreements treated as collateralized financing. During the third quarter of 2016, the CMBS Funds each sold investments to fully settle the borrowings under their respective repurchase agreements of $500 million. The remaining investments of $167 million were distributed directly to us.
We also consolidate NCL LLC. During the third quarter of 2016, CoInvest VI contributed its largest investment, Norwegian Cruise Line Holdings Ltd. (NCLH) shares with a value of $143 million, to a newly formed entity, NCL LLC, in exchange for 100% of the membership interests in this entity. Subsequent to this contribution, CoInvest VI distributed its Class A membership interests in NCL LLC to us and the Class B membership interests in NCL LLC to the general partner of CoInvest VI. NCL LLC is subject to the same management fees, selling restrictions, and carried interest calculation as CoInvest VI. NCL LLC classifies its NCLH shares as an AFS security. We are the primary beneficiary and consolidate NCL LLC, as substantially all of its activities are conducted on our behalf.
CoInvest VII holds a significant investment in an investment fund, MidCap FinCo Limited (MidCap FinCo). During 2016, we purchased a pool of loans sourced by MidCap FinCo and contemporaneously sold subordinated participation interests in the loans to a subsidiary of MidCap FinCo. As of September 30, 2016, the $18 million due to MidCap FinCo under the subordinated participation agreement is reflected as a secured borrowing in other liabilities on the condensed consolidated balance sheets.
Trading securities – including related party – Trading securities represents investments in fixed maturity and equity securities with changes in fair value recognized in investment related gains (losses) within revenues of consolidated variable interest entities on the condensed consolidated statements of income. For the nine months ended September 30, 2016, and 2015, investment related gains (losses) included losses of $51 million and $27 million, respectively, resulting from the change in unrealized gains and losses underlying trading securities we still held as of the respective period end date. Trading securities held by CoInvest VI and CoInvest VII are considered related party investments because Apollo affiliates exercise significant influence over the operations of these investees.
Investment funds – including related party – Investment funds include non-fixed income, alternative investments in the form of limited partnerships or similar legal structures that meet the definition of VIEs; however, our consolidated VIEs are not considered the primary beneficiary of these investment funds. Changes in fair value of these investment funds are included in investment related gains (losses) within revenues of consolidated variable interest entities on the condensed consolidated statements of income. Investment funds held by CoInvest VII and CoInvest Other are considered related party investments as they are sponsored or managed by Apollo affiliates.
F-137
Table of Contents
ATHENE HOLDING LTD.
Notes to Condensed Consolidated Financial Statements (Unaudited)
Fair Value – See Note 5 – Fair Value for a description of the levels of our fair value hierarchy and our process for determining the level to which we assign our assets and liabilities carried at fair value.
The following represents the hierarchy for assets and liabilities of our consolidated VIEs measured at fair value on a recurring basis:
| September 30, 2016 | ||||||||||||||||
| (in millions) | Total | Level 1 | Level 2 | Level 3 | ||||||||||||
| Assets of consolidated variable interest entities |
||||||||||||||||
| Investments |
||||||||||||||||
| AFS securities |
||||||||||||||||
| Equity securities |
$ | 143 | $ | 143 | $ | — | $ | — | ||||||||
| Trading securities |
||||||||||||||||
| Fixed maturity securities |
51 | — | — | 51 | ||||||||||||
| Equity securities |
90 | 43 | — | 47 | ||||||||||||
| Investment funds |
541 | — | — | 541 | ||||||||||||
| Cash and cash equivalents |
4 | 4 | — | — | ||||||||||||
|
|
|
|
|
|
|
|
|
|||||||||
| Total assets of consolidated VIEs measured at fair value |
$ | 829 | $ | 190 | $ | — | $ | 639 | ||||||||
|
|
|
|
|
|
|
|
|
|||||||||
| December 31, 2015 | ||||||||||||||||
| (in millions) | Total | Level 1 | Level 2 | Level 3 | ||||||||||||
| Assets of consolidated variable interest entities |
||||||||||||||||
| Investments |
||||||||||||||||
| Trading securities |
||||||||||||||||
| Fixed maturity securities |
$ | 722 | $ | — | $ | 669 | $ | 53 | ||||||||
| Equity securities |
309 | 271 | — | 38 | ||||||||||||
| Investment funds |
516 | — | — | 516 | ||||||||||||
| Cash and cash equivalents |
6 | 6 | — | — | ||||||||||||
|
|
|
|
|
|
|
|
|
|||||||||
| Total assets of consolidated VIEs measured at fair value |
$ | 1,553 | $ | 277 | $ | 669 | $ | 607 | ||||||||
|
|
|
|
|
|
|
|
|
|||||||||
Fair Value Valuation Methods—Refer to Note 5 – Fair Value for the valuation methods used to determine the fair value of trading securities, investment funds, and cash and cash equivalents.
F-138
Table of Contents
ATHENE HOLDING LTD.
Notes to Condensed Consolidated Financial Statements (Unaudited)
Level 3 Financial Instruments – The following is a reconciliation for all VIE Level 3 assets and liabilities measured at fair value on a recurring basis:
| Nine months ended September 30, 2016 | ||||||||||||||||||||||||||||||||
| (In millions) | Beginning Balance |
Total realized and unrealized gains (losses) included in income |
Purchases/ Borrowings |
Sales/ Repayments |
Transfers in (out) |
Other | Ending Balance |
Total gains (losses) included in earnings1 |
||||||||||||||||||||||||
| Assets of consolidated variable interest entities |
||||||||||||||||||||||||||||||||
| Trading securities |
||||||||||||||||||||||||||||||||
| Fixed maturity securities |
$ | 53 | $ | (1) | $ | — | $ | (1) | $ | — | $ | — | $ | 51 | $ | (1) | ||||||||||||||||
| Equity securities |
38 | 8 | 1 | — | — | — | 47 | 8 | ||||||||||||||||||||||||
| Investment funds |
516 | 30 | 9 | (14) | — | — | 541 | 30 | ||||||||||||||||||||||||
|
|
|
|
|
|
|
|
|
|
|
|
|
|
|
|
|
|||||||||||||||||
| Total Level 3 assets of consolidated VIEs |
$ | 607 | $ | 37 | $ | 10 | $ | (15) | $ | — | $ | — | $ | 639 | $ | 37 | ||||||||||||||||
|
|
|
|
|
|
|
|
|
|
|
|
|
|
|
|
|
|||||||||||||||||
| 1 | Related to instruments held at end of period. |
| Nine months ended September 30, 2015 | ||||||||||||||||||||||||||||||||
| (In millions) | Beginning Balance |
Total realized and unrealized gains (losses) included in income |
Purchases/ Borrowings |
Sales/ Repayments |
Transfers in (out) |
Other2 | Ending Balance |
Total gains (losses) included in earnings1 |
||||||||||||||||||||||||
| Assets of consolidated variable interest entities |
||||||||||||||||||||||||||||||||
| Trading securities |
||||||||||||||||||||||||||||||||
| Fixed maturity securities |
$ | 57 | $ | (1) | $ | — | $ | — | $ | — | $ | — | $ | 56 | $ | (1) | ||||||||||||||||
| Equity securities |
62 | (10) | — | — | — | (9) | 43 | (10) | ||||||||||||||||||||||||
| Investment funds |
40 | 5 | 6 | (11) | — | 473 | 513 | 5 | ||||||||||||||||||||||||
| Loans held for investment |
2,071 | — | — | — | — | (2,071) | — | — | ||||||||||||||||||||||||
|
|
|
|
|
|
|
|
|
|
|
|
|
|
|
|
|
|||||||||||||||||
| Total Level 3 assets of consolidated VIEs |
$ | 2,230 | $ | (6) | $ | 6 | $ | (11) | $ | — | $ | (1,607) | $ | 612 | $ | (6) | ||||||||||||||||
|
|
|
|
|
|
|
|
|
|
|
|
|
|
|
|
|
|||||||||||||||||
| Liabilities of consolidated variable interest entities |
||||||||||||||||||||||||||||||||
| Borrowings |
$ | (1,517) | $ | — | $ | — | $ | — | $ | — | $ | 1,517 | $ | — | $ | — | ||||||||||||||||
|
|
|
|
|
|
|
|
|
|
|
|
|
|
|
|
|
|||||||||||||||||
| Total Level 3 liabilities of consolidated VIEs |
$ | (1,517) | $ | — | $ | — | $ | — | $ | — | $ | 1,517 | $ | — | $ | — | ||||||||||||||||
|
|
|
|
|
|
|
|
|
|
|
|
|
|
|
|
|
|||||||||||||||||
| 1 | Related to instruments held at end of period. |
| 2 | Other activity primarily relates to the deconsolidation of MidCap Financial Holdings, LLC and its restructuring into MidCap FinCo. |
There were no transfers between Level 1, Level 2, or Level 3 during the nine months ended September 30, 2016, and 2015.
F-139
Table of Contents
ATHENE HOLDING LTD.
Notes to Condensed Consolidated Financial Statements (Unaudited)
Significant Unobservable Inputs – For certain Level 3 trading securities and investment funds, the valuations have significant unobservable inputs for comparable multiples and weighed average cost of capital rates applied in the valuation models. These inputs in isolation can cause significant increases or decreases in fair value. Specifically, the comparable multiples are multiplied by the underlying investment’s earnings before interest, tax, depreciation, and amortization to establish the total enterprise value of the underlying investments. We use a comparable multiple consistent with the implied trading multiple of public industry peers.
For other Level 3 trading securities, investment funds, loans held for investment, and borrowings, valuations are performed using a discounted cash flow model. For a discounted cash flow model, the significant input is the discount rate applied to present value the projected cash flows. An increase in the discount rate can significantly lower the fair value; a decrease in the discount rate can significantly increase the fair value. The discount rate is determined by considering the weighted average cost of capital calculation of companies in similar industries with comparable debt to equity ratios.
We apply a discount to the values reported by the investment funds for certain Level 3 trading securities and investment funds held within consolidated VIEs related to the lack of marketability of the underlying investment. As the degree of marketability increases, the related discount applied to the underlying investment is decreased. The weighted average of the discount rates applied to each individual investment are 13% and 34% as of September 30, 2016, and December 31, 2015, respectively.
Fair Value Option – The following represents the gains (losses) recorded for instruments within the consolidated VIEs for which we have elected the fair value option:
| Nine months ended September 30, | ||||||||
| (In millions) | 2016 | 2015 | ||||||
| Trading securities |
||||||||
| Fixed maturity securities |
$ | (1) | $ | (1) | ||||
| Equity securities |
(77) | 3 | ||||||
| Investment funds |
31 | 4 | ||||||
|
|
|
|
|
|||||
| Total gains (losses) |
$ | (47) | $ | 6 | ||||
|
|
|
|
|
|||||
Fair Value of Financial Instruments Not Held at Fair Value – Assets of consolidated variable interest entities includes $12 million and $18 million of investment funds accounted for under the equity method and, therefore, not carried at fair value as of September 30, 2016, and December 31, 2015, respectively; however, the carrying amount approximates fair value. Liabilities of consolidated variable interest entities included $500 million of borrowings held at cost as of December 31, 2015, and the unpaid principal balance of borrowings approximated fair value.
Commitments and Contingencies – Included in assets of CoInvest VI, one of our consolidated VIEs on the condensed consolidated balance sheets, are equity investments in publicly traded shares of Caesars Entertainment Corporation (CEC) and Caesars Acquisition Company (CAC). We received the CEC and CAC shares as part of a contribution agreement in 2012 with AAA Guarantor – Athene, L.P. and its subsidiary, Apollo Life Re Ltd., in order to provide a capital base to support future acquisitions. There are pending claims against CEC, CAC, and/or others, related to certain guaranties issued for debt of Caesars Entertainment Operating Company (CEOC) and/or certain transactions involving CEOC and certain of its subsidiaries (collectively, Debtors), CEC, CAC, and others. CEC and the Debtors announced on or about September 26, 2016, that CEC and CEOC had received confirmations from representatives of CEOC’s major creditor groups of those groups’ support for a term sheet
F-140
Table of Contents
ATHENE HOLDING LTD.
Notes to Condensed Consolidated Financial Statements (Unaudited)
that describes the key economic terms of a proposed consensual chapter 11 plan for the Debtors. A term of the proposed consensual chapter 11 plan provides that CoInvest VI and others will not retain their CEC shares, and CoInvest VI and others will receive releases to the fullest extent permitted by law. As a result, CoInvest VI recorded a loss of $25 million during the third quarter of 2016 for the carrying value of the CEC shares. As of September 30, 2016, CoInvest VI’s investment in CAC is carried at its fair value of $42 million.
Non-Consolidated VIEs—We invest in other entities meeting the definition of a VIE. We do not consolidate these investments because we do not meet the criteria of primary beneficiary as described below.
Fixed Maturity Securities – We invest in securitization entities as a debt holder or an investor in the residual interest of the securitization vehicle, which are included in fixed maturity securities on the condensed consolidated balance sheets. These entities are deemed VIEs due to insufficient equity within the structure and lack of control by the equity investors over the activities that significantly impact the economics of the entity. In general, we are a debt investor within these entities and, as such, hold a variable interest; however, due to the debt holders’ lack of ability to control the decisions within the trust that significantly impact the entity, and the fact the debt holders are protected from losses due to the subordination by the equity tranche, the debt holders are not deemed the primary beneficiary. Securitization vehicles in which we hold the residual tranche are not consolidated because we do not unilaterally have substantive rights to remove the general partner, or when assessing related party interests, we are not under common control, as defined by GAAP, with the related party, nor are substantially all of the activities conducted on our behalf; therefore, we are not deemed the primary beneficiary. Debt investments and investments in the residual tranche of securitization entities are considered debt instruments and are held at fair value on the balance sheet and classified as AFS or trading.
Investment funds – Investment funds include non-fixed income, alternative investments in the form of limited partnerships or similar legal structures that meet the definition of VIEs.
A portion of these investment funds are sponsored and managed by unrelated parties in which we, as limited partner, do not have the power to direct the activities that most significantly impact the economic performance of the fund, nor do we unilaterally have substantive rights to remove the general partner or dissolve the entity without cause. As a result, we do not meet the power criterion to be considered the primary beneficiary and do not consolidate these VIEs in our financial statements.
We also have equity interests in investment funds where the general partner or investment manager is a related party. We have determined in accordance with GAAP we are not under common control with the related party, nor are we deemed to be the primary beneficiary. As a result, investments in these VIEs are not consolidated.
We account for non-consolidated investment funds where we are able to exercise significant influence over the entity under the equity method or by electing the fair value option, in which NAV is used as a practical expedient for fair value.
Our investments in investment funds are generally passive in nature as we do not take an active role in the investment fund’s management. Our risk of loss is limited and depends on the investment as follows: (1) investment funds accounted for under the equity method are limited to our initial investment plus unfunded commitments; (2) investment funds under the fair value option are limited to the fair value plus unfunded commitments; (3) AFS securities and other investments are limited to cost or amortized cost; and (4) trading securities are limited to carrying value.
F-141
Table of Contents
ATHENE HOLDING LTD.
Notes to Condensed Consolidated Financial Statements (Unaudited)
The following summarizes the carrying value and maximum loss exposure of these non-consolidated VIEs:
| September 30, 2016 | December 31, 2015 | |||||||||||||||
| (In millions) | Carrying Value | Maximum Loss Exposure |
Carrying Value | Maximum Loss Exposure |
||||||||||||
| Investment funds |
$ | 725 | $ | 888 | $ | 733 | $ | 878 | ||||||||
| Investment in related parties – investment funds |
1,073 | 1,355 | 997 | 1,454 | ||||||||||||
| Assets of consolidated variable interest entities – investment funds |
553 | 577 | 534 | 558 | ||||||||||||
| Investment in fixed maturity securities |
19,069 | 19,016 | 17,673 | 18,146 | ||||||||||||
| Investment in related parties – fixed maturity and equity securities |
524 | 527 | 525 | 554 | ||||||||||||
|
|
|
|
|
|
|
|
|
|||||||||
| Total investment funds’ assets |
$ | 21,944 | $ | 22,363 | $ | 20,462 | $ | 21,590 | ||||||||
|
|
|
|
|
|
|
|
|
|||||||||
The following summarizes our investment funds, including related party investment funds and investment funds owned by consolidated VIEs:
| September 30, 2016 | December 31, 2015 | |||||||||||||||||||||||
| (In millions, except for percentages and years) | Carrying value |
Percent of total |
Life of underlying funds in years |
Carrying value |
Percent of total |
Life of underlying funds in years |
||||||||||||||||||
| Investment funds |
||||||||||||||||||||||||
| Private equity |
$ | 262 | 36.2% | 0 – 6 | $ | 263 | 35.9% | 0 – 7 | ||||||||||||||||
| Mortgage and real estate |
112 | 15.4% | 0 – 5 | 101 | 13.8% | 0 – 7 | ||||||||||||||||||
| Natural resources |
5 | 0.7% | 0 – 1 | 6 | 0.8% | 0 – 1 | ||||||||||||||||||
| Hedge funds |
72 | 9.9% | 1 – 3 | 86 | 11.7% | 0 – 4 | ||||||||||||||||||
| Credit funds |
274 | 37.8% | 0 – 2 | 277 | 37.8% | 0 – 5 | ||||||||||||||||||
|
|
|
|
|
|
|
|
|
|||||||||||||||||
| Total investment funds |
725 | 100.0% | 733 | 100.0% | ||||||||||||||||||||
|
|
|
|
|
|
|
|
|
|||||||||||||||||
| Investment funds – related parties |
||||||||||||||||||||||||
| Private equity – A-A Mortgage1 |
316 | 29.5% | 6 – 6 | 225 | 22.6% | 6 – 7 | ||||||||||||||||||
| Private equity – other |
47 | 4.4% | 2 – 9 | 36 | 3.6% | 6 – 7 | ||||||||||||||||||
| Mortgage and real estate |
245 | 22.8% | 0 – 4 | 234 | 23.5% | 0 – 7 | ||||||||||||||||||
| Natural resources |
45 | 4.2% | 5 – 6 | 46 | 4.6% | 3 – 7 | ||||||||||||||||||
| Hedge funds |
186 | 17.3% | 9 – 10 | 256 | 25.6% | 0 – 1 | ||||||||||||||||||
| Credit funds |
234 | 21.8% | 2 – 3 | 200 | 20.1% | 3 – 10 | ||||||||||||||||||
|
|
|
|
|
|
|
|
|
|||||||||||||||||
| Total investment funds – related parties |
1,073 | 100.0% | 997 | 100.0% | ||||||||||||||||||||
|
|
|
|
|
|
|
|
|
|||||||||||||||||
| Investment funds owned by consolidated VIEs |
||||||||||||||||||||||||
| Private equity – MidCap FinCo2 |
511 | 92.4% | N/A | 482 | 90.3% | N/A | ||||||||||||||||||
| Credit funds |
30 | 5.4% | 0 – 3 | 34 | 6.3% | 0 – 4 | ||||||||||||||||||
| Mortgage and real assets |
12 | 2.2% | 3 – 4 | 18 | 3.4% | 3 – 4 | ||||||||||||||||||
|
|
|
|
|
|
|
|
|
|||||||||||||||||
| Total investment funds owned by consolidated VIEs |
553 | 100.0% | 534 | 100.0% | ||||||||||||||||||||
|
|
|
|
|
|
|
|
|
|||||||||||||||||
| Total investment funds including related parties and funds owned by consolidated VIEs |
$ | 2,351 | $ | 2,264 | ||||||||||||||||||||
|
|
|
|
|
|||||||||||||||||||||
| 1 | A-A Mortgage Opportunities, LP (A-A Mortgage) is a platform to originate residential mortgage loans and mortgage servicing rights. |
| 2 | Our total investment in MidCap FinCo, including amounts advanced under credit facilities, totaled $748 million and $782 million at September 30, 2016, and December 31, 2015, respectively, which is greater than 10% of total AHL shareholders’ equity at the respective period end dates. |
F-142
Table of Contents
ATHENE HOLDING LTD.
Notes to Condensed Consolidated Financial Statements (Unaudited)
Summarized Ownership of Investment Funds—The following table presents the carrying value by ownership percentage of equity method investment funds, including related party investment funds and investment funds owned by consolidated VIEs:
| (In millions) | September 30, 2016 | December 31, 2015 | ||||||||||
| Ownership Percentage |
||||||||||||
| 100% |
$ | 29 | $ | 49 | ||||||||
| 50% – 99% |
370 | 322 | ||||||||||
| Greater than 3% – 49% |
1,276 | 1,225 | ||||||||||
|
|
|
|
|
|||||||||
| Equity method investment funds |
$ | 1,675 | $ | 1,596 | ||||||||
|
|
|
|
|
|||||||||
The following table presents the carrying value by ownership percentage of investment funds where we elected the fair value option, including related party investment funds and investment funds owned by consolidated VIEs:
| (In millions) | September 30, 2016 | December 31, 2015 | ||||||||||
| Ownership Percentage |
||||||||||||
| Greater than 3% – 49% |
$ | 541 | $ | 516 | ||||||||
| 3% or less |
135 | 152 | ||||||||||
|
|
|
|
|
|||||||||
| Fair value option investment funds |
$ | 676 | $ | 668 | ||||||||
|
|
|
|
|
|||||||||
5. Fair Value
Fair value is the price we would receive to sell an asset or pay to transfer a liability (exit price) in an orderly transaction between market participants. We determine fair value based on the following fair value hierarchy:
Level 1 – Unadjusted quoted prices for identical assets or liabilities in an active market.
Level 2 – Quoted prices for inactive markets or valuation techniques that require observable direct or indirect inputs for substantially the full term of the asset or liability. Level 2 inputs include the following:
| • | Quoted prices for similar assets or liabilities in active markets, |
| • | Observable inputs other than quoted market prices, and |
| • | Observable inputs derived principally from market data through correlation or other means. |
Level 3 – Prices or valuation techniques with unobservable inputs significant to the overall fair value estimate. These valuations use critical assumptions not readily available to market participants. Level 3 valuations are based on market standard valuation methodologies, including discounted cash flows, matrix pricing, or other similar techniques.
The fair value hierarchy gives the highest priority to quoted prices in active markets for identical assets or liabilities (Level 1) and the lowest priority to unobservable inputs (Level 3). If the inputs used to measure fair value fall within different levels of the hierarchy, the category level is based on the lowest priority level input that is significant to the instrument’s fair value measurement.
We use a number of valuation sources to determine fair values. Valuation sources can include quoted market prices; third-party commercial pricing services; third-party brokers; industry-standard, vendor modeling software that uses market observable inputs; and other internal modeling techniques based on projected cash flows. We periodically review the assumptions and inputs of third-party commercial pricing services through internal valuation price variance reviews, comparisons to internal pricing models, back testing to recent trades, or monitoring trading volumes.
F-143
Table of Contents
ATHENE HOLDING LTD.
Notes to Condensed Consolidated Financial Statements (Unaudited)
The following represents the hierarchy for our assets and liabilities measured at fair value on a recurring basis:
| September 30, 2016 | ||||||||||||||||||||
| (In millions) | Total | NAV1 | Level 1 | Level 2 | Level 3 | |||||||||||||||
| Assets |
||||||||||||||||||||
| AFS securities |
||||||||||||||||||||
| Fixed maturity securities |
||||||||||||||||||||
| U.S. government and agencies |
$ | 73 | $ | — | $ | 33 | $ | 40 | $ | — | ||||||||||
| U.S. state, municipal, and political subdivisions |
1,230 | — | — | 1,225 | 5 | |||||||||||||||
| Foreign governments |
2,542 | — | — | 2,527 | 15 | |||||||||||||||
| Corporate |
30,619 | — | — | 30,277 | 342 | |||||||||||||||
| CLO |
4,879 | — | — | 4,756 | 123 | |||||||||||||||
| ABS |
2,712 | — | — | 1,618 | 1,094 | |||||||||||||||
| CMBS |
2,013 | — | — | 1,926 | 87 | |||||||||||||||
| RMBS |
8,855 | — | — | 8,855 | — | |||||||||||||||
|
|
|
|
|
|
|
|
|
|
|
|
|
|
|
| ||||||
| Total AFS fixed maturity securities |
52,923 | — | 33 | 51,224 | 1,666 | |||||||||||||||
| Equity securities |
335 | — | 66 | 264 | 5 | |||||||||||||||
|
|
|
|
|
|
|
|
|
|
|
|
|
|
|
| ||||||
| Total AFS securities |
53,258 | — | 99 | 51,488 | 1,671 | |||||||||||||||
|
|
|
|
|
|
|
|
|
|
|
|
|
|
|
| ||||||
| Trading securities |
||||||||||||||||||||
| Fixed maturity securities |
||||||||||||||||||||
| U.S. government and agencies |
3 | — | 3 | — | — | |||||||||||||||
| U.S. state, municipal, and political subdivisions |
145 | — | — | 128 | 17 | |||||||||||||||
| Corporate |
1,515 | — | — | 1,515 | — | |||||||||||||||
| CLO |
59 | — | — | — | 59 | |||||||||||||||
| ABS |
87 | — | — | — | 87 | |||||||||||||||
| CMBS |
86 | — | — | 86 | — | |||||||||||||||
| RMBS |
379 | — | — | 251 | 128 | |||||||||||||||
|
|
|
|
|
|
|
|
|
|
|
|
|
|
|
| ||||||
| Total trading fixed maturity securities |
2,274 | — | 3 | 1,980 | 291 | |||||||||||||||
| Equity securities |
447 | — | — | 447 | — | |||||||||||||||
|
|
|
|
|
|
|
|
|
|
|
|
|
|
|
| ||||||
| Total trading securities |
2,721 | — | 3 | 2,427 | 291 | |||||||||||||||
|
|
|
|
|
|
|
|
|
|
|
|
|
|
|
| ||||||
| Mortgage loans |
45 | — | — | — | 45 | |||||||||||||||
| Investment funds |
135 | 135 | — | — | — | |||||||||||||||
| Funds withheld at interest – embedded derivative |
205 | — | — | — | 205 | |||||||||||||||
| Derivative assets |
1,169 | — | 8 | 1,161 | — | |||||||||||||||
| Short-term investments |
164 | — | 13 | 151 | — | |||||||||||||||
| Cash and cash equivalents |
2,556 | — | 2,556 | — | — | |||||||||||||||
| Restricted cash |
63 | — | 63 | — | — | |||||||||||||||
| Investments in related parties |
||||||||||||||||||||
| AFS, fixed maturity securities |
||||||||||||||||||||
| CLO |
256 | — | — | 256 | — | |||||||||||||||
| ABS |
57 | — | — | — | 57 | |||||||||||||||
|
|
|
|
|
|
|
|
|
|
|
|
|
|
|
| ||||||
| Total AFS fixed maturity securities |
313 | — | — | 256 | 57 | |||||||||||||||
| AFS, equity securities |
20 | — | 20 | — | — | |||||||||||||||
|
|
|
|
|
|
|
|
|
|
|
|
|
|
|
| ||||||
| Total AFS securities – related party |
333 | — | 20 | 256 | 57 | |||||||||||||||
| Trading securities, CLO |
211 | — | — | 22 | 189 | |||||||||||||||
| Reinsurance recoverable |
1,878 | — | — | — | 1,878 | |||||||||||||||
|
|
|
|
|
|
|
|
|
|
|
|
|
|
|
| ||||||
| Total assets measured at fair value |
$ | 62,738 | $ | 135 | $ | 2,762 | $ | 55,505 | $ | 4,336 | ||||||||||
|
|
|
|
|
|
|
|
|
|
|
|
|
|
|
| ||||||
(Continued)
F-144
Table of Contents
ATHENE HOLDING LTD.
Notes to Condensed Consolidated Financial Statements (Unaudited)
| September 30, 2016 | ||||||||||||||||||||
| (In millions) | Total | NAV1 | Level 1 | Level 2 | Level 3 | |||||||||||||||
| Liabilities |
||||||||||||||||||||
| Interest sensitive contract liabilities |
||||||||||||||||||||
| Embedded derivative |
$ | 5,273 | $ | — | $ | — | $ | — | $ | 5,273 | ||||||||||
| Universal life benefits |
1,050 | — | — | — | 1,050 | |||||||||||||||
| Unit-linked contracts |
431 | — | — | 431 | — | |||||||||||||||
| Future policy benefits |
||||||||||||||||||||
| AmerUs Closed Block |
1,710 | — | — | — | 1,710 | |||||||||||||||
| ILICO Closed Block and life |
812 | — | — | — | 812 | |||||||||||||||
| Derivative liabilities |
29 | — | — | 21 | 8 | |||||||||||||||
| Funds withheld liability – embedded |
30 | — | — | 30 | — | |||||||||||||||
|
|
|
|
|
|
|
|
|
|
|
|
|
|
|
| ||||||
| Total liabilities measured at fair |
$ | 9,335 | $ | — | $ | — | $ | 482 | $ | 8,853 | ||||||||||
|
|
|
|
|
|
|
|
|
|
|
|
|
|
|
| ||||||
| 1 | Investments measured at NAV as a practical expedient in determining fair value have not been classified in the fair value hierarchy. |
(Concluded)
F-145
Table of Contents
ATHENE HOLDING LTD.
Notes to Condensed Consolidated Financial Statements (Unaudited)
| December 31, 2015 | ||||||||||||||||||||
| (In millions) | Total | NAV1 | Level 1 | Level 2 | Level 3 | |||||||||||||||
| Assets |
||||||||||||||||||||
| AFS securities |
||||||||||||||||||||
| Fixed maturity securities |
||||||||||||||||||||
| U.S. government and agencies |
$ | 45 | $ | — | $ | 41 | $ | 4 | $ | — | ||||||||||
| U.S. state, municipal, and political subdivisions |
1,165 | — | — | 1,165 | — | |||||||||||||||
| Foreign governments |
2,464 | — | — | 2,447 | 17 | |||||||||||||||
| Corporate |
26,936 | — | — | 26,300 | 636 | |||||||||||||||
| CLO |
4,555 | — | — | 4,038 | 517 | |||||||||||||||
| ABS |
2,918 | — | — | 1,105 | 1,813 | |||||||||||||||
| CMBS |
1,738 | — | — | 1,671 | 67 | |||||||||||||||
| RMBS |
7,995 | — | — | 7,237 | 758 | |||||||||||||||
|
|
|
|
|
|
|
|
|
|
|
|
| |||||||||
| Total AFS fixed maturity |
47,816 | — | 41 | 43,967 | 3,808 | |||||||||||||||
| Equity securities |
407 | — | 82 | 316 | 9 | |||||||||||||||
|
|
|
|
|
|
|
|
|
|
|
|
| |||||||||
| Total AFS securities |
48,223 | — | 123 | 44,283 | 3,817 | |||||||||||||||
|
|
|
|
|
|
|
|
|
|
|
|
| |||||||||
| Trading securities |
||||||||||||||||||||
| Fixed maturity securities |
||||||||||||||||||||
| U.S. government and agencies |
1 | — | 1 | — | — | |||||||||||||||
| U.S. state, municipal, and political subdivisions |
133 | — | — | 116 | 17 | |||||||||||||||
| Corporate |
1,450 | — | — | 1,434 | 16 | |||||||||||||||
| CLO |
108 | — | — | — | 108 | |||||||||||||||
| ABS |
98 | — | — | — | 98 | |||||||||||||||
| CMBS |
99 | — | — | 99 | — | |||||||||||||||
| RMBS |
161 | — | — | 132 | 29 | |||||||||||||||
|
|
|
|
|
|
|
|
|
|
|
|
| |||||||||
| Total trading fixed maturity |
2,050 | — | 1 | 1,781 | 268 | |||||||||||||||
| Equity securities |
418 | — | — | 418 | — | |||||||||||||||
|
|
|
|
|
|
|
|
|
|
|
|
| |||||||||
| Total trading securities |
2,468 | — | 1 | 2,199 | 268 | |||||||||||||||
|
|
|
|
|
|
|
|
|
|
|
|
| |||||||||
| Mortgage loans |
48 | — | — | — | 48 | |||||||||||||||
| Investment funds |
152 | 152 | — | — | — | |||||||||||||||
| Funds withheld at interest – embedded derivative |
36 | — | — | — | 36 | |||||||||||||||
| Derivative assets |
871 | — | 9 | 862 | — | |||||||||||||||
| Short-term investments |
135 | — | 4 | 131 | — | |||||||||||||||
| Cash and cash equivalents |
2,714 | — | 2,714 | — | — | |||||||||||||||
| Restricted cash |
116 | — | 116 | — | — | |||||||||||||||
| Investments in related parties |
||||||||||||||||||||
| AFS, fixed maturity securities |
||||||||||||||||||||
| CLO |
248 | — | — | 241 | 7 | |||||||||||||||
| ABS |
60 | — | — | — | 60 | |||||||||||||||
|
|
|
|
|
|
|
|
|
|
|
|
| |||||||||
| Total AFS securities – related |
308 | — | — | 241 | 67 | |||||||||||||||
| Trading securities, CLO |
217 | — | — | 26 | 191 | |||||||||||||||
| Reinsurance recoverable |
2,377 | — | — | — | 2,377 | |||||||||||||||
|
|
|
|
|
|
|
|
|
|
|
|
| |||||||||
| Total assets measured at fair value |
$ | 57,665 | $ | 152 | $ | 2,967 | $ | 47,742 | $ | 6,804 | ||||||||||
|
|
|
|
|
|
|
|
|
|
|
|
| |||||||||
(Continued)
F-146
Table of Contents
ATHENE HOLDING LTD.
Notes to Condensed Consolidated Financial Statements (Unaudited)
| December 31, 2015 | ||||||||||||||||||||
| (In millions) | Total | NAV1 | Level 1 | Level 2 | Level 3 | |||||||||||||||
| Liabilities |
||||||||||||||||||||
| Interest sensitive contract liabilities |
||||||||||||||||||||
| Embedded derivative |
$ | 4,477 | $ | — | $ | — | $ | — | $ | 4,477 | ||||||||||
| Universal life benefits |
1,464 | — | — | — | 1,464 | |||||||||||||||
| Unit-linked contracts |
418 | — | — | 418 | — | |||||||||||||||
| Future policy benefits |
||||||||||||||||||||
| AmerUs Closed Block |
1,581 | — | — | — | 1,581 | |||||||||||||||
| ILICO Closed Block and life benefits |
897 | — | — | — | 897 | |||||||||||||||
| Derivative liabilities |
17 | — | 1 | 9 | 7 | |||||||||||||||
| Funds withheld liability – embedded derivative |
35 | — | — | 35 | — | |||||||||||||||
|
|
|
|
|
|
|
|
|
|
|
|
||||||||||
| Total liabilities measured at fair value |
$ | 8,889 | $ | — | $ | 1 | $ | 462 | $ | 8,426 | ||||||||||
|
|
|
|
|
|
|
|
|
|
|
|
||||||||||
| 1 | Investments measured at NAV as a practical expedient in determining fair value have not been classified in the fair value hierarchy. |
(Concluded)
Refer to Note 4 – Variable Interest Entities for fair value disclosures associated with consolidated VIEs.
Fair Value Valuation Methods—We used the following valuation methods and assumptions to estimate fair value:
AFS and trading securities
Fixed maturity – We obtain the fair value for most marketable bonds without an active market from several commercial pricing services. These are classified as Level 2 assets. The pricing services incorporate a variety of market observable information in their valuation techniques, including benchmark yields, broker-dealer quotes, credit quality, issuer spreads, bids, offers, and other reference data. This category typically includes U.S. and non-U.S. corporate bonds, U.S. agency and government guaranteed securities, ABS, CMBS, and RMBS.
We value privately placed fixed maturity securities based on the credit quality and duration of comparable marketable securities, which may be securities of another issuer with similar characteristics. In some instances, we use a matrix-based pricing model. These models consider the current level of risk-free interest rates, corporate spreads, credit quality of the issuer, and cash flow characteristics of the security. We also consider additional factors such as net worth of the borrower, value of collateral, capital structure of the borrower, presence of guarantees, and our evaluation of the borrower’s ability to compete in its relevant market. Privately placed fixed maturity securities are classified as Level 2 or 3.
Equity securities – Fair values of publicly traded equity securities are based on quoted market prices and classified as Level 1. Other equity securities, typically private equities or equity securities not traded on an exchange, we value based on other sources, such as analytics or brokers and are classified as Level 2 or 3.
Mortgage loans – Mortgage loans for which we have elected the fair value option or those held for sale are carried at fair value. We estimate fair value on a monthly basis using discounted cash flow analysis and rates being offered for similar loans to borrowers with similar credit ratings. Loans with similar characteristics are aggregated for purposes of the calculations. The discounted cash flow model uses unobservable inputs, including estimates of discount rates and loan prepayments. Mortgage loans are classified as Level 3.
F-147
Table of Contents
ATHENE HOLDING LTD.
Notes to Condensed Consolidated Financial Statements (Unaudited)
Funds withheld (embedded derivative) – We estimate the fair value of the embedded derivative based on the change in the fair value of the assets supporting the funds withheld payable under the combined coinsurance, modco, and coinsurance funds withheld reinsurance agreements. As a result, the fair value of the embedded derivative is classified as Level 2 or 3 based on the valuation methods used for the assets held in trust supporting the reinsurance agreements.
Derivatives – Derivative contracts can be exchange traded or over-the-counter. Exchange-traded derivatives typically fall within Level 1 of the fair value hierarchy depending on trading activity. Over-the-counter derivatives are valued using valuation models or an income approach using third-party broker valuations. Valuation models require a variety of inputs, including contractual terms, market prices, yield curves, credit curves, measures of volatility, prepayment rates, and correlation of the inputs. We consider and incorporate counterparty credit risk in the valuation process through counterparty credit rating requirements and monitoring of overall exposure. We also evaluate and include our own nonperformance risk in valuing derivatives. The majority of our derivatives trade in liquid markets; therefore, we can verify model inputs and model selection does not involve significant management judgment. These are typically classified within Level 2 of the fair value hierarchy.
Cash and cash equivalents – The carrying amount for cash equals fair value. We estimate the fair value for cash equivalents based on quoted market prices. These assets are classified as Level 1.
Interest sensitive contract liabilities (embedded derivative) – Embedded derivatives related to interest sensitive contract liabilities with fixed indexed annuity products are classified as Level 3. The valuations include significant unobservable inputs associated with actuarial assumptions for policyholder behavior.
Unit-linked contracts – Unit-linked contracts are valued based on the fair value of the investments supporting the contract. The underlying investments are trading securities comprised primarily of mutual funds. The valuations of these are based on quoted market prices for similar assets and are classified in Level 2, resulting in a corresponding classification for the unit-linked contracts.
AmerUs Closed Block – We elected the fair value option for the future policy benefits liability in the AmerUs Closed Block. Our valuation technique is to set the fair value of policyholder liabilities equal to the fair value of assets. There is an additional component which captures the fair value of the open block’s cost to hold capital in excess of existing liabilities on the closed block. This component uses a present value of future cash flows, which includes investment earnings and policyholder liability movements. Unobservable inputs include estimates for these items. The target surplus as a percentage of statutory reserves is 3.85% based on the statutory risk-based capital ratio applicable to this block of business. The AmerUs Closed Block policyholder liabilities and any corresponding reinsurance recoverable are classified as Level 3.
ILICO Closed Block – We elected the fair value option for the ILICO Closed Block. Our valuation technique is to set the fair value of policyholder liabilities equal to the fair value of assets. There is an additional component which captures the fair value of the open block’s obligations to the closed block business. This component uses the present value of future cash flows. The cash flows include commissions, administrative expenses, reinsurance premiums and benefits, and an explicit cost of capital. Unobservable inputs include estimates for these items. The explicit cost of capital assumption is 9% of required capital, post tax. A margin of 9.42% is included in the discount rates to reflect the business risk. An additional 0.28% is included to reflect non-performance risk. The ILICO Closed Block policyholder liabilities and corresponding reinsurance recoverable are classified as Level 3.
Universal life liabilities and other life benefits – We elected the fair value option for certain blocks of universal and other life business ceded to Global Atlantic Financial Group Limited (Global Atlantic). We use a present
F-148
Table of Contents
ATHENE HOLDING LTD.
Notes to Condensed Consolidated Financial Statements (Unaudited)
value of liability cash flows. Unobservable inputs include estimates of mortality, persistency, expenses, premium payments, and a risk margin used in the discount rates that reflects the riskiness of the business. The risk margin was 0.09%. These universal life policyholder liabilities and corresponding reinsurance recoverable are classified as Level 3.
Fair Value Option—The following represents the gains or losses recorded for instruments for which we have elected the fair value option:
| Nine months ended September 30, | ||||||||
| (In millions) | 2016 | 2015 | ||||||
| Trading securities |
$ | 93 | $ | (173) | ||||
| Mortgage loans |
(1) | (2) | ||||||
| Investment funds |
4 | 18 | ||||||
| Future policy benefits |
(129) | 85 | ||||||
|
|
|
|
|
|||||
| Total gains (losses) |
$ | (33) | $ | (72) | ||||
|
|
|
|
|
|||||
For fair value option mortgage loans, we record interest income, gains or losses from initial measurement, and subsequent changes in fair value in net investment income on the condensed consolidated statements of income. Gains and losses related to investment funds, including related party investment funds, are recorded in net investment income on the condensed consolidated statements of income. We record the change in fair value of future policy benefits to future policy and other policy benefits on the condensed consolidated statements of income.
The following summarizes information for fair value option mortgage loans:
| (In millions) | September 30, 2016 | December 31, 2015 | ||||||
| Unpaid principal balance |
$ | 42 | $ | 46 | ||||
| Mark to fair value |
3 | 2 | ||||||
|
|
|
|
|
|||||
| Fair value |
$ | 45 | $ | 48 | ||||
|
|
|
|
|
|||||
There were no fair value option mortgage loans 90 days or more past due as of September 30, 2016, and December 31, 2015.
Transfers Between Levels—Transfers into Level 3 represent securities that were valued using pricing sources which, due to changing market conditions, were less observable than in prior periods as indicated by the lack of commercially available vendor prices with observable inputs. Additionally, changes in pricing sources also led to securities transferring into Level 3.
Transfers out of Level 3 represent securities that were valued using pricing sources which, due to changing market conditions, were more observable than in prior periods as indicated by commercially available vendor prices with observable inputs. Additionally, changes in pricing sources also led to securities transferring into Level 2.
Transfers into or out of any level are assumed to occur at the end of the period. For the nine months ended September 30, 2016, and 2015, there were no transfers between Level 1 and Level 2.
F-149
Table of Contents
ATHENE HOLDING LTD.
Notes to Condensed Consolidated Financial Statements (Unaudited)
Level 3 Financial Instruments—The following is a reconciliation for all Level 3 assets and liabilities measured at fair value on a recurring basis:
| Nine months ended September 30, 2016 | ||||||||||||||||||||||||||||||||||||||||
| Total realized and unrealized gains (losses) |
Transfers | |||||||||||||||||||||||||||||||||||||||
| (In millions) | Beginning Balance |
Included in income |
Included in OCI |
Purchases | Sales | In | (Out) | Other | Ending Balance |
Total gains (losses) included in earnings1 |
||||||||||||||||||||||||||||||
| Assets |
||||||||||||||||||||||||||||||||||||||||
| AFS securities |
||||||||||||||||||||||||||||||||||||||||
| Fixed maturity |
||||||||||||||||||||||||||||||||||||||||
| U.S. state, municipal, and political subdivisions |
$ | — | $ | — | $ | — | $ | — | $ | — | $ | 5 | $ | — | $ | — | $ | 5 | $ | — | ||||||||||||||||||||
| Foreign governments |
17 | 1 | (1) | — | (2) | — | — | — | 15 | — | ||||||||||||||||||||||||||||||
| Corporate |
636 | 4 | 27 | 47 | (118) | 4 | (258) | — | 342 | — | ||||||||||||||||||||||||||||||
| CLO |
517 | 3 | 38 | 24 | (17) | 10 | (452) | — | 123 | — | ||||||||||||||||||||||||||||||
| ABS |
1,813 | 78 | (7) | 102 | (857) | 103 | (138) | — | 1,094 | — | ||||||||||||||||||||||||||||||
| CMBS |
67 | 1 | 3 | 10 | — | 53 | (47) | — | 87 | — | ||||||||||||||||||||||||||||||
| RMBS |
758 | 3 | 16 | — | (249) | — | (528) | — | — | — | ||||||||||||||||||||||||||||||
| Equity securities |
9 | — | — | — | (4) | — | — | — | 5 | — | ||||||||||||||||||||||||||||||
| Trading securities |
||||||||||||||||||||||||||||||||||||||||
| Fixed maturity |
||||||||||||||||||||||||||||||||||||||||
| U.S. state, municipal, and political subdivisions |
17 | — | — | — | — | — | — | — | 17 | — | ||||||||||||||||||||||||||||||
| Corporate |
16 | — | — | — | (4) | — | (12) | — | — | 5 | ||||||||||||||||||||||||||||||
| CLO |
108 | (4) | — | — | (45) | — | — | — | 59 | 8 | ||||||||||||||||||||||||||||||
| ABS |
98 | (11) | — | — | — | — | — | — | 87 | — | ||||||||||||||||||||||||||||||
| RMBS |
29 | (7) | — | 111 | — | — | (5) | — | 128 | 1 | ||||||||||||||||||||||||||||||
| Mortgage loans |
48 | — | — | — | (3) | — | — | — | 45 | — | ||||||||||||||||||||||||||||||
| Funds withheld at interest – embedded derivative |
36 | 169 | — | — | — | — | — | — | 205 | — | ||||||||||||||||||||||||||||||
| Investments in related parties |
||||||||||||||||||||||||||||||||||||||||
| AFS securities |
||||||||||||||||||||||||||||||||||||||||
| Fixed maturity |
||||||||||||||||||||||||||||||||||||||||
| CLO |
7 | — | — | — | — | — | (7) | — | — | — | ||||||||||||||||||||||||||||||
| ABS |
60 | — | — | — | (3) | — | — | — | 57 | — | ||||||||||||||||||||||||||||||
| Trading securities, CLO |
191 | (23) | — | 33 | (16) | 26 | (22) | — | 189 | 21 | ||||||||||||||||||||||||||||||
| Reinsurance recoverable |
2,377 | (499) | — | — | — | — | — | — | 1,878 | — | ||||||||||||||||||||||||||||||
|
|
|
|
|
|
|
|
|
|
|
|
|
|
|
|
|
|
|
|
|
|
|
|
|
|||||||||||||||||
| Total Level 3 assets |
$ | 6,804 | $ | (285) | $ | 76 | $ | 327 | $ | (1,318) | $ | 201 | $ | (1,469) | $ | — | $ | 4,336 | $ | 35 | ||||||||||||||||||||
|
|
|
|
|
|
|
|
|
|
|
|
|
|
|
|
|
|
|
|
|
|
|
|
|
|||||||||||||||||
(Continued)
F-150
Table of Contents
ATHENE HOLDING LTD.
Notes to Condensed Consolidated Financial Statements (Unaudited)
| Nine months ended September 30, 2016 | ||||||||||||||||||||||||||||||||||||||||
| Total realized and unrealized gains (losses) |
Transfers | |||||||||||||||||||||||||||||||||||||||
| (In millions) | Beginning Balance |
Included in income |
Included in OCI |
Purchases | Sales | In | (Out) | Other | Ending Balance |
Total gains (losses) included in earnings1 |
||||||||||||||||||||||||||||||
| Liabilities |
||||||||||||||||||||||||||||||||||||||||
| Interest sensitive contract liabilities |
||||||||||||||||||||||||||||||||||||||||
| Embedded derivative2 |
$ | (4,477) | $ | (391) | $ | — | $ | — | $ | — | $ | — | $ | — | $ | (405) | $ | (5,273) | $ | — | ||||||||||||||||||||
| Universal life liabilities |
(1,464) | 414 | — | — | — | — | — | — | (1,050) | — | ||||||||||||||||||||||||||||||
| Future policy benefits |
||||||||||||||||||||||||||||||||||||||||
| AmerUs Closed Block |
(1,581) | (129) | — | — | — | — | — | — | (1,710) | — | ||||||||||||||||||||||||||||||
| ILICO Closed Block and life benefits |
(897) | 85 | — | — | — | — | — | — | (812) | — | ||||||||||||||||||||||||||||||
| Derivative liabilities |
(7) | (1) | — | — | — | — | — | — | (8) | — | ||||||||||||||||||||||||||||||
|
|
|
|
|
|
|
|
|
|
|
|
|
|
|
|
|
|
|
|
|
|
|
|
|
|||||||||||||||||
| Total Level 3 liabilities |
$ | (8,426) | $ | (22) | $ | — | $ | — | $ | — | $ | — | $ | — | $ | (405) | $ | (8,853) | $ | — | ||||||||||||||||||||
|
|
|
|
|
|
|
|
|
|
|
|
|
|
|
|
|
|
|
|
|
|
|
|
|
|||||||||||||||||
| 1 | Related to instruments held at end of period. |
| 2 | Other activity represents the change in fair value due to issuances of $517 million, offset by settlements of $112 million. |
(Concluded)
F-151
Table of Contents
ATHENE HOLDING LTD.
Notes to Condensed Consolidated Financial Statements (Unaudited)
| Nine months ended September 30, 2015 | ||||||||||||||||||||||||||||||||||||||||
| Total realized and unrealized gains (losses) |
Transfers | |||||||||||||||||||||||||||||||||||||||
| (In millions) | Beginning balance |
Included in income |
Included in OCI |
Purchases | Sales | In | Out | Other | Ending balance |
Total gains (losses) included in earnings1 |
||||||||||||||||||||||||||||||
| Assets |
||||||||||||||||||||||||||||||||||||||||
| AFS securities |
||||||||||||||||||||||||||||||||||||||||
| Fixed maturity |
||||||||||||||||||||||||||||||||||||||||
| U.S. state, municipal, and political subdivisions |
$ | 52 | $ | (1) | $ | 1 | $ | 1 | $ | (7) | $ | — | $ | — | $ | (27) | $ | 19 | $ | — | ||||||||||||||||||||
| Corporate |
208 | 3 | — | 230 | (91) | 171 | (54) | 27 | 494 | — | ||||||||||||||||||||||||||||||
| CLO |
182 | 2 | (2) | 20 | (2) | 224 | (131) | — | 293 | — | ||||||||||||||||||||||||||||||
| ABS |
924 | 13 | (14) | 342 | (118) | 811 | (10) | — | 1,948 | — | ||||||||||||||||||||||||||||||
| CMBS |
69 | 1 | 2 | 45 | (1) | 24 | (94) | — | 46 | — | ||||||||||||||||||||||||||||||
| RMBS |
654 | 11 | (20) | 246 | (117) | 19 | (42) | — | 751 | — | ||||||||||||||||||||||||||||||
| Trading securities |
||||||||||||||||||||||||||||||||||||||||
| Fixed maturity |
||||||||||||||||||||||||||||||||||||||||
| U.S. state, municipal, and political subdivisions |
— | — | — | — | — | 17 | — | — | 17 | — | ||||||||||||||||||||||||||||||
| Corporate |
— | — | — | — | — | 9 | — | — | 9 | — | ||||||||||||||||||||||||||||||
| CLO |
146 | — | — | — | (24) | — | — | — | 122 | (3) | ||||||||||||||||||||||||||||||
| ABS |
— | 1 | — | 100 | — | — | — | — | 101 | (1) | ||||||||||||||||||||||||||||||
| RMBS |
— | (1) | — | 25 | — | — | — | — | 24 | — | ||||||||||||||||||||||||||||||
| Mortgage loans |
73 | (1) | — | — | (5) | — | — | (18) | 49 | (1) | ||||||||||||||||||||||||||||||
| Funds withheld at interest –embedded derivative |
127 | (57) | — | — | — | — | — | — | 70 | — | ||||||||||||||||||||||||||||||
| Investments in related parties |
||||||||||||||||||||||||||||||||||||||||
| AFS securities |
||||||||||||||||||||||||||||||||||||||||
| Fixed maturity |
||||||||||||||||||||||||||||||||||||||||
| CLO |
15 | — | (1) | 14 | — | — | (7) | — | 21 | — | ||||||||||||||||||||||||||||||
| ABS |
66 | — | — | — | (3) | — | — | — | 63 | — | ||||||||||||||||||||||||||||||
| Trading securities, CLO |
268 | 1 | — | 39 | (74) | — | (30) | — | 204 | 9 | ||||||||||||||||||||||||||||||
| Reinsurance recoverable |
2,460 | (93) | — | — | — | — | — | — | 2,367 | — | ||||||||||||||||||||||||||||||
|
|
|
|
|
|
|
|
|
|
|
|
|
|
|
|
|
|
|
|
|
|||||||||||||||||||||
| Total Level 3 assets |
$ | 5,244 | $ | (121) | $ | (34) | $ | 1,062 | $ | (442) | $ | 1,275 | $ | (368) | $ | (18) | $ | 6,598 | $ | 4 | ||||||||||||||||||||
|
|
|
|
|
|
|
|
|
|
|
|
|
|
|
|
|
|
|
|
|
|||||||||||||||||||||
| Liabilities |
||||||||||||||||||||||||||||||||||||||||
| Interest sensitive contract liabilities |
||||||||||||||||||||||||||||||||||||||||
| Embedded derivative2 |
$ | (4,437) | $ | 314 | $ | — | $ | — | $ | — | $ | — | $ | — | $ | (102) | $ | (4,225) | $ | — | ||||||||||||||||||||
| Universal life liabilities |
(1,417) | (26) | — | — | — | — | — | — | (1,443) | — | ||||||||||||||||||||||||||||||
| Future policy benefits |
||||||||||||||||||||||||||||||||||||||||
| AmerUs Closed Block |
(1,715) | 85 | — | — | — | — | — | — | (1,630) | — | ||||||||||||||||||||||||||||||
| ILICO Closed Block and life benefits |
(1,026) | 118 | — | — | — | — | — | — | (908) | — | ||||||||||||||||||||||||||||||
| Derivative liabilities |
(8) | 2 | — | — | — | — | — | — | (6) | 1 | ||||||||||||||||||||||||||||||
|
|
|
|
|
|
|
|
|
|
|
|
|
|
|
|
|
|
|
|
|
|||||||||||||||||||||
| Total Level 3 liabilities |
$ | (8,603) | $ | 493 | $ | — | $ | — | $ | — | $ | — | $ | — | $ | (102) | $ | (8,212) | $ | 1 | ||||||||||||||||||||
|
|
|
|
|
|
|
|
|
|
|
|
|
|
|
|
|
|
|
|
|
|||||||||||||||||||||
| 1 | Related to instruments held at end of period. |
| 2 | Other activity represents the change in fair value due to issuances of $215 million, offset by settlements of $113 million. |
F-152
Table of Contents
ATHENE HOLDING LTD.
Notes to Condensed Consolidated Financial Statements (Unaudited)
Significant Unobservable Inputs—Significant unobservable inputs occur when we could not obtain or corroborate the quantitative detail of the inputs. This applies to AFS fixed maturity securities, mortgage loans, total return swaps, and credit default swaps. Additional significant unobservable inputs are described below.
Fixed maturity securities – For certain fixed maturity securities, internal models are used to calculate the fair value. A discounted cash flow approach is utilized. The discount rate is the significant unobservable input due to the determined credit spread being internally developed, illiquid, or other adjustments made to the base rate. The base rate represents a market comparable rate for securities with similar characteristics. Discounts ranged from 4% to 8%. This excludes assets for which significant unobservable inputs are not developed internally, primarily consisting of broker quotes.
Interest sensitive contract liabilities – embedded derivative – Significant unobservable inputs we use in the fixed indexed annuities embedded derivative of the interest sensitive contract liabilities valuation include:
| 1. | Non-performance risk – For contracts we issue, we use the credit spread from the U.S. treasury curve based on our public credit rating as of the valuation date. This represents our credit risk for use in the estimate of the fair value of embedded derivatives. For contracts reinsured through funds withheld reinsurance, the cedant company holds collateral against its exposure; therefore, immaterial non-performance risk is ascribed to these contracts. |
| 2. | Option budget – We assume future hedge costs in the derivative’s fair value estimate. The level of option budgets determines the future costs of the options and impacts future policyholder account value growth. |
| 3. | Policyholder behavior – We regularly review the lapse and withdrawal assumptions (Surrender rate). These are based on our initial pricing assumptions updated for actual experience. Actual experience may be limited for recently issued products. |
The following summarizes the unobservable inputs for the embedded derivatives of fixed indexed annuities:
| September 30, 2016 | ||||||||||||||||||||||||||
| (In millions, except for percentages) |
Fair value | Valuation technique | Unobservable inputs | Input/range of inputs |
Impact of an increase in the input on fair value |
|||||||||||||||||||||
| Interest sensitive contract liabilities – fixed indexed annuities embedded derivatives |
$ | 5,273 | Option budget method | Non-performance risk | 0.6 | % | – | 1.8% | Decrease | |||||||||||||||||
| Option budget | 0.7 | % | – | 3.8% | Increase | |||||||||||||||||||||
| Surrender rate | 0.0 | % | – | 16.2% | Decrease | |||||||||||||||||||||
| December 31, 2015 | ||||||||||||||||||||||||||
| (In millions, except for percentages) | Fair value | Valuation technique | Unobservable inputs | Input/range of inputs |
Impact of an increase in the input on fair value |
|||||||||||||||||||||
| Interest sensitive contract liabilities – fixed indexed annuities embedded derivatives |
$ | 4,477 | Option budget method | Non-performance risk | 0.6 | % | – | 1.8% | Decrease | |||||||||||||||||
| Option budget | 0.8 | % | – | 3.8% | Increase | |||||||||||||||||||||
| Surrender rate | 0.0 | % | – | 10.7% | Decrease | |||||||||||||||||||||
F-153
Table of Contents
ATHENE HOLDING LTD.
Notes to Condensed Consolidated Financial Statements (Unaudited)
Fair Value of Financial Instruments Not Carried at Fair Value—The following represents our financial instruments not carried at fair value on the condensed consolidated balance sheets:
| September 30, 2016 | December 31, 2015 | |||||||||||||||||||
| (In millions) | Fair Value Level |
Carrying Value |
Fair Value | Carrying Value |
Fair Value | |||||||||||||||
| Assets |
||||||||||||||||||||
| Mortgage loans |
3 | $ | 5,474 | $ | 5,662 | $ | 5,452 | $ | 5,567 | |||||||||||
| Investment funds |
NAV1 | 590 | 590 | 581 | 581 | |||||||||||||||
| Policy loans |
2 | 606 | 606 | 642 | 642 | |||||||||||||||
| Funds withheld at interest |
3 | 6,170 | 6,170 | 3,446 | 3,446 | |||||||||||||||
| Other investments |
3 | 84 | 84 | 83 | 83 | |||||||||||||||
| Investments in related parties |
||||||||||||||||||||
| Investment funds |
NAV1 | 1,073 | 1,073 | 997 | 997 | |||||||||||||||
| Short-term investments |
2 | — | — | 55 | 55 | |||||||||||||||
| Other investments |
3 | 237 | 260 | 245 | 256 | |||||||||||||||
|
|
|
|
|
|
|
|
|
|||||||||||||
| Total assets not carried at fair value |
$ | 14,234 | $ | 14,445 | $ | 11,501 | $ | 11,627 | ||||||||||||
|
|
|
|
|
|
|
|
|
|||||||||||||
| Liabilities |
||||||||||||||||||||
| Interest sensitive contract liabilities2 |
3 | $ | 27,163 | $ | 26,827 | $ | 23,645 | $ | 22,963 | |||||||||||
| Funds withheld liability |
2 | 364 | 364 | 353 | 353 | |||||||||||||||
|
|
|
|
|
|
|
|
|
|||||||||||||
| Total liabilities not carried at fair value |
$ | 27,527 | $ | 27,191 | $ | 23,998 | $ | 23,316 | ||||||||||||
|
|
|
|
|
|
|
|
|
|||||||||||||
| 1 | Investments measured at NAV as a practical expedient in determining fair value have not been classified in the fair value hierarchy. |
| 2 | During 2016, we changed the disclosure of interest sensitive contract liabilities to exclude insurance contracts, which are not required to be included. We determined contract types that meet the definition of insurance contracts include universal life and traditional fixed and fixed indexed annuities with significant mortality or morbidity risks. In previous periods, all contracts within interest sensitive contract liabilities not held at fair value were included. As such, the carrying and fair values reported for December 31, 2015, were adjusted to be comparable. |
We estimate the fair value for financial instruments not carried at fair value using the same methods and assumptions as those we do carry at fair value. The financial instruments presented above are reported at carrying value on the condensed consolidated balance sheets; however, in the case of investment funds, policy loans, funds withheld at interest and liability, other investments, and investments in related parties – short-term investments, the carrying amount approximates or equals fair value.
Investment in related parties – Other investments – The fair value of investment in related party – other investments is determined using a discounted cash flow model using discount rates for similar investments.
Interest sensitive contract liabilities – The carrying and fair value of interest sensitive contract liabilities above includes fixed indexed and traditional fixed annuities without mortality or morbidity risks, funding agreements, and payout annuities without life contingencies. The embedded derivatives within fixed indexed annuities without mortality or morbidity risks are excluded, as they are carried at fair value. The valuation of these investment contracts is based on discounted cash flow methodologies using significant unobservable inputs. The estimated fair value is determined using current market risk-free interest rates, adding a spread to reflect our nonperformance risk and subtracting a risk margin to reflect uncertainty inherent in the projected cash flows.
F-154
Table of Contents
ATHENE HOLDING LTD.
Notes to Condensed Consolidated Financial Statements (Unaudited)
6. Reinsurance
During the nine months ended September 30, 2016, we novated certain open blocks of business ceded to affiliates of Global Atlantic, in accordance with the terms of the coinsurance and assumption agreement. As a result of the novation, interest sensitive contract liabilities decreased $1,006 million, future policy benefits decreased $188 million, policy loans decreased $8 million, and reinsurance recoverable decreased $1,186 million.
7. Deferred Acquisition Costs, Deferred Sales Inducements, and Value of Business Acquired
The following represents a rollforward of deferred acquisition costs (DAC), deferred sales inducements (DSI), and value of business acquired (VOBA):
| (In millions) | DAC | DSI | VOBA | Total | ||||||||||||
| Balance at December 31, 2015 |
$ | 707 | $ | 321 | $ | 1,635 | $ | 2,663 | ||||||||
| Additions |
449 | 145 | — | 594 | ||||||||||||
| Unlocking |
(12 | ) | (3 | ) | (23 | ) | (38 | ) | ||||||||
| Amortization |
(75 | ) | (17 | ) | (93 | ) | (185 | ) | ||||||||
| Impact of unrealized investment (gains) losses |
(81 | ) | (39 | ) | (207 | ) | (327 | ) | ||||||||
|
|
|
|
|
|
|
|
|
|
|
|
| |||||
| Balance at September 30, 2016 |
$ | 988 | $ | 407 | $ | 1,312 | $ | 2,707 | ||||||||
|
|
|
|
|
|
|
|
|
|
|
|
| |||||
| (In millions) | DAC | DSI | VOBA | Total | ||||||||||||
| Balance at December 31, 2014 |
$ | 425 | $ | 188 | $ | 1,616 | $ | 2,229 | ||||||||
| Additions |
211 | 104 | — | 315 | ||||||||||||
| Unlocking |
(6 | ) | (2 | ) | (26 | ) | (34 | ) | ||||||||
| Amortization |
(23 | ) | (12 | ) | (89 | ) | (124 | ) | ||||||||
| Impact of unrealized investment (gains) losses |
14 | 6 | 95 | 115 | ||||||||||||
|
|
|
|
|
|
|
|
|
|
|
|
| |||||
| Balance at September 30, 2015 |
$ | 621 | $ | 284 | $ | 1,596 | $ | 2,501 | ||||||||
|
|
|
|
|
|
|
|
|
|
|
|
| |||||
The unlocking impact in 2016 was primarily the result of a decrease in projected net investment earned rates, partially offset by a decrease in projected policyholder withdrawal rates. In 2015, the unlocking impact was primarily driven by a decrease in projected net investment earned rates.
8. Debt
Revolving Credit Facility—In the first quarter of 2016, AHL, ALRe, and Athene USA entered into a five-year revolving credit agreement (Revolving Credit Facility) with Citibank, N.A., as administrative agent. The amount available under the Revolving Credit Facility is $1 billion. In connection with the Revolving Credit Facility, AHL and Athene USA guaranteed all of the obligations of AHL, ALRe, and Athene USA under this facility, and ALRe guaranteed certain of the obligations of AHL and Athene USA under this facility. The Revolving Credit Facility contains various standard covenants with which we must comply, including the following:
| 1. | Consolidated debt to capitalization ratio of not greater than 35%; |
| 2. | Minimum consolidated net worth of no less than the sum of (a) $3.7 billion and (b) an amount equal to 50% of the net cash proceeds received in any subsequent equity issuances; and |
| 3. | Restrictions on our ability to incur debt and liens and to declare or pay dividends, in each case with certain exceptions. |
F-155
Table of Contents
ATHENE HOLDING LTD.
Notes to Condensed Consolidated Financial Statements (Unaudited)
As of September 30, 2016, we had no amounts outstanding under the Revolving Credit Facility and were in compliance with all covenants under this facility.
Interest accrues on outstanding borrowings at London Inter Bank Offering Rate (LIBOR) plus a margin or a base rate plus a margin, with the applicable margin varying based on AHL’s issuer credit rating. The Revolving Credit Facility has a commitment fee that is determined by reference to AHL’s issuer credit rating, and ranges from 0.15% to 0.50% of the unused commitment.
9. Common Stock
We have six classes of common stock: Class A, Class B, Class M-1, Class M-2, Class M-3, and Class M-4. The Class M-1, Class M-2, Class M-3, and Class M-4 shares are collectively referred to as Class M shares.
Class A shares collectively represent 55% of the total voting power of the Company. Class B shares represent the remaining 45% of the total voting power of the Company, and are beneficially owned by shareholders who are members of the Apollo Group, as defined in our bye-laws. Class M shares are restricted, non-voting shares issued under equity incentive plans. Our bye-laws place certain restrictions on Class A shares such that (1) a holder of Class A shares, including its affiliates, cannot control greater than 9.9% of the total outstanding vote and if a holder of Class A shares were to control greater than 9.9%, then a holder’s voting power is automatically reduced to 9.9% and the other holders of Class A shares would vote the remainder on a prorated basis, (2) the total voting power held by members of our management and employees of the Apollo Group is limited to 3%, and (3) Class A shares may be deemed non-voting when owned by a shareholder who owns Class B shares, has an equity interest in certain Apollo entities, or is a member of the Apollo Group.
F-156
Table of Contents
ATHENE HOLDING LTD.
Notes to Condensed Consolidated Financial Statements (Unaudited)
The table below shows the changes in each class of shares issued and outstanding:
| Nine months ended September 30, 2016 | ||||
| Class A |
||||
| Beginning balance |
50,151,265 | |||
| Issued shares |
137,196 | |||
| Forfeited shares |
(30,091 | ) | ||
| Repurchased shares |
(55,440 | ) | ||
|
|
|
| ||
| Ending balance |
50,202,930 | |||
|
|
|
| ||
| Class B |
||||
| Beginning and ending balance |
135,963,975 | |||
|
|
|
| ||
| Class M-1 |
||||
| Beginning balance |
5,198,273 | |||
| Forfeited shares |
(270,543 | ) | ||
|
|
|
| ||
| Ending balance |
4,927,730 | |||
|
|
|
| ||
| Class M-2 |
||||
| Beginning balance |
3,125,869 | |||
| Forfeited shares |
(161,474 | ) | ||
|
|
|
| ||
| Ending balance |
2,964,395 | |||
|
|
|
| ||
| Class M-3 |
||||
| Beginning balance |
3,110,000 | |||
| Forfeited shares |
(224,000 | ) | ||
|
|
|
| ||
| Ending balance |
2,886,000 | |||
|
|
|
| ||
| Class M-4 |
||||
| Beginning balance |
5,038,443 | |||
| Issued shares |
990,650 | |||
| Forfeited shares |
(312,750 | ) | ||
| Repurchased shares |
(23,871 | ) | ||
|
|
|
| ||
| Ending balance |
5,692,472 | |||
|
|
|
| ||
During the second quarter of 2016, we accrued a liability and recorded a corresponding decrease in equity for the repurchase of outstanding Class A, Class M-1, Class M-2, Class M-3 and Class M-4 common shares. As of September 30, 2016, cash payment for the repurchase had not yet occurred and the shares remain legally outstanding, although the criteria for accounting recognition had been met. As a result, the repurchase is not reflected in the above rollforward. Subsequent to September 30, 2016, we completed the repurchase transaction.
Stock-based Compensation—On September 30, 2016, we modified Class M-1, M-2, and M-3 share agreements to vest all Tranche 2 performance-based shares. The compensation committee approved the modification given that vesting of the shares in the near future was probable. We also amended the conversion option, which previously allowed conversion of vested shares only subsequent to an Initial Public Offering (IPO). Under the modified conversion terms, individuals can elect one of three options including conversion at a specified date prior to an IPO, on the date of an IPO, or ratably each month for six months after an IPO. The modifications impacted 27 individuals.
F-157
Table of Contents
ATHENE HOLDING LTD.
Notes to Condensed Consolidated Financial Statements (Unaudited)
As a result of the modifications, we recorded an $83 million increase to additional paid-in capital, due to the reclassification from liability awards to equity awards. We also recorded a $42 million charge to stock-based compensation expense and additional paid-in capital for the vesting of Tranche 2 shares, primarily related to the acceleration of previously unrecognized compensation expense. Subsequent to September 30, 2016, but prior to the issuance of these condensed consolidated financial statements, individuals electing conversion prior to an IPO exchanged 4,082,776 Class M shares, through net share settlement of the conversion price, for 2,839,605 Class A shares.
During the second quarter of 2016, we adopted a long-term incentive plan (LTIP) to provide an incentive to achieve long-term company goals and align the interests of our employees with those of shareholders. The plan consists of time and performance-based restricted share units (RSUs) and time-based stock options for Class A shares. RSUs represent a contractual right to receive Class A common shares and may be settled in shares or cash at our election. Stock options represent a right to purchase Class A common shares at a specified exercise price. We have issued 328,127 RSUs and 470,644 options under the LTIP.
Stock-based compensation expense, including LTIP and modifications made to Class M-1, M-2 and M-3 shares, was $61 million and $51 million for the nine months ended September 30, 2016, and 2015, respectively. As of September 30, 2016, we had unrecognized compensation expense, including LTIP, of $60 million. This cost is expected to be recognized over a weighted-average period of 1.2 years.
10. Earnings Per Share
The following table represents basic and diluted earnings per share calculation:
| Nine months ended September 30, | ||||||||
| (In millions, except share and per share data) | 2016 | 2015 | ||||||
| Net income available to AHL shareholders |
$ | 437 | $ | 320 | ||||
|
|
|
|
|
|||||
| Basic weighted average shares outstanding1 |
185,924,524 | 171,457,313 | ||||||
| Dilutive effect of stock compensation plans |
92,338 | 56,631 | ||||||
|
|
|
|
|
|||||
| Diluted weighted average shares outstanding1 |
186,016,862 | 171,513,944 | ||||||
|
|
|
|
|
|||||
| Earnings per share2 |
||||||||
| Basic |
$ | 2.35 | $ | 1.87 | ||||
| Diluted |
$ | 2.35 | $ | 1.87 | ||||
| 1 | Weighted average shares outstanding includes the effects of the share repurchase described in Note 9 – Common Stock. |
| 2 | Calculated using whole figures. |
Dilutive shares are calculated using the treasury stock method. Earnings per share for all Class M shares is zero, as no earnings are attributable to these classes of shares.
The number of shares, options, and RSUs excluded from diluted shares outstanding were 12,720,694 shares and 13,580,502 shares for the nine months ended September 30, 2016, and 2015, respectively. These are related to Class M shares, options, and RSUs for which the issuance restrictions had not been satisfied as of each period end or are antidilutive. The modifications described in Note 9 – Common Stock related to Class M-1, M-2, and M-3 shares resulted in additional shares becoming dilutive as of September 30, 2016, for those shares elected to be converted prior to an IPO. As these shares were only included in the calculation of diluted weighted average shares outstanding for one day, the modifications did not materially impact diluted earnings per share.
F-158
Table of Contents
ATHENE HOLDING LTD.
Notes to Condensed Consolidated Financial Statements (Unaudited)
11. Accumulated Other Comprehensive Income
The following is a detail of AOCI:
| (In millions) | September 30, 2016 | December 31, 2015 | ||||||
| AFS securities |
$ | 2,270 | $ | (405) | ||||
| DAC, DSI, VOBA, future policy benefits, and dividends payable to policyholders adjustment on AFS securities |
(879) | 91 | ||||||
| Noncredit component of OTTI losses on AFS securities |
(19) | (15) | ||||||
| Hedging instruments |
2 | 15 | ||||||
| Pension adjustments |
(5) | (4) | ||||||
| Foreign currency translation adjustments |
(3) | (4) | ||||||
|
|
|
|
|
|||||
| Accumulated other comprehensive income (loss), before taxes |
1,366 | (322) | ||||||
| Deferred income tax asset (liability) |
(446) | 85 | ||||||
|
|
|
|
|
|||||
| Accumulated other comprehensive income (loss) |
$ | 920 | $ | (237) | ||||
|
|
|
|
|
|||||
Changes in AOCI are presented below:
| Nine months ended September 30, | ||||||||
| (In millions) | 2016 | 2015 | ||||||
| Unrealized gains (losses) on AFS securities |
||||||||
| Unrealized holding gains (losses) arising during the period |
$ | 2,674 | $ | (862) | ||||
| Change in DAC, DSI, VOBA, future policy benefits, and dividends payable to policyholders |
(970) | 211 | ||||||
| Less: Reclassification adjustment for gains (losses) realized in net income1 |
(1) | 73 | ||||||
| Less: Income tax expense (benefit) |
537 | (242) | ||||||
|
|
|
|
|
|||||
| Change in unrealized gains (losses) on AFS securities |
1,168 | (482) | ||||||
|
|
|
|
|
|||||
| Noncredit component of OTTI losses on AFS securities |
||||||||
| Noncredit component of OTTI losses on AFS securities recognized during the period |
(11) | (5) | ||||||
| Less: Reclassification adjustment for gains (losses) realized in net income1 |
(7) | 3 | ||||||
| Less: Income tax expense (benefit) |
(2) | (3) | ||||||
|
|
|
|
|
|||||
| Change in noncredit component of OTTI losses on AFS securities |
(2) | (5) | ||||||
|
|
|
|
|
|||||
| Unrealized gain (loss) on hedging instruments |
||||||||
| Change in hedging instruments during the period |
(13) | 9 | ||||||
| Less: Income tax expense (benefit) |
(4) | 3 | ||||||
|
|
|
|
|
|||||
| Change in hedging instruments |
(9) | 6 | ||||||
|
|
|
|
|
|||||
| Pension adjustments during the period |
(1) | — | ||||||
| Foreign currency translation adjustments during the period |
1 | (2) | ||||||
|
|
|
|
|
|||||
| Change in AOCI |
$ | 1,157 | $ | (483) | ||||
|
|
|
|
|
|||||
| 1 | Recognized in investment related gains (losses) on the condensed consolidated statements of income. |
F-159
Table of Contents
ATHENE HOLDING LTD.
Notes to Condensed Consolidated Financial Statements (Unaudited)
12. Income Taxes
Our effective tax rates were (19)% and 10% for the nine months ended September 30, 2016, and 2015, respectively. Our current period effective tax rate is not meaningful due to the significant effect of releasing $102 million of deferred tax valuation allowance. During the third quarter of 2016, we identified a tax plan that, when implemented, will allow us to use a significant portion of the U.S. non-life insurance companies’ net operating losses, which are scheduled to expire beginning in 2022, and other deductible temporary differences. As a result, we released the corresponding deferred tax valuation allowance, as it is more likely than not that these attributes will be realized.
Under current Bermuda law, we are not required to pay any taxes in Bermuda on either income or capital gains. We have received an undertaking from the Minister of Finance in Bermuda that, in the event of any such taxes being imposed, we will be exempted from taxation until the year 2035.
13. Related Parties
Athene Asset Management
Investment related expenses – Substantially all of our investments, with the exception of the investments of ADKG, are managed by Athene Asset Management, L.P. (AAM), a subsidiary of AGM. AAM provides direct investment management, asset allocation, mergers and acquisition asset diligence, and certain operational support services for our investment portfolio, including investment compliance, tax, legal, and risk management support. As of September 30, 2016, AAM directly managed $53,975 million of our investment portfolio assets, of which 84% are rated one or two by the National Association of Insurance Commissioners. For certain assets which require specialized sourcing and underwriting capabilities, AAM has chosen to mandate sub-advisors rather than building out in-house capabilities. For the services related to these investments, AAM earns a fee of 0.40% per year on all assets managed in accounts owned by or related to us, including sub-advised assets, but excluding assets of ADKG and certain other limited exceptions. Additionally, AAM recharges the sub-advisory fees it incurs with respect to our sub-advised assets to us.
Although the investment management fee that AAM charges us is generally 0.40% as described above, we have entered into an agreement with AAM to discount certain fees due by Athene. For the total dollar amount of all liabilities sourced through our organic distribution channels during 2016 in excess of $5.1 billion, subject to certain exceptions, (Excess Liabilities), AAM has agreed to reduce the fees as follows:
| • | For 2016, a discount of 0.40%. |
| • | For 2017, a discount of 0.20%. |
| • | For 2018 and thereafter, a discount of 0.075% per year. |
Excess Liabilities are determined based on our actuarial projections at the time that such Excess Liabilities are written and will amortize on a quarterly basis according to our projections for purposes of determining the discount. During the nine months ended September 30, 2016, our organic channels have provided deposits of $6.9 billion.
AAM has entered into a Master Sub-Advisory Agreement (MSAA) with certain Apollo affiliates to sub-advise AAM with respect to a portion of our assets, with the fees recharged to us, in addition to the gross fee of 0.40% per year paid to AAM as described above. The MSAA covers services rendered by Apollo-affiliated sub-advisors relating to investments in certain asset classes, primarily CLO, CMBS, and ABS.
F-160
Table of Contents
ATHENE HOLDING LTD.
Notes to Condensed Consolidated Financial Statements (Unaudited)
The following represents the assets sub-advised by Apollo affiliates:
| (In millions, except for percentages) | September 30, 2016 | December 31, 2015 | ||||||
| Fixed maturity securities |
||||||||
| U.S. state, municipal, and political subdivisions |
$ | 5 | $ | 10 | ||||
| Foreign governments |
151 | 107 | ||||||
| Corporate |
1,975 | 1,435 | ||||||
| CLO |
4,682 | 4,339 | ||||||
| ABS |
926 | 1,746 | ||||||
| CMBS |
959 | 1,010 | ||||||
| RMBS |
— | 21 | ||||||
| Mortgage loans |
1,739 | 1,594 | ||||||
| Investment funds |
23 | 21 | ||||||
| Trading securities |
146 | 207 | ||||||
| Funds withheld at interest |
1,579 | 1,182 | ||||||
| Other investments |
84 | 83 | ||||||
|
|
|
|
|
|||||
| Total assets sub-advised by Apollo affiliates |
$ | 12,269 | $ | 11,755 | ||||
|
|
|
|
|
|||||
| Percent of assets sub-advised by Apollo affiliates to total AAM-managed assets |
19% | 20% | ||||||
Apollo Asset Management Europe
ADKG has an investment advisory agreement with Apollo Asset Management Europe (together with certain of its affiliates, AAME), also a subsidiary of AGM. AAME provides advisory services for all of ADKG’s investment portfolio other than operating cash, mortgage loans secured by residential and commercial properties that are not identified and advised by AAME, and assets related to unit-linked policies. Also excluded are assets held in German special investment funds managed or advised by Apollo, AAM, and any of the respective affiliates of Apollo, AAM, or AAME, to the extent the entity receives a management or advisory fee in connection with the fund. In providing these services, AAME has access to Apollo’s European expertise and capabilities. The ADKG investments sub-advised by AAME consist primarily of corporate and sovereign bonds, as compared to the more diverse range of assets managed by AAM or those held in the German special investment funds. As compensation for the investment advisory services rendered, AAME receives a fee of 0.10% per year on the assets it sub-advises. Affiliates of AAME receive an advisory fee of 0.35% per year on certain German special investment funds and is included in sub-advisory fees in the table below. As of September 30, 2016, these investment funds totaled $256 million.
The following represents the assets sub-advised by AAME:
| (In millions) | September 30, 2016 | December 31, 2015 | ||||||
| Fixed maturity securities |
||||||||
| Foreign governments |
$ | 2,362 | $ | 2,349 | ||||
| Corporate |
1,868 | 1,607 | ||||||
| Mortgage loans |
— | 139 | ||||||
| Other investments |
1,022 | 961 | ||||||
|
|
|
|
|
|||||
| Total assets sub-advised by AAME |
$ | 5,252 | $ | 5,056 | ||||
|
|
|
|
|
|||||
F-161
Table of Contents
ATHENE HOLDING LTD.
Notes to Condensed Consolidated Financial Statements (Unaudited)
The following summarizes the asset management fees and sub-advisory fees we have incurred related to AAM, AAME, and other Apollo affiliates:
| Nine months ended September 30, | ||||||||
| (In millions) | 2016 | 2015 | ||||||
| Asset management fees |
$ | 176 | $ | 174 | ||||
| Sub-advisory fees |
50 | 32 | ||||||
The management and sub-advisory fees are included within the net investment income line on the condensed consolidated statements of income. The management fees payable as of September 30, 2016, and December 31, 2015, were $46 million and $35 million, respectively. The sub-advisory fees payable as of September 30, 2016, and December 31, 2015, were $15 million and $24 million, respectively.
The investment management or advisory agreements with AAM or AAME have no stated term and any party can terminate upon notice. However, our bye-laws provide that we will not exercise our termination rights under the agreements, except that any agreement may only be terminated on October 31, 2018, or any third anniversary thereafter. Any termination on that date without cause requires (1) approval of our board of directors and the holders of our common shares that hold a majority of total voting power (giving effect to the voting allocation provisions set forth in our bye-laws) and (2) six months’ prior written notice to AAM or AAME of termination. We may terminate the investment management or advisory agreements for cause, with the approval of our board of directors.
Because the Apollo Group has a significant voting interest in us, in order to protect against potential conflicts of interest resulting from transactions into which we have entered, and will continue to enter into with the Apollo Group, our board of directors has formed a conflicts committee, consisting of five of our directors who are not members of the Apollo Group. The conflicts committee reviews and a majority of the committee members must approve material transactions between us and the Apollo Group, subject to certain exceptions.
Other related party transactions—In 2015, we entered into a loan purchase agreement with AmeriHome Mortgage Company, LLC (AmeriHome), an investee of A-A Mortgage, an equity method investee. The agreement allows us to purchase certain residential mortgage loans which they have purchased from correspondent sellers and pooled for sale in the secondary market. AmeriHome retains the servicing rights to the sold loans. We have purchased $19 million and $72 million of residential mortgage loans under this agreement during the nine months ended September 30, 2016, and 2015, respectively.
During the third quarter of 2016, we completed a series of transactions with Apollo Commercial Real Estate Finance, Inc. (ARI), a related party managed by an affiliate of Apollo. Pursuant to an agreement between ARI and Apollo Residential Mortgage, Inc. (AMTG), another related party managed by an Apollo affiliate, AMTG merged with and into ARI. In accordance with an Asset Purchase and Sale Agreement between us and ARI, we purchased $1,090 million of primarily non-agency RMBS from ARI subsequent to its merger with AMTG. We also provided ARI with a secured short-term $175 million loan to consummate the merger, which was subsequently repaid with the proceeds of the sale of such RMBS. Finally, subsequent to the merger, we purchased $20 million of ARI shares of common stock pursuant to a stock purchase agreement that required such purchase if ARI’s common stock price fell below a specified price, which was the per share value used in determining the purchase price under the merger agreement between ARI and AMTG, during the 30 trading days following the closing of the merger.
F-162
Table of Contents
ATHENE HOLDING LTD.
Notes to Condensed Consolidated Financial Statements (Unaudited)
14. Commitments and Contingencies
Contingent Commitments—We had commitments to make additional capital contributions to certain investment funds of $1,167 million and $825 million as of September 30, 2016, and December 31, 2015, respectively. We expect most of our current commitments will be invested over the next five years; however, these commitments could become due any time upon counterparty request.
Funding Agreements—We are a member of the Federal Home Loan Bank (FHLB) of Indianapolis and Des Moines. Through membership, we have issued funding agreements with a carrying value of $736 million and $1,112 million as of September 30, 2016, and December 31, 2015, respectively, to the FHLB in exchange for cash advances. The decrease in carrying value during the nine months ended September 30, 2016 was a result of maturities and payments on the outstanding funding agreements. We are required to provide collateral equal to the funding agreements, considering any discounts to the securities posted and prepayment penalties.
Pledged Assets and Funds in Trust (Restricted Assets)—The total restricted assets included on the condensed consolidated balance sheets are as follows:
| (In millions) | September 30, 2016 | December 31, 2015 | ||||||
| AFS securities |
||||||||
| Fixed maturity |
$ | 1,436 | $ | 1,865 | ||||
| Equity |
42 | 56 | ||||||
| Investment funds |
25 | 27 | ||||||
| Mortgage loans |
1,052 | 1,134 | ||||||
| Restricted cash |
63 | 116 | ||||||
|
|
|
|
|
|
| |||
| Total restricted assets |
$ | 2,618 | $ | 3,198 | ||||
|
|
|
|
|
|
| |||
The restricted assets are primarily a result of the FHLB funding agreements described above. Additionally, we have established reinsurance trusts of assets equal to statutory reserves, plus an additional amount of assets, as a result of coinsurance agreements with Transamerica Life Insurance Corporation.
Litigation, Claims, and Assessments—On June 12, 2015, a putative class action complaint was filed in the United States District Court, Northern District of California against us. The complaint, which is similar to complaints recently filed against other large insurance companies, primarily alleges that captive reinsurance and other transactions had the effect of misrepresenting the financial condition of Athene Annuity and Life Company (AAIA). The complaint purports to be brought on behalf of a class of purchasers of annuity products issued by AAIA between 2007 and the present. There are also various allegations related to the purchase of Aviva USA, and concerning a modified coinsurance transaction entered into with ALRe in October 2013. The suit asserts claims of violation of the Racketeer Influenced and Corrupt Organizations Act and seeks compensatory damages, trebled, in an amount to be determined, costs, and attorneys’ fees. On March 25, 2016, the matter was transferred to the United States District Court, Southern District of Iowa. On May 25, 2016, the court granted plaintiff’s motion to file an amended complaint dropping plaintiff Silva and defendant Aviva plc. We moved to dismiss that complaint on June 30, 2016, and the motion was fully briefed as of September 8, 2016. On November 4, 2016, the court stayed consideration of the motion to dismiss pending a ruling from the United States Court of Appeals for the Eighth Circuit in a similar case which will likely affect the disposition of our motion. See Ludwick v. Harbinger Grp., Inc., 161 F. Supp. 3d 769 (W.D. Mo. 2016), appeal docketed, No. 16-1561 (8th Cir.). We believe we have meritorious defenses to the claims set forth in the amended complaint and intend to vigorously defend the litigation and seek dismissal of the amended complaint. In light of the inherent uncertainties involved in this matter, reasonably possible losses, if any, cannot be estimated at this time.
F-163
Table of Contents
ATHENE HOLDING LTD.
Notes to Condensed Consolidated Financial Statements (Unaudited)
On July 27, 2015, a putative class action complaint was filed in the United States District Court, District of Massachusetts, against us. An amended complaint was filed on December 18, 2015. The complaint alleges a putative class action on behalf of all persons who are the beneficial owners of assets which were used to purchase structured settlement annuities that Aviva London Assignment Corporation, Aviva Life Insurance Company, and CGU International Insurance, plc (Aviva Entities) or their predecessors, as applicable, delivered to purchasers on or after April 1, 2003. The complaint alleges that the Aviva Entities sold structured settlement annuities to the public on the basis that such products were backed by a capital maintenance agreement by CGU International Insurance, plc, which was alleged as a source of great financial strength. The complaint further alleges that the Aviva Entities used this capital maintenance agreement to enhance the sales volume and raise the price of the annuities. The complaint claims that, as a result of Aviva USA’s sale to AHL, the capital maintenance agreement terminated. According to the complaint, no notice was provided to the owners of the structured settlement annuities and the termination of the capital maintenance agreement constituted a breach of contract and the plaintiff further asserts other causes of action. AHL is a named defendant due to its purchase of Aviva USA, and AAIA and Athene London Assignment are named as successors to Aviva Life Insurance Company and Aviva London Assignment Corporation, respectively. The defendants have answered and are engaged in the discovery process. We believe that we have meritorious defenses to the claims set forth in the complaint and intend to vigorously defend the litigation. In light of the inherent uncertainties involved in this matter, reasonably possible losses, if any, cannot be estimated at this time.
The IRS has completed its examinations of the 2006 through 2010 Aviva USA tax years. Aviva USA agreed to all adjustments that were proposed with respect to those tax years with two exceptions: (1) AAIA’s treatment of call options used to hedge fixed indexed annuity (FIA) liabilities for the tax years 2008 – 2010, and (2) the disallowance of offsetting tax deductions taken by AAIA and taxable income reported by the non-life subgroup with respect to unpaid independent marketing organization commissions. The first adjustment to which Aviva USA did not agree would disallow deductions of $191 million, $154 million, and $76 million for 2008, 2009, and 2010, respectively. The second adjustment to which Aviva USA did not agree would increase non-life net operating losses and decrease AAIA net operating losses by $16 million in each of 2009 and 2010. Taxes, penalties and interest with respect to these two issues for the years under audit are potentially subject to indemnification by Aviva plc. Athene USA has been unable to negotiate a favorable settlement of this issue with the IRS, and has reserved its right to contest the adjustment in federal court. If the IRS position is upheld in federal court, Athene USA expects that it would owe tax of $120 million, plus interest, for tax years ending on or before October 2, 2013, which are subject to indemnification by Aviva plc as described above. The treatment of FIA hedges is a recurring issue as to the timing of the related deductions and could affect the current income tax incurred in periods after October 2, 2013, which are not subject to indemnification by Aviva plc. Given that the disallowance of a deduction in one period results in an increased deduction in a future period, AHL does not expect that there will be any material impact to its financial condition resulting from this issue.
In 2000 and 2001, two insurance companies which were subsequently merged into AAIA purchased from American General Life Insurance Company (American General) broad based variable corporate-owned life insurance (COLI) policies that, as of September 30, 2016, had an asset value of $324 million, and is included in other assets on the condensed consolidated balance sheets. In January 2012, the COLI policy administrator delivered to AAIA a supplement to the existing COLI policies and advised that American General and ZC Resource Investment Trust (ZC Trust) had unilaterally implemented changes set forth in the supplement that if effective, would: (1) potentially negatively impact the crediting rate for the policies and (2) change the exit and surrender protocols set forth in the policies. In March 2013, AAIA filed suit against American General, ZC Trust, and ZC Resource LLC in Chancery Court in Delaware, seeking, among other relief, a declaration that the changes set forth in the supplement were ineffectual and in breach of the parties’ agreement. The parties filed cross motions for judgment as a matter of law, and the court granted defendants’ motion and dismissed without prejudice on ripeness grounds. The issue that negatively impacts the crediting rate for one of the COLI policies
F-164
Table of Contents
ATHENE HOLDING LTD.
Notes to Condensed Consolidated Financial Statements (Unaudited)
has been triggered and we will pursue further adjudication. If the supplement is ultimately deemed to be effective, the purported changes to the policies could impair AAIA’s ability to access the value of guarantees associated with the policies. The value of the guarantees included within the asset value reflected above are $155 million as of September 30, 2016.
15. Segment Information
We operate our core business strategies out of one reportable segment, Retirement Services. In addition to Retirement Services, we report certain other operations in Corporate and Other.
Retirement Services—Retirement Services is comprised of our United States and Bermuda operations which issue and reinsure retirement savings products and institutional products. Retirement Services has retail operations, which provide annuity retirement solutions to our policyholders. Retirement Services also has reinsurance operations, which reinsure multi-year guaranteed annuities, fixed indexed annuities, traditional one-year guarantee fixed deferred annuities, immediate annuities, and institutional products from our reinsurance partners. In addition, our funding agreement backed notes program is included in our Retirement Services segment.
Corporate and Other—Corporate and Other includes certain other operations related to our corporate activities and our German operations, which is primarily comprised of participating long-duration savings products. In addition to our German operations, included in Corporate and Other are corporate allocated expenses, merger and acquisition costs, debt costs, certain integration and restructuring costs, certain stock-based compensation, and intersegment eliminations. In Corporate and Other, we also hold the capital in excess of the level of capital we hold in Retirement Services to support our operating strategy.
Financial Measures—Segment operating income, net of tax, is an internal measure used by the chief operating decision maker to evaluate and assess the results of our segments.
Operating revenue is a component of operating income, net of tax, and excludes market volatility and adjustments for other non-operating activity. Our operating revenue equals the total revenue of the Company, adjusted to eliminate the impact of the following non-operating adjustments:
| • | Change in fair values of derivatives and embedded derivatives – index annuities, net of offsets; |
| • | Investment gains (losses), net of offsets; |
| • | VIE expenses and noncontrolling interest; and |
| • | Other adjustments to revenues. |
F-165
Table of Contents
ATHENE HOLDING LTD.
Notes to Condensed Consolidated Financial Statements (Unaudited)
The table below reconciles segment operating revenues to total revenues presented on the condensed consolidated statements of income:
| Nine months ended September 30, | ||||||||
| (In millions) | 2016 | 2015 | ||||||
| Operating revenue by segment |
||||||||
| Retirement Services |
$ | 2,471 | $ | 2,206 | ||||
| Corporate and Other |
166 | 21 | ||||||
|
|
|
|
|
|||||
| Total segment operating revenues |
2,637 | 2,227 | ||||||
|
|
|
|
|
|||||
| Non-operating adjustments |
||||||||
| Change in fair values of derivatives and embedded derivatives – index annuities, net of offsets |
100 | (620) | ||||||
| Investment gains (losses), net of offsets |
292 | (80) | ||||||
| VIE expenses and noncontrolling interest |
13 | 29 | ||||||
| Other adjustments to revenues |
3 | 15 | ||||||
|
|
|
|
|
|||||
| Total non-operating adjustments |
408 | (656) | ||||||
|
|
|
|
|
|||||
| Total revenues |
$ | 3,045 | $ | 1,571 | ||||
|
|
|
|
|
|||||
Operating income, net of tax, is an internal measure used to evaluate our financial performance excluding market volatility and expenses related to integration, restructuring, stock compensation, and other expenses. Our operating income, net of tax, equals net income available to Athene Holding Ltd. shareholders, adjusted to eliminate the impact of the following non-operating adjustments:
| • | Change in fair values of derivatives and embedded derivatives – index annuities, net of offsets; |
| • | Investment gains (losses), net of offsets; |
| • | Integration, restructuring and other non-operating expenses; |
| • | Stock-based compensation, excluding LTIP; and |
| • | Provision for income taxes – non-operating. |
F-166
Table of Contents
ATHENE HOLDING LTD.
Notes to Condensed Consolidated Financial Statements (Unaudited)
The table below reconciles segment operating income, net of tax, to net income available to Athene Holding Ltd. shareholders presented on the condensed consolidated statements of income:
| Nine months ended September 30, | ||||||||
| (In millions) | 2016 | 2015 | ||||||
| Operating income, net of tax by segment |
||||||||
| Retirement Services |
$ | 563 | $ | 513 | ||||
| Corporate and Other |
(87) | (17) | ||||||
|
|
|
|
|
|||||
| Total segment operating income, net of tax |
476 | 496 | ||||||
|
|
|
|
|
|||||
| Non-operating adjustments |
||||||||
| Change in fair values of derivatives and embedded derivatives – index annuities, net of offsets |
(82) | (92) | ||||||
| Investment gains (losses), net of offsets |
97 | (20) | ||||||
| Integration, restructuring and other non-operating expenses |
(8) | (31) | ||||||
| Stock-based compensation, excluding LTIP |
(59) | (51) | ||||||
| Provision for income taxes – non-operating |
13 | 18 | ||||||
|
|
|
|
|
|||||
| Total non-operating adjustments |
(39) | (176) | ||||||
|
|
|
|
|
|||||
| Net income available to Athene Holding Ltd. shareholders |
$ | 437 | $ | 320 | ||||
|
|
|
|
|
|||||
The following represents total assets by segment:
| (In millions) | September 30, 2016 | December 31, 2015 | ||||||
| Total assets by segment |
||||||||
| Retirement Services |
$ | 79,449 | $ | 73,710 | ||||
| Corporate and Other |
7,551 | 7,144 | ||||||
|
|
|
|
|
|||||
| Total assets |
$ | 87,000 | $ | 80,854 | ||||
|
|
|
|
|
|||||
F-167
Table of Contents
To Board of Directors of Athene Holding Ltd.:
We have audited the accompanying consolidated financial statements of Aviva USA and its subsidiaries, which comprise the consolidated balance sheet as of October 1, 2013, and the related consolidated statements of income and comprehensive income, of shareholder’s equity, and of cash flows for the nine month period ended October 1, 2013.
Management’s Responsibility for the Consolidated Financial Statements
Management is responsible for the preparation and fair presentation of the consolidated financial statements in accordance with accounting principles generally accepted in the United States of America; this includes the design, implementation, and maintenance of internal control relevant to the preparation and fair presentation of consolidated financial statements that are free from material misstatement, whether due to fraud or error.
Auditor’s Responsibility
Our responsibility is to express an opinion on the consolidated financial statements based on our audit. We conducted our audit in accordance with auditing standards generally accepted in the United States of America. Those standards require that we plan and perform the audit to obtain reasonable assurance about whether the consolidated financial statements are free from material misstatement.
An audit involves performing procedures to obtain audit evidence about the amounts and disclosures in the consolidated financial statements. The procedures selected depend on our judgment, including the assessment of the risks of material misstatement of the consolidated financial statements, whether due to fraud or error. In making those risk assessments, we consider internal control relevant to the Company’s preparation and fair presentation of the consolidated financial statements in order to design audit procedures that are appropriate in the circumstances, but not for the purpose of expressing an opinion on the effectiveness of the Company’s internal control. Accordingly, we express no such opinion. An audit also includes evaluating the appropriateness of accounting policies used and the reasonableness of significant accounting estimates made by management, as well as evaluating the overall presentation of the consolidated financial statements. We believe that the audit evidence we have obtained is sufficient and appropriate to provide a basis for our audit opinion.
Opinion
In our opinion, the consolidated financial statements referred to above present fairly, in all material respects, the financial position of Aviva USA and its subsidiaries as of October 1, 2013, and the results of their operations and their cash flows for the nine month period ended October 1, 2013, in accordance with accounting principles generally accepted in the United States of America.
/s/ PricewaterhouseCoopers LLP
Des Moines, Iowa
February 19, 2016
F-168
Table of Contents
AVIVA USA AND SUBSIDIARIES
(Dollars in thousands, unless otherwise stated)
| Assets | October 1, 2013 | |||
| Investments |
||||
| Securities available for sale at fair value: |
||||
| Fixed maturity securities (amortized cost: 2013 – $40,309,003) |
$ | 42,569,879 | ||
| Equity securities (cost: 2013 – $65,304) |
65,304 | |||
| Short-term investments |
17,392 | |||
| Securities held for trading purposes at fair value: |
||||
| Fixed maturity securities |
835,690 | |||
| Equity securities |
1,365 | |||
| Short-term investments |
4,895 | |||
| Mortgage loans, net of allowances |
5,209,228 | |||
| Real estate at amortized cost (net of accumulated depreciation of: 2013 – $26) |
9,485 | |||
| Policy loans at unpaid principal balances |
645,160 | |||
| Other investments |
2,205,558 | |||
|
|
|
|||
| Total investments |
51,563,956 | |||
| Cash and cash equivalents |
1,778,071 | |||
| Accrued investment income |
550,367 | |||
| Premium, fees, and other receivables |
45,785 | |||
| Reinsurance receivables |
1,174,925 | |||
| Deferred policy acquisition costs and deferred sales inducements |
3,761,278 | |||
| Value of business acquired |
730,173 | |||
| Property and equipment |
204,305 | |||
| Other assets |
458,727 | |||
| Separate account assets |
47,906 | |||
|
|
|
|||
| Total assets |
$ | 60,315,493 | ||
|
|
|
|||
| Liabilities and Shareholder’s Equity |
||||
| Liabilities |
||||
| Policy reserves and policyowner funds: |
||||
| Future life and annuity policy benefits |
$ | 50,545,860 | ||
| Policyowner funds |
2,863,873 | |||
| Accrued expenses and other liabilities |
929,774 | |||
| Payable for collateral under securities lending and other transactions |
786,517 | |||
| Dividends payable to policyowners |
408,646 | |||
| Policy and contract claims |
113,554 | |||
| Deferred income taxes |
1,062,971 | |||
| Separate account liabilities |
47,906 | |||
|
|
|
|||
| Total liabilities |
56,759,101 | |||
|
|
|
|||
| Shareholder’s equity |
||||
| Common stock, par value of $0.00 per share; 230,000,000 shares authorized; shares issued and outstanding: 2013 – 32 |
— | |||
| Additional paid-in capital |
2,708,847 | |||
| Retained earnings |
139,167 | |||
| Accumulated other comprehensive income |
708,378 | |||
|
|
|
|||
| Total shareholder’s equity |
3,556,392 | |||
|
|
|
|||
| Total liabilities and shareholder’s equity |
$ | 60,315,493 | ||
|
|
|
|||
The accompanying Notes are an integral part of the Consolidated Financial Statements.
F-169
Table of Contents
AVIVA USA AND SUBSIDIARIES
Consolidated Statement of Income
(Dollars in thousands, unless otherwise stated)
| Nine months ended October 1, 2013 |
||||
| Revenues |
||||
| Insurance premiums |
$ | 135,268 | ||
| Universal life and annuity product charges |
508,751 | |||
| Net investment income |
1,918,386 | |||
| Other-than-temporary impairments: |
||||
| Other-than-temporary impairment on fixed maturity securities |
(92,035) | |||
| Portion of other-than-temporary impairments recognized in other comprehensive income |
— | |||
|
|
|
|||
| Net other-than-temporary impairments recognized in net income |
(92,035) | |||
| Other realized/unrealized gains on investments |
1,653,475 | |||
| Other income |
58,450 | |||
|
|
|
|||
| Total revenues |
4,182,295 | |||
|
|
|
|||
| Benefits and expenses |
||||
| Policyowner benefits |
2,253,077 | |||
| Underwriting, acquisition, and other expenses |
345,617 | |||
| Amortization of deferred policy acquisition costs and value of business acquired |
520,759 | |||
| Dividends to policyowners |
57,621 | |||
| Interest expense |
36,945 | |||
|
|
|
|||
| Total benefits and expenses |
3,214,019 | |||
|
|
|
|||
| Income before income taxes |
968,276 | |||
| Income tax expense |
325,505 | |||
|
|
|
|||
| Net income |
$ | 642,771 | ||
|
|
|
|||
The accompanying Notes are an integral part of the Consolidated Financial Statements.
F-170
Table of Contents
AVIVA USA AND SUBSIDIARIES
Consolidated Statement of Comprehensive Income
(Dollars in thousands, unless otherwise stated)
| Nine months ended October 1, 2013 |
||||
| Net income |
$ | 642,771 | ||
| Other comprehensive income, before tax: |
||||
| Change in unrealized investment losses on available for sale securities |
(709,750) | |||
| Change in noncredit component of the other-than-temporary impairment losses, available for sale |
9,828 | |||
|
|
|
|||
| Other comprehensive loss before tax |
(699,922) | |||
| Income tax benefit related to items in other comprehensive income |
(244,973) | |||
|
|
|
|||
| Other comprehensive loss after tax |
(454,949) | |||
|
|
|
|||
| Total comprehensive income |
$ | 187,822 | ||
|
|
|
|||
The accompanying Notes are an integral part of the Consolidated Financial Statements.
F-171
Table of Contents
AVIVA USA AND SUBSIDIARIES
Consolidated Statement of Shareholder’s Equity
(Dollars in thousands, unless otherwise stated)
| Common stock |
Additional paid-in capital |
Retained earnings (deficit) |
Accumulated other comprehensive income |
Total shareholder’s equity |
||||||||||||||||
| Balance at December 31, 2012 |
$ | — | $ | 3,742,058 | $ | (498,604) | $ | 1,163,327 | $ | 4,406,781 | ||||||||||
| Net income |
— | — | 642,771 | — | 642,771 | |||||||||||||||
| Other comprehensive loss, net of tax |
— | — | — | (454,949) | (454,949) | |||||||||||||||
| Capital distribution to parent |
— | — | (5,000) | — | (5,000) | |||||||||||||||
| Share redemption |
— | (1,033,211) | — | — | (1,033,211) | |||||||||||||||
|
|
|
|
|
|
|
|
|
|
|
|||||||||||
| Balance at October 1, 2013 |
$ | — | $ | 2,708,847 | $ | 139,167 | $ | 708,378 | $ | 3,556,392 | ||||||||||
|
|
|
|
|
|
|
|
|
|
|
|||||||||||
The accompanying Notes are an integral part of the Consolidated Financial Statements.
F-172
Table of Contents
AVIVA USA AND SUBSIDIARIES
Consolidated Statement of Cash Flows
(Dollars in thousands, unless otherwise stated)
| Nine months ended October 1, 2013 |
||||
| Cash flows from operating activities |
||||
| Net income |
$ | 642,771 | ||
| Adjustments to reconcile net income to net cash provided by operating activities: |
||||
| Universal life and annuity product charges |
(508,751) | |||
| Interest credited to policyowner account balances |
777,510 | |||
| Change in option value of indexed products and market value adjustments on total return strategy annuities |
550,698 | |||
| Realized and unrealized (gains) on investments |
(1,561,440) | |||
| Amortization of deferred policy acquisition costs and value of business acquired |
520,759 | |||
| Other amortization |
20,788 | |||
| Impairment of other assets |
14,814 | |||
| Change in: |
||||
| Accrued investment income |
36,429 | |||
| Reinsurance receivables |
(104,211) | |||
| Fair value of securities held for trading purposes: |
||||
| Fixed maturity securities |
172,849 | |||
| Short-term investments |
978 | |||
| Deferred policy acquisition costs and deferred sales inducements |
978 | |||
| Future life and annuity policy benefits |
672,715 | |||
| Accrued expenses and other liabilities |
(119,347) | |||
| Policy and contract claims and other policyowner funds |
(71,826) | |||
| Deferred income taxes |
254,002 | |||
| Other |
45,794 | |||
|
|
|
|||
| Net cash provided by operating activities |
$ | 1,345,510 | ||
|
|
|
|||
(Continued)
The accompanying Notes are an integral part of the Consolidated Financial Statements.
F-173
Table of Contents
AVIVA USA AND SUBSIDIARIES
Consolidated Statement of Cash Flows
(Dollars in thousands, unless otherwise stated)
| Nine months ended October 1, 2013 |
||||
| Cash flows from investing activities |
||||
| Purchase of fixed maturity securities available for sale |
$ | (5,808,729) | ||
| Proceeds from sales and maturities of fixed maturity securities |
7,983,514 | |||
| Purchase of equity securities available for sale |
(6,908) | |||
| Proceeds from sale of equity securities available for sale |
38,775 | |||
| Change in short-term investments available for sale |
(1,980) | |||
| Investment in mortgage loans |
(700,661) | |||
| Proceeds from repayment and sale of mortgage loans |
364,354 | |||
| Purchase of other investments |
(516,257) | |||
| Proceeds from sale of other investments |
1,428,335 | |||
| Change in policy loans |
8,387 | |||
| Change in other assets |
54,013 | |||
|
|
|
|||
| Net cash provided by investing activities |
2,842,843 | |||
|
|
|
|||
| Cash flows from financing activities |
||||
| Deposits to policyowner account balances |
2,373,544 | |||
| Withdrawals from policyowner account balances |
(3,718,084) | |||
| Net principal payments on revolving credit agreement |
(237,000) | |||
| Principal payments on other notes payable |
(896,000) | |||
| Collateral under securities lending and other transactions |
276,412 | |||
| Share redemption |
(1,033,211) | |||
| Other |
(60,474) | |||
|
|
|
|||
| Net cash used in financing activities |
(3,294,813) | |||
|
|
|
|||
| Net increase (decrease) in cash |
893,540 | |||
| Cash at beginning of period |
884,531 | |||
|
|
|
|||
| Cash at end of period |
$ | 1,778,071 | ||
|
|
|
|||
| Supplemental disclosure of cash activities: |
||||
| Interest paid |
$ | 21,573 | ||
| Income taxes paid |
48,325 | |||
| Non-Cash transactions: |
||||
| Deposits to policyowner account balances through reinsurance agreements |
$ | 224 | ||
| Withdrawals from policyowner account balances through reinsurance agreements |
17,880 | |||
(Concluded)
The accompanying Notes are an integral part of the Consolidated Financial Statements.
F-174
Table of Contents
AVIVA USA AND SUBSIDIARIES
Notes to Consolidated Financial Statements
(Dollars in thousands, unless otherwise stated)
| 1. | Company and Organization |
Nature of Operations
Aviva USA Corporation and its wholly owned subsidiaries (Aviva USA or the Company), is engaged in the underwriting, marketing, and distribution of life insurance, annuities, and related products in the United States through various systems, organizations, and networks. Aviva USA is a wholly owned indirect subsidiary of Aviva plc.
The Company operates and manages its business as a single reportable segment. The Company’s primary business activities are selling life and annuity products. Management reviews operating results at a total company level which combines life and annuity products as a whole to make decisions about allocating resources and assessing performance. Insurance premiums, and investment-type contract deposits which are not included as revenues in the accompanying Consolidated Statements of Income, collected by product type are as follows:
| Product |
Nine months ended October 1, 2013 |
|||
| Annuities |
$ | 1,675,134 | ||
| Life insurance |
664,553 | |||
| Accident and health insurance |
633 | |||
|
|
|
|||
| $ | 2,340,320 | |||
|
|
|
|||
Basis of presentation, period, and circumstances
The Consolidated Financial Statements have been prepared in accordance with accounting principles generally accepted in the United States of America (U.S. GAAP). All significant intercompany balances and transactions have been eliminated in consolidation. The Company accounts for investments over which it has significant influence but not a controlling financial interest using the equity method of accounting.
On December 21, 2012, Aviva plc entered into a definitive agreement to sell 100% of the common shares of Aviva USA to Athene Holding Ltd. (AHL). AHL is a Bermuda exempted company and, through its subsidiaries, provides insurance products focused principally on the retirement market. The transaction was approved by the relevant states’ regulators in the U.S. and closed on October 2, 2013.
As a result, in accordance with the Rule 3-05 of the Securities and Exchange Commission Regulation S-X, the historical financial statements of Aviva USA are included in the S-1 registration statement for AHL due to the significance of the acquisition.
Aviva USA was a member of the North American reporting region of Aviva plc, which consisted of Aviva USA and Aviva Canada. All expenses associated with regional activities (personnel, advertising, facilities, etc.) were allocated to Aviva USA in the accompanying Consolidated Financial Statements. The allocation methodologies used were developed to achieve a representative allocation of the relative time and usage split to result in an accurate expense recording to Aviva USA or Aviva Canada and these methodologies were consistently applied each period.
The predecessor entities of Aviva USA were acquired by Aviva plc in November 2006 and certain assets acquired through the acquisition were pushed down and recorded by Aviva USA. The accompanying Consolidated Financial Statements reflect these assets and the impacts of the changes in these balances.
F-175
Table of Contents
AVIVA USA AND SUBSIDIARIES
Notes to Consolidated Financial Statements (continued)
(Dollars in thousands, unless otherwise stated)
| 2. | Significant Accounting Policies |
Use of Estimates
The preparation of consolidated financial statements in conformity with GAAP requires management to make estimates and assumptions that affect the reported amounts of assets and liabilities and disclosure of contingent assets and liabilities at the date of the consolidated financial statements and the reported amounts of revenues and expenses during the reporting period. Significant estimates and assumptions are used in the calculation of deferred policy acquisition costs (DAC), deferred sales inducements (DSI), policy benefit reserves, valuation of derivatives, valuation of investments and other-than-temporary impairment (OTTI) of investments, valuation of deferred tax assets, value of business acquired (VOBA), allocation of historical costs, and reinsurance. A description of each significant estimate is incorporated within the discussion of the related accounting policies included herein. Actual experience could differ from these estimates and assumptions.
Investments
Investments in fixed maturity securities, equity securities, and short-term investments intended to be held for indefinite periods of time are classified as securities available for sale and are reported at fair value. Unrealized gains and losses on available for sale securities are included in accumulated other comprehensive income, net of income taxes and adjustments to DAC, VOBA, and unearned revenue reserves.
Fixed maturity securities, equity securities, and short-term investments bought and held principally to support the Company’s total return strategy fixed annuity products are reported as trading securities and are carried at fair value with changes in fair value reported as other realized/unrealized gains (losses) on investments in the Consolidated Statements of Income.
Premiums and discounts on fixed maturity securities are amortized or accreted over the life of the related security as an adjustment to yield using the effective interest method, and are recorded in net investment income in the Consolidated Statements of Income. Investment income is recognized when earned. Realized gains and losses on investments are recognized on a specific identification basis.
Fair values of fixed maturity securities are reported based on quoted market prices, where available. Market values of fixed maturity securities not actively traded in a liquid market are estimated by comparison to similar securities with quoted prices when possible. Otherwise, the most recent purchases and sales of similar unquoted securities, independent broker quotes, or internally prepared valuations are used to estimate fair value. Internally prepared valuations use a matrix calculation assuming a spread based on interest rates and a risk assessment of the bonds over U.S. Treasury bonds. Fair values of redeemable preferred stocks and equity securities are based on the latest quoted market prices, or for those not readily marketable, generally at values which are representative of the fair values of comparable issues.
Other investments include investments in hedge funds and funds-of-funds, partnerships and LLCs, derivatives, and other investments. Investments in partnerships in which the Company’s ownership percentage exceeds three percent, and joint ventures, are generally accounted for under the equity method. Subsequent to an initial investment, the Company increases or decreases the carrying amount of the investment for its share of income or loss of the investee, dividend distributions, and changes in the equity of the investee in the income statement. Investments in partnerships in which the Company’s ownership percentage is less than three percent are generally accounted for under the cost method whereby dividends received by the investee are recognized as income. The Company is primarily a limited partner in such investments.
F-176
Table of Contents
AVIVA USA AND SUBSIDIARIES
Notes to Consolidated Financial Statements (continued)
(Dollars in thousands, unless otherwise stated)
Derivative Instruments and Hedging Activities
The Company hedges certain portions of its exposure to interest rate risk, credit risk, and equity risk fluctuations by entering into derivative transactions. All derivative instruments are recognized as either assets or liabilities in the Consolidated Balance Sheets at fair value. The accounting for changes in the fair value of a derivative instrument depends on whether it has been designated and qualifies as part of a hedging relationship and further, on the type of hedging relationship. For derivative instruments that are designated and qualify as hedging instruments, the Company designates the hedging instrument based upon the exposure being hedged. Derivative instruments that are economic hedges, but not designated as hedging instruments, are also utilized.
For derivative instruments that are designated and qualify as a fair value hedge, the gain or loss on the derivative instrument as well as the offsetting loss or gain on the hedged item attributable to the hedged risk is recognized in other realized/unrealized gains (losses) on investments during the period of change in fair value. Premiums, if any, received on such instruments are recorded as net investment income. Economic hedges for which the Company does not seek hedge accounting treatment are recognized in current income with changes in asset values included in other realized/unrealized gains (losses) on investments and changes in liability values included in policyowner benefits. For derivative instruments not designated as hedging instruments (i.e. economic derivatives), the gain or loss is recognized in current income during the period of change in other realized/unrealized gains (losses) on investments. The Company does not hold any speculative derivatives. Derivative assets are included within other investments while derivative liabilities are included within accrued expenses and other liabilities in the Consolidated Balance Sheets. Where the Company enters into enforceable master netting arrangements with counterparties, the master netting arrangements permit the Company to net those derivative asset and liability positions and to offset cash collateral held and posted with the same counterparty.
See Note 6 – Derivative Instruments and Hedging Activities for the recognized derivative instruments, including bifurcated embedded derivatives, that are offset in the Consolidated Balance Sheets, and/or are subject to an enforceable master netting arrangement or similar agreement.
The Company issues certain fixed indexed annuities and fixed indexed universal life products with returns linked to the performance of a specific market index. These products contain terms that are deemed to be embedded derivatives. The Company assesses the contract terms to identify embedded derivatives which are required to be bifurcated under the authoritative guidance for Derivatives and Hedging. If the contract is not reported in its entirety at fair value and management determines the terms of the embedded derivative are not clearly and closely related to the economic characteristics of the host contract, and a separate instrument with the same terms would qualify as a derivative instrument, the embedded derivative is bifurcated from the host contract and accounted for separately.
Such embedded derivatives are carried on the Consolidated Balance Sheets at fair value in the same line item as the host contract. Changes in the fair value of embedded derivatives associated with the fixed indexed annuities and fixed indexed universal life contracts are reflected in policyowner benefits on the Consolidated Statements of Income.
Fair Value
Certain assets and liabilities are measured at estimated fair value in the Company’s Consolidated Balance Sheets. In addition, the Notes to these Consolidated Financial Statements include further disclosures of estimated fair values. Fair value is the price that would be received to sell an asset or paid to transfer a liability (an exit price) in the principal or most advantageous market for the asset or liability in an orderly transaction between market
F-177
Table of Contents
AVIVA USA AND SUBSIDIARIES
Notes to Consolidated Financial Statements (continued)
(Dollars in thousands, unless otherwise stated)
participants on the measurement date. In most cases, the exit price and the transaction (or entry) price will be the same at initial recognition.
After initial recognition, the Company categorizes its assets and liabilities measured at estimated fair value into a three-level hierarchy, based on the lowest level input that is significant to its valuation. The input levels are as follows:
Level 1 – Quoted Market Prices in Active Markets – Inputs to Level 1 fair values are unadjusted quoted prices in active markets for identical assets or liabilities.
Level 2 – Valued with Significant Observable Market Parameters – Inputs to Level 2 fair values are inputs other than quoted prices included within Level 1 that are observable for the asset, either directly or indirectly. If the asset has a specified contractual term, a Level 2 input must be observable for substantially the full term of the asset. Level 2 inputs may include the following:
| • | Quoted prices for similar assets or liabilities in active markets. |
| • | Quoted prices for identical or similar assets or liabilities in markets that are not active, the prices are not current, price quotations vary substantially either over time or among market makers, or in which little information is released publicly. |
| • | Inputs other than quoted prices that are observable for the asset or liability (for example, interest rates and yield curves observable at commonly quoted intervals, volatilities, prepayment speeds, loss severities, credit risks, and default rates). |
| • | Inputs that are derived principally from, or corroborated by, observable market data by correlation or other market-corroborated inputs. |
Examples include securities measured using discounted cash flow models based on market observable swap yields, investment property measured using market observable information, and listed debt or equity securities in an inactive market.
Level 3 – Valued Using Models with Significant Unobservable Market Parameters – Inputs to Level 3 fair values are unobservable inputs for the asset. Unobservable inputs may be used to measure fair value to the extent observable inputs are not available, allowing for situations in which there is little, if any, market activity or market information for the inputs to any valuation model for the asset or liability at the measurement date. As such, unobservable inputs reflect management’s assumptions about the inputs market participants would use in pricing the asset. Examples include certain private equity investments and private placements.
Fair Value Option
The Company has the option to elect fair value for certain financial instruments, including funding agreement liabilities and certain hybrid financial instruments. The fair value option may be elected for any instrument that meets the definition of a financial asset or financial liability. The decision about whether to elect the fair value option is:
| (1) | Applied on an instrument-by-instrument basis; |
| (2) | Irrevocable unless a new election date occurs; and |
F-178
Table of Contents
AVIVA USA AND SUBSIDIARIES
Notes to Consolidated Financial Statements (continued)
(Dollars in thousands, unless otherwise stated)
| (3) | Applied to the entire instrument and not to only specified risks, specific cash flows, or portions of that instrument. |
Funding agreement liabilities represent contracts issued to the Federal Home Loan Bank (FHLB) for which the proceeds are invested in bonds at a higher interest rate than the borrowed funds to earn a spread on the investment. The Company elected the fair value option for funding agreement liabilities entered into prior to 2008 to match the accounting for the financial asset and the liability. The fair value of funding agreement liabilities are included in policyowner funds in the Consolidated Balance Sheet and were $660,565 at October 1, 2013. Changes in the fair value of the liabilities are recorded within policyowner benefits on the Company’s Consolidated Statement of Income and totaled a gain of $25,850 for the nine months and one day ended (nine months ended) October 1, 2013. The fair value of the funding agreement liabilities is calculated based on the discounted cash flow method using the observable spreads received from the FHLB.
The Company elected the fair value option with respect to its income-only commercial mortgage-backed securities (I/O CMBS). The fair value of I/O CMBS is recorded in fixed maturity securities held for trading and was $10,158 at October 1, 2013. Unrealized gains recorded in other realized/unrealized gains (losses) on investments in the Company’s Consolidated Statement of Income for I/O CMBS were $2,204 during the nine months ended October 1, 2013.
Subsequent changes to the carrying amounts include impairment, fair value adjustments, as well as amortization. The Company reports changes in fair value on items for which the fair value option has been elected in earnings.
Mortgage Loans
Commercial mortgage loans are carried at unpaid principal balances adjusted for amortization of premiums and accretion of discounts, and inclusive of accrued interest. Interest income is accrued on the principal balance of the loan based on the loan’s contractual interest rate. Premiums and discounts are amortized using the effective yield method over the life of the loan. Interest income and amortization of premiums and discounts are reported in net investment income on the Consolidated Statements of Income along with mortgage loan fees, which are recorded as incurred. Loans are reviewed quarterly and asset administrators determine whether any loans are impaired by evaluating the following:
| • | The probability of default/foreclosure; |
| • | The borrower’s plan to correct the condition and willingness to continue to fund the property; |
| • | Analysis of recovery of contractual principal and interest; |
| • | Probable value vs. debt; and |
| • | Credit enhancements (e.g. guaranty, letter of credit, etc). |
The Company evaluates impairment of loans on a quarterly basis and considers characteristics and risk factors attributable to the aggregate portfolio. If the Company determines the value of any mortgage loan is impaired (i.e., when it is probable the Company will be unable to collect all amounts due according to the contractual terms of the loan agreement, or a loan modification occurs which has been classified as a troubled debt restructuring), the carrying value of the mortgage loan is reduced to its fair value, which may be based upon the present value of expected future cash flows from the loan, or the fair value of the underlying collateral.
The Company ceases accruing interest on mortgage loans when impaired and does not resume interest accrual after impairment. Payments and interest income are recorded when received.
F-179
Table of Contents
AVIVA USA AND SUBSIDIARIES
Notes to Consolidated Financial Statements (continued)
(Dollars in thousands, unless otherwise stated)
Policy Loans
Policy loans represent loans the Company issues to contract holders and which use the cash surrender value of the life insurance policy as collateral. Policy loans are carried at unpaid principal balances.
Agent and Broker Loans
The Company provides loans to its agents and brokers. These loans are not collateralized, and, as such, the Company records an allowance related to expected uncollectible loans.
Closed Blocks
The Company has established two Closed Blocks of policies in connection with the reorganization of two of its subsidiaries from mutual companies to stock companies. Insurance policies which had a dividend scale in effect as of each Closed Block establishment date were included in the Closed Blocks. The Closed Blocks were designed to give reasonable assurance to the owners of insurance policies included therein that, after the reorganizations, assets would be available to maintain the dividend scales and interest credits in effect prior to the reorganization, if the experience underlying such scales and crediting continued. The assets, including related revenue, allocated to the Closed Blocks will accrue solely to the benefit of the policyowners included until the Closed Blocks no longer exists.
The Company will continue to pay guaranteed benefits under all policies, including policies included in the Closed Blocks, in accordance with their terms. In the event the Closed Blocks’ assets are insufficient to meet the Closed Blocks’ guaranteed benefits, general assets would be used to meet the contractual benefits of the Closed Blocks’ policyowners.
A policyowner dividend obligation is required to be established for earnings in the Closed Blocks that are not available to the shareholder. A model was established to produce the pattern of expected earnings in the Closed Blocks. If actual cumulative earnings are greater than the expected cumulative earnings, only the expected cumulative earnings will be recognized in income, with the excess recorded as a policyowner dividend obligation. This policyowner dividend obligation represents undistributed accumulated earnings that will be paid to Closed Blocks’ policyowners as additional policyowner dividends, unless offset by less favorable future performance. If actual cumulative performance is less favorable than expected, only actual earnings will be recognized in income.
Deferred Policy Acquisition Costs and Deferred Sales Inducements
The Company incurs significant costs in connection with acquiring new insurance contracts. Costs related directly to successful acquisition of new or renewal contracts are capitalized as DAC. Such costs include commissions, underwriting, policy issuance and processing, or various sales force contract selling related costs. All other acquisition related costs are expensed as incurred.
The method of amortizing DAC for traditional life insurance products varies, depending upon whether the contract is participating or nonparticipating. Participating contracts are those expected to pay dividends to policyowners in proportion to their relative contribution to the Company’s statutory surplus. DAC for participating traditional life insurance is amortized over the life of the policies in proportion to the present value of estimated gross margins. Nonparticipating traditional life insurance DAC is amortized over the premium-paying period of the related policies in proportion to the ratio of annual premium revenues to total anticipated
F-180
Table of Contents
AVIVA USA AND SUBSIDIARIES
Notes to Consolidated Financial Statements (continued)
(Dollars in thousands, unless otherwise stated)
premium revenues, using assumptions consistent with those used in computing policy benefit reserves. For universal life, indexed life, and annuity products, DAC is amortized in proportion to the present value of estimated gross margins from surrender charges and investment, mortality, and expense margins. The cumulative amortization of DAC is adjusted to reflect actual experience and revisions in estimated future gross margins on participating traditional life, universal life, indexed life, and annuity products. These adjustments are reflected in income in the period estimates are revised. The DAC asset is also adjusted for the impact on estimated gross margins of net realized and unrealized gains and losses on securities supporting such products. The impact of unrealized gains and losses is reflected in other comprehensive income.
The Company offers programs under which policyowners, for a selected product or group of products, can exchange an existing policy or contract issued by the Company for a similar form of policy or contract. If such internal replacements occur, and the rights and obligations of the parties to the contract are substantially unchanged from those under the replaced contract, the replacement contract is accounted for as a continuation of the replaced contract with no related impact on DAC. If an internal replacement occurs, and results in a replacement contract substantially changed from the replaced contract, the replaced contract is accounted for as if the contract or policy was extinguished, and the related DAC is written off as an expense.
DAC is reviewed by line of business annually, or when an event occurs that may warrant loss recognition, to determine if it is recoverable from future income and, if not, is charged to expense. Future investment income attributable to related premiums is considered when measuring the recoverability of the carrying value.
The Company also offers sales inducements on certain annuity products, which are recognized as policyowner liabilities as the inducements are accrued and credited to the policyowner’s account. A sales inducement is capitalized as an asset if it is explicitly identified in the contract at inception, incremental to amounts credited on similar contracts without sales inducements, and higher than the contract’s expected ongoing crediting rates for periods after the inducement period. The amortization of DSI is expensed to policyowner benefits on the Consolidated Statements of Income in proportion to the present value of estimated gross margins, consistent with the DAC asset. The DSI asset is also adjusted for the impact on estimated gross margins of net realized and unrealized gains and losses on securities supporting such products. The impact of unrealized gains and losses is reflected in other comprehensive income. DSI is subject to loss recognition testing on an annual basis, or when an event occurs that may warrant loss recognition.
Value of Business Acquired
The portion of the purchase price of insurance companies allocated to the right to receive future cash flows from insurance contracts existing at the date of the acquisition is referred to as VOBA. This cost of policies purchased represents the actuarially determined present value of the projected future gross margins from the acquired policies.
The expected future gross margins and expected premiums used in determining such value are based on actuarial projections of future premium receipts, mortality, surrenders, operating expenses, changes in insurance liabilities, investment yields on the assets retained to support the policy liabilities, and other factors. These projections take into account all factors known or expected at the valuation date, based on management’s judgment. The actual experience on purchased business may vary from projections due to differences in renewal premium, investment spread, investment gains or losses, mortality and morbidity costs, and other factors.
VOBA is amortized based on the expected gross margins and the interest rate credited to the underlying policies. If gross margins differ from expectations, the amortization is adjusted. The VOBA asset is adjusted for the
F-181
Table of Contents
AVIVA USA AND SUBSIDIARIES
Notes to Consolidated Financial Statements (continued)
(Dollars in thousands, unless otherwise stated)
impact on estimated gross margins of net realized and unrealized gains and losses on securities supporting the underlying business. At least annually, the recoverability of the VOBA is evaluated, and if the evaluation indicates the existing insurance liabilities, together with the present value of future gross margins from the blocks of business acquired, is insufficient to recover the VOBA, the difference is charged to expense as an impairment of the VOBA.
Actuarial Assumption Changes
Annually, or as circumstances warrant, the Company conducts comprehensive reviews of the assumptions used for its estimates of future gross profits and future gross margins underlying the amortization of the DAC, DSI, and VOBA, as well as the valuation of the embedded derivatives and reserves for life insurance and annuity products with guaranteed minimum benefits. Based on these reviews, the cumulative balances of DAC, DSI, and VOBA are adjusted to the extent future gross margins are changed.
During 2013, for the annuity business, the Company made changes to its assumptions which resulted in a net unfavorable impact of $2,879 on DAC, DSI, and VOBA amortization. For the life business, the Company made changes to its assumptions which resulted in a net unfavorable impact of $7,654 on DAC, DSI, and VOBA amortization. There was no unlocking in 2013.
Policyowner Dividends
Participating policies entitle the policyowners to receive dividends based on actual interest, mortality, morbidity, and expense experience for the related policies. These dividends are distributed to the policyowners through an annual dividend using current dividend scales, which are approved by the Board of Directors. As of October 1, 2013, approximately 49% of traditional life policies were paying dividends. Traditional life policies represented approximately 50% of the Company’s individual life policies in force at October 1, 2013.
Separate Accounts
Separate account assets and liabilities represent funds separately administered, principally for variable annuity contracts, and for which the contractholder, rather than the Company, bears the investment risk. Separate account contractholders typically have no claim against the assets of the general account of the Company, except with respect to certain insurance benefits. Separate account assets are reported at fair value. The related separate account liabilities are reported at the value of the separate account assets attributable to third parties.
Cash and Cash Equivalents
The Company includes cash, amounts due from other financial institutions, and interest-bearing deposits in other financial institutions, purchased with original maturities of three months or less, in cash and cash equivalents.
Property and Equipment
Property and equipment includes property, equipment, leasehold improvements, and computer software. Property, equipment, and leasehold improvements are stated at cost, less accumulated depreciation and amortization. Depreciation is determined using the straight-line method over the estimated useful lives of the assets, as appropriate. The estimated life for Company-occupied real estate property is 39 years. Estimated lives for leasehold improvements and other property and equipment ranges from three to five years.
Computer software is stated at cost, less accumulated amortization. Purchased software costs, as well as certain internal and external costs incurred to develop internal-use computer software during the application development stage, are capitalized. Such costs are amortized over a seven year period using the straight-line method.
F-182
Table of Contents
AVIVA USA AND SUBSIDIARIES
Notes to Consolidated Financial Statements (continued)
(Dollars in thousands, unless otherwise stated)
Future Life and Annuity Policy Benefits
The Company establishes liabilities for amounts payable under insurance policies, including traditional life insurance, immediate annuities, and term life insurance policies. Amounts are usually payable over an extended period of time, and related liabilities are calculated as the present value of future expected benefits to be paid, reduced by the present value of future expected premiums. Principal assumptions used in the establishment of liabilities for future policy benefits are mortality, policy lapse, renewal, investment returns, inflation, expenses, and other contingent events as appropriate for the respective product. These assumptions, including provisions for adverse deviations, are established at the time the policy is issued, and are intended to estimate the experience for the period the policy benefits are payable. Using these assumptions, liabilities are established on a block-of-business basis. For traditional long duration insurance contracts, assumptions such as mortality, morbidity, and interest rates are locked in upon the issuance of new business. However, significant adverse changes in experience on such contracts may require the Company to establish premium deficiency reserves. Premium deficiency reserves occur when the gross premiums are lower than the required U.S. GAAP premium to fund the future policyowner benefits. Such reserves are determined based on assumptions at the time the premium deficiency reserve is established, and do not include a provision for adverse deviation.
Future policy benefit liabilities for participating traditional life insurance policies are equal to the aggregate of (1) net level premium reserves for death and endowment policy benefits, calculated based upon the nonforfeiture interest rate, and (2) the liability for terminal dividends.
Future policy benefit liabilities for nonparticipating traditional life insurance policies are equal to the aggregate of the present value of expected future benefit payments and related expenses, less the present value of expected future net premiums. Assumptions as to mortality and persistency are based upon the Company’s experience when the basis of the liability is established.
Future policy benefit liabilities for individual fixed annuities and fixed indexed annuities (after annuitization), as well as immediate annuities, are equal to the present value of expected future payments.
Future policy benefit reserves for fixed indexed annuities earning a fixed rate of interest and other deferred annuity products are computed under a retrospective deposit method and represent policy account balances before applicable surrender charges. The interest crediting rates include interest bonuses capitalized as DSI.
The future policy benefits for investment-type contracts principally include individual fixed annuities in the accumulation phase, fixed indexed annuity contracts, universal life, and fixed indexed universal life products which have policy benefit reserves equal to (1) policy account values, which consist of an accumulation of gross premium payments and investment performance; (2) credited interest less expenses, mortality charges, and withdrawals; and (3) fair value adjustments relating to changes in the equity index levels.
The Company establishes additional liabilities for its persistency bonus/enhanced credited rate, income rider, and no lapse guarantees (associated with universal life type products) by estimating the expected value of withdrawal and death benefits in excess of the projected account balance, and recognizing the excess proportionally over the accumulation period based on total expected assessments. The methods used to estimate the liabilities use assumptions about policyholder behavior, mortality, and market conditions affecting the growth of the account balance.
F-183
Table of Contents
AVIVA USA AND SUBSIDIARIES
Notes to Consolidated Financial Statements (continued)
(Dollars in thousands, unless otherwise stated)
Policyowner Funds
Liabilities related to Guaranteed Interest Contracts (GICs) and funding agreements include (1) policy account values, which consist of an accumulation of gross premium payments and investment performance; (2) credited interest less expenses and withdrawals.
Policy and Contract Claims
Policy and contract claims include amounts payable relating to in course of settlement (ICOS) and incurred but not reported (IBNR) claim liabilities. ICOS claim liabilities are established for policies when the Company is notified of the death of the policyholder but the claim has not been paid as of the reporting date. IBNR claim liabilities are determined using studies of past experience and are estimated on an undiscounted basis, using actuarial estimates of historical claims expense, adjusted for current trends and conditions. These estimates are continually reviewed and the ultimate liability may vary significantly from the amount recognized, which are reflected in net income in the period in which they are determined. Changes in policy and contract claims are recorded in policyowner benefits in the Consolidated Statements of Income.
Reinsurance
Accounting for reinsurance requires extensive use of assumptions and estimates, particularly related to the future performance of the underlying business and the potential impact of counterparty credit risks. The Company periodically reviews actual and anticipated experience compared to the assumptions used to establish assets and liabilities relating to ceded and assumed reinsurance, and evaluates the financial strength of counterparties to its reinsurance agreements using criteria similar to that evaluated in the security impairment process discussed previously. Additionally, for each of its reinsurance agreements, the Company determines whether the agreement provides indemnification against loss or liability relating to insurance risk.
The Company reviews all reinsurance contractual features, particularly those that may limit the amount of insurance risk to which the reinsurer is subject or features that delay the timely reimbursement of claims. For reinsurance of existing in-force blocks of long-duration contracts that transfer significant insurance risk, the difference, if any, between the amounts paid or received, and the liabilities ceded or assumed, related to the underlying contracts is considered the net cost of reinsurance at the inception of the reinsurance agreement. The net cost of reinsurance is recorded as an adjustment to DAC and recognized as a component of underwriting, acquisition, and other expenses on a basis consistent with the way the acquisition costs on the underlying reinsured contracts would be recognized. Subsequent amounts paid or received on the reinsurance of in-force blocks, as well as amounts paid or received related to new business, are recorded as ceded or assumed premiums and ceded or assumed future policy benefit liabilities.
The assumptions used to account for both long and short-duration reinsurance agreements are consistent with those used for the underlying contracts. Ceded policyowner and contract related liabilities, other than those currently due, are reported gross on the Consolidated Balance Sheets.
Amounts currently recoverable under reinsurance agreements are included in reinsurance receivables and amounts currently payable are included in accrued expenses and other liabilities on the Consolidated Balance Sheets. Such assets and liabilities relating to reinsurance agreements with the same reinsurer may be recorded net on the balance sheet, if a right of offset exists within the reinsurance agreement. In the event reinsurers do not meet their obligations to the Company under the terms of the reinsurance agreements, reinsurance balances recoverable could become uncollectible. In such instances, reinsurance recoverable balances are stated net of allowances for uncollectible reinsurance.
F-184
Table of Contents
AVIVA USA AND SUBSIDIARIES
Notes to Consolidated Financial Statements (continued)
(Dollars in thousands, unless otherwise stated)
Premiums, fees, and policyowner benefits and claims include amounts assumed under reinsurance agreements and are net of reinsurance ceded. Deposits received are included in accrued expenses and other liabilities and deposits made are included in reinsurance receivables. As amounts are paid or received, consistent with the underlying contracts, the deposit assets or liabilities are adjusted. Interest on such deposits is recorded as net investment income or interest expense, as appropriate. Periodically, the Company evaluates the adequacy of the expected payments or recoveries and adjusts the deposit asset or liability through policyowner benefits or other income, as appropriate.
Cessions under reinsurance agreements do not discharge the Company’s obligations as the primary insurer.
Recognition of Revenues
Premiums for traditional life insurance products, including those products with fixed and guaranteed premiums and benefits, which consists principally of whole life insurance policies and certain annuities with life contingencies, are recognized as revenue when due from policyowners.
Amounts received as payments for universal life-type and annuity-type contracts are not recorded as premium revenue. Revenues for such contracts consist of policy charges for the cost of insurance, policy administration charges, and surrender charges assessed against policyowner account balances during the period, and are earned when assessed against policyowner account balances during the period. All insurance related revenue is reported net of reinsurance ceded.
Share-Based Compensation
The Company has share-based compensation plans (collectively, the Plans), which are included in accrued expenses and other liabilities and initially measured at fair value at the dates of grants. The fair value of the awards is remeasured at each reporting period end until settlement. Changes in the fair value of the awards are recognized as compensation cost and are included in underwriting, acquisition, and other expenses. All awards under the Plans are cash settled.
Income Taxes
Deferred income taxes have been established based upon the temporary differences between the financial statement and income tax bases of assets and liabilities. Deferred tax assets and liabilities are recognized for the future tax consequences attributable to differences between the financial statement carrying amounts of existing assets and liabilities and their respective tax bases and operating loss and tax credit carryforwards. Deferred tax assets and liabilities are measured using enacted tax rates expected to apply to taxable income in the years in which those temporary differences are expected to be recovered or settled. The effect on deferred tax assets and liabilities of a change in tax rates is recognized in income in the period in which a change is enacted. The Company recognizes the effect of uncertain income tax positions only if those positions are more likely than not of being sustained. Recognized uncertain income tax positions are measured at the largest amount that is greater than 50% likely of being realized. Changes in recognition or measurement are recorded in the period in which the change in judgment occurs. The Company records interest expense and any associated penalties related to uncertain tax positions as income tax expense.
New Accounting Pronouncements
In July 2013, the Financial Accounting Standards Board (FASB) issued new guidance regarding derivatives. The guidance permits the Fed Funds Effective Swap Rate (or Overnight Index Swap Rate) to be used as a U.S.
F-185
Table of Contents
AVIVA USA AND SUBSIDIARIES
Notes to Consolidated Financial Statements (continued)
(Dollars in thousands, unless otherwise stated)
benchmark interest rate for hedge accounting in addition to the United States Treasury rate and London Inter-Bank Offered Rate (LIBOR). The guidance also removes the restriction on using different benchmark rates for similar hedges. The guidance is effective for qualifying new or redesignated hedging relationships entered into on or after July 17, 2013, and was applied prospectively. Adoption of the guidance did not have a significant effect on the Company’s Consolidated Balance Sheets, Statements of Income, or financial statement disclosures.
In February 2013 and June 2011, the FASB issued updated guidance regarding the presentation of comprehensive income. Under the February 2013 amendment, an entity is required to separately present information about significant items reclassified out of accumulated other comprehensive income by component as well as changes in accumulated other comprehensive income balances by component in either the financial statements or the notes to the financial statements. The guidance does not change the items that are reported in other comprehensive income, does not change when an item of other comprehensive income must be reclassified to net income, and does not amend any existing requirements for reporting net income or other comprehensive income. The guidance became effective for interim or annual reporting periods that began after December 15, 2012, and was applied prospectively. Adoption of the guidance did not have a significant effect on the Company’s Consolidated Balance Sheets, Statements of Income, or financial statement disclosures.
The June 2011 amendment requires entities to present the total of comprehensive income, the components of net income, and the components of other comprehensive income in either a continuous statement of comprehensive income or in two separate but consecutive statements. The amendment does not change the items that must be reported in other comprehensive income. This amendment is effective for fiscal years, and interim periods within those years, beginning after December 15, 2013, and early adoption is permitted. The Company opted to present the total of comprehensive income, the components of net income, and the components of other comprehensive income in two separate but consecutive statements. The consolidated financial statements reflect the adoption of this updated guidance.
In January 2013 and December 2011, the FASB issued updated guidance regarding the disclosure of recognized derivative instruments (including bifurcated embedded derivatives), repurchase agreements and securities borrowing/lending transactions that are offset in the statement of financial position or are subject to an enforceable master netting arrangement or similar agreement (irrespective of whether they are offset in the statement of financial position). This new guidance requires an entity to disclose information on both a gross and net basis about instruments and transactions within the scope of this guidance. This new guidance became effective for interim or annual reporting periods that began on or after January 1, 2013, and was applied retrospectively for all comparative periods presented. The disclosures required by this guidance are included in Note 6 –Derivative Instruments and Hedging Activities.
In July 2012, the FASB amended the guidance for testing impairment of indefinite-lived intangible assets. An entity has the option to first assess qualitative factors to determine whether it is more likely than not that an indefinite-lived intangible asset is impaired as a basis for determining whether it is necessary to perform the quantitative impairment test. If an entity determines it is not more likely than not that impairment exists, quantitative impairment testing is not required. However, if an entity concludes otherwise, the impairment test outlined in current guidance is required to be completed. This amended guidance does not change the current requirement that indefinite-lived intangible assets be reviewed for impairment at least annually. This amended guidance was effective January 1, 2013. This amended guidance did not have an impact on the Company’s results of operations or financial position.
F-186
Table of Contents
AVIVA USA AND SUBSIDIARIES
Notes to Consolidated Financial Statements (continued)
(Dollars in thousands, unless otherwise stated)
| 3. | Investments |
Available for Sale Investments
The Company’s investments classified as securities available for sale, with corresponding OTTI impacts for the period then ended, are summarized as follows:
| October 1, 2013 | ||||||||||||||||||||
| Amortized Cost |
Gross Unrealized Gains |
Gross Unrealized Losses |
Fair Value | OTTI Losses recognized in income during the period |
||||||||||||||||
| Fixed maturity securities |
||||||||||||||||||||
| Corporate bonds |
$ | 33,245,245 | $ | 2,475,277 | $ | (493,371) | $ | 35,227,151 | $ | (38,486) | ||||||||||
| U.S. government bonds |
146,749 | 1,910 | (2,744) | 145,915 | — | |||||||||||||||
| State and political subdivisions |
1,751,308 | 149,824 | (30,821) | 1,870,311 | — | |||||||||||||||
| Foreign government bonds |
754,875 | 41,153 | (18,118) | 777,910 | — | |||||||||||||||
| Asset-backed bonds |
95,820 | 1,003 | (164) | 96,659 | — | |||||||||||||||
| Commercial mortgage-backed securities |
3,551,219 | 161,690 | (65,421) | 3,647,488 | (53,548) | |||||||||||||||
| Collateralized mortgage-backed securities |
665,542 | 38,886 | (1,906) | 702,522 | — | |||||||||||||||
| Other debt securities |
98,245 | 11,081 | (7,403) | 101,923 | — | |||||||||||||||
|
|
|
|
|
|
|
|
|
|
|
|||||||||||
| Total fixed maturities available for sale |
40,309,003 | 2,880,824 | (619,948) | 42,569,879 | (92,034) | |||||||||||||||
| Equity securities |
65,304 | — | — | 65,304 | — | |||||||||||||||
| Short-term investments |
17,392 | 1 | (1) | 17,392 | — | |||||||||||||||
|
|
|
|
|
|
|
|
|
|
|
|||||||||||
| Total available for sale securities |
$ | 40,391,699 | $ | 2,880,825 | $ | (619,949) | $ | 42,652,575 | $ | (92,034) | ||||||||||
|
|
|
|
|
|
|
|
|
|
|
|||||||||||
The amortized cost and estimated fair value of investments in available for sale fixed maturity securities at October 1, 2013, are summarized by stated maturity as follows:
| Amortized Cost | Fair Value | |||||||
| Due before 2015 |
$ | 1,051,530 | $ | 1,079,815 | ||||
| Due 2015-2019 |
9,257,832 | 10,165,577 | ||||||
| Due 2020-2024 |
11,497,273 | 11,640,726 | ||||||
| Due after 2024 |
14,189,787 | 15,237,092 | ||||||
| Mortgage-backed securities |
4,312,581 | 4,446,669 | ||||||
|
|
|
|
|
|||||
| Total |
$ | 40,309,003 | $ | 42,569,879 | ||||
|
|
|
|
|
|||||
The above data is based on the stated maturities of the securities. Actual maturities may differ for some securities because borrowers may have the right to call or prepay obligations with or without call or prepayment penalties.
F-187
Table of Contents
AVIVA USA AND SUBSIDIARIES
Notes to Consolidated Financial Statements (continued)
(Dollars in thousands, unless otherwise stated)
At October 1, 2013, investments in fixed maturity securities with a carrying amount of $13,227, were on deposit with state insurance departments to satisfy regulatory requirements.
Proceeds from the sale of available for sale investment securities and respective gross realized gains and losses are as follows:
| Nine months ended October 1, 2013 |
||||
| Available for sale fixed maturity securities: |
||||
| Gross realized gains |
$ | 459,614 | ||
| Gross realized losses |
(44,422) | |||
|
|
|
|||
| Net realized gains |
415,192 | |||
|
|
|
|||
| Equity securities: |
||||
| Gross realized gains |
91 | |||
| Gross realized losses |
(980) | |||
|
|
|
|||
| Net realized (losses) gains |
(889) | |||
|
|
|
|||
| Other investments: |
||||
| Gross realized gains |
24,824 | |||
| Gross realized losses |
(9,317) | |||
|
|
|
|||
| Net realized gains |
15,507 | |||
|
|
|
|||
| Total net realized gains on investment securities |
$ | 429,810 | ||
|
|
|
|||
Proceeds from sales of available for sale fixed maturity securities were $5,110,419 for the nine months ended October 1, 2013. Proceeds from sales of available for sale equity securities were $38,775 for the nine months ended October 1, 2013. Proceeds from sales of available for sale other investments were $1,428,335 for the nine months ended October 1, 2013.
Trading Investments
The following provides detail of the portion of trading gains (losses) that relates to trading securities held at the end of the period:
| Nine months ended October 1, 2013 |
||||
| Gross gain (loss) recognized during the period on trading securities |
$ | 4,440 | ||
| Less: Net gain (loss) recognized during the period on trading securities sold |
14,168 | |||
|
|
|
|||
| Net unrealized gain (loss) recognized during the period on trading securities held |
$ | (9,728) | ||
|
|
|
|||
F-188
Table of Contents
AVIVA USA AND SUBSIDIARIES
Notes to Consolidated Financial Statements (continued)
(Dollars in thousands, unless otherwise stated)
Investment Impairments
Gross unrealized losses on investment securities for which OTTI have not been recognized and the fair values of those securities, aggregated by investment category and length of time individual securities have been in a continuous unrealized loss position at October 1, 2013, were as follows:
| Less than 6 months | 7-12 months | More than 12 months | Total | |||||||||||||||||||||||||||||||||||||||||||||
| Total temporarily impaired securities |
Number of securities |
Fair value | Gross unrealized loss |
Number of securities |
Fair value | Gross unrealized loss |
Number of securities |
Fair value | Gross unrealized loss |
Number of securities |
Fair value | Gross unrealized loss |
||||||||||||||||||||||||||||||||||||
| Fixed maturity securities |
||||||||||||||||||||||||||||||||||||||||||||||||
| Corporate bonds |
2,759 | $ | 9,166,773 | $ | (435,601) | 234 | $ | 498,881 | $ | (56,621) | 6 | $ | 10,803 | $ | (1,149) | 2,999 | $ | 9,676,457 | $ | (493,371) | ||||||||||||||||||||||||||||
| U.S. government bonds |
46 | 79,683 | (2,744) | — | — | — | — | — | — | 46 | 79,683 | (2,744) | ||||||||||||||||||||||||||||||||||||
| State and political subdivisions |
85 | 416,953 | (30,821) | — | — | — | — | — | — | 85 | 416,953 | (30,821) | ||||||||||||||||||||||||||||||||||||
| Foreign government bonds |
119 | 334,398 | (17,989) | 4 | 709 | (129) | — | — | — | 123 | 335,107 | (18,118) | ||||||||||||||||||||||||||||||||||||
| Asset-backed bonds |
57 | 46,841 | (160) | 1 | 1,608 | (4) | — | — | — | 58 | 48,449 | (164) | ||||||||||||||||||||||||||||||||||||
| Commercial mortgage-backed securities |
246 | 1,337,832 | (40,691) | 40 | 190,372 | (19,774) | 4 | 12,116 | (4,956) | 290 | 1,540,320 | (65,421) | ||||||||||||||||||||||||||||||||||||
| Collateralized mortgage-backed securities |
236 | 93,891 | (1,587) | 89 | 3,949 | (219) | 51 | 1,944 | (100) | 376 | 99,784 | (1,906) | ||||||||||||||||||||||||||||||||||||
| Other debt securities |
— | — | — | 1 | 7,554 | (4,446) | 2 | 4,143 | (2,957) | 3 | 11,697 | (7,403) | ||||||||||||||||||||||||||||||||||||
|
|
|
|
|
|
|
|
|
|
|
|
|
|
|
|
|
|
|
|
|
|
|
|
|
|||||||||||||||||||||||||
| Total fixed maturities available for sale |
3,548 | 11,476,371 | (529,593 | ) | 369 | 703,073 | (81,193) | 63 | 29,006 | (9,162) | 3,980 | 12,208,450 | (619,948) | |||||||||||||||||||||||||||||||||||
| Equity securities |
— | — | — | — | — | — | — | — | — | — | — | — | ||||||||||||||||||||||||||||||||||||
| Short-term investments |
7 | 2,391 | (1) | — | — | — | — | — | — | 7 | 2,391 | (1) | ||||||||||||||||||||||||||||||||||||
|
|
|
|
|
|||||||||||||||||||||||||||||||||||||||||||||
| Total |
3,555 | $ | 11,478,762 | $ | (529,594) | 369 | $ | 703,073 | $ | (81,193) | 63 | $ | 29,006 | $ | (9,162) | 3,987 | $ | 12,210,841 | $ | (619,949) | ||||||||||||||||||||||||||||
|
|
|
|
|
|||||||||||||||||||||||||||||||||||||||||||||
F-189
Table of Contents
AVIVA USA AND SUBSIDIARIES
Notes to Consolidated Financial Statements (continued)
(Dollars in thousands, unless otherwise stated)
In concluding the above fixed maturity securities were not other-than-temporarily impaired, management evaluated fixed maturity securities using a three step process to: (1) screen and identify; (2) assess and document; and (3) recommend and approve. In identifying a potential OTTI, all securities that have a fair value less than amortized cost are considered.
Securities in an unrealized loss position and equity method investments are subject to an assessment to determine if impairment is other-than-temporary. Management makes certain assumptions or judgments in its assessment of potentially impaired securities based on information including, but not limited to, the following:
| • | Company descriptions, industry characteristics and trends, company-to-industry profile, quality of management, etc. |
| • | Ability and intent to hold the security for loan-backed and structured securities |
| • | Severity and duration of the impairment |
| • | Industry factors |
| • | Financial factors such as earnings trends, asset quality, liquidity, subsequent events, enterprise valuation, fair value, and volatility |
| • | For loan-backed and structured securities, outputs of cash flow modeling processes to determine the likelihood of loss of principal, including consideration of significant assumptions, such as default and severity rates, and prepayment estimates. |
If management determines the security is other-than-temporarily impaired, it is written down to fair value. The write-down is reviewed and approved by senior management. The difference between amortized cost and fair value is charged to other-than-temporary impairments on fixed maturity securities on the Consolidated Statements of Income. For asset-backed securities, an impairment loss is established if the fair value of the security is less than amortized cost and there is an adverse change in estimated cash flows from the cash flows previously projected. For fixed maturity securities in an unrealized loss position, OTTI is recognized in earnings when it is anticipated the amortized cost will not be recovered. In such situations, the OTTI recognized in earnings is the entire difference between the fixed maturity security’s amortized cost and its estimated fair value only when either (1) the Company has the intent to sell the fixed maturity security; or (2) it is more likely than not the Company will be required to sell the fixed maturity security before recovery. If neither of these two conditions exist, the difference between the amortized cost of the fixed maturity security and the present value of projected future cash flows expected to be collected is recognized as an OTTI in earnings (credit loss). If the estimated fair value is less than the present value of projected future cash flows expected to be collected, this portion of OTTI related to other-than credit factors (noncredit loss) is recorded in other comprehensive income (loss). Adjustments are not made for subsequent recoveries in value.
The Company believes the unrealized losses on fixed maturity securities were generally caused by significantly distressed bond prices due to a prolonged and severe recession of the commercial real estate market, the generic credit market spread widening, and the volatility of financial markets. Based on the diversification of issuers and the weighted average credit quality of the investments, the Company does not anticipate any material defaults in the underlying credits. Financial market improvement and changes in interest rates have led to price improvement on the fixed maturity securities. Since the Company does not intend to sell the securities and believes that it is not likely it will be required to sell the securities before recovery of their amortized cost basis, the securities are not considered to be other-than-temporarily impaired.
F-190
Table of Contents
AVIVA USA AND SUBSIDIARIES
Notes to Consolidated Financial Statements (continued)
(Dollars in thousands, unless otherwise stated)
The following is a rollforward of the amounts recognized in earnings for available for sale debt securities that have been other-than-temporarily impaired because of credit losses which also have OTTI due to noncredit factors:
| Nine months ended October 1, 2013 |
||||
| Cumulative credit loss at the beginning of year |
$ | 152,855 | ||
| Increases attributable to: |
||||
| Credit losses on securities for which OTTI has not previously been recognized |
65,791 | |||
| Additional credit losses on securities for which OTTI has previously been recognized |
26,243 | |||
| Decreases attributable to: |
||||
| Securities sold |
(7,220) | |||
|
|
|
|||
| Cumulative credit loss at end of year |
$ | 237,669 | ||
|
|
|
|||
Investment Income
Major categories of investment income, net of related expenses consists of the following:
| Nine months ended October 1, 2013 |
||||
| Available for sale |
||||
| Fixed maturity securities |
$ | 1,667,375 | ||
| Equity securities |
2,094 | |||
| Short-term investments |
29 | |||
| Trading |
||||
| Fixed maturity securities |
31,237 | |||
| Short-term investments |
97 | |||
| Mortgage loans |
218,375 | |||
| Real estate |
3,209 | |||
| Policy loans |
24,145 | |||
| Other investments |
21,796 | |||
| Cash and cash equivalents |
429 | |||
|
|
|
|||
| Gross investment income |
1,968,786 | |||
| Investment expenses |
(50,400) | |||
|
|
|
|||
| Net investment income |
$ | 1,918,386 | ||
|
|
|
|||
Concentration of Credit Risk – Fixed Maturity Securities
There were no exposures to individual counterparties exceeding 10% of shareholder’s equity at October 1, 2013.
F-191
Table of Contents
AVIVA USA AND SUBSIDIARIES
Notes to Consolidated Financial Statements (continued)
(Dollars in thousands, unless otherwise stated)
| 4. | Fair Value and Equity Method Investments |
Private equity and hedge funds
The Company holds alternative investments, which include private equity funds and hedge funds, carried as equity method investments or at fair value. The Company’s equity method investments are summarized as follows:
| October 1, 2013 | ||||||||||||||||||||||||||||
| Carrying Value | Unrealized Gains |
Unrealized Losses |
Fair Value | |||||||||||||||||||||||||
| Private Equity |
$ | 44,749 | $ | 7,046 | $ | (3,688) | $ | 48,107 | ||||||||||||||||||||
| Hedge Fund |
258,941 | 17,282 | (85) | 276,138 | ||||||||||||||||||||||||
|
|
|
|
|
|
|
|
|
|||||||||||||||||||||
| Total |
$ | 303,690 | $ | 24,328 | $ | (3,773) | $ | 324,245 | ||||||||||||||||||||
|
|
|
|
|
|
|
|
|
|||||||||||||||||||||
The Company’s fair value method investments are summarized as follows:
| October 1, 2013 | ||||
| Private Equity |
$ | 23,882 | ||
| Hedge Fund |
278,154 | |||
|
|
|
|||
| Total |
$ | 302,036 | ||
|
|
|
|||
At October 1, 2013, private equity fund investments are not redeemable during the lives of the funds and have expected remaining lives that extend up to ten years. At that date, 23% of the total above had expected remaining lives of less than three years, 59% between three and seven years, and 18% between seven and ten years. Expected lives are based upon legal maturity, which can be extended at the fund manager’s discretion, typically in one-year increments.
At October 1, 2013, the hedge fund investments may be redeemed monthly, quarterly, semiannually, or annually, depending on the terms of the specific fund. Redemption requires notice of 95 days or less, and some funds are subject to investor level gates and/or lock-up periods. Based upon these factors, as of October 1, 2013, 29% could be liquidated within three months, 59% could be liquidated within six months, 65% could be liquidated within nine months, and 87% could be liquidated within one year.
Variable Interest Entities
Some of the private equity funds and hedge funds the Company invests in are variable interest entities (VIEs). An entity is considered a VIE if (1) it does not have sufficient equity to fund its operations without additional subordinated financial support, (2) a party outside of the equity group at risk has the power to make decisions related to the activity that most significantly impacts the entity’s economic performance, or (3) if substantially all of the activities of the entity are performed by or on behalf of an investor with disproportionately few voting rights.
The Company has determined the cost or equity methods of accounting are appropriate for these entities, it is not required to consolidate these entities, and it is not the primary beneficiary of these entities, during the periods presented because (1) it does not absorb the majority of the economics of the entities, (2) it does not have the
F-192
Table of Contents
AVIVA USA AND SUBSIDIARIES
Notes to Consolidated Financial Statements (continued)
(Dollars in thousands, unless otherwise stated)
ability to direct the activities of the entities, and (3) it does not have the obligation to absorb losses or the right to receive benefits from the entities that could be potentially significant. The maximum exposure to loss associated with the entities is equal to the carrying amounts of the investment in the entity plus unfunded commitments. Unfunded commitments were $45,298 at October 1, 2013. The determination of whether the entities are VIEs applies to 61 entities in 2013. The carrying value of these investments, recognized as part of other investments, was $626,280 at October 1, 2013.
| 5. | Loans |
Commercial Real Estate Mortgage Loans
The Company’s mortgage loan portfolio consists solely of commercial mortgage loans collateralized by the related properties and is diversified as to property type, location, and loan size.
The mortgage loan portfolio is summarized by property type as follows:
| October 1, 2013 | ||||||||
| Property Type | Carrying Value | Percentage | ||||||
| Apartment |
$ | 770,501 | 15% | |||||
| Hotel/Motel |
134,386 | 2% | ||||||
| Industrial |
1,250,213 | 24% | ||||||
| Mixed Use |
199,352 | 4% | ||||||
| Office Building |
1,287,258 | 25% | ||||||
| One-Four Family |
24 | —% | ||||||
| Retail |
1,463,414 | 28% | ||||||
| Other |
104,080 | 2% | ||||||
|
|
|
|
|
|||||
| Total |
$ | 5,209,228 | 100% | |||||
|
|
|
|
|
|||||
The mortgage loan portfolio is summarized by geographic region as follows:
| October 1, 2013 | ||||||||
| Region | Carrying Value | Percentage | ||||||
| East North Central |
$ | 624,004 | 12% | |||||
| East South Central |
87,244 | 2% | ||||||
| Middle Atlantic |
424,602 | 8% | ||||||
| Mountain |
586,069 | 11% | ||||||
| New England |
166,486 | 3% | ||||||
| Pacific |
823,098 | 16% | ||||||
| South Atlantic |
1,295,541 | 25% | ||||||
| West North Central |
414,875 | 8% | ||||||
| West South Central |
787,309 | 15% | ||||||
|
|
|
|
|
|||||
| Total |
$ | 5,209,228 | 100% | |||||
|
|
|
|
|
|||||
F-193
Table of Contents
AVIVA USA AND SUBSIDIARIES
Notes to Consolidated Financial Statements (continued)
(Dollars in thousands, unless otherwise stated)
Interest income on impaired loans is recognized on a cash basis. There was $291 of interest income recognized on impaired loans for the nine months ended October 1, 2013.
The Company did not hold mortgages with interest more than 180 days overdue at October 1, 2013. The average recorded investment in impaired loans during 2013 was $14,802.
Loans that have been restructured, are in foreclosure or are significantly delinquent are valued at the lower of fair value or the current carrying value. The Company held loans classified as delinquent with carrying values of $1,651 at October 1, 2013.
Real estate acquired in satisfaction of debt is accounted for at the lower of the property’s fair value less expected selling costs or the loan balance. The Company holds foreclosed properties of $15,913 at October 1, 2013, and is actively marketing these properties for sale. There were no impairments recorded during 2013. These properties are included within other assets.
The Company primarily evaluates the credit quality of its commercial mortgage loan portfolio based on an internal rating matrix, which also incorporates consideration of debt service coverage in determining the risk profile of a loan.
The following presents loan-to-value information the Company used in determining the credit quality of its commercial mortgage loan portfolio:
| October 1, 2013 | ||||||||
| Carrying Value | Percentage | |||||||
| Less than 70% |
$ | 4,133,440 | 79% | |||||
| 70% - 80% |
875,814 | 17% | ||||||
| 80% - 90% |
103,760 | 2% | ||||||
| 90% - 100% |
82,718 | 2% | ||||||
| Greater than 100% |
13,496 | —% | ||||||
|
|
|
|
|
|||||
| Total Mortgage Loans |
$ | 5,209,228 | 100% | |||||
|
|
|
|
|
|||||
The Company reviews the population of commercial mortgage loans for specific mortgage loan valuation allowances, as well as reviews the population as a whole to determine whether a collective allowance is required, given the homogeneous nature of the loans within the portfolio. A review of historical mortgage loan losses over the past ten years has shown insignificant mortgage loan losses were incurred in 2001 through 2008. Historical trending in commercial mortgage loan losses has shown that loan losses typically occur during economic downturns, such as the credit crisis experienced between 2008 and 2011. The Company expects that commercial mortgage losses will continue to trend downward as the real estate market continues to recover. Losses of $387 were recorded through specific mortgage loan valuation allowances in 2013 and were derived primarily from 2007 and 2008 vintage originations. Based on the historical trending expectations, the Company has determined a collective loan loss allowance is not necessary at October 1, 2013.
F-194
Table of Contents
AVIVA USA AND SUBSIDIARIES
Notes to Consolidated Financial Statements (continued)
(Dollars in thousands, unless otherwise stated)
Aging of commercial real estate mortgage loan principal values is summarized in the following:
| October 1, 2013 | ||||
| Current |
$ | 5,195,071 | ||
| 30-59 Days |
1,644 | |||
| 60-119 Days |
— | |||
| 120 Days and Over |
7 | |||
|
|
|
|||
| Total Principal Balance |
$ | 5,196,722 | ||
|
|
|
|||
Policy Loans
Policy loans represent loans the Company issues to contract holders and which use the cash surrender value of the life insurance policy as collateral. Policy loans are carried at unpaid principal balances. Policy loans are not aged as payments are not required. Furthermore, as the loans are backed by the cash surrender value of the policies, there is minimal risk of impairment.
Agent and Broker Loans
The Company provides loans to its agents and brokers. These loans are not collateralized and, as such, the Company records an allowance related to expected uncollectible loans. The Company recorded outstanding agent and broker loans (net of related allowance) in premium, fees, and other receivables in the amount of $2,740 at October 1, 2013. Details for the change in the allowance for loan losses related to agents and brokers are as follows:
| Nine months ended October 1, 2013 |
||||
| Beginning balance |
$ | 8,808 | ||
| Provision |
1,092 | |||
| Write-offs, net of recoveries |
(1,384) | |||
|
|
|
|||
| Ending balance |
$ | 8,516 | ||
|
|
|
|||
| 6. | Derivative Instruments and Hedging Activities |
The Company is exposed to various risks relating to its ongoing business operations, including interest rate risk, credit risk, and equity market risk. The Company uses a variety of strategies to manage these risks, including the use of derivative instruments. See Note 14 – Fair Value of Financial Instruments for fair value information on derivatives.
Interest Rate Swaps – The Company uses interest rate swaps to reduce market risks from changes in interest rates and to alter interest rate exposure arising from mismatches between assets and liabilities. Under interest rate swaps, the Company agrees with other parties to exchange, at specified intervals, the difference between fixed rate and floating rate interest amounts calculated by reference to an agreed notional principal amount. Generally, no cash is exchanged at the outset of the contract and neither party makes principal payments.
Credit Default Swaps – Credit default swaps provide a measure of protection against the default of an issuer and/or to gain credit exposure to an issuer or traded index. The Company uses credit default swaps coupled with a
F-195
Table of Contents
AVIVA USA AND SUBSIDIARIES
Notes to Consolidated Financial Statements (continued)
(Dollars in thousands, unless otherwise stated)
bond in replication synthetic asset transactions (RSAT) to synthetically create the characteristics of a bond and to hedge credit risk. An RSAT is a synthetic instrument that has a lower cost, is more liquid, or has other advantages relative to the cash market. These transactions provide the Company with a periodic premium to compensate it for accepting credit risk and are used to enhance investment income. Hedging credit risk involves buying protection for existing credit risk. The exposure amount of such agreements, which is usually the notional amount, is equal to the maximum proceeds that must be paid by a counterparty for a defaulted security. Should a credit event occur on a reference entity, a counterparty who sold protection would be required to pay the buyer the net of the trade notional amount less any recovery value of the security.
Credit Default Swaptions – A default swaption is an option to enter into a credit default swap at a specified strike price for a given option maturity. The cost of the option is paid or received at inception. Credit default swaptions may be used to enhance income. This occurs when the Company with an exposure to the underlying credit default swap sells a swaption and collects the cost of the option. Swaptions can also be used to hedge credit risk.
Options – The Company offers fixed indexed products. These contracts credit interest based on certain indices, primarily the S&P 500 Index. Over-the-counter (OTC) option contracts, call options, and call spreads are purchased to hedge the growth in interest credited to the customer as a direct result of increases in the related indices. Upon maturity, the Company will receive the market value of the call option. The parties with whom the Company enters into OTC option contracts are highly rated financial institutions where contracts are supported by collateral, which minimizes the credit risk associated with such contracts.
Futures – Under exchange-traded futures contracts, the Company agrees to purchase a specified number of contracts with other parties and to post variation margin on a daily basis in an amount equal to the difference in the daily market values of those contracts. Futures contracts are purchased to hedge the growth in interest credited to the customer as a direct result of increases in the related indices. The clearing brokers with whom the Company enters into exchange-traded futures are regulated futures commission’s merchants who are members of a trading exchange.
Interest Rate Caps and Floors – The Company purchases interest rate caps and floors to mitigate the asset/liability risks of a significant and sustained increase or decrease, respectively, in interest rates. The parties with whom the Company enters into contracts for caps and floors are highly rated financial institutions where contracts are supported by collateral, which minimizes the credit risk associated with such contracts. The Company pays a premium at the outset of the contract and receives cash payments when rates rise above the strike price on the cap or fall below the strike price on the floor.
Total Rate of Return Swaps – The Company purchases total rate of return swaps to gain exposure and benefit from a reference asset without actually having to own it. Total rate of return swaps are contracts in which one party makes payments based on a set rate, either fixed or variable, while the other party makes payments based on the return of the underlying asset, which includes both the income it generates and any capital gains. The underlying asset is usually an equity index, loan, or bond.
The Company may use additional derivative instruments for hedging or limited income generation purposes.
F-196
Table of Contents
AVIVA USA AND SUBSIDIARIES
Notes to Consolidated Financial Statements (continued)
(Dollars in thousands, unless otherwise stated)
The following presents the types of derivatives and estimated fair values of the Company’s derivative financial instruments, excluding embedded derivatives:
| October 1, 2013 | ||||||||||||
| Notional amount | Fair Value of Assets | Fair Value of Liabilities | ||||||||||
| Equity derivatives: |
||||||||||||
| Call options |
24,514,400 | $ | 1,468,424 | $ | 88,435 | |||||||
| Futures |
1,084,535 | 21,761 | — | |||||||||
| Interest rate derivatives: |
||||||||||||
| Interest rate swaps |
4,759,179 | 10,606 | 85,557 | |||||||||
| Credit derivatives: |
||||||||||||
| Credit default swaps |
10,000 | — | 8,316 | |||||||||
| Total rate of return swaps |
65,000 | — | 11,499 | |||||||||
|
|
|
|
|
|
| |||||||
| Total |
$ | 1,500,791 | $ | 193,807 | ||||||||
|
|
|
|
|
|
| |||||||
The following differentiates between the Company’s derivatives which are designated as hedges and those which are not designated as hedges, excluding embedded derivatives. Derivative assets are included in other investments and derivative liabilities are included in accrued expenses and other liabilities in the Consolidated Balance Sheet.
| October 1, 2013 | ||||||||
| Assets | Liabilities | |||||||
| Derivatives designated as hedges |
||||||||
| Fair value hedges: |
||||||||
| Interest rate swaps |
$ | — | $ | 14,903 | ||||
| Derivatives not designated as hedges |
||||||||
| Equity derivatives: |
||||||||
| Call options |
1,468,424 | 88,435 | ||||||
| Futures |
21,761 | — | ||||||
| Interest rate derivatives: |
||||||||
| Interest rate swaps |
10,606 | 70,654 | ||||||
| Credit derivatives: |
||||||||
| Credit default swaps |
— | 8,316 | ||||||
| Total rate of return swaps |
— | 11,499 | ||||||
|
|
|
|
|
|
| |||
| Total derivatives not designates as hedges |
1,500,791 | 178,904 | ||||||
|
|
|
|
|
|
| |||
| Total derivatives |
$ | 1,500,791 | $ | 193,807 | ||||
|
|
|
|
|
|
| |||
F-197
Table of Contents
AVIVA USA AND SUBSIDIARIES
Notes to Consolidated Financial Statements (continued)
(Dollars in thousands, unless otherwise stated)
The following provides the pre-tax gain (loss) recognized in net income as other realized/unrealized gains (losses) on investments for the effects of derivatives not designated as hedges:
| Nine months ended October 1, 2013 |
||||
| Equity Derivatives: |
||||
| Call options |
$ | 1,049,683 | ||
| Futures |
120,750 | |||
| Interest Rate Derivatives: |
||||
| Interest rate swaps |
(15,003) | |||
| Caps |
— | |||
| Floors |
(95) | |||
| Credit Derivatives: |
||||
| Credit default swaps |
115 | |||
| Total rate of return swaps |
180 | |||
|
|
|
|||
| Total non-designated or non-qualifying derivatives |
$ | 1,155,630 | ||
|
|
|
|||
The following provides the pre-tax gain (loss) recognized in net income as other realized/unrealized gains (losses) on investments for the effects of derivatives designated as hedges:
| Nine months ended October 1, 2013 |
||||
| Fair Value Hedges: |
||||
| Interest rate swaps |
$ | 114,220 | ||
Credit Derivatives
The Company sells protection on one credit default index tranche of 2% – 4%, which has a notional amount of $10,000 and is accounted for as a liability with a fair value of $8,316 at October 1, 2013.
Credit Risk on Freestanding Derivatives
The Company is exposed to credit-related losses in the event of nonperformance by counterparties on derivative instruments. The Company does not anticipate nonperformance by any of these counterparties. Purchasing instruments from financial institutions with high credit ratings minimizes the credit risk associated with such instruments. The amount of exposure is represented by the fair value at the reporting date less any posted collateral. Collateral support documents are negotiated to further reduce this exposure where deemed necessary. Exchange-traded derivatives are effected through a regulated exchange and positions are marked to fair value daily.
The counterparty may be required to post collateral for any derivative contracts that are entered. The amount of collateral that is required is determined by the fair value of the contract and credit threshold of the counterparty.
The current credit exposure of the Company’s derivative contracts is limited to the fair value at the reporting date less collateral held. Credit risk is managed by entering into transactions with creditworthy counterparties and
F-198
Table of Contents
AVIVA USA AND SUBSIDIARIES
Notes to Consolidated Financial Statements (continued)
(Dollars in thousands, unless otherwise stated)
obtaining collateral where appropriate and customary. The Company also attempts to minimize its exposure to credit risk through the use of various credit monitoring techniques. All of the net credit exposure for the Company from derivative contracts is with investment-grade counterparties.
The Company enters into various collateral arrangements, which require both the pledging and accepting of collateral in connection with its OTC derivative instruments. Collateral is recorded as a payable for collateral under securities lending and other transactions within the Company’s Consolidated Balance Sheets. The Company was obligated to return cash collateral under its control of $582,228 at October 1, 2013. This cash collateral is included in cash and cash equivalents or in short-term investments and the obligation to return it is included in payable for collateral under securities lending and other transactions in the Consolidated Balance Sheets. The Company had received collateral consisting of various securities with a fair value of $770,476 at October 1, 2013.
The estimated fair value of the Company’s net derivative and other financial assets and liabilities after the application of master netting agreements and collateral were as follows:
| October 1, 2013 | ||||||||
| Derivatives and other financial instruments subject to a Master Netting Agreement or a similar arrangement |
Assets | Liabilities | ||||||
|
|
|
|
|
|
||||
| Gross estimated fair value: |
||||||||
| Derivatives: |
||||||||
| OTC1 |
$ | 1,479,030 | $ | 197,324 | ||||
| Exchange-traded |
21,761 | — | ||||||
|
|
|
|
|
|||||
| Total gross estimated fair value of derivatives and other financial assets |
1,500,791 | 197,324 | ||||||
| Amounts not subject to a master netting agreement or a similar agreement |
— | — | ||||||
|
|
|
|
|
|||||
| Estimated fair value of derivatives and other financial assets |
1,500,791 | 197,324 | ||||||
| Gross amounts offset in the consolidated balance sheets: |
||||||||
| Gross estimated fair value of OTC derivatives2 |
(158,964) | (158,964) | ||||||
| Collateral of OTC derivatives3 |
(1,320,066) | (38,360) | ||||||
|
|
|
|
|
|||||
| Net amount after application of master netting agreements and collateral |
$ | 21,761 | $ | — | ||||
|
|
|
|
|
|||||
1At October 1, 2013, income or expense accruals on derivative assets reported in accrued investment income or in accrued expenses and other liabilities were $0 and income or expense accruals on derivative liabilities reported in accrued investment income or in accrued expenses were $3,517.
2Estimated fair value of derivatives is limited to the amount subject to offset and includes income or other expense accruals.
3The amount of collateral offset in the above is limited to the net estimated fair value of derivatives and other financial instruments after the application of netting agreements. At October 1, 2013, the Company received no excess collateral and provided no excess collateral.
Certain derivative instruments contain provisions that require the Company to either post additional collateral or immediately settle any outstanding liability balances upon the occurrence of a specified credit-risk related event. Certain of these events are defined by the existing International Swaps and Derivative Association (ISDA) agreements and include downgrades in the credit ratings of the Company and its affiliates. Another credit-risk related contingent feature is a negative credit event on a reference entity of a credit default swap, where Aviva USA has sold protection against default or a ratings downgrade. The fair values of all derivative instruments with credit-risk related contingent features in a net liability position at October 1, 2013, were $34,891. The Company
F-199
Table of Contents
AVIVA USA AND SUBSIDIARIES
Notes to Consolidated Financial Statements (continued)
(Dollars in thousands, unless otherwise stated)
recorded $36,496 as collateral payable for collateral under securities lending and other transactions for these exposures in the normal course of business as of October 1, 2013. Upon the occurrence of an Event of Default or Termination Event as defined in the existing ISDA agreements, the Company would be required to either post an additional collateral or settle the instruments immediately, which was zero as of October 1, 2013. In the event the reference entity listed on a credit default swap defaults where the Company has sold credit protection, the Company would be liable for the notional amount minus any residual value of the reference security. The maximum amount the Company would owe is the notional value, which was $10,000 as of October 1, 2013.
The fair value of the Company’s derivative assets by counterparty and each counterparty’s credit rating are as follows:
| October 1, 2013 | ||||||
| Counterparty |
Carrying Amount | Credit Rating (S&P) | ||||
| Barclays Bank PLC |
$ | 320,684 | A+ | |||
| Citibank NA |
9 | BB- | ||||
| Merrill Lynch International |
3,716 | A- | ||||
| Morgan Stanley |
23,504 | A- | ||||
| Royal Bank of Canada |
141,978 | AA- | ||||
| Societe Generale |
244,356 | A | ||||
| The Bank of New York Mellon |
163,142 | A+ | ||||
| Suntrust Banks Inc |
227,820 | BBB | ||||
| BNP Paribas SA |
375,582 | A+ | ||||
|
|
|
|
||||
| Total |
$ | 1,500,791 | ||||
|
|
|
|
||||
Certain counterparties may have been downgraded subsequent to October 1, 2013. Depending on the terms of the contract, such counterparties may be required to post additional collateral to the Company as a result.
| 7. | Deferred Policy Acquisition Costs and Deferred Sales Inducements |
A rollforward of the DAC and DSI balance is as follows:
| Nine months ended October 1, 2013 |
||||
| Balance at beginning of year |
$ | 2,333,216 | ||
| Cost capitalized |
292,663 | |||
| Costs amortized |
(622,522) | |||
| Impact of unrealized losses (gains) on available for sale securities |
1,757,921 | |||
|
|
|
|||
| Balance at end of year |
$ | 3,761,278 | ||
|
|
|
|||
The impact of unrealized investment gains and losses represents the amount of DAC and DSI that would have been amortized at the balance sheet date if such gains and losses had been recognized.
F-200
Table of Contents
AVIVA USA AND SUBSIDIARIES
Notes to Consolidated Financial Statements (continued)
(Dollars in thousands, unless otherwise stated)
Amortization of DAC in the amount of $374,364 is recorded in amortization of deferred policy acquisition costs and value of business acquired for the nine months ended October 1, 2013. Amortization of DAC relating to commission expense in the amount of $33,353 is recorded in underwriting, acquisition, and other expenses for the nine months ended October 1, 2013.
DSI costs capitalized were $45,484 for the nine months ended October 1, 2013. Amortization of DSI is attributed to the amount of gross margins or profits originating from transactions including realized gains and losses. Amortization of DSI in the amount of $214,805 is recorded in policyowner benefits for the nine months ended October 1, 2013.
| 8. | Value of Business Acquired |
A rollforward of VOBA is as follows:
| Nine months ended October 1, 2013 |
||||
| Balance at beginning of year |
$ | 674,327 | ||
| VOBA amortized |
(146,395) | |||
| Impact of unrealized losses on available for sale securities |
202,241 | |||
|
|
|
|||
| Balance at end of year |
$ | 730,173 | ||
|
|
|
|||
Amortization is recognized in proportion to expected future gross margins or premiums over the life of the policies and is based on the average interest crediting rates, which range from 4.87% to 5.74% for the nine months ended October 1, 2013, and over the next five years. Interest accrued on the unamortized VOBA amounted to $27,976 for the nine months ended October 1, 2013, which is included within VOBA amortization in the preceding table. Unrealized investment gains and losses represent the amount of VOBA that would have been amortized if such gains and losses had been recognized.
| 9. | Property and Equipment |
The cost basis of the property, equipment, and leasehold improvements was $189,824 at October 1, 2013. Accumulated depreciation and amortization of property, equipment, and leasehold improvements was $36,998 at October 1, 2013. Related depreciation and amortization expense was $8,548 for the nine months ended October 1, 2013.
The cost basis of computer software was $99,534 at October 1, 2013, while accumulated amortization of capitalized software was $48,055 at October 1, 2013. Related amortization expense was $10,624 for the nine months ended October 1, 2013.
| 10. | Income Taxes |
The Company’s net current tax liability was $23,169 as of October 1, 2013.
F-201
Table of Contents
AVIVA USA AND SUBSIDIARIES
Notes to Consolidated Financial Statements (continued)
(Dollars in thousands, unless otherwise stated)
The provision for income tax expense consists of the following:
| Nine months ended October 1, 2013 |
||||
| Current |
$ | 70,603 | ||
| Deferred |
254,902 | |||
|
|
|
|||
| Total |
$ | 325,505 | ||
|
|
|
|||
A reconciliation of the differences between the provision for income taxes and the expected tax provision at the U.S federal income tax rate is as follows:
| Nine months ended October 1, 2013 |
||||
| Expected tax provision at U.S. statutory rate |
$ | 338,896 | ||
| (Decrease) increase in income taxes resulting from: |
||||
| Deferred tax valuation allowance |
(21,100) | |||
| Prior year estimate changes |
6,154 | |||
| Corporate owned life insurance |
(1,200) | |||
| Dividend received deduction |
(100) | |||
| Agent meetings, penalties, meals and entertainment, and other |
2,855 | |||
|
|
|
|||
| Total income tax expense |
$ | 325,505 | ||
|
|
|
|||
| Effective tax rate |
33.62% | |||
F-202
Table of Contents
AVIVA USA AND SUBSIDIARIES
Notes to Consolidated Financial Statements (continued)
(Dollars in thousands, unless otherwise stated)
The tax effects of temporary differences that give rise to deferred income tax asset and liabilities is as follows:
| October 1, 2013 | ||||
| Deferred tax assets |
||||
| Reserve valuation differences |
$ | 732,975 | ||
| Reinsurance related assets |
521,414 | |||
| Net operating loss carryforward |
76,276 | |||
| Employee benefit plans |
79,445 | |||
| Other |
284,434 | |||
|
|
|
|||
| Total deferred tax assets |
1,694,544 | |||
| Valuation allowance |
(89,900) | |||
|
|
|
|||
| Net deferred tax asset |
1,604,644 | |||
| Deferred tax liabilities |
||||
| Invested asset valuation differences |
1,889,713 | |||
| Deferred acquisition costs |
493,128 | |||
| Valuation of Business Acquired |
249,442 | |||
| Fixed assets |
35,332 | |||
|
|
|
|||
| Total deferred tax liability |
2,667,615 | |||
|
|
|
|||
| Net deferred tax liability |
$ | 1,062,971 | ||
|
|
|
|||
At October 1, 2013, our gross federal tax net operating loss carryforwards were $217,931 and begin to expire in 2021.
Uncertain tax positions
The Company reviews all subjective tax positions in order to compute its liability for uncertain tax positions. No liability for uncertain tax positions has been recorded as the Company does not have any material items requiring establishment of or disclosure of such a reserve. Interest and penalties associated with uncertain tax positions would be recognized within the income tax expense line of the Consolidated Statements of Income.
The Company files income tax returns in the federal jurisdiction and various state and local jurisdictions. IRS examinations for the Company have been completed for all tax years prior to 2011. The Company protested certain unfavorable adjustments related to tax years 2006 through 2010 and has requested a review by IRS Appeals. The Company does not believe any tax payments resulting from these examinations would materially impact the Company’s effective tax rate or net income.
| 11. | Reinsurance |
The Company has indemnity reinsurance agreements with various companies whereby life insurance in excess of retention limits is reinsured. Insurance in force ceded to nonaffiliated companies under risk sharing arrangements at October 1, 2013, totaled approximately $64.0 billion. The Company has entered into modified coinsurance arrangements to cede between 70% and 90% of certain annuity products. Under these arrangements, the Company transfers the risks and rewards of the business to the assuming company; however, the Company retains the assets and liabilities associated with the business.
F-203
Table of Contents
AVIVA USA AND SUBSIDIARIES
Notes to Consolidated Financial Statements (continued)
(Dollars in thousands, unless otherwise stated)
Information regarding the impact of reinsurance on the Consolidated Statement of Income is as follows:
| Nine months ended October 1, 2013 |
||||
| Direct insurance premiums |
$ | 188,061 | ||
| Reinsurance assumed |
16,952 | |||
| Reinsurance ceded |
(69,745) | |||
|
|
|
|||
| Insurance premiums |
$ | 135,268 | ||
|
|
|
|||
| Nine months ended October 1, 2013 |
||||
| Direct insurance benefits and claims |
$ | 2,376,235 | ||
| Assumed insurance benefits and claims |
12,273 | |||
| Ceded benefits and claims |
(149,234) | |||
|
|
|
|||
| Policyowner benefits |
$ | 2,239,274 | ||
|
|
|
|||
F-204
Table of Contents
AVIVA USA AND SUBSIDIARIES
Notes to Consolidated Financial Statements (continued)
(Dollars in thousands, unless otherwise stated)
| 12. | Closed Blocks |
The Closed Blocks, which are included in the accompanying consolidated financial statements, are presented below on a pre-tax basis and, accordingly, do not include current or deferred taxes. Summarized financial information of the Closed Blocks is as follows:
| Liabilities | October 1, 2013 | |||
| Policy reserves and policyowner funds: |
||||
| Future life and annuity policy benefits |
$ | 2,353,857 | ||
| Policyowner funds |
3,746 | |||
|
|
|
|||
| Total policy reserves and policyowner funds |
2,357,603 | |||
| Accrued expenses and other liabilities |
8,822 | |||
| Dividends payable to policyowners |
117,454 | |||
| Policy and contract claims |
16,035 | |||
| Policyowner dividend obligation |
283,975 | |||
|
|
|
|||
| Total liabilities |
$ | 2,783,889 | ||
|
|
|
|||
F-205
Table of Contents
AVIVA USA AND SUBSIDIARIES
Notes to Consolidated Financial Statements (continued)
(Dollars in thousands, unless otherwise stated)
| Assets |
October 1, 2013 |
|||
| Investments: |
||||
| Available for sale at fair value, fixed maturity securities |
$ | 1,796,343 | ||
| Mortgage loans, net of allowances |
250,754 | |||
| Policy loans at unpaid principal balances |
289,445 | |||
|
|
|
|||
| Total investments |
2,336,542 | |||
| Cash and cash equivalents |
12,426 | |||
| Accrued investment income |
26,684 | |||
| Premium, fees, and other receivables |
21,700 | |||
|
|
|
|||
| Total assets |
2,397,352 | |||
|
|
|
|||
| Maximum future earnings to be recognized from Closed Blocks |
$ | 386,537 | ||
| Change in policyowner dividend obligation |
Nine months ended October 1, 2013 |
|||
| Beginning balance |
$ | 444,490 | ||
| Impact on income before income taxes |
15,007 | |||
| Unrealized investment gains (losses) |
(175,522) | |||
|
|
|
|||
| Ending balance |
$ | 283,975 | ||
|
|
|
|||
| Maximum future earnings from Closed Blocks’ assets
and |
Nine months ended October 1, 2013 |
|||
| Beginning balance |
$ | 393,314 | ||
| Pre-tax contribution from the Closed Blocks |
(20,701) | |||
| Federal income taxes funded by the Closed Blocks |
13,924 | |||
|
|
|
|||
| Ending balance |
$ | 386,537 | ||
|
|
|
|||
F-206
Table of Contents
AVIVA USA AND SUBSIDIARIES
Notes to Consolidated Financial Statements (continued)
(Dollars in thousands, unless otherwise stated)
| Contribution from the Closed Blocks |
Nine months ended October 1, 2013 |
|||
| Revenues |
||||
| Insurance premiums |
$ | 71,996 | ||
| Universal life and annuity product charges |
2,897 | |||
| Net investment income |
90,273 | |||
| Other realized/unrealized gains (losses) on investments |
17,583 | |||
|
|
|
|||
| Total revenues |
182,749 | |||
|
|
|
|||
| Benefits and expenses |
||||
| Policyowner benefits |
108,996 | |||
| Underwriting, acquisition, and other expenses |
844 | |||
| Dividends to policyowners |
52,208 | |||
|
|
|
|||
| Total benefits and expenses |
162,048 | |||
|
|
|
|||
| Contribution from the Closed Blocks before income taxes |
$ | 20,701 | ||
|
|
|
|||
| 13. | Notes Payable |
Borrowings under Credit Agreement – In 2011, the Company refinanced an Amended and Restated Credit Agreement (Credit Agreement) with a syndicate of commercial banks that permitted the Company to borrow up to $350,000. The facility bears interest at variable base rates based on LIBOR plus an applicable margin, with the latter component based on the Company’s credit rating. Under the terms of the Credit Agreement, the Company is required to pay an annual commitment fee ranging from 0.175% to 0.500% of the unused portion of the commitment. As of October 1, 2013, the Company repaid the outstanding balance of $290,000, including interest of $40.
Intergroup borrowings – The Company enters into borrowing arrangements with companies that form part of the Aviva plc group. The Company incurred interest expense of $13,464 during the nine months ended October 1, 2013, in connection with its intergroup borrowings. The interest rate applicable to intergroup borrowings was three month LIBOR plus 1.725% for the nine months ended October 1, 2013. Interest rates were 2.0% in 2013. As of October 1, 2013, the Company repaid in the outstanding balance of $896,000 intergroup borrowings, including interest of $875.
The Company had $2,992,014 available on unused letters of credit related to its reinsurance captives at October 1, 2013.
F-207
Table of Contents
AVIVA USA AND SUBSIDIARIES
Notes to Consolidated Financial Statements (continued)
(Dollars in thousands, unless otherwise stated)
| 14. | Fair Value of Financial Instruments |
Financial Assets and Financial Liabilities
The following sets forth a comparison of the carrying amounts and fair values of the Company’s financial instruments:
| October 1, 2013 | ||||||||
| Carrying Amount |
Fair Value | |||||||
| Assets |
||||||||
| Cash and cash equivalents |
$ | 1,778,071 | $ | 1,778,071 | ||||
| Loans |
||||||||
| Mortgage loans, net of allowances |
5,209,228 | 5,317,810 | ||||||
| Policy loans at unpaid principal balances |
645,160 | 645,160 | ||||||
| Agent/broker loans |
2,740 | 2,740 | ||||||
| Equity securities |
66,669 | 66,669 | ||||||
| Fixed Maturity Securities: |
||||||||
| Available for sale |
||||||||
| Corporate bonds |
35,227,151 | 35,227,151 | ||||||
| US Government bonds |
145,915 | 145,915 | ||||||
| State and political subs |
1,870,311 | 1,870,311 | ||||||
| Foreign Government bonds |
777,910 | 777,910 | ||||||
| Asset backed bonds |
96,659 | 96,659 | ||||||
| Commercial MBS |
3,647,488 | 3,647,488 | ||||||
| Collateralized MBS |
702,522 | 702,522 | ||||||
| Other debt securities |
101,923 | 101,923 | ||||||
| Trading |
||||||||
| Corporate bonds |
697,413 | 697,413 | ||||||
| US Government bonds |
22,676 | 22,676 | ||||||
| State and political subs |
1,484 | 1,484 | ||||||
| Foreign Government bonds |
2,523 | 2,523 | ||||||
| Commercial MBS |
104,319 | 104,319 | ||||||
| Collateralized MBS |
7,275 | 7,275 | ||||||
|
|
|
|
|
|||||
| Total fixed maturity securities |
43,405,569 | 43,405,569 | ||||||
| Separate account assets |
47,906 | 47,906 | ||||||
| Mutual funds |
80,000 | 80,000 | ||||||
| Other investments |
2,205,558 | 2,205,558 | ||||||
|
|
|
|
|
|||||
| 53,440,901 | 53,549,483 | |||||||
|
|
|
|
|
|||||
| Liabilities |
||||||||
| Policyowner funds |
2,863,873 | 3,327,086 | ||||||
| Payable for collateral under securities lending and other transactions |
786,517 | 786,517 | ||||||
| Derivative liabilities |
193,807 | 193,807 | ||||||
| EIA and EIUL embedded derivative liabilities |
4,855,950 | 4,855,950 | ||||||
|
|
|
|
|
|||||
| $ | 8,700,147 | $ | 9,163,360 | |||||
|
|
|
|
|
|||||
F-208
Table of Contents
AVIVA USA AND SUBSIDIARIES
Notes to Consolidated Financial Statements (continued)
(Dollars in thousands, unless otherwise stated)
The methods and assumptions are used to estimate the fair value of financial instruments as follows:
Cash and cash equivalents – Estimated fair value approximates carrying value, due to the short-term nature.
Mortgage loans, net of allowances – Mortgage loans are comprised of commercial mortgage loans, which are originated for investment purposes and primarily carried at amortized cost. Mortgage loans in effective hedging relationships are carried at fair value. For mortgage loans in hedging relationships and for mortgage loans carried at amortized cost, estimated fair value was primarily determined by estimating expected future cash flows and discounting the loans using current interest rates for similar mortgage loans with similar credit risk.
Policy loans at unpaid principal balances – The fair value of policy loans is reflected as being equal to the carrying value of the loans. Policy loans are collateralized by the cash surrender value of the associated insurance contracts.
Agent/broker loans – The estimated fair value for agent and broker loans approximates carrying value due to the short-term nature of these obligations.
Policyowner funds – The estimated fair values of the policyowner funds are determined by using a discounted cash flow analyses based on current interest rates, including non-performance risk, being offered for similar funds.
Payable for collateral under securities lending and other transactions – The estimated fair value for payables for collateral under securities lending and other transactions approximates carrying value. The related agreements to loan securities are short-term in nature such that the Company believes there is limited risk of a material change in market interest rates.
Mutual funds – Mutual funds include investments held as support for the Company’s deferred compensation plans. These assets include investments in funds such as American Funds Growth Fund, Guaranteed Income Fund, PIMCO Total Return (Class D), Vanguard Index Trust 500 Portfolio, and Vanguard Wellington Fund. The investments are recorded at fair value, as reported by the investment administrator.
Other investments – Other investments include derivative assets, trade receivables, and other investments for which carrying value approximates fair value.
F-209
Table of Contents
AVIVA USA AND SUBSIDIARIES
Notes to Consolidated Financial Statements (continued)
(Dollars in thousands, unless otherwise stated)
The Company’s assets and liabilities which are measured at fair value on a recurring basis are presented below based on the fair value hierarchy levels:
| October 1, 2013 |
Total Fair Value | Quoted Prices in Active Markets (Level 1) |
Significant Other Observable Inputs (Level 2) |
Significant Unobservable Inputs (Level 3) |
||||||||||||
| Assets |
||||||||||||||||
| Cash and cash equivalents |
$ | 1,778,071 | $ | 1,778,071 | $ | — | $ | — | ||||||||
| Equity securities |
66,669 | 1,365 | 65,304 | — | ||||||||||||
| Short term investments |
22,287 | — | 22,287 | — | ||||||||||||
| Fixed maturity securities |
||||||||||||||||
| Available for Sale |
||||||||||||||||
| Corporate bonds |
35,227,151 | — | 34,865,538 | 361,613 | ||||||||||||
| US Government bonds |
145,915 | 114,254 | 31,661 | — | ||||||||||||
| State and political subs |
1,870,311 | — | 1,870,311 | — | ||||||||||||
| Foreign Government bonds |
777,910 | — | 777,910 | — | ||||||||||||
| Asset backed bonds |
96,659 | — | 96,659 | — | ||||||||||||
| Commercial MBS |
3,647,488 | — | 3,647,488 | — | ||||||||||||
| Collateralized MBS |
702,522 | — | 702,522 | — | ||||||||||||
| Other debt securities |
101,923 | — | 101,923 | — | ||||||||||||
|
|
|
|
|
|
|
|
|
|||||||||
| 42,569,879 | 114,254 | 42,094,012 | 361,613 | |||||||||||||
|
|
|
|
|
|
|
|
|
|||||||||
| Trading |
||||||||||||||||
| Corporate bonds |
697,413 | — | 697,413 | — | ||||||||||||
| US Government bonds |
22,676 | 22,676 | — | — | ||||||||||||
| State and political subs |
1,484 | — | 1,484 | — | ||||||||||||
| Foreign Government bonds |
2,523 | — | 2,523 | — | ||||||||||||
| Commercial MBS |
104,319 | — | 104,319 | — | ||||||||||||
| Collateralized MBS |
7,275 | — | 7,275 | — | ||||||||||||
|
|
|
|
|
|
|
|
|
|||||||||
| 835,690 | 22,676 | 813,014 | — | |||||||||||||
|
|
|
|
|
|
|
|
|
|||||||||
| Total fixed maturity securities |
43,405,569 | 136,930 | 42,907,026 | 361,613 | ||||||||||||
| Separate account assets |
47,906 | — | 47,906 | — | ||||||||||||
| Mutual funds |
80,000 | — | 80,000 | — | ||||||||||||
| Other investments |
2,205,558 | 27,785 | 1,479,333 | 698,440 | ||||||||||||
|
|
|
|
|
|
|
|
|
|||||||||
| Total assets |
47,606,060 | 1,944,151 | 44,601,856 | 1,060,053 | ||||||||||||
|
|
|
|
|
|
|
|
|
|||||||||
| Liabilities |
||||||||||||||||
| Policyowner funds |
1,003,334 | — | 660,565 | 342,769 | ||||||||||||
| Derivative liabilities |
193,807 | — | 174,044 | 19,763 | ||||||||||||
| EIA and EIUL embedded derivative liabilities |
4,855,950 | — | — | 4,855,950 | ||||||||||||
|
|
|
|
|
|
|
|
|
|||||||||
| Total liabilities |
$ | 6,053,091 | $ | — | $ | 834,609 | $ | 5,218,482 | ||||||||
|
|
|
|
|
|
|
|
|
|||||||||
F-210
Table of Contents
AVIVA USA AND SUBSIDIARIES
Notes to Consolidated Financial Statements (continued)
(Dollars in thousands, unless otherwise stated)
Methods and Assumptions Used in Estimating Fair Values
The following methods and assumptions were used in estimating the fair values of financial instruments during the periods presented in these consolidated financial statements. The Company uses independent pricing services as well as internally developed models to estimate the fair value of its financial instruments, when available.
Fixed Maturity Securities and Equity Securities – The fair values of fixed maturity securities and equity securities in an active and orderly market are determined using independent pricing services. The independent pricing services incorporate a variety of observable market data in their valuation techniques including reported trading prices, benchmark yields, broker-dealer quotes, benchmark securities, bids and offers, credit ratings, relative credit information, and other reference data.
The independent pricing services also take into account perceived market movements and sector conditions, as well as a security’s terms and conditions, including any features specific to that issue that may influence risk and marketability. Depending on the security, the priority of the use of observable market inputs may change as some observable market inputs may not be relevant or additional inputs may be necessary.
The independent pricing services provide quoted market prices when available. Quoted prices are not always available due to market inactivity. When quoted market prices are not available, the third parties use yield data and other factors relating to instruments or securities with similar characteristics to determine fair value for securities that are not actively traded. The Company generally obtains one value from its primary external pricing service. In situations where a price is not available from this service, further quotes or prices from additional parties may be obtained as needed. Valuations and quotes obtained from third-party commercial pricing services are nonbinding and do not represent quotes to execute the disposition of the assets.
Management undergoes a process to internally validate prices received from third parties. The Company validates external valuations regularly through a combination of procedures that include the evaluation of methodologies used by the pricing services, analytical reviews, performance analysis of the prices against trends, and maintenance of a securities watch list. Additionally, as needed, the Company uses discounted cash flow models or performs internal validations of inputs and assumptions similar to those used by the pricing services. Although differences are identified from time to time as a result of these validation procedures, the Company typically does not adjust quotes or prices obtained from counterparties, brokers, or pricing services. Upon identification of a difference from a counterparty source, the Company may participate in a challenge process in order to challenge the counterparty’s price. From time to time, the counterparty will update its quote based on the outcome of this challenge process.
The Company obtains broker quotes for certain corporate debt securities, and no information regarding the observability of inputs is provided by the brokers. For the majority of investments priced by a broker, the quoted price is validated using an internal model, which may utilize observable inputs to validate the broker price.
The Company also obtains pricing for certain debt securities from a third-party pricing source that provides a consensus valuation by polling banks and trading desks of market makers in these instruments. The collection of quotes is adjusted to remove outliers and stale information. These inputs represent prices at which banks are holding the instruments in their trading portfolios but do not necessarily represent executable quotes or observable prices.
The Company holds certain interest-only CMBS (I/O CMBS) investments for which no marketplace information is observed besides broker prices. A third-party pricing source is used to provide independent valuations of
F-211
Table of Contents
AVIVA USA AND SUBSIDIARIES
Notes to Consolidated Financial Statements (continued)
(Dollars in thousands, unless otherwise stated)
securities through various techniques using a proprietary prepayment model that produces prepayment projections based on rates, seasoning, seasonality, and exposure to refinancing. An option adjusted model is used to project collateral-specific prepayment rates and future interest rates.
U.S. Treasury Securities – Evaluations of U.S. Treasury securities are based on prices obtained from electronic trading platforms. The electronic trading platform provides independent, real-time price information from trading activity in the market, sourced from market makers, dealers, and brokers. Feeds from multiple live data sources are obtained for evaluation. Based on the activity and liquidity of the U.S. Treasury market, differences generally do not exist between pricing information provided by the various sources. Evaluations are based on observable inputs from active markets.
Foreign Government Bonds – Foreign government bonds are valued by a third-party pricing source using proprietary valuation models based on the discounted cash flow method, incorporating option-adjusted spread (OAS) features as applicable. The basis for the valuation consists of benchmark curves for the various markets, which are inputs into the creation of applicable constant maturity curves, using industry-accepted interpolation techniques to infer points on the curve that may be lacking based on a lack of benchmark issues. The credit spread applicable to each issuer and issue is based on observations by the evaluators of primary and secondary market activity as well as real-time news and market events. In cases of less actively traded issuers or issuers where there is a lack of recent trades or prices from the major dealers, a third-party pricing source bases the determination of credit spreads on more frequently traded credits with comparable attributes. After deriving the relevant yield curves, the third-party pricing source projects principal and interest cash flows, either based on contract terms for fixed-rate bonds or based on yield curves and rates at each reset date. The cash flows are discounted to present value using the relevant issue yield curves. The third-party pricing source’s evaluation models and analytical tools are specifically designed to enable the third-party pricing source to value a range of fixed income asset types and structures, including hard-to-value, thinly traded instruments, and are based on observable inputs in active markets.
U.S. Corporate Securities – Investment Grade – A third-party pricing source’s evaluations of high-grade U.S. corporate debt securities are based on the application of credit spreads to the U.S. Treasury curve, resulting in a specific yield for the unique issuer and security maturity, up to 40 years. The U.S. Treasury curve is obtained as of the end of the trading day and is an observable input over the maturities applicable to the portfolio. With the exception of certain bonds maturing after 2053, all of the Company’s corporate bonds mature within 40 years. For those securities that mature after 2053, a third-party pricing source prices them based on a benchmark as of the first call date, using an observable interest rate (such as LIBOR), and adding a premium using the actual number of days in each period divided by 365. Issuer-specific credit spreads are determined by the third-party pricing source based on observable market transactions and new issue activity. In addition, the third-party pricing source applies an OAS model to adjust the spreads for issues with optionality features (e.g., early redemption). The third-party pricing source’s evaluations are based on observable inputs from active markets.
Private Placements – Prices for private placement securities are priced on a quarterly basis by a third-party pricing source using public or private proxies when available.
Provincial Bonds – Prices for provincial bonds are obtained from a third-party pricing source. Valuation information for Canadian dollar denominated securities is provided to the third-party pricing source by a separate third party, who obtains its data from two primary sources: (1) market maker bids from Royal Bank of Canada/Dominion Securities and (2) market maker bids from Wood Gundy traders. Prices obtained by the third-party pricing source are validated by obtaining information regarding the specific valuation inputs used to value a
F-212
Table of Contents
AVIVA USA AND SUBSIDIARIES
Notes to Consolidated Financial Statements (continued)
(Dollars in thousands, unless otherwise stated)
sample of securities, and verifying that the observability of the valuation inputs for the sample of securities is consistent with the valuation input levels assigned to the respective investments.
State/Municipal Bonds – Prices for state and municipal bonds are obtained from two separate third-party pricing sources. Prices obtained by the first third-party pricing source are validated by obtaining information regarding the specific valuation inputs used to value a sample of securities. The Company verifies that the observability of the specific valuation inputs used by the third-party pricing source to value the sample of securities is consistent with the valuation input level assigned to the respective investments. The second third-party pricing source uses a number of inputs in determining the fair value pricing. Their process involves the use of public and private comparables (recent trades, new issues, etc.). From these comparables, adjustments are made to the spread to make the value comparable to the security being priced. In determining the final price, certain issue and issuer-specific variables are also taken into consideration.
Derivative Instruments – For the majority of its derivative portfolio, the Company obtains prices from the derivative counterparties and corroborates these prices using internal models. The internal models are based on observable inputs to the extent practicable. Both counterparty risk and own-credit risk are considered, but the presence of collateral mitigates any counterparty or own nonperformance risk related to the derivatives. Nonstandard swaps are priced using base correlations in the Company’s internal model, which are unobservable inputs. Hedge fund values are reported by the fund administrator and are an unobservable input. Futures are priced based on active trades on the Chicago Board of Trade or Chicago Mercantile Exchange, which are observable inputs.
For the nonstandard swaps, broker quotes are obtained from the counterparty and compared to an internal model. The swaps have unobservable base correlations that are extrapolated by looking at traded index tranches. In addition to the unobservable inputs, the internal model uses rates obtained from Bloomberg and CDS curves/recoveries from Fitch. The hedge fund total return swaps are priced as the difference between the face value of the swap and the hedge fund value reported by the fund administrator. Hedge fund values as reported by the fund administrator are unobservable inputs.
The Company’s total return swaps are priced by taking the difference between the face value of the swap and the hedge fund value reported by the fund administrator. Additionally, hedge fund total return swaps are priced as the difference between the face value of the swap and the hedge fund value reported by the fund administrator. The Company does not receive information regarding the fund administrator’s assumptions.
Indexed Annuity Policy and Fixed Indexed Universal Life Liabilities – The Company estimates the fair value of the embedded derivative component of its fixed index annuity policy and equity indexed universal life liabilities at each valuation date by (1) projecting policy contract values and minimum guaranteed contract values over the expected lives of the contracts and (2) discounting the future claims at the applicable risk free interest rates adjusted for nonperformance risk related to those liabilities. The projections of policy contract values are based on the Company’s best estimate assumptions for future policy growth and future policy decrements. The Company’s best estimate assumptions for future policy growth include assumptions for the expected index credit on the next policy anniversary date, which are derived from the fair values of the underlying call options purchased to fund such index credits and the expected costs of annual call options that the Company will purchase in the future to fund index credits beyond the next policy anniversary. The projections of minimum guaranteed contract values include the same best estimate assumptions for policy decrements as were used to project policy contract values.
F-213
Table of Contents
AVIVA USA AND SUBSIDIARIES
Notes to Consolidated Financial Statements (continued)
(Dollars in thousands, unless otherwise stated)
Level 3 Reconciliation
The following provides a reconciliation of the beginning and ending balances for the Company’s Level 3 assets, which are measured at fair value on a recurring basis using significant unobservable inputs:
| Level 3 Assets | Nine months ended October 1, 2013 |
|||
| Beginning balance |
$ | 912,081 | ||
| Impairment losses |
(1,187) | |||
| Purchases |
291,708 | |||
| Disposals |
(179,436) | |||
| Transfers in to Level 3 |
— | |||
| Transfers out of Level 3 |
— | |||
| Net recognized gains (losses) in income statement |
6,951 | |||
| Net recognized gains (losses) in investment valuation reserve |
29,936 | |||
|
|
|
|||
| Ending balance |
1,060,053 | |||
|
|
|
|||
The following provides a reconciliation of the beginning and ending balances for the Company’s Level 3 liabilities, which are measured at fair value on a recurring basis using significant unobservable inputs:
| Level 3 Liabilities | Nine months ended October 1, 2013 |
|||
| Policyowner funds |
||||
| Beginning balance |
$ | 322,347 | ||
| Issuances |
20,422 | |||
| Net recognized (gains) losses in income statement |
— | |||
|
|
|
|||
| Ending balance |
342,769 | |||
|
|
|
|||
| Derivative liabilities |
||||
| Beginning balance |
20,737 | |||
| Purchases |
— | |||
| Disposals |
— | |||
| Net recognized (gains) losses in income statement |
(974) | |||
|
|
|
|||
| Ending balance |
19,763 | |||
|
|
|
|||
| EIA and EIUL embedded derivative liabilities |
||||
| Beginning balance |
4,552,979 | |||
| Purchases |
178,338 | |||
| Disposals |
(162,038) | |||
| Net recognized (gains) losses in income statement |
286,671 | |||
|
|
|
|||
| Ending balance |
$ | 4,855,950 | ||
|
|
|
|||
F-214
Table of Contents
AVIVA USA AND SUBSIDIARIES
Notes to Consolidated Financial Statements (continued)
(Dollars in thousands, unless otherwise stated)
The following summarizes changes in unrealized gains (losses) included in net income related to financial instruments carried at fair value and classified within Level 3, held at the end of each period:
| Nine months ended October 1, 2013 |
||||
| Investments: |
||||
| Debt |
$ | — | ||
| I/O CMBS |
(2,203) | |||
| Derivative liabilities |
974 | |||
|
|
|
|||
| Total |
$ | (1,229) | ||
|
|
|
|||
Transfers between Levels
Transfers between fair value hierarchy levels are recognized at the end of the period in which the transfer occurs. The Company regularly reviews the fair value levels assigned to its investments on a security-by-security basis, and continually evaluates whether information based on changing market conditions and new information available related to specific securities would warrant a transfer from one level within the fair value hierarchy to another.
In 2013, there were no transfers between levels.
Financial Instruments Not Held at Fair Value on the Consolidated Balance Sheets
The following represents the Company’s financial instruments not held at fair value:
| October 1, 2013 |
||||||||||||
| Fair Value Level |
Carrying Amount |
Fair Value | ||||||||||
| Assets |
||||||||||||
| Mortgage loans, net of allowances |
3 | $ | 5,209,228 | $ | 5,317,810 | |||||||
| Policy loans at unpaid principal balances |
2 | 645,160 | 645,160 | |||||||||
| Agent/broker loans |
2 | 2,740 | 2,740 | |||||||||
|
|
|
|
|
|||||||||
| Total assets not measured at fair value |
5,857,128 | 5,965,710 | ||||||||||
|
|
|
|
|
|||||||||
| Liabilities |
||||||||||||
| Policyowner funds |
3 | 1,860,539 | 2,323,752 | |||||||||
| Payable for collateral under securities lending and other transactions |
2 | 786,517 | 786,517 | |||||||||
| Notes payable |
||||||||||||
|
|
|
|
|
|||||||||
| Total liabilities not measured at fair value |
$ | 2,647,056 | $ | 3,110,269 | ||||||||
|
|
|
|
|
|||||||||
We estimate the fair value for financial instruments not carried at fair value using the same methods and assumptions as those we do carry at fair value. The financial instruments presented above are reported at carrying
F-215
Table of Contents
AVIVA USA AND SUBSIDIARIES
Notes to Consolidated Financial Statements (continued)
(Dollars in thousands, unless otherwise stated)
value on the consolidated balance sheets; however, in some cases, the carrying amount approximates or equals fair value.
In cases where quoted market prices are not available, fair values are based on estimates using present value or other valuation techniques. Those techniques are significantly affected by the assumptions used, including the discount rate and estimates of future cash flows. In that regard, the derived fair values estimates, in many cases, could not be realized in immediate settlement of the instrument.
Authoritative guidance excludes certain financial instruments, including insurance contracts and all nonfinancial instruments from its disclosure requirements.
Fair value estimates are made at a specific point in time, based on available market information and judgments about various financial instruments, such as estimates of timing and amounts of future cash flows. Such estimates do not reflect any premium or discount that could result from offering for sale at one time the Company’s entire holdings of a particular financial instrument, nor do they consider the tax impact of the realization of unrealized capital gains (losses). In many cases, the fair value estimates cannot be substantiated by comparison to independent markets, nor can the disclosed value be realized in immediate settlement of the instruments. In evaluating the Company’s management of interest rate, price and liquidity risks, the fair values of all assets and liabilities should be taken into consideration, not only those presented above.
| 15. | Shareholder’s Equity |
Generally, dividends from the Company’s insurance subsidiaries during any year may not be paid, without prior regulatory approval, in excess of the greater of (1) ten percent of the insurance subsidiaries’ statutory paid in capital and unassigned surplus as of the preceding December 31, or (2) the insurance subsidiaries’ statutory gain from operations before net realized capital gains on investments for the preceding year, which equates to $533,087 at October 1, 2013. The Company is primarily dependent on dividends from its insurance subsidiaries to pay dividends to its parent.
Management approved a plan to redeem 84 shares of its capital stock from Aviva plc for $1.0 billion. This redemption is part of the sale to AHL.
| 16. | Share-Based Compensation |
The Company has share-based compensation plans where the Company grants awards of phantom shares of Aviva plc (Awards) to officers and key employees. The phantom shares are units used to calculate the cash payment due at the end of the performance period. They do not transfer ownership, provide for equity purchase options, or in any way grant rights associated with common stock ownership, including voting rights or dividend rights. The Company has only granted Awards that can be settled in cash at the vesting date. The plan authorizes the Company to grant a number of phantom shares equal to a predetermined percentage of the recipient’s annual base income. These are granted based on the grant-date share price of Aviva plc 25p ordinary stock, and the grant-date U.S. dollar exchange rate. All Awards have multi-year performance periods and quantifiable performance goals, which determine final vesting percentages and related cash payouts. The shares are classified as liability awards. The fair value of the Awards is amortized over the vesting performance periods. The unamortized balance of the Awards is remeasured at period end and amortization is adjusted accordingly.
The weighted average grant-date fair value of Awards granted during the nine months ended October 1, 2013, was $4.73. The total cash value of Awards vested and paid during the nine months ended October 1, 2013, was $8,100. Total compensation costs amounted to $(281) for the nine months ended October 1, 2013.
F-216
Table of Contents
AVIVA USA AND SUBSIDIARIES
Notes to Consolidated Financial Statements (continued)
(Dollars in thousands, unless otherwise stated)
At October 1, 2013, there is no unrecognized compensation cost related to unvested Awards granted under the plan.
The following represents a summary of the activity for the phantom share Awards:
| Number of Phantom Shares |
Weighted Average Remaining Vesting Term (in Years) |
|||||||
| Unvested at December 31, 2012 |
2,273,384 | 1.75 | ||||||
| Granted (2013 Award - 3 year vest) |
491,316 | — | ||||||
| Vested |
(1,018,115) | — | ||||||
| Forfeited or expired |
(1,746,585) | — | ||||||
|
|
|
|
|
|||||
| Unvested at October 1, 2013 |
— | — | ||||||
|
|
|
|
|
|||||
| 17. | Commitments and Contingencies |
At October 1, 2013, the Company has commitments to extend credit for commercial mortgages totaling $41,400. The Company also makes commitments to fund private equity investments in the normal course of business. The amounts of these unfunded commitments were $45,298 at October 1, 2013.
The Company leases office space under various operating leases with terms through 2022. Rental expense for operating leases amounted to $3,720 for the nine months ended October 1, 2013. At October 1, 2013, the future minimum aggregate rental commitments and sublease income were as follows:
| Rental Commitments |
Sublease Income |
|||||||
| Remainder of 2013 |
$ | 2,852 | $ | 1,007 | ||||
| 2014 |
11,437 | 4,033 | ||||||
| 2015 |
10,730 | 3,588 | ||||||
| 2016 |
10,857 | 3,532 | ||||||
| 2017 |
8,031 | 2,603 | ||||||
| Thereafter |
18,225 | 7,436 | ||||||
|
|
|
|
|
|||||
| $ | 62,132 | $ | 22,199 | |||||
|
|
|
|
|
|||||
The Company is routinely involved in litigation and other proceedings, including class actions, reinsurance claims, and regulatory proceedings arising in the ordinary course of its business. In recent years, the life insurance industry, including the Company, has been subject to an increase in litigation pursued on behalf of both individual and purported classes of insurance purchasers, questioning the conduct of insurers and their agents in the marketing of their products. In addition, state and federal regulatory bodies, such as state insurance departments and attorneys general, periodically make inquiries and conduct examinations concerning compliance by the Company and others with applicable insurance and other laws. The Company responds to such inquiries and cooperates with regulatory examinations in the ordinary course of business. At present, no contingencies related to pending litigation and regulatory matters are considered material in relation to the financial position of the Company.
As of October 1, 2013, the Company had three and 19 synthetic GICs outstanding with a notional amount of $1,194 and $4,568, respectively. Under the terms of the synthetic GICs, the Company has provided a guarantee,
F-217
Table of Contents
AVIVA USA AND SUBSIDIARIES
Notes to Consolidated Financial Statements (continued)
(Dollars in thousands, unless otherwise stated)
to the contract holder, to cover any fair value shortfalls on a book value payout for a specific contract in return for which the contract holder pays a premium. At October 1, 2013, there was no liability associated with such contracts.
| 18. | Accumulated Other Comprehensive Income |
The following is a detail of AOCI:
| Nine months ended October 1, 2013 |
||||
| Available for sale securities |
$ | 2,201,818 | ||
| DAC, DSI, and VOBA adjustment on available for sale securities |
(1,072,427) | |||
| Noncredit component of other-than-temporary impairment losses on available for sale securities |
(39,579) | |||
|
|
|
|||
| Accumulated other comprehensive income, before taxes |
1,089,812 | |||
| Deferred income tax liability |
(381,434) | |||
|
|
|
|||
| Accumulated other comprehensive income |
$ | 708,378 | ||
|
|
|
|||
Changes in AOCI are presented below.
| Nine months ended October 1, 2013 | ||||||||||||
| Before tax amount |
Tax (expense) benefit |
After tax amount |
||||||||||
| Unrealized gains (loss) on available for sale securities |
||||||||||||
| Unrealized holding gains (losses) arising during the period |
$ | (2,658,507) | $ | 930,478 | $ | (1,728,029) | ||||||
| Change in DAC, DSI, and VOBA |
2,363,949 | (827,382) | 1,536,567 | |||||||||
| Less: Reclassification adjustment for net (loss) gains realized in net income1 |
415,192 | (145,317) | 269,875 | |||||||||
|
|
|
|
|
|
|
|||||||
| Changes in unrealized (loss) gains on investments, available for sale |
(709,750) | 248,413 | (461,337) | |||||||||
|
|
|
|
|
|
|
|||||||
| Noncredit component of the other-than-temporary impairment losses on available for sale securities |
||||||||||||
| Noncredit component of other-than-temporary impairment losses on available for sale securities recognized during the period |
— | — | — | |||||||||
| Less: Reclassification adjustment for net (loss) gains realized in net income1 |
(9,828) | 3,440 | (6,388) | |||||||||
|
|
|
|
|
|
|
|||||||
| Changes in noncredit component of the other-than-temporary impairments |
9,828 | (3,440) | 6,388 | |||||||||
|
|
|
|
|
|
|
|||||||
| Change in AOCI |
$ | (699,922) | $ | 244,973 | $ | (454,949) | ||||||
|
|
|
|
|
|
|
|||||||
1 Recognized in other realized/unrealized gains (losses) on investments on the consolidated statements of income
F-218
Table of Contents
AVIVA USA AND SUBSIDIARIES
Notes to Consolidated Financial Statements (continued)
(Dollars in thousands, unless otherwise stated)
| 19. | Statutory Accounting Practices |
The Company files financial statements prepared in accordance with statutory accounting practices prescribed or permitted by domestic and foreign insurance regulatory authorities.
The Company’s insurance subsidiaries had statutory net income of $436.9 million for the nine months ended October 1, 2013. The Company’s insurance subsidiaries’ statutory surplus and capital was $3.4 billion at October 1, 2013. The minimum capital and surplus requirements are met in all the states in which the insurance subsidiaries are domiciled.
The Company’s insurance subsidiaries are domiciled in the States of Iowa, Vermont, and New York and prepare their statutory-basis financial statements in accordance with accounting practices prescribed or permitted by those respective state insurance departments. The National Association of Insurance Commissioners (NAIC) has codified statutory accounting practices, which have been adopted by each of these states as a component of their accounting practices prescribed or permitted. The States of Vermont and Iowa separately maintain prescribed practices to recognize as admitted assets the letters of credit and contingent notes, respectively, used to fund captive reinsurance entity’s reinsurance obligations to a ceding company.
The respective insurance departments impose minimum risk-based capital (RBC) requirements on insurance enterprises that were developed by the NAIC. The formulas for determining the amount of RBC specify various weighting factors that are applied to financial balances or various levels of activity based on the perceived degree of risk. Regulatory compliance is determined by a ratio of the enterprise’s regulatory total adjusted capital, to its authorized control level RBC. The Company’s life insurance subsidiaries exceed the authorized control level RBC requirements. Following this permitted practice allows the Company to stay within the authorized control level risk based capital requirements.
| 20. | Subsequent Events |
Effective October 2, 2013, pursuant to a stock purchase agreement, dated as of December 21, 2012 (as amended from time to time), between Aviva plc and AHL, AHL acquired 100% of the issued and outstanding capital stock of Aviva USA Corporation, and thereby acquired control of certain of Aviva plc’s U.S.-domiciled subsidiaries, including, but not limited to, the Company. The total purchase price was $529 million.
On June 12, 2015, a putative class action complaint was filed in the United States District Court, Northern District of California against the Company, AHL, AAM, and AGM. The complaint, which is analogous to complaints recently filed against other large insurance companies, primarily alleges that captive reinsurance and other transactions had the effect of misrepresenting the financial condition of AAIA. The suit asserts claims of violation of the Racketeer Influenced and Corrupt Organizations Act and seeks compensatory damages, trebled, in an amount to be determined. The Company, AHL, AAM, and AGM, together believe the allegations are unfounded and that they have meritorious defenses to the claims set forth in the complaint and intend to vigorously defend the litigation. In light of the inherent uncertainties involved in this matter, reasonably possible losses, if any, cannot be estimated at this time.
On July 27, 2015, a putative class action complaint was filed in the United States District Court, District of Massachusetts, against the Company’s Iowa domiciled insurance subsidiary and AHL. An amended complaint was filed on December 18, 2015. The complaint alleges a putative class action on behalf of all persons who are the beneficial owners of assets which were used to purchase structured settlement annuities that Aviva or its predecessors delivered to purchasers on or after April 1, 2003. The complaint alleges the Aviva entities (Aviva
F-219
Table of Contents
AVIVA USA AND SUBSIDIARIES
Notes to Consolidated Financial Statements (continued)
(Dollars in thousands, unless otherwise stated)
London Assignment Corporation, Aviva Life Insurance Company, and CGU International Insurance, plc) sold structured settlement annuities to the public on the basis that they were backed by a capital maintenance agreement by CGU International Insurance, plc, which was alleged as a source of great financial strength. The complaint further alleges that the Aviva entities used this capital maintenance agreement to enhance the sales volume and raise the price of the annuities. The complaint claims that, as a result of Aviva’s sale to AHL, the capital maintenance agreement terminated. According to the complaint, no notice was provided to the owners of the structured settlement annuities, and the termination of the capital maintenance agreement creates a breach of contract and other causes of action. The Company believes its subsidiary has meritorious defenses to the claims set forth in the complaint and intends to vigorously defend the litigation. In light of the inherent uncertainties involved in this matter, reasonably possible losses, if any, cannot be estimated at this time.
The Company has evaluated events through February 19, 2016, the date these Consolidated Financial Statements were available to be issued. There were no subsequent events that required adjustment to the Consolidated Financial Statements for 2013.
F-220
Table of Contents
ATHENE HOLDING LTD.
GLOSSARY OF SELECTED INSURANCE, REINSURANCE AND FINANCIAL TERMS
Unless otherwise indicated in this prospectus, the following terms have the meanings set forth below:
Athene Holding Ltd. and Related Entities
| A-A Mortgage |
A-A Mortgage Opportunities, LP | |
| AAA |
AP Alternative Assets, L.P. | |
| AAA Investor |
AAA Guarantor – Athene, L.P. | |
| AADE |
Athene Annuity & Life Assurance Company, formerly known as Liberty Life Insurance Company, the parent insurance company of our U.S. insurance subsidiaries | |
| AAIA |
Athene Annuity and Life Company, formerly known as Aviva Life and Annuity Company | |
| AAM |
Athene Asset Management, L.P. | |
| AAME |
Apollo Asset Management Europe, LLP (together with certain of its affiliates) | |
| AANY |
Athene Annuity & Life Assurance Company of New York | |
| AD |
Athene Deutschland GmbH, formerly known as Delta Lloyd Deutschland AG | |
| ADKG |
Athene Deutschland Holding GmbH & Co. KG | |
| ADV |
Athene Deutschland Verwaltungs GmbH | |
| ALACNY |
Aviva Life and Annuity Company of New York, now known as ALICNY | |
| ALIC |
Athene Life Insurance Company | |
| ALICNY |
Athene Life Insurance Company of New York, formerly known as ALACNY | |
| ALRe |
Athene Life Re Ltd. | |
| ALV |
Athene Lebensversicherung AG, formerly known as Delta Lloyd Lebensversicherung AG | |
| AmeriHome |
AmeriHome Mortgage Company, LLC | |
| APK |
Athene Pensionskasse AG, formerly known as Delta Lloyd Pensionskasse AG | |
| Apollo |
Apollo Global Management, LLC | |
| Apollo Group |
(A) Apollo, (B) the AAA Investor, (C) any investment fund or other collective investment vehicle whose general partner or managing member is owned, directly or indirectly, by Apollo or one or more of Apollo’s subsidiaries, (D) BRH Holdings GP, Ltd. and its shareholders and (E) any affiliate of any of the foregoing (except that AHL and its subsidiaries and employees of AHL, its subsidiaries or AAM are not members of the Apollo Group) | |
| AREM |
Athene Real Estate Management Company s.a.r.l, formerly known as Delta Lloyd Real Estate Management Company s.a.r.l | |
| Athene USA |
Athene USA Corporation, formerly known as Aviva USA Corporation | |
| DLD |
Delta Lloyd Deutschland AG, now known as Athene Deutschland GmbH | |
| German Group Companies |
AD, ADKG, ADV, ALV and APK | |
| Liberty Life |
Liberty Life Insurance Corporation | |
| Luxembourg subsidiary |
AREM | |
| MidCap |
MidCap FinCo Limited | |
| MidCap Financial |
MidCap Financial Holdings, LLC | |
| MidCap Holdings |
MidCap FinCo Holdings Limited |
G-1
Table of Contents
| ATHENE HOLDING LTD.
Certain Terms & Acronyms
| ||
| ABS |
Asset-backed security, generally included in the fixed maturity securities in the Management’s Discussion and Analysis section (whether issued by related parties or not) | |
| ACL |
Authorized control level RBC as defined by the model created by the National Association of Insurance Commissioners | |
| ALM |
Asset liability management | |
| Alternative investments |
Alternative investments, including investment funds, CLO equity positions and certain other debt instruments considered to be equity-like | |
| Base of earnings |
Earnings generated from our results of operations and the underlying profitability drivers of our business | |
| Bermuda capital |
The capital of ALRe calculated under U.S. statutory accounting principles, including that for policyholder reserve liabilities which are subjected to U.S. cash flow testing requirements, but excluding certain items that do not exist under our applicable Bermuda requirements, such as interest maintenance reserves. | |
| Block reinsurance |
A transaction in which the ceding company cedes all or a portion of a block of previously issued annuity contracts through a reinsurance agreement | |
| BMA |
Bermuda Monetary Authority | |
| BSCR |
Bermuda Solvency Capital Requirement | |
| CAGR |
Compound annual growth rate | |
| CAL |
Company action level RBC as defined by the model created by the National Association of Insurance Commissioners | |
| CLO |
Collateralized loan obligation, generally included in the fixed maturity securities in “Management’s Discussion and Analysis of Financial Condition and Results of Operations,” except for CLO equity positions which are generally included in trading securities at fair value | |
| CMBS |
Commercial mortgage-backed securities, generally included in the fixed maturity securities in “Management’s Discussion and Analysis of Financial Condition and Results of Operations” | |
| CML |
Commercial mortgage loans, generally included in the mortgage loans, net of allowances, in “Management’s Discussion and Analysis of Financial Condition and Results of Operations” | |
| Capital ratio |
Ratios calculated (i) with respect to our U.S. insurance subsidiaries, by reference to RBC, (ii) with respect to ALRe, by reference to BSCR, and (iii) with respect to our German Group Companies, by reference to SCR | |
| Cost of crediting |
The interest credited to the policyholders on our fixed annuities, including, with respect to our FIAs, option costs | |
| DAC |
Deferred acquisition costs | |
| Deferred annuities |
FIAs, annual reset annuities and MYGAs | |
| DSI |
Deferred sales inducement | |
| Excess capital |
Capital in excess of the level management believes is needed to support our current operating strategy | |
| FIA |
Fixed indexed annuity, which is an insurance contract that earns interest at a crediting rate based on a specified index on a tax-deferred basis | |
| Fixed annuities |
FIAs together with fixed rate annuities | |
| Fixed rate annuity |
Fixed rate annuity is an insurance contract that offers tax-deferred growth and the opportunity to produce a guaranteed stream of retirement income for the lifetime of its policyholder | |
| Flow reinsurance |
A transaction in which the ceding company cedes a portion of newly issued policies to the reinsurer | |
| GLWB |
Guaranteed living withdrawal benefits | |
| GMDB |
Guaranteed minimum death benefits | |
G-2
Table of Contents
ATHENE HOLDING LTD.
| IID |
Iowa Insurance Division | |
| IMO |
Independent marketing organization | |
| IMR |
Interest maintenance reserve, which is a reserve required by U.S. statutory accounting principles to accumulate realized gains and losses resulting from fluctuations in interest rates | |
| Invested assets |
The sum of (a) total investments on the consolidated balance sheet with AFS securities at amortized cost, excluding derivatives, (b) cash and cash equivalents and restricted cash, (c) investments in related parties, (d) accrued investment income, (e) the consolidated VIE assets, liabilities and noncontrolling interest and (f) policy loans ceded (which offset the direct policy loans in total investments). Invested assets also excludes assets associated with funds withheld liabilities related to business exited through reinsurance agreements and derivative collateral (offsetting the related cash positions). | |
| Investment margin |
Investment margin applies to deferred annuities and is the excess of our net investment earned rate over the cost of crediting to our policyholders | |
| IRIS |
Insurance Regulatory Information System | |
| LIMRA |
Life Insurance and Market Research Association | |
| MCR |
Minimum capital requirements | |
| MMS |
Minimum margin of solvency | |
| MVA |
Market value adjustment | |
| NAIC |
National Association of Insurance Commissioners | |
| Net investment earned rate |
Income from our invested assets divided by the average invested assets for the relevant period. | |
| NYSDFS |
New York State Department of Financial Services | |
| OTTI |
Other-than-temporary-impairment | |
| Payout annuities |
Annuities with a current cash payment component, which consist primarily of SPIAs, supplemental contracts and structured settlements | |
| Policy loan |
A loan to a policyholder under the terms of, and which is secured by, a policyholder’s policy | |
| RBC |
Risk-based capital | |
| Reserve liabilities |
The sum of (a) interest sensitive contract liabilities, (b) future policy benefits, (c) dividends payable to policyholders, and (d) other policy claims and benefits, offset by reinsurance recoverables, excluding policy loans ceded. Reserve liabilities also includes the reserves related to assumed modified coinsurance agreements in order to appropriately match the costs incurred in the consolidated statements of income with the liabilities. Reserve liabilities is net of the ceded liabilities to third-party reinsurers as the costs of the liabilities are passed to such reinsurers and therefore we have no net economic exposure to such liabilities, assuming our reinsurance counterparties perform under our agreements. | |
| RMBS |
Residential mortgage-backed securities, generally included in the fixed maturity securities in “Management’s Discussion and Analysis of Financial Condition and Results of Operations” | |
| RML |
Residential mortgage loans, generally included in the mortgage loans, net of allowances in “Management’s Discussion and Analysis of Financial Condition and Results of Operations” | |
| Sales |
All money paid into an individual annuity, including money paid into new contracts with initial purchase occurring in the specified period and existing contracts with initial purchase occurring prior to the specified period (excluding internal transfers) | |
| SPIA |
Single premium immediate annuity | |
| Surplus assets |
Assets in excess of policyholder obligations, determined in accordance with the applicable domiciliary jurisdiction’s statutory accounting principles |
G-3
Table of Contents
| TAC |
Total adjusted capital as defined by the model created by the NAIC | |
| Total return |
A measure of the historical performance of a portfolio computed using the modified Dietz method, which divides the total gain or loss in value of the portfolio, net of external flows, by the average value of the portfolio over the period of measurement | |
| U.S. RBC Ratio |
The CAL RBC ratio for AADE, our parent U.S. insurance company | |
| VIE |
Variable interest entity | |
| VOBA |
Value of business acquired | |
| Yield |
Investment yields are based on underwritten projections at the time of purchase. Yields on floating rate investments may be based on the forward interest rate curve for similar maturity at the time of purchase |
G-4
Table of Contents
Through and including , 2016 (the 25th day after the date of this prospectus), all dealers effecting transactions in these securities, whether or not participating in this offering, may be required to deliver a prospectus. This is in addition to a dealer’s obligation to deliver a prospectus when acting as an underwriter and with respect to an unsold allotment or subscription.
Shares
Class A Common Shares
PROSPECTUS
Goldman, Sachs & Co.
Barclays
Citigroup
Wells Fargo Securities
BofA Merrill Lynch
BMO Capital Markets
Credit Suisse
Deutsche Bank Securities
J.P. Morgan
Morgan Stanley
RBC Capital Markets
BNP PARIBAS
BTIG
Evercore ISI
SunTrust Robinson Humphrey
UBS Investment Bank
Apollo Global Securities
Dowling & Partners Securities LLC
Keefe, Bruyette & Woods
A Stifel Company
Lazard
Rothschild
Sandler O’Neill + Partners, L.P.
The Williams Capital Group, L.P.
, 2016
Table of Contents
PART II
INFORMATION NOT REQUIRED IN PROSPECTUS
| Item 13. | Other Expenses of Issuance and Distribution |
The following table sets forth the costs and expenses, other than the underwriting discount, payable in connection with the sale and distribution of the securities being registered. All amounts are estimated except the SEC registration fee, the FINRA filing fee and the NYSE listing fee. All the expenses below will be paid by us.
| Amount to be paid |
||||
| SEC registration fee |
$10,070.00 | |||
| FINRA filing fee |
15,500.00 | |||
| NYSE listing fee |
150,000.00 | |||
| Legal fees and expenses |
* | |||
| Accounting fees and expenses |
* | |||
| Printing and engraving expenses |
* | |||
| Transfer agent and registrar fees |
* | |||
| Miscellaneous fees and expenses |
* | |||
|
|
|
|||
| Total |
$ | * | ||
|
|
|
|||
|
* To be filed by amendment. |
||||
| Item 14. | Indemnification of Directors and Officers |
Our bye-laws provide that our directors will not be liable for monetary damages for breach of fiduciary duty.
Our bye-laws provide that we will indemnify our directors and officers. Our bye-laws provide for the indemnification of officers and directors acting on our behalf if the director or officer acted in good faith and in a manner reasonably believed to be in and not opposed to our best interest, and, with respect to any criminal action or proceeding, the indemnified party had no reason to believe his or her conduct was unlawful. Our directors and officers will not be indemnified by us if they seek indemnification from us for any acts or omissions in their capacity as directors or officers of AAM.
We have entered into indemnification agreements with each of our executive officers and directors, in addition to the indemnification provided for in our charter documents, and we intend to enter into indemnification agreements with any new directors and executive officers in the future. The indemnification agreements provide that we will indemnify our directors and officers or any person appointed to any committee by the board of directors acting in their capacity as such for any loss arising or liability attaching to them by virtue of any rule of law in respect of any negligence, default, breach of duty or breach of trust of which such person may be guilty in relation to us other than in respect of such person’s own fraud or dishonesty. However, we are required to indemnify our directors and officers in any proceeding in which they are successful. The indemnification agreements are limited to those payments that are lawful under Bermuda law.
We have purchased and intend to maintain insurance on behalf of us and any person who is or was a director or officer against any loss arising from any claim asserted against him or her and incurred by him or her in that capacity, subject to certain exclusions and limits of the amount of coverage.
The Underwriting Agreement filed as Exhibit 1.1 to this registration statement will provide for indemnification by the underwriters of us and our officers and directors for certain liabilities arising under the Securities Act or otherwise.
II-1
Table of Contents
| Item 15. | Recent Sales of Unregistered Securities |
During the three years preceding the date of this filing, we issued the following equity instruments to our employees and employees of Athene Asset Management, L.P. (“AAM”) in connection with our equity and long-term incentive plans: 260,846 Class A common shares, 3,390,000 Class M-3 common shares, 5,722,683 Class M-4 and M-4 Prime common shares, 524,959 restricted stock units (“RSUs”) and 470,644 options.
During the three years preceding the date of this filing, we issued 162,207 Class A common shares to members of our board of directors as compensation for their board service.
On April 4, 2014, April 21, 2014 and April 2, 2015, we entered into subscription agreements with third-party institutional investors as well as individuals who are employed by, or are directors of, Athene Holding Ltd. (“AHL”), its subsidiaries, or AAM, a subsidiary of Apollo Global Management, LLC (“Apollo”), for aggregate primary equity commitments of approximately $1.4 billion for approximately 43.5 million Class A common shares and approximately 8.7 million Class B common shares of AHL. The capital commitments were subsequently settled with the issuance of 42,119,768 Class A common shares and 10,115,384 Class B common shares. Currently, there are no equity commitments outstanding.
On April 21, 2014, we also issued and sold to certain of our employees, directors and affiliates, 3,693,730 fully-paid Class A common shares for approximately $49.7 million.
On September 29, 2014, we issued 3,808,626 Class B common shares to AAA Guarantor–Athene, L.P. (the “AAA Investor”) in satisfaction of our note payable to the AAA Investor, which arose in connection with the AAA Investor’s contribution of certain investment assets to us in October 2012.
On March 27, 2015, we issued and sold 563,968 Class M-4 common shares and 19,300 M-4 RSUs to AAM for approximately $1.3 million.
On March 14, 2016, we issued and sold an aggregate of 20,750 Class M-4 Prime common shares and 2,500 Class M-4 Prime RSUs to AAM for approximately $0.2 million.
Throughout 2014 and on April 2, 2015, we issued and sold an aggregate of 13,738,736 Class B common shares to Apollo in settlement of the Transaction Advisory Services Agreement.
Throughout 2015 and 2016, we also issued and sold to certain of our employees fully-paid Class A common shares as follows: (1) on September 28, 2015, 359,325 shares for approximately $10 million, (2) on October 15, 2015, 17,965 shares for approximately $500,000, (3) on November 9, 2015, 65,000 shares for approximately $1.8 million, (4) on November 24, 2015, 300 shares for approximately $10,000, (5) on February 19, 2016, approximately 23,000 shares for approximately $650,000 and (6) on August 16, 2016, 4,120 shares for approximately $150,000.
No underwriters were involved in the foregoing sales of securities.
The sales and issuances of shares described above were effected in reliance on the exemptions for sales of securities not involving a public offering, as set forth in Rule 506 promulgated under the Securities Act and in Section 4(a)(2) of the Securities Act, based on the following: (1) the investors confirmed to us that they were either “accredited investors,” as defined in Rule 501 of Regulation D promulgated under the Securities Act or had such background, education and experience in financial and business matters as to be able to evaluate the merits and risks of an investment in the securities; (2) the investors acknowledged that all securities being purchased were “restricted securities” for purposes of the Securities Act, and agreed to transfer such securities only in a transaction registered under the Securities Act or exempt from registration under the Securities Act; and (3) a legend was placed on the certificates representing each such security stating that it was restricted and could only be transferred if subsequently registered under the Securities Act or transferred in a transaction exempt from registration under the Securities Act.
II-2
Table of Contents
| Item 16. | Exhibits Index |
| (a) | Exhibits. |
The exhibit index attached hereto is incorporated herein by reference.
| (b) | Financial Statement Schedules. |
| Number |
Description |
|||||||||
| Schedule I | Summary of Investments - Other Than Investments in Related Parties | F-104 | ||||||||
| Schedule II | Condensed Financial Information of Registrant | F-105 | ||||||||
| Schedule III | Supplementary Insurance Information | F-110 | ||||||||
| Schedule IV | Reinsurance | F-111 | ||||||||
| Schedule V | Valuation and Qualifying Accounts | F-112 | ||||||||
| Item 17. | Undertakings |
The undersigned registrant hereby undertakes to provide to the underwriters at the closing specified in the underwriting agreement, certificates in such denominations and registered in such names as required by the underwriters to permit prompt delivery to each purchaser.
Insofar as indemnification for liabilities arising under the Securities Act may be permitted to directors, officers and controlling persons of the registrant pursuant to the foregoing provisions, or otherwise, we have been advised that in the opinion of the SEC such indemnification is against public policy as expressed in the Securities Act and is therefore unenforceable. In the event that a claim for indemnification against such liabilities (other than the payment by the registrant of expenses incurred or paid by a director, officer or controlling person of the registrant in the successful defense of any action, suit or proceeding) is asserted by such director, officer or controlling person in connection with the securities being registered, we will, unless in the opinion of our counsel the matter has been settled by controlling precedent, submit to a court of appropriate jurisdiction the question whether such indemnification by us is against public policy as expressed in the Securities Act and will be governed by the final adjudication of such issue.
The undersigned registrant hereby further undertakes that:
| (1) | For purposes of determining any liability under the Securities Act, the information omitted from the form of prospectus as filed as part of this Registration Statement in reliance upon Rule 430A and contained in a form of prospectus filed by the registrant pursuant to Rule 424(b)(1) or (4) or 497(h) under the Securities Act shall be deemed to be part of this Registration Statement as of the time it was declared effective. |
| (2) | For the purpose of determining any liability under the Securities Act, each post-effective amendment that contains a form of prospectus shall be deemed to be a new Registration Statement relating to the securities offered therein, and the offering of such securities at that time shall be deemed to be the initial bona fide offering thereof. |
II-3
Table of Contents
Signatures
Pursuant to the requirements of the Securities Act of 1933, as amended (the “Securities Act”), the registrant has duly caused this registration statement on Form S-1 to be signed on its behalf by the undersigned, thereunto duly authorized, in Pembroke, Bermuda, on the 21st day of November, 2016.
| ATHENE HOLDING LTD. | ||
| By: | /s/ Martin P. Klein | |
| Martin P. Klein Chief Financial Officer | ||
Pursuant to the requirements of the Securities Act, this Registration Statement has been signed by the following persons in the capacities indicated below as of November 21, 2016:
| Signature | Title | Date | ||
| /s/ * |
Chairman and Chief Executive Officer (Principal Executive Officer) |
November 21, 2016 | ||
| James R. Belardi |
||||
| /s/ Martin P. Klein |
Chief Financial Officer (Principal Financial Officer) |
November 21, 2016 | ||
| Martin P. Klein |
||||
| /s/ * |
Controller (Principal Accounting Officer) |
November 21, 2016 | ||
| William Eckert |
||||
| /s/ * |
Director | November 21, 2016 | ||
| Marc Beilinson |
||||
| /s/ * |
Director | November 21, 2016 | ||
| Robert Borden |
||||
| /s/ * |
Director | November 21, 2016 | ||
| Mark Cutis |
||||
| /s/ * |
Director | November 21, 2016 | ||
| Ahmed Ghubash |
||||
| /s/ * |
Director | November 21, 2016 | ||
| Gernot Lohr |
||||
| /s/ * |
Director | November 21, 2016 | ||
| Matthew R. Michelini |
||||
| /s/ * |
Director | November 21, 2016 | ||
| Jerome Mourgue d’Algue |
||||
| /s/ * |
Director | November 21, 2016 | ||
| Manfred Puffer |
||||
Table of Contents
| Signature | Title | Date | ||
| /s/ * |
Director | November 21, 2016 | ||
| Marc Rowan |
||||
| /s/ * |
Director | November 21, 2016 | ||
| Lawrence J. Ruisi |
||||
| /s/ * |
Director | November 21, 2016 | ||
| Imran Siddiqui |
||||
| /s/ * |
Director | November 21, 2016 | ||
| Hope Schefler Taitz |
||||
| /s/ * |
Director | November 21, 2016 | ||
| Brian Leach |
||||
| /s/ * |
Director | November 21, 2016 | ||
| H. Carl McCall |
||||
| /s/ * |
Director | November 21, 2016 | ||
| Arthur Wrubel |
||||
| * | By: /s/ Martin P. Klein |
Martin P. Klein
Attorney-in-fact
Table of Contents
EXHIBIT INDEX
| Exhibit |
Description of Exhibit | |
| 1.1 | Form of Underwriting Agreement* | |
| 2.1 | Share Purchase and Transfer Agreement, dated as of January 14, 2015, among Delta Lloyd N.V., Blitz 14-164 GmbH and Athene Holding Ltd.(2) | |
| 3.1 | Certificate of Incorporation of Athene Holding Ltd.(1) | |
| 3.2 | Memorandum of Association of Athene Holding Ltd.(1) | |
| 3.2.1 | Form of Certificate of Deposit of Memorandum of Increase of Share Capital(3) | |
| 3.3 | Ninth Amended and Restated Bye-laws of Athene Holding Ltd., dated as of November 14, 2016 | |
| 4.1 | Form of Athene Holding Ltd. Class A common share certificate(3) | |
| 4.2 | Third Amended and Restated Registration Rights Agreement, dated as of April 4, 2014, among Athene Holding Ltd. and the shareholders party thereto(2) | |
| 4.3 | First Amendment to Third Amended and Restated Registration Rights Agreement, dated as of October 6, 2015, among Athene Holding Ltd. and the shareholders party thereto(2) | |
| 5.1 | Opinion of Conyers Dill & Pearman Limited | |
| 8.1 | Opinion of Sidley Austin LLP | |
| 10.1 | Commitment Letter, dated as of February 26, 2016, from Athene USA Corporation to Apollo Commercial Real Estate Finance, Inc.(2) | |
| 10.2 | Asset Purchase and Sale Agreement, dated as of February 26, 2016, among Athene Annuity and Life Company, Athene Annuity & Life Assurance Company and Apollo Commercial Real Estate Finance, Inc.(2) | |
| 10.3 | Stock Purchase Agreement, dated as of February 26, 2016, between Athene USA Corporation and Apollo Commercial Real Estate Finance, Inc.(2) | |
| 10.4.1 | Shared Services and Cost Sharing Agreement, dated as of October 2, 2013, among Athene Holding Ltd., Athene USA Corporation, Athene Life Re Ltd., Athene Annuity & Life Assurance Company, Athene Life Insurance Company, Investors Insurance Corporation, Aviva Life and Annuity Company (now known as Athene Annuity and Life Company), Structured Annuity Reinsurance Company, Aviva Re USA IV, Inc. (now known as Athene Re USA IV, Inc.) and Athene Asset Management LLC(2) | |
| 10.4.2 | Amendment One to Shared Services and Cost Sharing Agreement, effective as of October 2, 2013, among Athene Holding Ltd., Athene USA Corporation, Athene Life Re Ltd., Athene Annuity & Life Assurance Company, Athene Life Insurance Company, Athene Annuity & Life Assurance Company (as successor by merger of Investors Insurance Corporation), Aviva Life and Annuity Company (now known as Athene Annuity and Life Company), Structured Annuity Reinsurance Company, Aviva Re USA IV, Inc. (now known as Athene Re USA IV, Inc.) and Athene Asset Management LLC(2) | |
| 10.4.3 | Shared Services and Cost Sharing Agreement, dated as of October 2, 2013, among Athene Holding Ltd., Athene USA Corporation, Athene Life Re Ltd., Athene Annuity & Life Assurance Company, Aviva Life and Annuity Company (now known as Athene Annuity and Life Company), Athene Asset Management LLC, Presidential Life Insurance Company (now known as Athene Annuity & Life Assurance Company of New York) and Aviva Life and Annuity Company of New York (now known as Athene Life Insurance Company of New York)(2) | |
| 10.4.4 | Amendment One to Shared Services and Cost Sharing Agreement, effective as of October 2, 2013, among Athene Holding Ltd., Athene USA Corporation, Athene Life Re Ltd., Athene Annuity & Life Assurance Company, Aviva Life and Annuity Company (now known as Athene Annuity and Life Company), Athene Asset Management LLC, Athene Annuity & Life Assurance Company of New York (formerly known as Presidential Life Insurance Company) and Aviva Life and Annuity Company of New York (now known as Athene Life Insurance Company of New York)(2) | |
Table of Contents
| Exhibit |
Description of Exhibit | |
| 10.5 | Credit Agreement, dated as of January 22, 2016, among Athene Holding Ltd., Athene Life Re Ltd. and Athene USA Corporation, as Borrowers, the lenders from time to time party thereto, and Citibank, N.A., as Administrative Agent(2) | |
| 10.6 | Guaranty, dated as of January 22, 2016, among Athene Holding Ltd., Athene Life Re Ltd. and Athene USA Corporation, as Guarantors, and Citibank, N.A., as Administrative Agent(2) | |
| 10.7.1 | Fourth Amended and Restated Fee Agreement, dated as of August 31, 2016, between Athene Asset Management, L.P. and Athene Holding Ltd.(2) | |
| 10.7.2 | Applicable 2016 Liability Fee Discount, effective as of September 30, 2016, between Athene Asset Management, L.P. and Athene Holding Ltd.(2) | |
| 10.8 | Services Agreement, dated as of March 1, 2016, among Apollo Asset Management Europe LLP, Apollo Management International LLP and Athene Deutschland Holding GmbH & Co.(2) | |
| 10.9 | Amended and Restated Coinsurance Agreement, dated as of July 31, 2015, between Athene Life Insurance Company of New York and First Allmerica Financial Life Insurance Company (regarding certain term and universal life policies)(2) | |
| 10.10 | Coinsurance and Assumption Agreement, dated as of October 1, 2013, between Aviva Life and Annuity Company (now known as Athene Annuity and Life Company) and Presidential Life Insurance Company – USA (now known as Accordia Life and Annuity Insurance Company)(2) | |
| 10.11 | Amended and Restated Coinsurance and Assumption Agreement, dated as of July 31, 2015, between Athene Life Insurance Company of New York and First Allmerica Financial Life Insurance Company (regarding certain policies described therein)(2) | |
| 10.12 | Amended and Restated Coinsurance Agreement, dated as of December 28, 2015, between Athene Annuity and Life Company and Accordia Life and Annuity Company (formerly known as Presidential Life Insurance Company—USA) (regarding the ILICO closed block)(2) | |
| 10.13 | Funds Withheld Coinsurance Agreement, dated as of October 1, 2013, between Aviva Life and Annuity Company of New York (now known as Athene Life Insurance Company of New York) and First Allmerica Financial Life Insurance Company (regarding certain term and universal life policies)(2) | |
| 10.14 | Coinsurance Agreement, dated as of April 29, 2011, between Liberty Life Insurance Company (now known as Athene Annuity & Life Assurance Company) and Protective Life Insurance Company(2) | |
| 10.15.1 | Employment Agreement, dated as of February 27, 2013, between Athene Holding Ltd. and James R. Belardi(2) | |
| 10.15.2 | Employment Agreement, dated as of September 7, 2015, between Athene Holding Ltd. and William J. Wheeler(2) | |
| 10.15.3 | Employment Agreement, dated as of October 12, 2015, between Athene Holding Ltd. and Martin P. Klein(2) | |
| 10.15.4 | Employment Agreement, dated as of April 26, 2016, between Athene Holding Ltd. and Grant Kvalheim(2) | |
| 10.16.1 | Amended and Restated Athene Holding Ltd. 2009 Share Incentive Plan(2) | |
| 10.16.2 | Amended and Restated Athene Holding Ltd. 2012 Share Incentive Plan(2) | |
| 10.16.3 | Athene Holding Ltd. 2014 Share Incentive Plan(2) | |
| 10.16.4 | Amendment No. 1 to 2014 Share Incentive Plan(2) | |
| 10.16.5 | Athene Holding Ltd. 2016 Share Incentive Plan(2) | |
Table of Contents
| Exhibit |
Description of Exhibit | |
| 10.17 | Form of Amended and Restated Restricted Share Award Agreement (Class M-1 common shares)(2) | |
| 10.18 | Form of Amended and Restated Restricted Share Award Agreement (Class M-2 common shares)(2) | |
| 10.19 | Form of Amended and Restated Restricted Share Award Agreement (Class M-3 common shares)(2) | |
| 10.20 | Form of Amended and Restated Restricted Share Award Agreement (Class M-4 common shares)(3) | |
| 10.21 | Form of Amended and Restated Restricted Share Unit Award Agreement (similar to Class M-4 common shares)(3) | |
| 10.22 | Form of Amended and Restated Restricted Share Award Agreement (Class M-4 Prime common shares)(3) | |
| 10.23 | Form of Amended and Restated Restricted Share Unit Award Agreement (similar to Class M-4 Prime common shares)(3) | |
| 10.24.1 | Form of Amended and Restated Class A Share Award Agreement (Class A common shares issued at $13.46 per share)(3) | |
| 10.24.2 | Form of Amendment Letter to the Amended and Restated Class A Share Award Agreement (Class A common shares issued at $13.46 per share)(3) | |
| 10.25.1 | Form of Restricted Share Award Agreement (Class A common shares)(3) | |
| 10.25.2 | Form of Amendment Letter to the Restricted Share Award Agreement (Class A common shares)(3) | |
| 10.26.1 | Form of Class A Share Award Agreement (Class A common shares issued at fair market value)(3) | |
| 10.26.2 | Form of Amendment Letter to Class A Share Award Agreement (Class A common shares issued at fair market value)(3) | |
| 10.27 | Form of Nonqualified Stock Option Award Notice and Nonqualified Stock Option Agreement(2) | |
| 10.28 | Form of Restricted Share Unit Award Notice (Performance-Based Vesting) and Restricted Share Unit Award Agreement(2) | |
| 10.29 | Form of Restricted Share Unit Award Notice (Time-Based Vesting) and Restricted Share Unit Award Agreement(2) | |
| 10.30 | Form of Amended and Restated Restricted Share Award Agreement (2014 awards to certain non-employee directors)(3) | |
| 10.31 | Form of Restricted Share Award Agreement (2015 awards to certain non-employee directors)(3) | |
| 10.32 | Form of Director Retention Letter(2) | |
| 10.33 | Supplemental Executive Retirement Plan(2) | |
| 10.34 | Separation Agreement and General Release, dated as of May 20, 2015, between Athene Holding Ltd. and Brenda Cushing(2) | |
| 10.35 | Separation Agreement and General Release, dated as of June 21, 2016, between Athene Holding Ltd. and Stephen E. Cernich(2) | |
| 10.36 | Letter Agreement, dated as of April 4, 2014, among Athene Holding Ltd., Apollo Global Management, LLC, Procific and AHL 2014 Investor, L.P.(2) | |
| 10.37 | Letter Agreement, dated as of December 4, 2012, among Athene Holding Ltd., Apollo Global Management, LLC and Procific(2) | |
| 10.38.1 | Purchase Agreement, dated as of December 31, 2015, between Athene Holding Ltd. and Athene Asset Management, L.P.(2) | |
| 10.38.2 | Purchase Agreement, dated as of December 31, 2014, between Athene Holding Ltd. and Athene Asset Management, L.P.(2) | |
Table of Contents
| Exhibit |
Description of Exhibit | |
| 10.39.1 | Amended and Restated Master Sub-Advisory Agreement, dated as of April 1, 2014, among Athene Asset Management L.P., Apollo Capital Management, L.P., Apollo Global Real Estate Management, L.P., ARM Manager LLC, Apollo Longevity, LLC and Apollo Emerging Markets, LLC(2) | |
| 10.39.2 | Master Sub-Advisory Agreement Addendum One, dated as of November 24, 2015, between Athene Asset Management L.P. and Apollo Emerging Markets, LLC(2) | |
| 10.39.3 | Second Amended and Restated Master Sub-Advisory Agreement, dated as of April 1, 2014, among Athene Asset Management L.P., Apollo Capital Management, L.P., Apollo Global Real Estate Management, L.P., ARM Manager LLC, Apollo Longevity, LLC, Apollo Royalties Management, LLC and Apollo Emerging Markets, LLC(2) | |
| 10.39.4 | Master Sub-Advisory Agreement Addendum One, dated as of November 24, 2015, between Athene Asset Management L.P. and Apollo Emerging Markets, LLC(2) | |
| 10.39.5 |
Second Amended and Restated Master Sub-Advisory Agreement, dated as of January 1, 2015, among Athene Asset Management L.P., Apollo Capital Management, L.P., Apollo Global Real Estate Management, L.P., ARM Manager LLC and Apollo Longevity, LLC(2) | |
| 16.1 | Change in Auditor Letter of PricewaterhouseCoopers Ltd. | |
| 21.1 | Subsidiaries of the Registrant(3) | |
| 23.1.1 | Consent of Conyers Dill & Pearman Limited (included in the opinion filed as Exhibit 5.1 hereto) | |
| 23.1.2 | Consent of Sidley Austin LLP (included in the opinion filed as Exhibit 8.1 hereto) | |
| 23.2.1 | Consent of PricewaterhouseCoopers LLP regarding Athene Holding Ltd. financial statements | |
| 23.2.2 | Consent of PricewaterhouseCoopers Ltd. regarding Athene Holding Ltd. financial statements | |
| 23.2.3 | Consent of PricewaterhouseCoopers LLP regarding Aviva USA Corporation financial statements | |
| 24.1 | Power of Attorney(1) | |
| 24.2 | Power of Attorney(2) | |
| 99.1 | Form F-N(1) | |
| (1) | Previously filed on May 9, 2016 as an exhibit to the Form S-1 |
| (2) | Previously filed on October 25, 2016 as an exhibit to the Form S-1 |
| (3) | Previously filed on November 10, 2016 as an exhibit to the Form S-1 |
| * | To be filed by amendment |