Attached files
| file | filename |
|---|---|
| 8-K - 8-K - Global Net Lease, Inc. | v453433_8k.htm |
Exhibit 99.1

November 2016 Proposed Merger with American Realty Capital Global Trust II

Additional Information About the Proposed Transaction and Where to Find It This communication does not constitute an offer to sell or the solicitation of an offer to buy any securities or a solicitation of any vote or approval . In connection with the proposed transaction, Global Net Lease, Inc . (“GNL” or the “Company”) and American Realty Capital Global Trust II, Inc . (“Global II”) intend to file relevant materials with the Securities and Exchange Commission (the "SEC"), including a joint proxy statement/prospectus on Form S - 4 . BOTH GNL AND GLOBAL II STOCKHOLDERS ARE URGED TO READ THE PROXY STATEMENT/PROSPECTUS (INCLUDING ALL AMENDMENTS AND SUPPLEMENTS THERETO) AND OTHER RELEVANT DOCUMENTS FILED WITH THE SEC IF AND WHEN THEY BECOME AVAILABLE BECAUSE THEY WILL CONTAIN IMPORTANT INFORMATION ABOUT THE PROPOSED TRANSACTION . Investors may obtain free copies of the proxy statement/prospectus and other relevant documents filed by GNL and Global II with the SEC (if and when they become available) through the website maintained by the SEC at www . sec . gov . Copies of the documents filed by GNL and Global II with the SEC are also available free of charge on GNL’s website at www . globalnetlease . com and copies of the documents filed by Global II with the SEC are available free of charge on Global II’s website at www . arcglobal 2 . com . 2
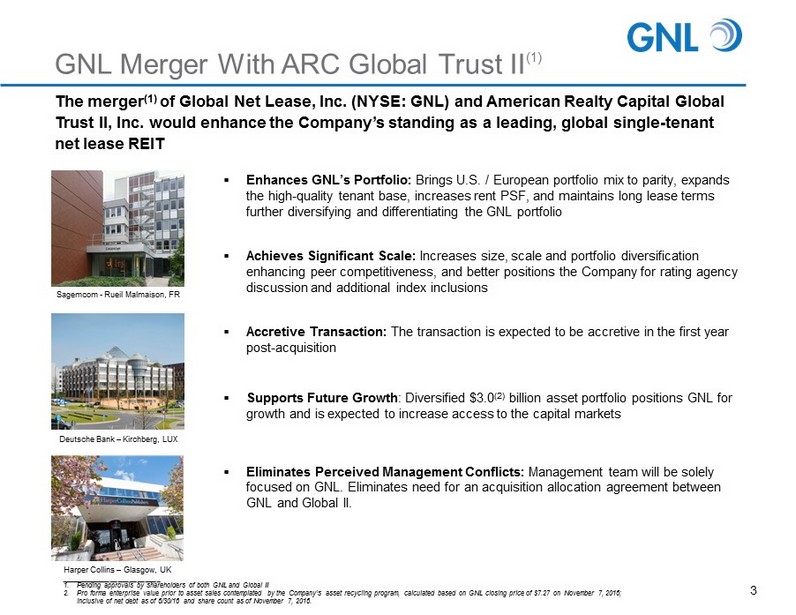
GNL Merger With ARC Global Trust II (1) 3 ▪ Enhances GNL’s Portfolio: Brings U.S. / European portfolio mix to parity, expands the high - quality tenant base, increases rent PSF, and maintains long lease terms further diversifying and differentiating the GNL portfolio ▪ Achieves Significant Scale: Increases size, scale and portfolio diversification enhancing peer competitiveness, and better positions the Company for rating agency discussion and additional index inclusions ▪ Accretive Transaction: The transaction is expected to be accretive in the first year post - acquisition ▪ Supports Future Growth : Diversified $3.0 (2) billion asset portfolio positions GNL for growth and is expected to increase access to the capital markets ▪ Eliminates Perceived Management Conflicts: Management team will be solely focused on GNL. Eliminates need for an acquisition allocation agreement between GNL and Global II. The merger (1) of Global Net Lease, Inc. (NYSE: GNL) and American Realty Capital Global Trust II, Inc. would enhance the Company’s standing as a leading, global single - tenant net lease REIT Sagemcom - Rueil Malmaison, FR Deutsche Bank – Kirchberg, LUX Harper Collins – Glasgow, UK __________________________ 1. Pending approvals by shareholders of both GNL and Global II 2. Pro forma enterprise value prior to asset sales contemplated by the Company’s asset recycling program, calculated based on GN L c losing price of $7.27 on November 7, 2016; inclusive of net debt as of 6/30/16 and share count as of November 7, 2016.

Transaction Overview 4 Deal Summary Board Composition & Leadership Breakup Fee ▪ Global Net Lease, Inc. will acquire American Realty Capital Global Trust II ▪ 100% stock transaction , resulting in a $3.0 (1) billion combined pro forma enterprise value through the acquisition of a $620 million (2) net lease portfolio ▪ Fixed exchange ratio , with each common share of Global II, and each of Global II's operating partnership units, receiving 2.27 shares of GNL at closing ▪ Pro Forma Ownership (3) : 86% GNL / 14% Global II ▪ Subject to approval by the GNL and Global II stockholders ▪ Under certain circumstances, GNL will receive a $6.0 million break - up fee plus expenses not to exceed $5.0 million ▪ Global II will appoint one director to GNL's board, increasing the number of independent directors to four out of five board seats Timeline to Closing ▪ Record Date: October 25, 2016 ▪ Effective Date: November 8, 2016 ▪ Shareholder Meeting: December 20, 2016 ▪ Expected Closing: December 2016 __________________________ 1. Pro forma enterprise value prior to asset sales contemplated by the Company’s asset recycling program, calculated based on GN L c losing price of $7.27 on 11/7/2016; inclusive of net debt as of 6/30/2016 and share count as of 11/7/2016. 2. Based on original contract purchase price at the currency exchange rate at the date of original purchase, excluding acquisiti on related costs. 3. Based on share count as of 11/7/2016 and the fixed exchange ratio of 2.27.

__________________________ 1. Investment grade tenant concentration and geographic distribution weighted by Annualized rental income converted from local c urr ency into USD as of June 30, 2016 for the in - place lease in the property on a straight - line basis, which includes tenant concessions such as free rent, as applicable; Weighted average remaining lease term b ased on square footage as of 6/30/2016. Actual ratings reflect the tenant rating. Implied Ratings are determined using a proprietary Moody’s analytical tool, which compares the risk metrics of the non - rated com pany to those of a company with an Actual Rating. A tenant with a parent that has an investment grade rating is included in implied investment grade. Implied investment grade for GNL, Global II and GNL Pro F orm a is 33.5%, 39.2% and 34.5%, respectively. Ratings information is as of August 1, 2016, unless otherwise noted. * Represents Moody’s Implied Rating. ** Represents Tenant Parent Rating. *** Represents Lease G uar antor Rating. 2. Weighted by annualized rental income converted from local currency into USD as of June 30, 2016 for the in - place lease in the pr operty on a straight - line basis, which includes tenant concessions such as free rent, as applicable. 3. Actual ratings reflect the tenant rating. Implied Ratings are determined using a proprietary Moody’s analytical tool, which c omp ares the risk metrics of the non - rated company to those of a company with an Actual Rating. A tenant with a parent that has an investment grade rating is included in implied investment grade. Ratings informati on is as of August 1, 2016, unless otherwise noted. * Represents Moody’s Implied Rating. ** Represents Tenant Parent Rating. *** Represents Lease Guarantor Rating. 4. FedEx also includes FedEx Ground. Combined Portfolio of High Quality, Global Net Lease Real Estate 5 GNL's top 10 tenant concentration improves from 38% to 36% post merger (2) GNL Top 10 Tenants (2) ARC Global II Top 10 Tenants (2) GNL Pro Forma Top 10 Tenants (2) Enhances portfolio strength and geographic balance GNL (1) ARC Global II (1) GNL Pro Forma (1) Size Tenants Lease Term Occupancy ▪ 329 properties ▪ 18.7 million square feet ▪ 16 properties ▪ 4.2 million square feet ▪ 345 properties ▪ 23.0 million square feet Size Tenants Lease Term Occupancy Size Tenants Lease Term Occupancy ▪ 70.1% Investment Grade ▪ 70.1% Investment Grade ▪ 70.1% Investment Grade ▪ 10.8 Years ▪ 8.5 Years ▪ 10.4 Years ▪ 100% ▪ 99.9% ▪ 100% Geographies Geographies Geographies ▪ U.S.: 62% / Europe: 38% ▪ U.S.: 5% / Europe: 95% ▪ U.S.: 51% / Europe: 49% Tenant % Rating (3) Tenant % Rating (3) Tenant % Rating (3) 5.2% Baa3 23.5% Ba2 4.5% Ba2 (4) 5.0 % Baa2 18.0% A1 (4) 4.3 % Baa2 4.3% Ba3 14.3% Baa2 4.2% Baa3 4.3% Aaa 11.5% Baa2 3.5% Ba3 5.7 % Aaa 9.9 % Baa1 3.5% Aaa 3.1% Baa2 6.4% Baa2 4.6% Aaa 2.8% Aa3 3.2% Aa2 3.4% A1 3.2% Aa3 2.8% Baa1 2.7% Baa2 2.6% A2 2.1% Ba3 2.5% Baa2 2.2% Baa1 2.0% Aa1 Top 10 Tenants 38.4% Top 10 Tenants 93.7% Top 10 Tenants 35.8% 2.6% Aa3

Office 58% Industrial & Distribution 29% Retail 12% Other 1% Office 54% Industrial & Distribution 30% Retail 15% Other 1% U.S. 62% U.K. 18% Germany 9% The Netherlands 4% Finland 7% Geographically diverse, well - positioned portfolio of high - quality assets in the U.S. and Europe (1) __________________________ 1. Weighted by annualized rental income converted from local currency into USD as of June 30, 2016 for the in - place lease in the pr operty on a straight - line basis, which includes tenant concessions such as free rent, as applicable. Pro Forma Geographic Exposure GNL Asset Type Diversification U.S. 51% U.K. 22% Germany 8% Luxembourg 2% France 5% The Netherlands 7% Finland 5% Merger Diversifies GNL Geographic Exposure And Maintains Asset Focus GNL Geographic Exposure U.S. 51% Europe 49% U.S. 62% Europe 38% Pro Forma Asset Type Diversification 6
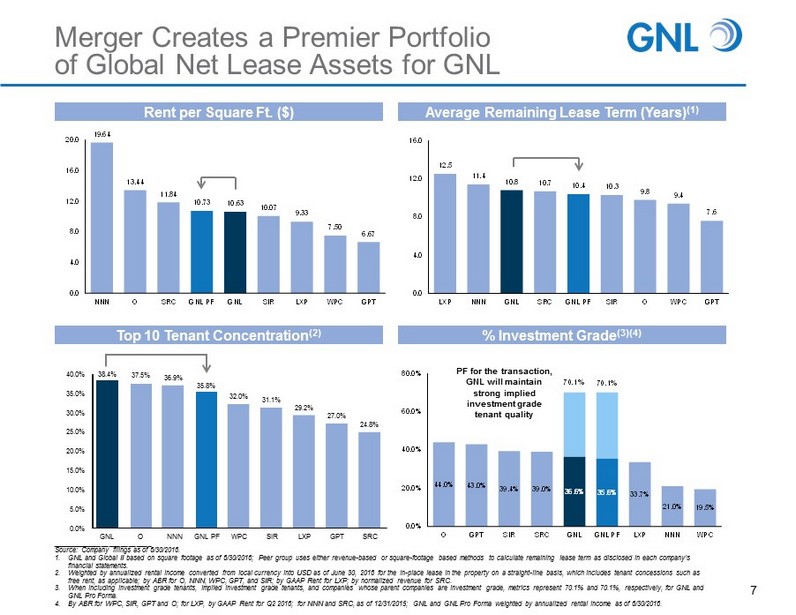
12.5 11.4 10.8 10.7 10.4 10.3 9.8 9.4 7.6 0.0 4.0 8.0 12.0 16.0 LXP NNN GNL SRC GNL PF SIR O WPC GPT 19.64 13.44 11.84 10.73 10.63 10.07 9.33 7.50 6.67 0.0 4.0 8.0 12.0 16.0 20.0 NNN O SRC GNL PF GNL SIR LXP WPC GPT 7 Rent per Square Ft. ($) Average Remaining Lease Term (Years) (1) % Investment Grade (3)(4) Top 10 Tenant Concentration (2) __________________________ Source: Company filings as of 6/30/2016. 1. GNL and Global II based on square footage as of 6/30/2016; Peer group uses either revenue - based or square - footage based methods to calculate remaining lease term as disclosed in each company’s financial statements. 2. Weighted by annualized rental income converted from local currency into USD as of June 30, 2016 for the in - place lease in the pr operty on a straight - line basis, which includes tenant concessions such as free rent, as applicable; by ABR for O, NNN, WPC, GPT, and SIR; by GAAP Rent for LXP; by normalized revenue for SRC. 3. When including investment grade tenants, implied investment grade tenants, and companies whose parent companies are investmen t g rade, metrics represent 70.1% and 70.1%, respectively, for GNL and GNL Pro Forma. 4. By ABR for WPC, SIR, GPT and O; for LXP, by GAAP Rent for Q2 2016; for NNN and SRC, as of 12/31/2015; GNL and GNL Pro Forma w eig hted by annualized rental income as of 6/30/2016. PF for the transaction, GNL will maintain strong implied investment grade tenant quality 44.0% 43.0% 39.4% 39.0% 36.6% 35.6% 33.7% 21.0% 19.5% 0.0% 20.0% 40.0% 60.0% 80.0% O GPT SIR SRC GNL GNL PF LXP NNN WPC 70.1% 70.1% Merger Creates a Premier Portfolio of Global Net Lease Assets for GNL 37.5% 38.4% 36.9% 35.8% 32.0% 31.1% 29.2% 27.0% 24.8% 0.0% 5.0% 10.0% 15.0% 20.0% 25.0% 30.0% 35.0% 40.0% GNL O NNN GNL PF WPC SIR LXP GPT SRC

_____________________________ Source: Company filings, market data as of November 7, 2016 (1) Pro forma enterprise value prior to asset sales contemplated by the Company, calculated based on GNL closing price of $7.27 o n N ovember 7,2016; inclusive of net debt as of June 30, 2016 and share count as of November 7, 2016. (2) Weighted by annualized rental income converted from local currency into USD as of June 30, 2016 for the in - place lease in the pr operty on a straight - line basis, which includes tenant concessions such as free rent, as applicable; GPT, WPC based on square footage as of June 30, 2016. (3) PF GNL weighted average remaining lease term as of June 30, 2016 based on square footage; GPT based on contractual base rent as of June 30, 2016, WPC based on annualized base rent as of June 30, 2016. (4) PF GNL includes investment grade; credit ratings as of August 1, 2016. GPT, and WPC based on annualized base rent for the qua rte r as of June 30, 2016. Enterprise Value (in billions ) $3.0 (1) $6.0 $11.9 Portfolio SF (in millions ) 23.0 55.0 92.8 # of Properties 345 296 914 % of Annualized Rental Income from International (2) Weighted Average Remaining Lease Term (years) (3) 10.4 7.6 9.4 % Investment Grade Tenants (4) 36% 43% 20% Retail Industrial / Distribution Office Other Annualized Rental Income by Property Type Diversifies and Differentiates Portfolio 36% 64% 49% 51% ▪ As a result of the merger, GNL will have the greatest global geographic diversification of any U.S. listed net lease company with international exposure ▪ GNL will also have the longest average remaining lease term of these peers 1% 58% 29% 12% 8 U.S. Europe 26% 44% 15% 15% 59% 36% 5% 3% 97%

Shameel Kahn CEO Gary Wilder Executive Chairman Jagdeep Kapoor CIO Moor Park Management Team Germany United Kingdom Nordics Benelux France Brian Mansouri Vice President Kyle Gray Analyst Jason Slear EVP Matt Furbish Director, IR and PR U.S. Team GNL Board of Directors William Kahane Director Edward Rendell Independent Director Sue Perrotty Non - Exec. Chairman Independent Director GNL Management Team Scott Bowman President & CEO Timothy Salvemini CFO Addition of One Independent Director to Enhance Corporate Governance Abby Wenzel Independent Director 9 Brandon Koch CAO NEW Independent Director Individual Regional Real Estate Teams To Be Appointed from Global II’s Board
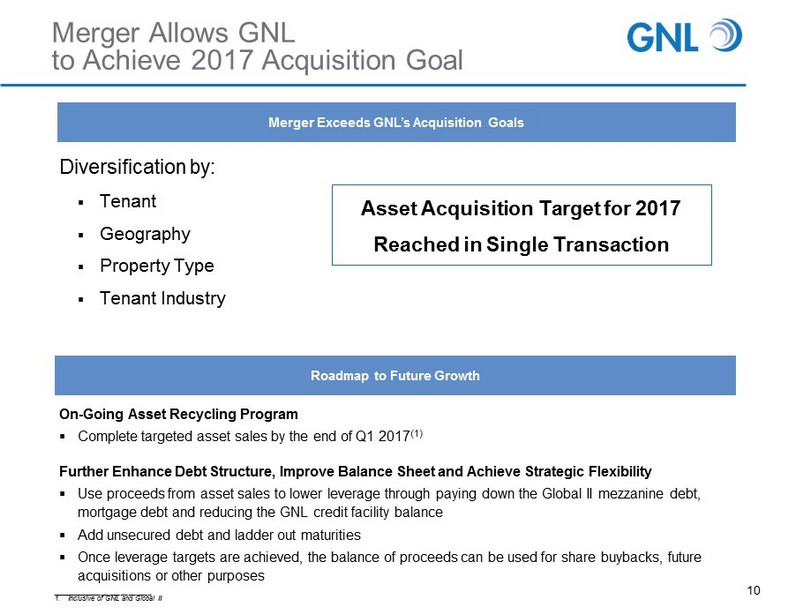
Diversification by: ▪ Tenant ▪ Geography ▪ Property Type ▪ Tenant Industry Merger Allows GNL to Achieve 2017 Acquisition Goal Roadmap to Future Growth Merger Exceeds GNL’s Acquisition Goals On - Going Asset Recycling Program ▪ Complete targeted asset sales by the end of Q1 2017 (1) Further Enhance Debt Structure, Improve Balance Sheet and Achieve Strategic Flexibility ▪ Use proceeds from asset sales to lower leverage through paying down the Global II mezzanine debt, mortgage debt and reducing the GNL credit facility balance ▪ Add unsecured debt and ladder out maturities ▪ Once leverage targets are achieved, the balance of proceeds can be used for share buybacks, future acquisitions or other purposes 10 Asset Acquisition Target for 2017 Reached in Single Transaction __________________________ 1. Inclusive of GNL and Global II

What Do I Do Next? Proxy statements will be mailed to shareholders If you have any questions about voting your shares in connection with the special meeting being held on December 20 , 2016 , please contact our proxy solicitor, D . F . King & Co . , Inc . at 800 - 659 - 5550 . Stockholders also have the following options for authorizing a proxy to vote their shares . Vote by Phone at 1 - 800 - 690 - 6903. Please have your control number available for reference. Vote by Mail by completing, signing and dating the enclosed proxy ballot and returning it in the pre - paid envelope provided in this package. Vote by Internet at www .pr o x yvo te . com/ GNL and enter the contr ol number on the voting instructions f orm and foll ow the promp ts. 11 Your VOTE is Needed!

12 Certain statements made in this presentation are “forward - looking statements” (as defined in Section 21E of the Exchange Act), which reflect the expectations of GNL and Global II regarding future events. The forward - looking statements involve a number of risks, uncertainties and other factors that could cause actual results to differ materially from those contained in the forward - looking statements. Such forward - looking statements include, but are not limited to, whether and when the transactions contemplated by the Agreement and Plan of Merger (the “Merger Agreement”) between GNL and Global II, among others, will be consummated, the new combined company’s plans, market and other expectations, objectives, intentions, as well as any expectations or projections with respect to the combined company, including regarding future dividends and market valuations, and other statements that are not historical facts. The following additional factors, among others, could cause actual results to differ from those set forth in the forward - looking statements: whether GNL's and Global II’s stockholders approve of the transactions contemplated in the Merger Agreement; whether the benefits from the transaction are achieved; market volatility; unexpected costs or unexpected liabilities that may arise from the transaction, whether or not consummated; continuation or deterioration of current market conditions; future regulatory or legislative actions that could adversely affect the companies; and the business plans of the tenants of the respective parties. Additional factors that may affect future results are contained in the Company’s and Global II’s filings with the SEC, including (i) the Annual Report on Form 10 - K for the year ended December 31, 2015 filed on February 29, 2016, the Quarterly Reports on Form 10 - Q for the quarters ended March 31, 2016, June 30, 2016 and September 30, 2016, filed on May 6, 2016, August 8, 2016 and November 9, 2016, respectively, and in future periodic reports filed by the Company under the Securities Exchange Act of 1934, as amended, which are available at the SEC’s website at www.sec.gov. The Company and Global II disclaim any obligation to update and revise statements contained in these materials based on new information or otherwise. Forward Looking Statements

13 The following are some of the risks and uncertainties, although not all risks and uncertainties, that could cause our actual results to differ materially from those presented in our forward - looking statements. See the section entitled “Item 1A. Risk Factors” in the Company’s Annual Report on Form 10 - K filed with the SEC on February 29, 2016 and the section entitled “Item 1A. Risk Factors” in the Company’s Quarterly Reports on form 10 - Q filed with the SEC on May 6, 2016, August 8, 2016 and November 9, 2016 for a discussion of the risks which should be considered in connection with your investment. All of our executive officers are also officers, managers and/or holders of a direct or indirect controlling interest in our Adv isor and other entities affiliated with AR Global Investments, LLC. As a result, our executive officers, our Advisor and its affil iat es face conflicts of interest, including significant conflicts created by our Advisor's compensation arrangements with us and ot her investment programs advised by AR Global Investments, LLC’s affiliates and conflicts in allocating time among these investment programs and us. These conflicts could result in unanticipated actions. Because investment opportunities that are suitable for us may also be suitable for other AR Global Investments, LLC advised investment programs, our Advisor and its affiliates face conflicts of interest relating to the purchase of properties and oth er investments and such conflicts may not be resolved in our favor, which could reduce the investment return to our stockholders. We may not be able to consummate the Mergers pursuant to the Merger Agreement in the timeframe contemplated or at all. The anticipated benefits from the Merger may not be realized or may take longer to realize than expected. Unexpected costs or unexpected liabilities may arise from the Merger or other transactions, whether or not consummated. We may be unable to pay or maintain cash dividends or increase dividends over time. We are obligated to pay fees which may be substantial to our Advisor and its affiliates. We depend on tenants for our rental revenue and, accordingly, our rental revenue is dependent upon the success and economic viability of our tenants. Increases in interest rates could increase the amount of our debt payments and limit our ability to pay dividends to our stockholders. We may be unable to raise additional debt or equity financing on attractive terms or at all. Risk Factors

14 Adverse changes in exchange rates may reduce the value of our properties located outside of the United States. We may not generate cash flows sufficient to pay dividends to our stockholders, as such, we may be forced to borrow at unfavorable rates or depend on our Advisor to waive reimbursement of certain expense and fees to fund our operations. There is no assurance that our Advisor will waive reimbursement of expenses or fees. Any of these dividends may reduce the amount of capital we ultimately invest in properties and other permitted investments and negatively impact the value of our common stock. We are subject to risks associated with our international investments, including risks associated with compliance with and changes in foreign laws, fluctuations in foreign currency exchange rates and inflation. We are subject to risks associated with any dislocations or liquidity disruptions that may exist or occur in the credit marke ts of the United States of America and Europe from time to time. We may fail to continue to qualify, as a real estate investment trust for U.S. federal income tax purposes, which would resul t in higher taxes, may adversely affect operations, adversely affect our ability to pay dividends and reduce the market price o f our common stock. We may be deemed to be an investment company under the Investment Company Act of 1940, as amended, and thus subject to regulation under the Investment Company Act. We may be exposed to risks due to a lack of tenant diversity, investment types and geographic diversity. The revenue derived from, and the market value of, properties located in the United Kingdom and continental Europe may decline as a result of the non binding referendum on June 23, 2016 in which a majority of voters voted to exit the European Union (the “Brexit” vote). Our ability to refinance or sell properties located in the United Kingdom and continental Europe may be impacted by the economic and political uncertainty following the Brexit vote. We may be exposed to changes in general economic, business and political conditions, including the possibility of intensified international hostilities, acts of terrorism, and changes in conditions of United States of America or international lending, capital and financing markets, including as a result of the Brexit vote . Risk Factors (Continued)

Projections 15 This presentation includes estimated projections of future operating results. These projections were not prepared in accordance with published guidelines of the SEC or the guidelines established by the American Institute of Certified Public Accountants for preparation and presentation of financial projections. This information is not fact and should not be relied upon as being necessarily indicative of future results; the projections were prepared in good faith by management and are based on numerous assumptions that may prove to be wrong. Important factors that may affect actual results and cause the projections to not be achieved include, but are not limited to, risks and uncertainties relating to the company and other fac tor s described in the “Risk Factors” section of GNL's Annual Report on Form 10 - K filed with the SEC on February 29, 2016, GNL's Quarterly Reports on Form 10 - Q filed for the quarters ended March 31, 2016, June 30, 2016 and September 30, 2016 filed on May 6, 2016, August 8, 2016 and November 9, 2016, respectively, in the “Risk Factors” section of Global II's Annual Report on Form 10 - K filed with the SEC on March 22, 2016, Global II's Quarterly Reports on Form 10 - Q filed for the quarters ended March 31, 2016, June 30, 2016 and September 30, 2016 filed on May 16, 2016, August 15, 2016 and November 14, 2016, respectively, in GNL's and Global II's future filings with the SEC. The projections also reflect assumptions as to cert ain business decisions that are subject to change. As a result, actual results may differ materially from those contained in the estimates. Accordingly, there can be no assurance that the estimates will be realized. This presentation also contains estimates and information concerning our industry, including market position, market size, and growth rates of the markets in which we participate, that are based on industry publications and reports. This informatio n involves a number of assumptions and limitations, and you are cautioned not to give undue weight to these estimates. We have not independently verified the accuracy or completeness of the data contained in these industry publications and reports. The industry in which we operate is subject to a high degree of uncertainty and risk due to variety of factors, incl udi ng those described in the “Risk Factors” section of the Company’s Annual Report on Form 10 - K filed with the SEC on February 29, 2016, the Quarterly Reports on Form 10 - Q filed for the quarters ended March 31, 2016, June 30, 2016 and September 30, 2016 filed on May 6, 2016, August 8, 2016 and November 9, 2016, respectively, and in future filings with the SEC. These and other factors could cause results to differ materially from those expressed in these publications and reports.

Definitions 16 Due to certain unique operating characteristics of real estate companies, as discussed below, the National Association of Rea l E state Investment Trusts ("NAREIT"), an industry trade group, has promulgated a measure known as funds from operations ("FFO"), whic h w e believe to be an appropriate supplemental measure to reflect the operating performance of a REIT. The use of FFO is recommend ed by the REIT industry as a supplemental performance measure. FFO is not equivalent to net income or loss as determined under acco unt ing principles generally accepted in the United States ("GAAP"). We define FFO, a non - GAAP measure, consistent with the standards established by the White Paper on FFO approved by the Board of Governors of NAREIT, as revised in February 2004 (the "White Paper"). The White Paper defines FFO as net income or loss compu ted in accordance with GAAP, excluding gains or losses from sales of property but including asset impairment writedowns, plus dep rec iation and amortization, and after adjustments for unconsolidated partnerships and joint ventures. Adjustments for unconsolidated pa rtn erships and joint ventures are calculated to reflect FFO. Our FFO calculation complies with NAREIT's definition. The historical accounting convention used for real estate assets requires straight - line depreciation of buildings and improvemen ts, and straight - line amortization of intangibles, which implies that the value of a real estate asset diminishes predictably over time, especially if not adequately maintained or repaired and renovated as required by relevant circumstances or as requested or required by less ees for operational purposes in order to maintain the value disclosed. We believe that, because real estate values historically rise and fall with market conditions, including inflation, interest rates, the business cycle, unemployment and consumer spending, presentations of operating results for a REIT using historical accounting for depreciation and certain other items may be less informative. Hi sto rical accounting for real estate involves the use of GAAP. Any other method of accounting for real estate such as the fair value me tho d cannot be construed to be any more accurate or relevant than the comparable methodologies of real estate valuation found in GAAP. Nevertheless, we believe that the use of FFO, which excludes the impact of real estate related depreciation and amortization, am ong other things, provides a more complete understanding of our performance to investors and to management, and when compared yea r over year, reflects the impact on our operations from trends in occupancy rates, rental rates, operating costs, general and a dmi nistrative expenses, and interest costs, which may not be immediately apparent from net income. However, FFO and adjusted funds from operations (“AFFO”), as described below, should not be construed to be more relevant or accurate than the current GAAP method olo gy in calculating net income or in its applicability in evaluating our operating performance. The method utilized to evaluate th e v alue and performance of real estate under GAAP should be construed as a more relevant measure of operational performance and considere d more prominently than the non - GAAP FFO and AFFO measures and the adjustments to GAAP in calculating FFO and AFFO. Other REITs may not define FFO in accordance with the current NAREIT definition (as we do) or may interpret the current NAREIT defi nit ion differently than we do and/or AFFO differently than we do. Consequently, our presentation of FFO and AFFO may not be comparab le to other similarly titled measures presented by other REITs. We consider FFO and AFFO useful indicators of our performance. Because FFO calculations exclude such factors as depreciation and amortization of real estate assets and gains or losses from sales of operating real estate assets (which can vary among owner s o f identical assets in similar conditions based on historical cost accounting and useful - life estimates), FFO facilitates compariso ns of operating performance between periods and between other REITs in our peer group.
Definitions (Continued) 17 Changes in the accounting and reporting promulgations under GAAP (for acquisition fees and expenses from a capitalization/dep rec iation model to an expensed - as - incurred model) that were put into effect in 2009 and other changes to GAAP accounting for real estate s ubsequent to the establishment of NAREIT's definition of FFO have prompted an increase in cash - settled expenses, specifically acquisition fees and expenses for all industries as items that are expensed under GAAP, that are typically accounted for as operating expenses. We exclude certain income or expense items from AFFO that we consider more reflective of investing activities, other non - cash in come and expense items and the income and expense effects of other activities that are not a fundamental attribute of our business pla n. These items include early extinguishment of debt and unrealized gains and losses, which may not ultimately be realized, such as gains or los ses on derivative instruments, gains and losses on foreign currency transactions, and gains and losses on investments. In addition, by excluding non - cash income and expense items such as amortization of above - market and below - market leases intangibles, amortization of defe rred financing costs, straight - line rent and equity - based compensation from AFFO, we believe we provide useful information regarding income and expense items which have a direct impact on our ongoing operating performance. We also include the realized gains or losses o n f oreign currency exchange contracts for AFFO as such items are part of our ongoing operations and affect the current operating perfor man ce of the Company. By providing AFFO, we believe we are presenting useful information that assists investors and analysts to better ass ess the sustainability of our ongoing operating performance without the impacts of transactions that are not related to the ongoing p rof itability of our portfolio of properties. We also believe that AFFO is a recognized measure of sustainable operating performance by the REIT i ndu stry. Further, we believe AFFO is useful in comparing the sustainability of our operating performance with the sustainability of th e o perating performance of other real estate companies. However, AFFO is not indicative of cash available to fund ongoing cash needs, inc lud ing the ability to make cash distributions. Investors are cautioned that AFFO should only be used to assess the sustainability of our op erating performance excluding these activities, as it excludes certain costs that have a negative effect on our operating performance du ring the periods in which these costs are incurred. As a result, we believe that the use of AFFO, together with the required GAAP presentations, provides a more complete underst and ing of our performance relative to our peers and a more informed and appropriate basis on which to make decisions involving operating, f ina ncing, and investing activities. In calculating AFFO, we exclude certain expenses, which under GAAP are characterized as operating expenses in determining ope rat ing net income. All paid and accrued merger, acquisition and transaction related fees and certain other expenses negatively impact ou r o perating performance during the period in which expenses are incurred or properties are acquired will also have negative effects on re tur ns to investors, but are not reflective of our on - going performance. AFFO that excludes such costs and expenses would only be comparab le to companies that did not have such activities. Further, under GAAP, certain contemplated non - cash fair value and other non - cash ad justments are considered operating non - cash adjustments to net income. In addition, as discussed above, we view gains and losses from fair value adjustments as items which are unrealized and may not ultimately be realized and not reflective of ongoing operations and are th erefore typically adjusted for when assessing operating performance. Excluding income and expense items detailed above from our calcu lat ion of AFFO provides information consistent with management's analysis of the operating performance of the Company. Additionally, fa ir value adjustments, which are based on the impact of current market fluctuations and underlying assessments of general market condit ion s, but can also result from operational factors such as rental and occupancy rates, may not be directly related or attributable to our c urr ent operating performance. By excluding such changes that may reflect anticipated and unrealized gains or losses, we believe AFFO provides use ful supplemental information.
Definitions (Continued) 18 We believe that earnings before interest, taxes, depreciation and amortization adjusted for acquisition and transaction - related expenses, other non - cash items and including our pro - rata share from unconsolidated joint ventures ("Adjusted EBITDA") is an appropriate measure of our ability to incur and service debt. Adjusted EBITDA should not be considered as an alternative to cash flows from operating activities, a s a measure of our liquidity or as an alternative to net income as an indicator of our operating activities. Other REITs may calculate Adjusted EBI TDA differently and our calculation should not be compared to that of other REITs. Net operating income ("NOI") is a non - GAAP financial measure equal to net income (loss), the most directly comparable GAAP finan cial measure, less discontinued operations, interest, other income and income from preferred equity investments and investment securities, plu s corporate general and administrative expense, acquisition and transaction - related expenses, depreciation and amortization, other non - cash expenses and interest expense. NOI is adjusted to include our pro rata share of NOI from unconsolidated joint ventures. We use NOI interna lly as a performance measure and believe NOI provides useful information to investors regarding our financial condition and results of operations bec ause it reflects only those income and expense items that are incurred at the property level. Therefore, we believe NOI is a useful measure fo r e valuating the operating performance of our real estate assets and to make decisions about resource allocations. Further, we believe NOI is use ful to investors as a performance measure because, when compared across periods, NOI reflects the impact on operations from trends in occupanc y r ates, rental rates, operating costs and acquisition activity on an unlevered basis, providing perspective not immediately apparent from ne t i ncome. NOI excludes certain components from net income in order to provide results that are more closely related to a property's results of operations. For example, interest expense is not necessarily linked to the operating performance of a real estate asset and is often incurred at the corporate level as opposed to the property level. In addition, depreciation and amortization, because of historical cost accounting and usefu l l ife estimates, may distort operating performance at the property level. NOI presented by us may not be comparable to NOI reported by other REITs th at define NOI differently. We believe that in order to facilitate a clear understanding of our operating results, NOI should be examined in co njunction with net income (loss) as presented in our consolidated financial statements. NOI should not be considered as an alternative to net in com e (loss) as an indication of our performance or to cash flows as a measure of our liquidity. Cash net operating income, or Cash NOI, is a non - GAAP financial measure that is intended to reflect the performance of our prope rties. We define Cash NOI as net operating income (which is separately defined herein) excluding amortization of above/below market lease inta ngi bles and straight - line adjustments that are included in GAAP lease revenues. We believe that Cash NOI is a helpful measure that both inve stors and management can use to evaluate the current financial performance of our properties and it allows for comparison of our operat ing performance between periods and to other REITs. Cash NOI should not be considered as an alternative to net income, as an indication of ou r f inancial performance, or to cash flows as a measure of liquidity or our ability to fund all needs. The method by which we calculate an d p resent Cash NOI may not be directly comparable to the way other REITs present Cash NOI.