Attached files
| file | filename |
|---|---|
| 8-K - SANDLER O'NEILL INVESTOR PRESENTATION NOVEMBER 2016 - INDEPENDENT BANK CORP | sandleroneillinvestorprese.htm |

Sandler O’Neill East Coast Financial Services
November 17, 2016
Robert Cozzone – Chief Financial Officer and Treasurer
Mark Ruggiero – SVP, Controller and Principal Accounting Officer
Exhibit 99.1

(2)
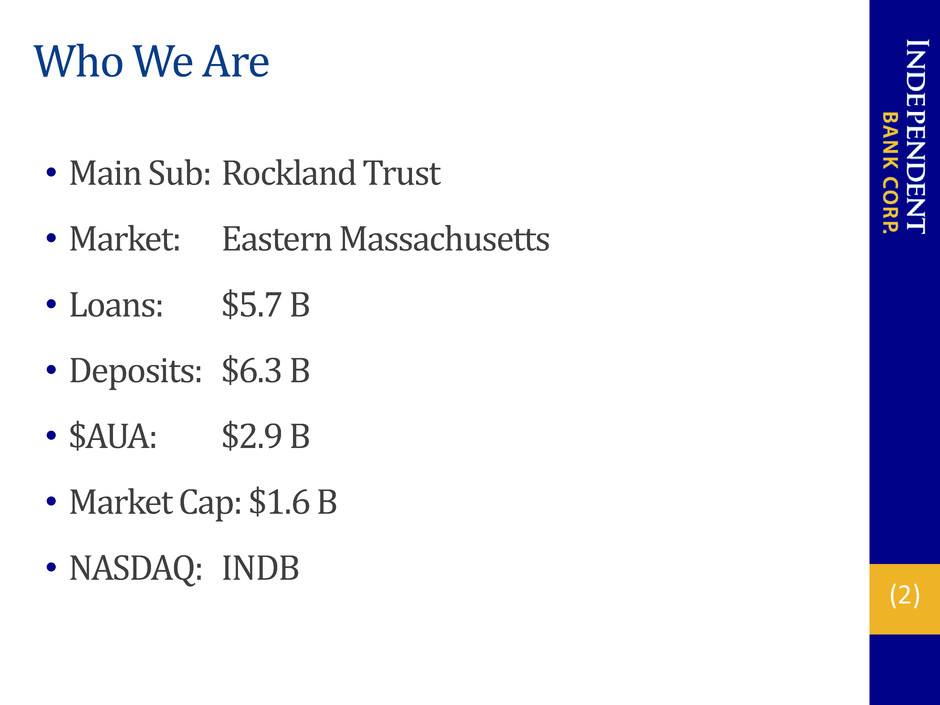
Who We Are
• Main Sub: Rockland Trust
• Market: Eastern Massachusetts
• Loans: $5.7 B
• Deposits: $6.3 B
• $AUA: $2.9 B
• Market Cap: $1.6 B
• NASDAQ: INDB

(3)
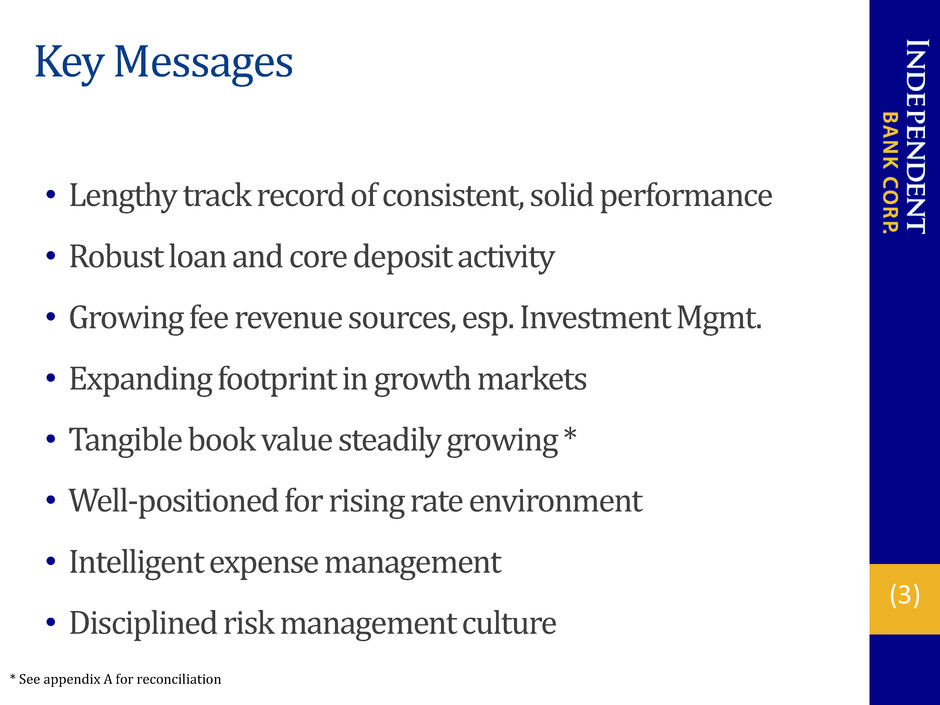
Key Messages
• Lengthy track record of consistent, solid performance
• Robust loan and core deposit activity
• Growing fee revenue sources, esp. Investment Mgmt.
• Expanding footprint in growth markets
• Tangible book value steadily growing *
• Well-positioned for rising rate environment
• Intelligent expense management
• Disciplined risk management culture
* See appendix A for reconciliation

(4)
Expanding Company Footprint
Rank 2016
1 23.5% 39%
Rank 2016
5 4.9% 18%
Rank 2016
3 12.3% 14%
Rank 2016
6 7.9% 12%
Rank 2016
19 1.2% 10%
Rank 2016
17 0.3% 4%
Rank 2016
2 19.7% 2%
Rank 2016
31 0.3% 1%
Suffolk County
Bristol County
Worcester County
Dukes County (MV)
Middlesex County
Norfolk County
% of
INDB Dep.Share
Barnstable County (Cape Cod)
Market
Plymouth County
Source: SNL Financial; Deposit/Market Share data as of October 20, 2016.
*Pro forma for pending Island Bancorp, Inc. acquisition
*

(5)
Recent Accomplishments
• Three consecutive years of record earnings
• Reached agreement to acquire Island Bancorp, Inc. of
Martha’s Vineyard
• Finalized acquisition of New England Bancorp, Inc. of
Cape Cod
• Capitalizing on expansion moves in vibrant Greater
Boston market
• Growth initiatives – new equipment leasing product, new
N. Quincy branch, expanded digital offerings
• Strong household growth rate

(6)
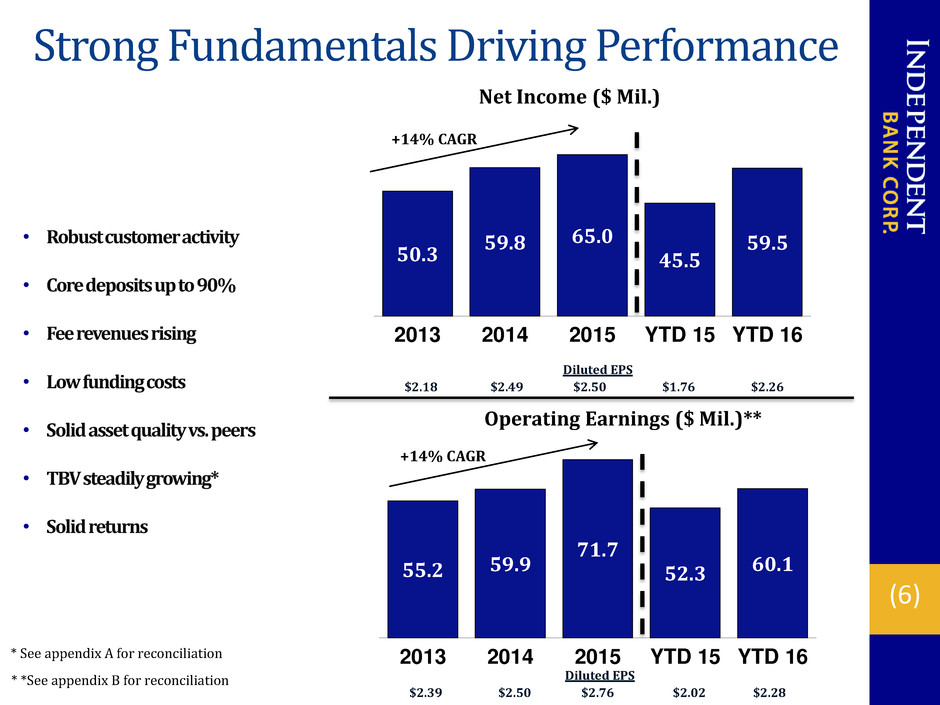
55.2 59.9
71.7
52.3 60.1
2013 2014 2015 YTD 15 YTD 16
Operating Earnings ($ Mil.)**
Strong Fundamentals Driving Performance
+14% CAGR
Diluted EPS
$2.18 $2.49 $2.50 $1.76 $2.26
• Robust customer activity
• Core deposits up to 90%
• Fee revenues rising
• Low funding costs
• Solid asset quality vs. peers
• TBV steadily growing*
• Solid returns
Diluted EPS
$2.39 $2.50 $2.76 $2.02 $2.28
* See appendix A for reconciliation
* *See appendix B for reconciliation
50.3
59.8 65.0
45.5
59.5
2013 2014 2015 YTD 15 YTD 16
Net Income ($ Mil.)
+14% CAGR

(7)
Vibrant Commercial Lending Franchise
TOTAL LOANS
$5.7 B
AVG. YIELD: 4.02%
3Q 2016
Comm'l
72%
Resi Mtg
11%
Home Eq
17%
• Long-term CRE/ C&I lender
• Strong name recognition in local markets
• Expanded market presence
• Experienced, knowledgeable lenders
• Commercial banker development program
• Growing in sophistication and capacity
• Increased small business focus
• Disciplined underwriting

(8)
Low Cost Deposit Base
Demand Deposits
32%
Money Market
19%
Savings/Now
39%
CDs
10%
TOTAL DEPOSITS
$6.3 B
AVG. COST: 0.17%
3Q 2016
• Sizable demand deposit
component
• Valuable source of liquidity
• Relationship-based approach
• Excellent household growth
• Expanded digital access
• Growing commercial base
CORE DEPOSITS: 90%

(9)
6.1
20.7
16.2
2006 2015 YTD 16
Revenues
($ Mil.)
816
2,883
2006 3Q16
AUAs
($ Mil.)
Investment Management :
Transformed Into High Growth Business
+253% +239%
• Successful business model
• Growing source of fee revenues
• Strong feeder business from Bank
• Expanding investment center locations
• Cross-sell opportunity in acquired bank markets
• Adding experienced professionals

(10)
Well-Positioned for Rising Rates:
Prudent Balance Sheet Management
-10%
-5%
0%
5%
10%
15%
20%
25%
30%
Year 0 Year 1 Year 2
%
In
cr
ease
o
n
N
et
In
te
re
st
In
co
m
e
Interest Rate Sensitivity
Down 100
Up 200
Up 400
Flat Up 200

(11)
Asset Quality: Well Managed
34.7
27.5 27.7 24.8
2013 2014 2015 3Q16
NPLs
($ Mil.)
8.8 8.5
0.8
-0.3
2013 2014 2015 YTD 16
Net Chargeoffs
($ Mil.)
NPL/Loan %
0.73% 0.55% 0.50% 0.43%
Peers 0.68%*
Loss Rate
19bp 18bp 1bp (1)bp
Peers 11bp*
* Source: FFIEC Peer Group 2; $3-10 Billion in Assets, June 30, 2016
Incl. 90 days + overdue

(12)
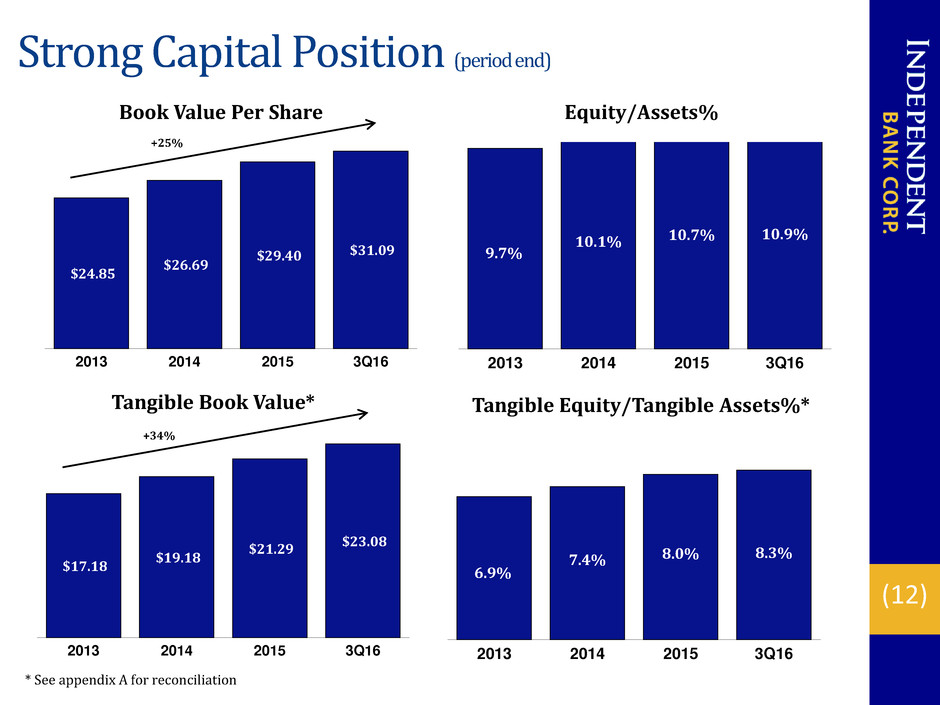
Strong Capital Position (period end)
6.9%
7.4% 8.0% 8.3%
2013 2014 2015 3Q16
Tangible Equity/Tangible Assets%*
$17.18
$19.18
$21.29
$23.08
2013 2014 2015 3Q16
Tangible Book Value*
+34%
* See appendix A for reconciliation
$24.85
$26.69
$29.40 $31.09
2013 2014 2015 3Q16
Book Value Per Share
+25%
Equity/Assets%
9.7%
10.1% 10.7% 10.9%
2013 2014 2015 3Q16

(13)
Strong Capital Position continued (period end)
8.6% 8.8%
9.3%
9.6%
2013 2014 2015 3Q16
Tier 1 Leverage %
• Strong internal capital generation
• No storehousing of excess capital
• No external equity raising
• No dividend cuts

(14)
Attentive to Shareholder Returns
$0.88
$0.96
$1.04
$0.87
2013 2014 2015 YTD 16
Cash Dividends Declared Per Share

(15)
Sustaining Business Momentum
Business Line
• Expand Market Presence/Recruit Seasoned Lenders
• Grow Client Base
• Expand Specialty Products, e.g. ABL, Leasing
• Lender Development Programs
Commercial
• Continue to Drive Household Growth
• Expand Digital Offerings
• Optimize Branch Network
Retail Delivery
• Capitalize on Strong Market Demographics
• Continue Strong Branch/Commercial Referrals
• Expand COI Relationships
Investment Management
• Continue Aggressive H.E. Marketing
• Scalable Resi Mortgage Origination Platform
Consumer Lending
Focal Points

(16)
Expanded Presence in Vibrant Greater Boston
Long-Term Commercial Lender in Greater Boston
Central Bancorp
$357MM Deposits
10 Branches – Nov. 2012
Investment Management
and Commercial Lending
Center
October 2013
Peoples Federal
Bancshares
$432MM Deposits
8 Branches – Feb. 2015

(17)
Island Bancorp Acquisition
Edgartown National Bank
• Profitable, well-managed community bank
• Provides first retail presence on M.V.
• Excellent complement to growing Cape Cod presence
• Financially attractive
• $0.03 - $0.04 EPS accretion expected in 2018
• Neutral to TBV
• Modest, low-risk deal
• Asset size: $194MM
• Transaction value: $24.5MM
• Expected to close in 2Q ‘17
INDB: A Proven Integrator

(18)
Building Franchise Value
Disciplined Acquisitions
Deal Value: $84.5MM
2% Core Dep. Premium*
Benjamin
Franklin Bancorp
Apr ‘09
$994mm Assets
$701mm Deposits
11 Branches
Deal Value: $52.0MM
8% Core Dep. Premium*
Central
Bancorp
Nov ‘12
$537mm Assets
$357mm Deposits
10 Branches
Deal Value: $40.3MM
8% Core Dep. Premium*
Mayflower
Bancorp
Nov’13
$243mm Assets
$219mm Deposits
8 Branches
$260 mm Assets
$214mm Deposits
Net 1 Branch
Deal Value: $41.7MM
12% Core Dep. Premium*
All Acquisitions Immediately Accretive
*Incl. CDs <$100k
Deal metrics based on closing price and actual acquired assets
New England Bancorp
Nov ‘16
Deal Value: $102.2 MM
17% Core Dep. Premium*
Slade’s Ferry
Bancorp
Mar ‘08
$630mm Assets
$411mm Deposits
9 Branches
Peoples Federal
Bancshares
Feb ’15
$640 mm Assets
$432mm Deposits
8 Branches
Deal Value: $141.8MM
10% Core Dep. Premium*
Island Bancorp
Q2 ‘17 (est.)
$194 mm Assets
$171mm Deposits
Net 4 Branches
Deal Value: $24.5MM
6% Core Dep. Premium*

(19)
Major Opportunities in Acquired Bank Markets:
Capitalizing on Rockland Trust Brand
Investment
Management
Commercial
Banking
Retail/
Consumer
• $2.9 billion AUA
• Wealth/Institutional
• Strong referral network
• Sophisticated products
• Expanded capacity
• In depth market knowledge
• Award winning customer service
• Electronic/mobile banking
• Competitive home equity products
Acquired Bank Customer Bases

(20)
Optimizing Retail Delivery Network
In the past twelve months we have:
• Acquired specialized analytics software/location model
• Shifted branch distribution
• Closed/consolidated 3
• Opened 1
• Redesigned 3
• Contracted ATM site in downtown Boston
• Implemented in-branch transaction balancing
• Transitioned to instant-issue debit cards

(21)
INDB Investment Merits
• High quality franchise in attractive markets
• Strong organic business volumes
• Growing brand recognition
• Operating platform that can be leveraged further
• Capitalizing on in-market consolidation opportunities
• Diligent stewards of shareholder capital
• Grounded management team
• Positioned to grow, build, and acquire to drive long-term value
creation

(22)
Appendix A
The following table reconciles Book Value per share, which is a GAAP based measure to Tangible Book Value per share, which
is a non-GAAP based measure. It also reconciles the ratio of Equity to Assets, which is a GAAP based measure, to Tangible
Equity to Tangible Assets, a non-GAAP measure, for the dates indicated:
2013 2014 2015 YTD16
(Dollars in thousands, except share and per share data)
Tangible common equity
Stockholders' equity (GAAP) $591,540 $640,527 $771,463 $818,242 (a)
Less: Goodwill and other intangibles 182,642 180,306 212,909 210,834
Tangible common equity 408,898 460,221 558,554 607,408 (b)
Tangible assets
Assets (GAAP) 6,099,234 6,364,912 7,210,038 7,502,009 (c)
Less: Goodwill and other intangibles 182,642 180,306 212,909 210,834
Tangible assets 5,916,592 6,184,606 6,997,129 7,291,175 (d)
Common shares 23,805,984 23,998,738 26,236,352 26,320,467 (e)
Common equity to assets ratio (GAAP) 9.70% 10.06% 10.70% 10.91% (a/c)
Tangible common equity to tangible assets ratio (Non-
GAAP) 6.91% 7.44% 7.98% 8.33% (b/d)
Book Value per share (GAAP) $24.85 $26.69 $29.40 $31.09 (a/e)
Tangible book value per share (Non-GAAP) $17.18 $19.18 $21.29 $23.08 (b/e)

(23)
Appendix B
The following table reconciles net income and diluted EPS, which are GAAP measures, to operating earnings and diluted EPS on an operating basis, which are Non-GAAP
measures as of the time periods indicated:
2013 2014 2015 YTD 15 YTD 16
(Dollars in thousands, except per share data)
Net income available to common shareholders (GAAP) $ 50,254 $ 2.18 $ 59,845 $ 2.49 $ 64,960 $ 2.50 $ 45,505 $ 1.76 $ 59,469 $ 2.26
Non-GAAP adjustments
Noninterest income components
Gain on extinguishment of debt (763) (0.03) - - - - - - - -
Gain on life insurance benefits (tax exempt) (227) (0.01) (1,964) (0.08) - - - - - -
Gain on sale of fixed income securities (258) (0.01) (121) (0.01) (798) (0.03) (798) (0.03) - -
Noninterest expense components
Impairment on acquired facilities - - 524 0.02 109 - 109 - - -
Loss on extinguishment of debt - - - - 122 0.01 122 0.01 437 0.02
Loss on sale of fixed income securities - - 21 0.00 1,124 0.04 1,124 0.04 - -
Loss on termination of derivatives 1,122 0.05 - - - -
Merger and acquisition expenses 8,685 0.38 1,339 0.06 10,501 0.41 10,501 0.41 691 0.03
Severance 325 0.01 - - - - - - - -
Total impact of noncore items 7,762 0.38 921 0.12 11,058 0.43 11,058 0.43 1,128 0.05
Net tax benefit associated with noncore items (2,837) (0.16) (866) (0.03) (4,285) (0.17) (4,285) (0.17) (461) (0.03)
Net operating earnings (Non-GAAP) $ 55,179 $ 2.40 $ 59,900 $ 2.58 $ 71,733 $ 2.76 $ 52,278 $ 2.02 $ 60,136 $ 2.28

(24)
NASDAQ Ticker: INDB
www.rocklandtrust.com
Robert Cozzone – CFO & Treasurer
Shareholder Relations:
(781) 982-6737
Statements contained in this presentation that are not historical facts are “forward-looking
statements” that are subject to risks and uncertainties which could cause actual results to differ
materially from those currently anticipated due to a number of factors, which include, but are not
limited to, factors discussed in documents filed by the Company with the Securities and Exchange
Commission from time to time.
