Attached files
| file | filename |
|---|---|
| 8-K - CHEMICAL FINANCIAL FORM 8-K - TCF FINANCIAL CORP | chem8k_111716.htm |
EXHIBIT 99.1

Creating a Preeminent Midwest Community Bank David B. Ramaker Chief Executive Officer Dennis L. Klaeser Chief Financial Officer November 17, 2016 Sandler O’Neill 2016 East Coast Financial Services Conference
| |

This presentation contains forward - looking statements that are based on management's beliefs, assumptions, current expectations, estimates and projections about the financial services industry, the economy and Chemical . Words and phrases such as "anticipates," "believes," "continue," "estimates," "expects," "forecasts," "future," "intends," "is likely," "judgment," "look ahead," "look forward," "on schedule," "opinion," "opportunity," "plans," "potential," "predicts," "probable," "projects," "should," "strategic," "trend," "will," and variations of such words and phrases or similar expressions are intended to identify such forward - looking statements . Such statements are based upon current beliefs and expectations and involve substantial risks and uncertainties which could cause actual results to differ materially from those expressed or implied by such forward - looking statements . These statements include, among others, statements related to future levels of loan charge - offs, future levels of provisions for loan losses, real estate valuation, future levels of nonperforming assets, the rate of asset dispositions, future capital levels, future dividends, future growth and funding sources, future liquidity levels, future profitability levels, future deposit insurance premiums, future asset levels, the effects on earnings of future changes in interest rates, the future level of other revenue sources, future economic trends and conditions, future initiatives to expand Chemical’s market share, expected performance and cash flows from acquired loans, future effects of new or changed accounting standards, future opportunities for acquisitions, opportunities to increase top line revenues, Chemical’s ability to grow its core franchise, future cost savings and Chemical’s ability to maintain adequate liquidity and capital based on the requirements adopted by the Basel Committee on Banking Supervision and U . S . regulators . All statements referencing future time periods are forward - looking . Management's determination of the provision and allowance for loan losses ; the carrying value of acquired loans, goodwill and mortgage servicing rights ; the fair value of investment securities (including whether any impairment on any investment security is temporary or other - than - temporary and the amount of any impairment) ; and management's assumptions concerning pension and other postretirement benefit plans involve judgments that are inherently forward - looking . There can be no assurance that future loan losses will be limited to the amounts estimated . All of the information concerning interest rate sensitivity is forward - looking . The future effect of changes in the financial and credit markets and the national and regional economies on the banking industry, generally, and on Chemical, specifically, are also inherently uncertain . These statements are not guarantees of future performance and involve certain risks, uncertainties and assumptions ("risk factors") that are difficult to predict with regard to timing, extent, likelihood and degree of occurrence . Therefore, actual results and outcomes may materially differ from what may be expressed or forecasted in such forward - looking statements . Chemical undertakes no obligation to update, amend or clarify forward - looking statements, whether as a result of new information, future events or otherwise . Forward - Looking Statements & Other Information 2
| |
This presentation also contains forward - looking statements regarding Chemical's outlook or expectations with respect to its merger with Talmer, including the benefits of the transaction, the expected costs to be incurred and cost savings to be realized in connection with the transaction, the expected impact of the transaction on Chemical's future financial performance, and consequences of the integration of Talmer into Chemical . The pro forma financial information is not a guarantee of future results and is presented for informational purposes only . Risk factors relating to the merger and the integration of Talmer into Chemical include, without limitation : • The anticipated cost savings and strategic gains, may be significantly harder or take longer to achieve than expected or may not be achieved in their entirety as a result of unexpected factors or events . • The integration of Talmer's business and operations into Chemical may take longer than anticipated or be more costly than anticipated or have unanticipated adverse results relating to Talmer’s or Chemical's existing businesses . • Chemical’s ability to achieve anticipated results from the transaction is dependent on the state of the economic and financial markets going forward . Specifically, Chemical may incur more credit losses than expected and customer and employee attrition may be greater than expected . • The outcome of pending or threatened litigation, whether currently existing or commencing in the future, including litigation related to the merger . • The challenges of integrating , retaining and hiring key personnel . • Failure to attract new customers and retain existing customers in the manner anticipated . In addition, risk factors include, but are not limited to, the risk factors described in Item 1 A of Chemical's Annual Report on Form 10 - K for the year ended December 31 , 2015 . These and other factors are representative of the risk factors that may emerge and could cause a difference between an ultimate actual outcome and a forward - looking statement . Non - GAAP Financial Measures This presentation contains certain non - GAAP financial measures that are not in accordance with U . S . generally accepted accounting principles (GAAP) . Chemical uses certain non - GAAP financial measures to provide meaningful, supplemental information regarding its operational results and to enhance investors’ overall understanding of Chemical’s financial performance . The limitations associated with non - GAAP financial measures include the risk that persons might disagree as to the appropriateness of items comprising these measures and that different companies might calculate these measures differently . These disclosures should not be considered an alternative to Chemical’s GAAP results . For a reconciliation of these non - GAAP financial measures to the most directly comparable GAAP financial measure , see non - GAAP reconciliation slides located in the Supplemental Information . Forward - Looking Statements & Other Information (continued) 3
| |

[Map on left side of page, same style. [same setup, Ohio / Michigan and then regional markets (same as following page) Show: Rank, branches, dms, market share Show: GDP For each state and % of gdp in each region, same Chemical/Talmer MOE creates significant value opportunity for shareholders 5 4 1 Demonstrated track record of organic growth 2 High Performing Pro Forma profitability should drive upside 3 Experienced and committed Board & management team Created the largest community bank headquartered in Michigan x Significant EPS accretion x Combined earnings and synergies efficiently absorb incremental regulatory costs from crossing over $10 billion in assets x Proven organic growth initiatives x Leadership in EPS growth among peers x Total Return out - performance (peers and indices) x Pro Forma 1.2%+ ROA, ROATCE approaching 15%, low efficiency ratio x Stable, clean NIM, attractive asset quality, strong capital x Significant revenue enhancements available x Strong governance, holding company Board of Directors comprised of 7 CHFC & 5 TLMR directors x Combination creates a strong, committed and experienced management team x Combined resources provide potential for significant organic growth in Southeast Michigan x Combined footprint has access to 96% of Michigan’s businesses (1) x Customer - facing staff substantially retained due to complementary markets (1) Source: SNL Geographic Intelligence Overview 4
| |

□ $17.4 billion in assets ▪ Largest banking company headquartered and operating branches in Michigan ▪ Operates 253 banking offices primarily in Michigan, Northeast Ohio and Northern Indiana ▪ Local market knowledge and business development opportunities led by 23 community - based advisory boards ▪ One of the largest trust and wealth management operations of a Michigan - headquartered bank with $4.37 billion in assets under management or custody and another $1.36 billion in assets within the Chemical Financial Advisors Program □ Focused on realizing operating and business synergies from Chemical / Talmer merger and enhancing preparedness for future organic and acquisitive growth □ $3.48 billion Market Capitalization (1) (1) Based upon CHFC shares outstanding of 70.5 million and the CHFC stock price of $49.40 on November 11, 2016. About Chemical Financial Corporation 5
| |

□ “Local ” community bank ▪ Strong belief in the community banking concept ▪ 23 identified centers of influence ▪ Community - driven leadership, rapid local response ▪ Emphasis on building relationships ▪ We know our markets, what works, and what does not work □ Strong credit culture ▪ Diversification ▪ In - depth knowledge of our customers and markets ▪ Underwriting discipline □ Low cost, stable, core funding – starts at relationship level □ Expense management and control □ Clean balance sheet, solid capital ratios and intense focus on effective capital deployment □ Identify, hire, motivate and retain talented individuals to carry out our relationship strategies □ Sustain long - term growth through combination of organic and acquisitive growth ▪ Higher lending limits provide enhanced middle market lending growth opportunities ▪ Opportunities for fee income growth from Wealth Management and Mortgage Banking synergies ▪ Future acquisitive growth opportunities in Michigan, Ohio, and Indiana Scalable Core Strategies & Disciplines Core Values 6
| |

CHFC is Largest MI - Headquartered Bank CHFC Operating Markets Source: SNL Financial. Deposit data as of 6/30/2016. Note: CHFC’s two branches in Northern Indiana are excluded from the Southwest Michigan region. (1) Local is defined as banks headquartered in Michigan Northern Michigan Southeast Michigan Southwest Michigan Central Michigan Northern Ohio Deposit Market Share Rank Number of Branches Deposits in Market ($000) Market Share (%) Central Michigan 1 62 2,945,718 19.8% Northern Michigan 1 58 2,104,274 17.5% Southwest Michigan 3 77 3,247,458 8.9% Southeast Michigan 9 30 2,983,852 2.3% Northern Ohio 13 26 1,223,393 1.2% Vision: Creating a Preeminent Midwest Community Bank Rank "Local" Rank (1) Institution (ST) Branches Deposits ($mm) Market Share (%) 1 JPMorgan Chase & Co. (NY) 242 42,007 21.0% 2 Comerica Inc. (TX) 215 26,964 13.5% 3 PNC Financial Services Group (PA) 197 17,326 8.7% 4 Bank of America Corp. (NC) 121 16,564 8.3% 5 Fifth Third Bancorp (OH) 218 16,073 8.0% 6 Huntington Bancshares Inc. (OH) 367 15,212 7.6% 7 1 Chemical Financial Corp. (MI) 227 11,281 5.6% 8 2 Flagstar Bancorp Inc. (MI) 99 8,773 4.4% 9 Citizens Financial Group Inc. (RI) 98 5,138 2.6% 10 TCF Financial Corp. (MN) 53 2,908 1.5% 11 Wells Fargo & Co. (CA) 18 2,812 1.4% 12 3 Mercantile Bank Corp. (MI) 48 2,282 1.1% 13 4 Independent Bank Corp. (MI) 64 2,152 1.1% 14 5 Macatawa Bank Corp. (MI) 30 1,360 0.7% 15 KeyCorp (OH) 23 1,334 0.7% Totals (1 - 123) 2,697 200,386 100.0% 7
| |

Milwaukee Milwaukee Milwaukee Milwaukee Milwaukee Milwaukee Milwaukee Milwaukee Milwaukee Pittsburgh Pittsburgh Pittsburgh Pittsburgh Pittsburgh Pittsburgh Pittsburgh Pittsburgh Pittsburgh Jefferson Chicago Chicago Chicago Chicago Chicago Chicago Chicago Chicago Chicago Milwaukee Milwaukee Milwaukee Milwaukee Milwaukee Milwaukee Milwaukee Milwaukee Milwaukee Overlapping Michigan Markets New Michigan & Ohio Markets Other Markets Southwest MI Central MI Southeast MI Northern OH Northern MI (1) Source: USDOC’s Bureau of Economic Analysis. Considered the largest Metropolitan Statistical Area for each region. The North ern Michigan region does not have a Metropolitan Statistical Area as defined by the Bureau of Economic Analysis (2) State Deposits are in billions per SNL Financial and as of 6/30/16 (3) Source: SNL Geographic Intelligence CHFC: Deposits / Rank $3.2 #3 CHFC: Deposits / Rank $2.9 #1 CHFC: Deposits / Rank $2.1 #1 CHFC: Deposits / Rank $3.0 #9 CHFC: Deposits / Rank $1.2 #13 All Major MI Markets & OH Growth Opportunity 96% of businesses / 97% of population is within MI footprint (3) Southeast Michigan represents more than 50% of Michigan GDP – a huge opportunity with recent market disruption CHFC Footprint By State & Regional Market MI OH Southwest MI Central MI Northern MI Southeast MI Northern OH Michigan Penetration Total Deposits ($B) $11.3 $1.2 $3.2 $2.9 $2.1 $3.0 $1.2 Market Share Rank 7 23 3 1 1 9 13 Deposit Market Share (%) 5.6% 0.4% 8.9% 19.8% 17.5% 2.3% 1.2% Market Information (as a % of): % of State ($B) GDP (1) 12% 2% - 53% 22% % of State Deposits (2) 18% 7% 6% 66% 33% 97% % of State Businesses (3) 25% 13% 11% 47% 39% 96% % of State Population (3) 25% 13% 9% 49% 37% 97% 8
| |

□ Michigan ranks 6 th in the country for its creation of nearly 450,000 jobs since late 2010 (1) □ Unemployment has dropped from 14.9% in June 2009 to 4.6% in Sept 2016 (2) □ Michigan GDP growth outpaced the nation from 2009 - 2014 with growth of 13.4% to 9.4% (3) □ Ranks as 7 th most competitive state for new business investment by Site Selection Magazine (4) □ New investment from global companies has grown by $8.4 billion since 2010 (5) □ From 2 nd worst to 13 th best corporate tax climate as rated by Tax Foundation □ 10 th largest state by population □ 8 th ranked state in number of skilled trade workers (2) □ Top ranked state in the country for electrical, mechanical and industrial engineers (2) □ A $1.5 billion structural budget deficit has been eliminated (6) □ Extensive recent investment in infrastructure □ Passage of Right - to - Work legislation and other pro - innovation policies in recent years Recent Performance Assets for Future Growth 1) Michigan Economic Development Corporation 2) US Bureau of Labor Statistics 3) Michigan Economic Development Corporation 4) January 2016 5) FDImarkets.com 6) Michigan Department of Technology, Management and Budget Economic Momentum in Michigan 9
| |

Board of Directors: 12 Members CHFC: 7 Board Members TLMR: 5 Board Members Gary Torgow Chairman of the Board David Ramaker CEO & President David Provost Vice Chairman Co - Architect of Talmer ; Founder/Chairman of the Sterling Group. Chief Executive Officer and President of Chemical Financial. Mr. Ramaker was appointed Chief Executive Officer and President in January 2002 and served as Chairman from April 2006 until August 2016 Co - Architect of Talmer and served as its President and CEO since December 2009; Former Chairman and CEO of The PrivateBank – Michigan, which was a subsidiary of Chicago - based PrivateBancorp, Inc. Franklin C. Wheatlake Gary E. Anderson James R. Fitterling Ronald A. Klein Richard M. Lievense Barbara J. Mahone John E. Pelizzari Larry D. Stauffer Arthur A. Weiss Lead Director since 2014, Chairman of Utility Supply and Construction Company, dealer/principal of Crossroads Chevrolet Retired Chairman, President and CEO of the Dow Corning Corporation President and COO of The Dow Chemical Company Director and CEO of Origen Financial, appointed to the BoD of Sun Communities in 2015 Founder and Chairman of Lake Michigan Financial Corporation and InSite Capital, LLC Retired from GM in 2008 as Executive Director, HR Director since 2014, previously served as Chairman of Northwestern Bancorp, COO of Burnette Foods, Inc. Former President of Auto Paint Inc. and Auto Wares Tool Company from 1984 to 2007 Shareholder and Chairman of the law firm of Jaffe Raitt Heuer & Weiss Governance: CHFC Board of Directors 10
| |

Chairman, CEO, President David Ramaker Special Projects Lori Gwizdala CFO Dennis Klaeser COO - Business Operations Leonardo Amat COO – Customer Experience Robert Rathbun Regional & Community Banking Thomas Shafer Commercial Lending Daniel Terpsma Chief Credit Officer James Tomczyk CRO Lynn Kerber General Counsel William Collins Vice Chairman Thomas Kohn □ Truly a combined management team taking best talent from both organizations □ Combined management and governance line - up provides integration benefits and guidance Executive Management Team - David Ramaker , Chairman of the Board of Directors, CEO and President - Thomas Kohn , Vice Chairman - Lori Gwizdala , EVP, Special Projects - Dennis Klaeser , EVP, Chief Financial Officer - Leonardo Amat, EVP, Chief Operating Officer – Business Operations - Robert Rathbun , EVP, Chief Operating Officer – Customer Experience - Thomas Shafer , EVP, Director of Regional and Community Banking - Daniel Terpsma , EVP, Director of Commercial Lending - James E. Tomczyk, EVP, Chief Credit Officer - Lynn Kerber , EVP, Chief Risk Officer - William Collins , EVP, General Counsel Deep & Experienced Executive Team Chemical Bank’s Executive Leadership Team 11
| |

□ Chemical Financial has integrated 26 whole - bank mergers/acquisitions since 1973 and acquired another 36 bank offices during that time ▪ Five major post - recession mergers/acquisitions (OAK Financial, Independent Bank branches, Northwestern Bancorp, Lake Michigan Financial Corporation (parent company for The Bank of Holland, The Bank of Northern Michigan) and Talmer Bancorp ▪ Five whole bank mergers/acquisitions (Northwestern Bank, Monarch Community Bank, The Bank of Holland, The Bank of Northern Michigan and Talmer Bank and Trust) during the past 24 months □ Newly joined CHFC executives from the merger with TLMR had extensive experience acquiring and integrating banks ▪ Four FDIC assisted acquisitions totaling $2.4 billion in assets (CF Bancorp, First Banking Center, Community Central Bank, and Peoples State Bank) ▪ Two Section 363 bankruptcy acquisitions totaling $3.6 billion (First Place Bank and Michigan Commerce Bank) ▪ One whole bank acquisition of First of Huron with assets of $228 million. □ All acquisitions by both Chemical and Talmer have been integrated within initially planned timeframes □ Exhibited the ability to divest non - core, non - strategic branches Integration: A Core Competency 12
| |

□ $52 million cost savings opportunities have been identified and on track for full realization in 2017 □ Key core and all ancillary systems selected and implementation completed □ Planning for comprehensive DFAST implementation has been initiated □ Recruiting efforts underway to hire additional sales talent in middle market commercial lending and wealth management □ Integration management team featuring leaders from both organizations meeting weekly to recognize opportunities and manage progress ▪ Holding company merger completed August 31, 2016 ▪ Bank consolidation and system conversion completed in November 2016 ▪ Core competency ▪ Closed 7 branches in association with the bank consolidation; currently operating 246 branches Integration Progress Proceeding on Schedule 13
| |

Source: SNL Financial, Company documents Commercial 25.4% CRE 32.9% C&D 5.1% Res Mtg 32.2% NIB 26.9% IBD 24.4% MMDA & SAV 27.8% Time 20.9% NIB 21.8% IBD 17.3% MMDA & SAV 24.0% Time 36.9% NIB 24.6% IBD 25.0% MMDA & SAV 25.2% Time 25.2% MRQ Yield on Loans: 4.19% Total Loans: $7.7bn MRQ Yield on Loans: 4.66% Total Loans: $5.1bn MRQ Cost of Deposits: 0.23% Total Deposits: $7.5bn MRQ Cost of Deposits: 0.42% Total Deposits: $5.3bn Consumer 3.4% Commercial 25.5% CRE 28.2% C&D 3.7% Res Mtg 19.5% Consumer 23.0% Commercial 24.9% CRE 29.7% C&D 3.9% Res Mtg 24.0% Consumer 17.6% Loan Composition Deposit Composition Chemical Financial Corporation Talmer Bancorp, Inc. Chemical Financial Corporation Chemical Financial Corporation Talmer Bancorp, Inc. MRQ Yield on Loans: 4.12% Total Loans: $12.7bn MRQ Cost of Deposits: 0.24% Total Deposits: $13.3bn Diversified Loan Portfolio and Low Cost Core Deposit Base 14 Chemical Financial Corporation June 30, 2016 September 30, 2016
| |

0.00 0.10 0.20 0.30 0.40 0.50 0.60 0.70 0.80 0.90 $ Per Share Performance & Expectations Analyst Consensus □ Consistent growth and performance for shareholders through economic cycles □ Merger creates the opportunity to strengthen the foundation for delivering sustainable, strong EPS growth into the future Source: SNL Financial Consensus EPS Consensus Dividend SNL Core EPS Common Dividend Consistent EPS Growth Performance 15
| |

Closing Remarks & Questions David B. Ramaker Chief Executive Officer Dennis L. Klaeser Chief Financial Officer November 17, 2016 Sandler O’Neill 2016 East Coast Financial Services Conference
| |

Supplemental Information David B. Ramaker Chief Executive Officer Dennis L. Klaeser Chief Financial Officer November 17, 2016
| |
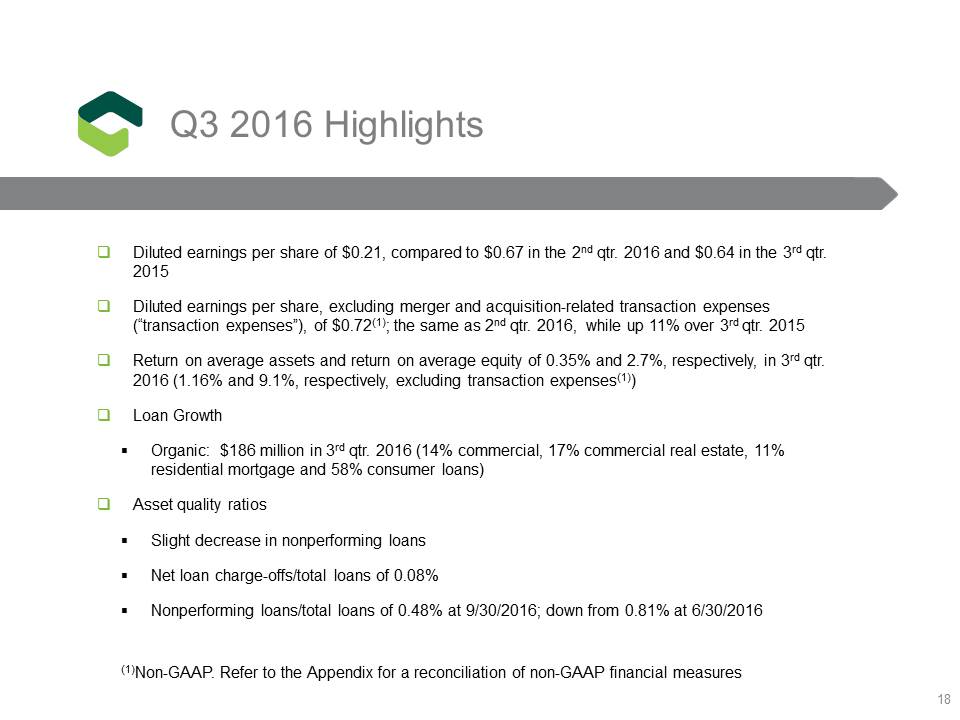
Q3 2016 Highlights □ Diluted earnings per share of $0.21, compared to $0.67 in the 2 nd qtr. 2016 and $0.64 in the 3 rd qtr. 2015 □ Diluted earnings per share, excluding merger and acquisition - related transaction expenses (“transaction expenses”), of $0.72 (1) ; the same as 2 nd qtr. 2016, while up 11% over 3 rd qtr. 2015 □ Return on average assets and return on average equity of 0.35% and 2.7%, respectively, in 3 rd qtr. 2016 (1.16% and 9.1%, respectively, excluding transaction expenses (1) ) □ Loan Growth ▪ Organic: $186 million in 3 rd qtr. 2016 (14% commercial, 17% commercial real estate, 11% residential mortgage and 58% consumer loans) □ Asset quality ratios ▪ Slight decrease in nonperforming loans ▪ Net loan charge - offs/total loans of 0.08% ▪ Nonperforming loans/total loans of 0.48% at 9/30/2016; down from 0.81% at 6/30/2016 (1) Non - GAAP. Refer to the Appendix for a reconciliation of non - GAAP financial measures 18
| |
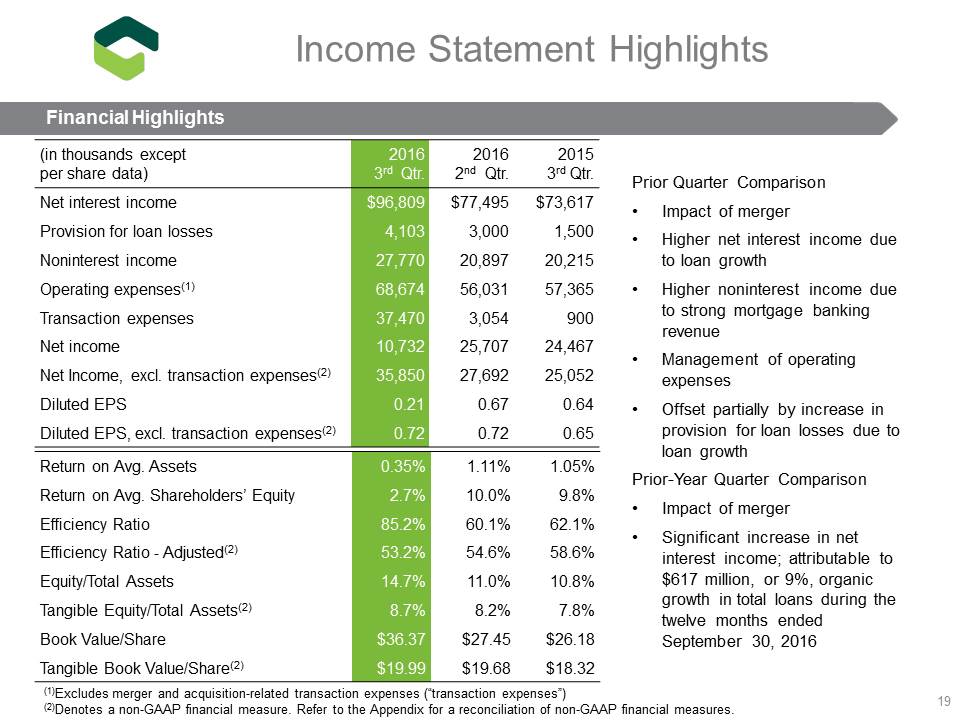
(in thousands except per share data) 2016 3 rd Qtr. 2016 2 nd Qtr. 2015 3 rd Qtr. Net interest income $96,809 $77,495 $73,617 Provision for loan losses 4,103 3,000 1,500 Noninterest income 27,770 20,897 20,215 Operating expenses (1) 68,674 56,031 57,365 Transaction expenses 37,470 3,054 900 Net income 10,732 25,707 24,467 Net Income, excl. transaction expenses (2) 35,850 27,692 25,052 Diluted EPS 0.21 0.67 0.64 Diluted EPS, excl. transaction expenses (2) 0.72 0.72 0.65 Return on Avg. Assets 0.35% 1.11% 1.05% Return on Avg. Shareholders’ Equity 2.7% 10.0% 9.8% Efficiency Ratio 85.2% 60.1% 62.1% Efficiency Ratio - Adjusted (2) 53.2% 54.6% 58.6% Equity/Total Assets 14.7% 11.0% 10.8% Tangible Equity/Total Assets (2) 8.7% 8.2% 7.8% Book Value/Share $36.37 $27.45 $26.18 Tangible Book Value/Share (2) $19.99 $19.68 $18.32 19 Prior Quarter Comparison • Impact of merger • Higher net interest income due to loan growth • Higher noninterest income due to strong mortgage banking revenue • Management of operating expenses • Offset partially by increase in provision for loan losses due to loan growth Prior - Year Quarter Comparison • Impact of merger • Significant increase in net interest income; attributable to $617 million , or 9 %, organic growth in total loans during the twelve months ended September 30, 2016 (1) Excludes merger and acquisition - related transaction expenses (“transaction expenses”) (2) Denotes a non - GAAP financial measure. Refer to the Appendix for a reconciliation of non - GAAP financial measures. Income Statement Highlights Financial Highlights
| |
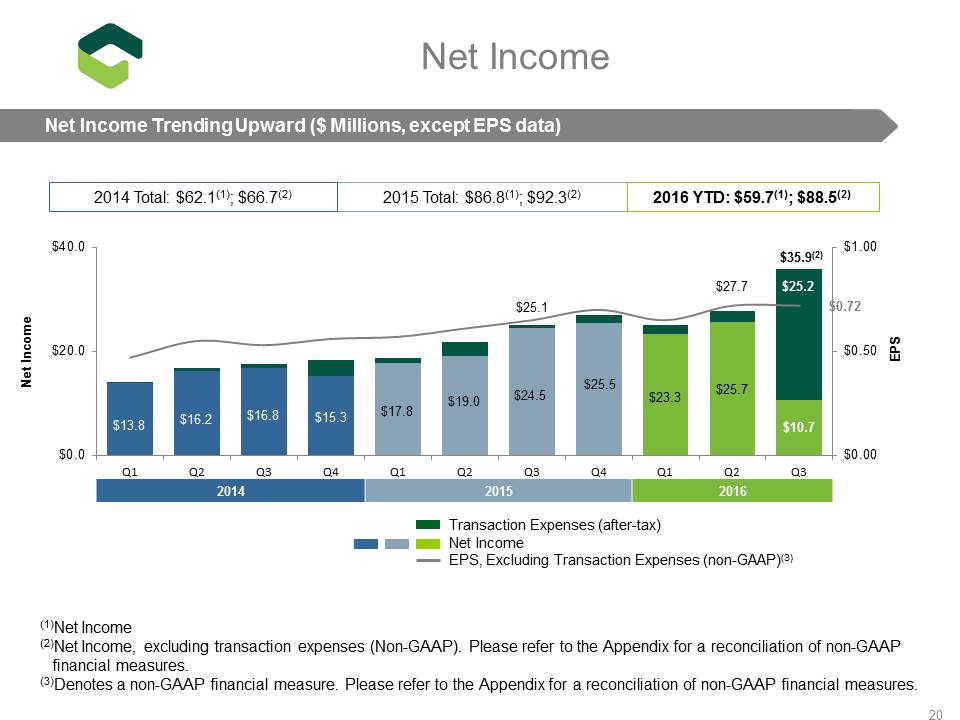
$13.8 $16.2 $16.8 $15.3 $17.8 $19.0 $24.5 $25.5 $ 23.3 $25.7 $10.7 $0.47 $0.72 $0.00 $0.50 $1.00 $0.0 $20.0 $40.0 Q1 Q2 Q3 Q4 Q1 Q2 Q3 Q4 Q1 Q2 Q3 EPS Net Income Transaction Expenses (after - tax) Net Income EPS, Excluding Transaction Expenses (non - GAAP) (3) 2014 2015 2016 20 (1) Net Income ( 2 ) Net Income, excluding transaction expenses (Non - GAAP). Please refer to the Appendix for a reconciliation of non - GAAP financial measures. (3) Denotes a non - GAAP financial measure. Please refer to the Appendix for a reconciliation of non - GAAP financial measures. 2015 Total: $86.8 (1) ; $92.3 (2) 2014 Total : $62.1 (1) ; $66.7 (2) 2016 YTD: $59.7 (1) ; $88.5 (2) $25.1 $35.9 (2) $25.2 Net Income Net Income Trending Upward ($ Millions, except EPS data) $27.7
| |

$3,160 $4,274 $3,047 $2,235 $1,254 $1,930 $1,617 $644 $1,906 $2,344 $1,430 $1,591 Commercial CRE/C&D Residential Consumer Loan Portfolio Composition ($ Millions) 21 $74 $130 $85 $273 Commercial CRE/C&D Residential Consumer $1,180 $1,800 $1,532 $371 Talmer Merger Aug. 31, 2016 $562 $4,883 $5,445 Total Organic Growth Nine Months Ended Sept. 30, 2016 Growth – Nine months ended Sept. 30, 2016 Dec. 31, 2015, $7,271 Total Loan Growth Nine months ended Sept. 30, 2016 Sept. 30, 2016, $12,716
| |

$74 $130 $85 $273 $26 $31 $21 $108 Commercial CRE/C&D Residential Consumer $0 $100 $200 $300 Q1 Q2 Q3 Q4 Q1 Q2 Q3 Q4 Q1 Q2 Q3 22 2014 - $565 2015 - $476 2016 YTD - $562 $106 $145 $142 $15 $172 $224 $181 $280 $56 $186 $562 $96 $186 Organic Loan Growth ($ Millions) Quarterly Organic Loan Growth Trends Organic Loan Growth – 2016 YTD Organic Loan Growth – 2016 Q3

$3.3 $3.3 $3.3 $2.9 $0.5 Noninterest-bearing Demand Deposits Interest-bearing Demand Deposits Savings Deposits Time Deposits Brokered Deposits $1.9 $2.0 $2.0 $1.5 $0.2 23 (1) Comprised of $477 million of growth in customer deposits offset by $158 million decrease in brokered deposits. (2) Cost of deposits based on period averages 2015 2016 Total Deposits – Sept. 30, 2015 $7.6 Total Deposits – Sept. 30, 2016 $13.3 Organic $0.3, 4.2% (1) $1.3 $0.9 $1.2 $1.5 $0.4 Talmer Merger $5.3 $0.1 $0.4 $0.1 ($0.1) ($0.2) Deposit Composition Total Deposits ($ Billions) Average Deposits ($ Millions) & Cost of Deposits (%) $6,204 $6,709 $7,453 $7,449 $ 7,535 $7,528 $9,484 0.22% 0.22% 0.23% 0.22% 0.22% 0.23% 0.24% 0.00% 0.25% 0.50% $3,000 $6,500 $10,000 Q1 Q2 Q3 Q4 Q1 Q2 Q3 Interest Rate Paid Total Average Deposits ($ Millions) Deposits Cost of Deposits (2)
| |
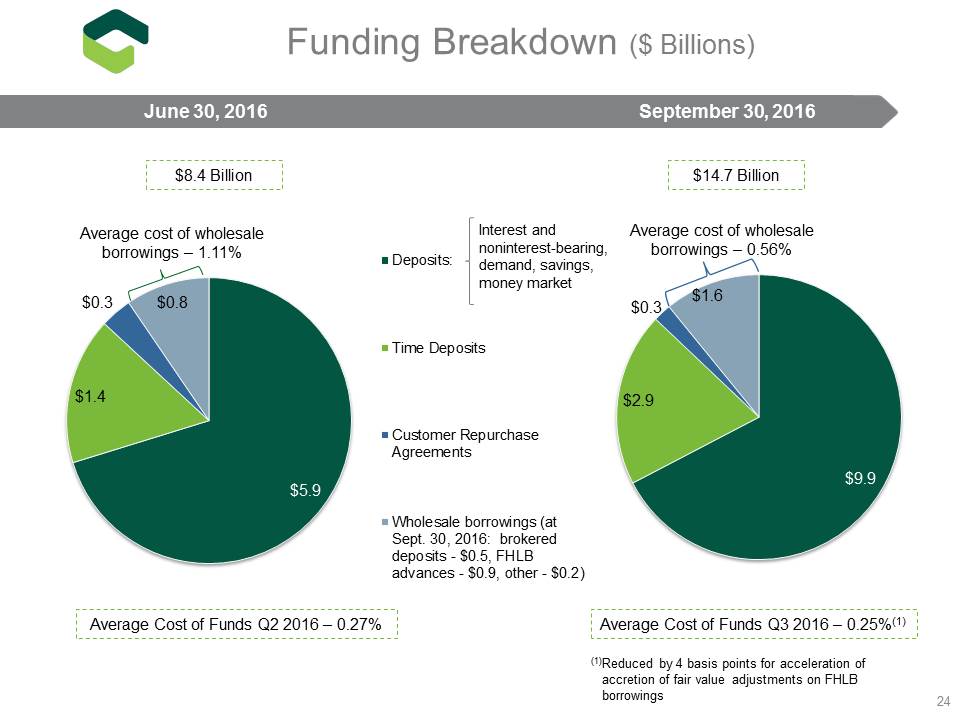
$9.9 $2.9 $0.3 $1.6 Deposits: Time Deposits Customer Repurchase Agreements Wholesale borrowings (at Sept. 30, 2016: brokered deposits - $0.5, FHLB advances - $0.9, other - $0.2) 24 Average Cost of Funds Q3 2016 – 0.25% (1) Average Cost of Funds Q2 2016 – 0.27% $8.4 Billion $14.7 Billion $5.9 $1.4 $0.3 $0.8 Interest and noninterest - bearing, demand, savings, money market Average cost of wholesale borrowings – 0.56% Average cost of wholesale borrowings – 1.11% Funding Breakdown ($ Billions) (1) Reduced by 4 basis points for acceleration of accretion of fair value adjustments on FHLB borrowings June 30, 2016 September 30, 2016
| |

$1.6 $1.5 $1.5 $1.5 $1.5 $1.5 $1.5 $2.0 $1.5 $3.0 $4.1 $2.2 $2.2 $2.3 $2.8 $1.9 $1.8 $0.8 $4.3 $ 4.5 $1.8 $1.8 $0.0 $2.5 $5.0 Q1 Q2 Q3 Q4 Q1 Q2 Q3 Q4 Q1 Q2 Q3 Provision for Loan Losses Net Loan Losses $148 $106 $91 $82 $71 $84 $73 $62 $62 $0 $80 $160 YE 2010 YE 2011 YE 2012 YE 2013 YE 2014 YE 2015 2016 Q1 2016 Q2 2016 Q3 25 ALL NPLs 2014 2015 2016 Originated Loans ($ billions) $3.1 $3.3 $3.8 $4.3 $5.0 $5.8 $6.0 $6.4 $6.7 Acquired Loans ($ billions) 0.6 0.5 0.4 0.3 0.7 1.5 1.4 1.2 6.0 Total Loans ($ billions) $3.7 $3.8 $4.2 $4.6 $5.7 $7.3 $7.4 $7.6 $12.7 ALL $90 $88 $84 $79 $76 $73 $70 $72 $74 ALL/ Originated Loans 2.86% 2.60% 2.22% 1.81% 1.51% 1.26% 1.17% 1.12% 1.09% NPLs/ Total Loans 4.01% 2.77% 2.18% 1.76% 1.25% 1.15% 0.99% 0.81% 0.48% Credit Mark as a % of Unpaid Principal on Acquired Loans 6.5% 6.6% 6.0% 7.8% 5.4% 4.4% 4.5% 4.1% 3.0% Credit Quality ($ Millions, unless otherwise noted) Provision for Loan Losses vs. Net Loan Losses Nonperforming Loans (NPLs) and Allowance for Loan Losses (ALL)
| |
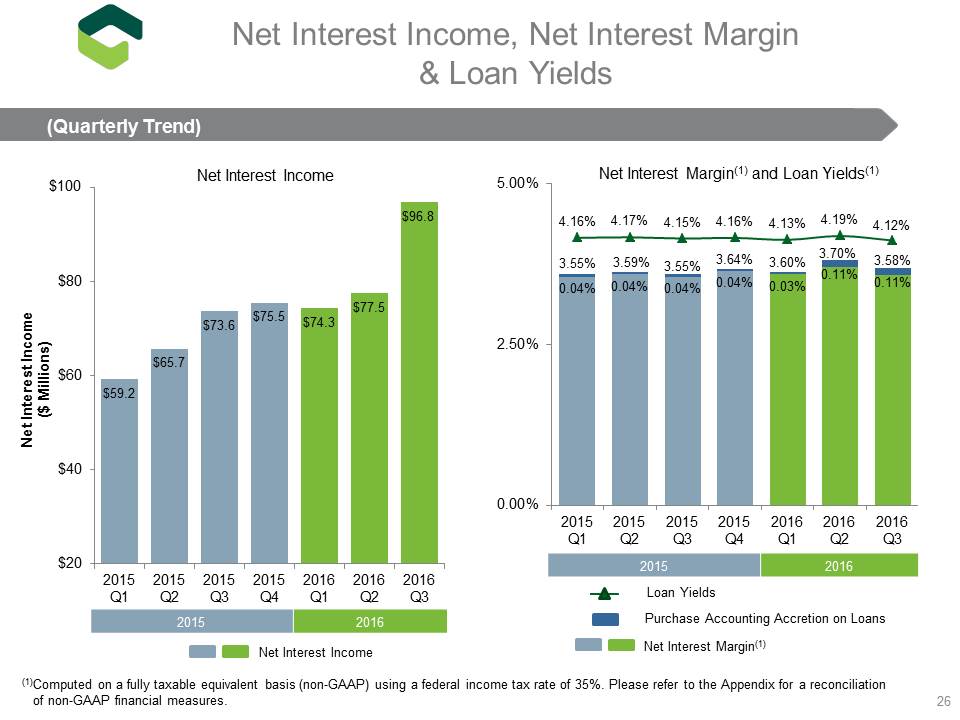
$59.2 $65.7 $73.6 $75.5 $ 74.3 $77.5 $96.8 $20 $40 $60 $80 $100 2015 Q1 2015 Q2 2015 Q3 2015 Q4 2016 Q1 2016 Q2 2016 Q3 Net Interest Income ($ Millions) Net Interest Income 26 3.55% 3.59% 3.55% 3.64% 3.60% 3.70% 3.58% 0.04% 0.04% 0.04% 0.04% 0.03% 0.11% 0.11% 4.16% 4.17% 4.15% 4.16% 4.13% 4.19% 4.12% 0.00% 2.50% 5.00% 2015 Q1 2015 Q2 2015 Q3 2015 Q4 2016 Q1 2016 Q2 2016 Q3 Net Interest Margin (1) and Loan Yields (1) Net Interest Margin (1) Purchase Accounting Accretion on Loans Loan Yields 2015 2016 2015 2016 Net Interest Income Net Interest Income, Net Interest Margin & Loan Yields (Quarterly Trend) (1) Computed on a fully taxable equivalent basis (non - GAAP) using a federal income tax rate of 35 %. Please refer to the Appendix for a reconciliation of non - GAAP financial measures .
| |

$6.3 $6.9 $7.4 $6.9 $7.1 $7.2 $10.1 $5.1 $5.6 $4.7 $5.2 $5.2 $5.8 $5.6 $5.9 $6.5 $6.7 $6.4 $5.7 $6.3 $7.7 $1.4 $1.7 $1.4 $1.6 $ 1.4 $1.6 $4.4 $0.6 $0.0 $15.0 $30.0 Q1 Q2 Q3 Q4 Q1 Q2 Q3 Other Wealth Management Service Charges Mortgage Banking Revenue Investment Securities Gain 2015 2016 ($ Millions) 27 $20.7 $19.3 $19.4 $20.1 $20.2 $27.8 $20.9 Non - Interest Income Quarterly
| |

$13.0 $13.1 $12.5 $16.1 $33.0 $33.9 $33.1 $40.6 $4.6 $4.9 $5.5 $5.5 $5.1 $4.4 $4.9 $6.4 $2.1 $ 2.6 $3.1 $37.5 $0.0 $55.0 $110.0 Q1 Q2 Q3 Q4 Q1 Q2 Q3 Other Compensation Occupancy Equipment Transaction Expenses 2015 2016 28 ($ Millions) $56.8 $51.0 $58.3 $56.0 $57.8 $59.1 $56.3 $58.9 $55.7 $68.6 (1) $106.1 Operating Expenses Quarterly (1) Includes $55.6 million attributable to legacy Chemical
| |
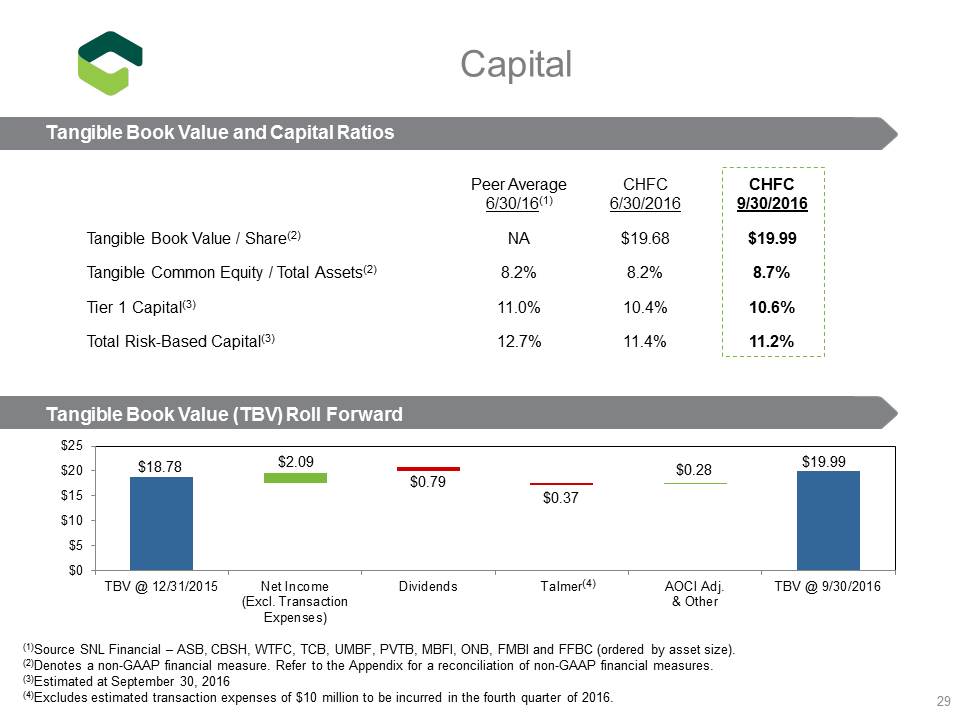
Peer Average 6/30/16 (1) CHFC 6/30/2016 CHFC 9/30/2016 Tangible Book Value / Share (2) NA $19.68 $19.99 Tangible Common Equity / Total Assets (2) 8.2% 8.2% 8.7% Tier 1 Capital (3) 11.0% 10.4% 10.6% Total Risk - Based Capital (3) 12.7% 11.4% 11.2% $19.99 $0.79 $0.37 $18.78 $2.09 $0.28 $0 $5 $10 $15 $20 $25 TBV @ 12/31/2015 Net Income (Excl. Transaction Expenses) Dividends Talmer AOCI Adj. & Other TBV @ 9/30/2016 29 Capital Tangible Book Value and Capital Ratios Tangible Book Value (TBV) Roll Forward (1) Source SNL Financial – ASB, CBSH, WTFC, TCB, UMBF, PVTB, MBFI, ONB, FMBI and FFBC (ordered by asset size ). (2) Denotes a non - GAAP financial measure. Refer to the Appendix for a reconciliation of non - GAAP financial measures. (3) Estimated at September 30, 2016 (4) Excludes estimated transaction expenses of $10 million to be incurred in the fourth quarter of 2016. (4)
| |
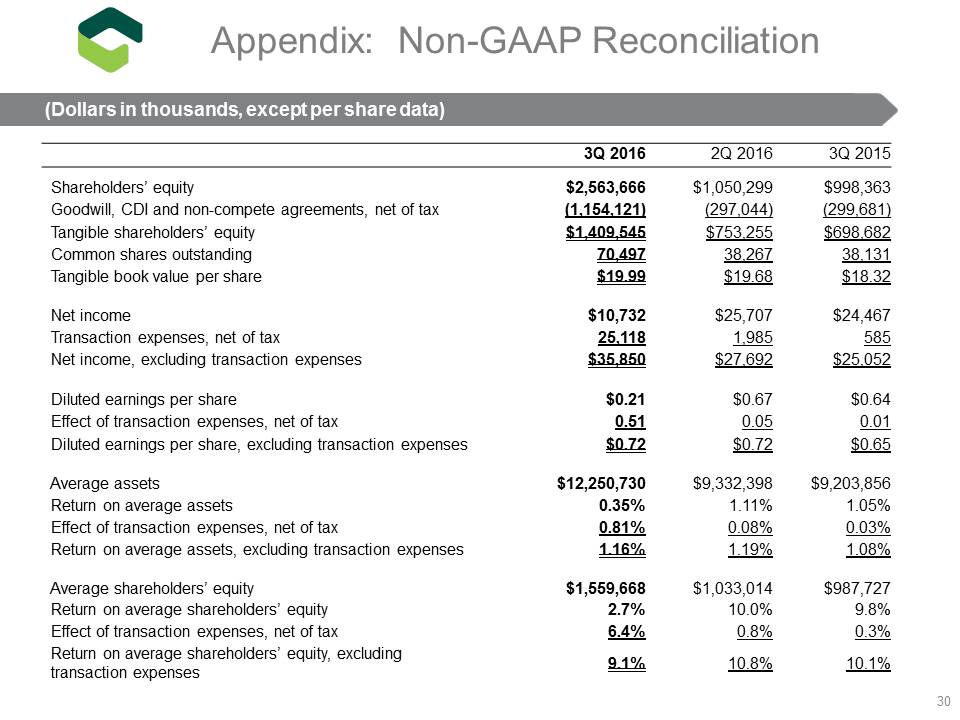
3Q 2016 2Q 2016 3Q 2015 Shareholders’ equity $2,563,666 $1,050,299 $998,363 Goodwill, CDI and non - compete agreements, net of tax (1,154,121) (297,044) (299,681) Tangible shareholders’ equity $1,409,545 $753,255 $698,682 Common shares outstanding 70,497 38,267 38,131 Tangible book value per share $19.99 $19.68 $18.32 Net income $10,732 $25,707 $24,467 Transaction expenses, net of tax 25,118 1,985 585 Net income, excluding transaction expenses $35,850 $27,692 $25,052 Diluted earnings per share $0.21 $0.67 $0.64 Effect of transaction expenses, net of tax 0.51 0.05 0.01 Diluted earnings per share, excluding transaction expenses $0.72 $0.72 $0.65 Average assets $12,250,730 $9,332,398 $9,203,856 Return on average assets 0.35% 1.11% 1.05% Effect of transaction expenses, net of tax 0.81% 0.08% 0.03% Return on average assets, excluding transaction expenses 1.16% 1.19% 1.08% Average shareholders’ equity $1,559,668 $1,033,014 $987,727 Return on average shareholders’ equity 2.7% 10.0% 9.8% Effect of transaction expenses, net of tax 6.4% 0.8% 0.3% Return on average shareholders’ equity, excluding transaction expenses 9.1% 10.8% 10.1% 30 Appendix: Non - GAAP Reconciliation (Dollars in thousands, except per share data)
| |

3Q 2016 2Q 2016 3Q 2015 Efficiency Ratio: Total revenue – GAAP $ 124,579 $ 98,392 $ 93,832 Net interest Income FTE adj 2,426 2,138 2,031 Gains from sale of investment securities gains and closed branch locations (301) (123) (111) Total revenue – Non - GAAP $ 126,704 $100,407 $ 95,752 Operating expenses – GAAP $ 106,144 $ 59,085 $ 58,265 Transaction expenses (37,470) (3,054) (900) Amortization of intangibles (1,292) (1,195) (1,270) Operating expenses – Non - GAAP $ 67,382 $ 54,836 $ 56,095 Efficiency ratio – GAAP 85.2% 60.1% 62.1% Efficiency ratio – adjusted 53.2% 54.6% 58.6% Net Interest Margin: Net Interest Income – GAAP $96,809 $77,495 $73,617 Adjustments for tax equivalent interest: Loans 777 717 740 Investment securities 1,649 1,421 1,291 Total taxable equivalent adjustments 2,426 2,138 2,031 Net Interest Income (on a tax equivalent basis) $99,235 $79,633 $75,648 Average interest - earning assets $11,058,143 $8,636,627 $8,467,939 Net Interest Margin – GAAP 3.49% 3.60% 3.46% Net Interest Margin (on a tax - equivalent basis) 3.58% 3.70% 3.55% 31 Appendix: Non - GAAP Reconciliation (Dollars in thousands, except per share data)
| |
