Attached files
| file | filename |
|---|---|
| 8-K - FORM 8-K - ASTORIA FINANCIAL CORP | v453330_8k.htm |
Exhibit 99.1

Investor Presentation Third Quarter Ended September 30, 2016 NYSE : AF
Forward Looking Statements 2 This presentation contains a number of forward - looking statements within the meaning of Section 27A of the Securities Act of 1933, as amended, or the Securities Act, and Section 21E of the Securities Exchange Act of 1934, as amended. These statements may be identified by the use of such words as “anticipate,” “believe,” “could,” “estimate,” “expect,” “intend,” “may,” “outlook,” “plan,” “potential,” “predict,” “project,” “should,” “will,” “would,” and similar terms and phrases, including references to assumptions. Forward - looking statements are based on various assumptions and analyses made by us in light of our management’s experience and perception of historical trends, current conditions and expected future developments, as well as other factors we believe are appropriate under the circumstances. These statements are not guarantees of future performance and are subject to risks, uncertainties and other factors (many of which are beyond our control) that could cause actual results to differ materially from future results expressed or implied by such forward - looking statements. These factors include, without limitation, the following: the timing and occurrence or non - occurrence of events that may be subject to circumstances beyond our control; increases in competitive pressure among financial institutions or from non - financial institutions; changes in the interest rate environment; changes in deposit flows, loan demand or collateral values; changes in accounting principles, policies or guidelines; changes in general economic conditions, either nationally or locally in some or all areas in which we do business, or conditions in the real estate or securities markets or the banking industry; legislative or regulatory changes, including the implementation of the Dodd - Frank Wall Street Reform and Consumer Protection Act of 2010, and any actions regarding foreclosures; enhanced supervision and examination by the Office of the Comptroller of the Currency, the Board of Governors of the Federal Reserve System and the Consumer Financial Protection Bureau; effects of changes in existing U.S. government or government - sponsored mortgage programs; our ability to successfully implement technological changes; our ability to successfully consummate new business initiatives; litigation or other matters before regulatory agencies, whether currently existing or commencing in the future; or our ability to implement enhanced risk management policies, procedures and controls commensurate with shifts in our business strategies and regulatory expectations. We have no obligation to update any forward - looking statements to reflect events or circumstances after the date of this press release.

Forward Looking Statements (Continued) 3 This communication contains certain forward - looking information about NYCB, Astoria, and the combined company after the close of the transaction that is intended to be covered by the safe harbor for “forward - looking statements” provided by the Private Securities Litigation Reform Act of 1995. All statements other than statements of historical fact are forward - looking statements. Such statements involve inherent risks and uncertainties, many of which are difficult to predict and are generally beyond the control of NYCB, Astoria and the combined company. Forward - looking statements speak only as of the date they are made and we assume no duty to update such statements. We caution readers that a number of important factors could cause actual results to differ materially from those expressed in, or implied or projected by, such forward - looking statements. In addition to factors previously disclosed in reports filed by NYCB and Astoria with the SEC, risks and uncertainties for each institution and the combined institution include, but are not limited to: lower than expected revenues; credit quality deterioration or a reduction in real estate values could cause an increase in the allowance for credit losses and a reduction in net earnings; enhanced supervision and examination by the Office of the Comptroller of the Currency, the Board of Governors of the Federal Reserve System and the Consumer Financial Protection Bureau; increases in competitive pressure among financial institutions or from non - financial institutions; effects of changes in existing U.S. government or government - sponsored mortgage programs; the ability to complete the proposed transaction, including obtaining regulatory approvals, or any future transaction, successfully integrate NYCB’s and Astoria’s integration plan, or achieve expected beneficial synergies and/or operating efficiencies, in each case within expected time - frames or at all; regulatory approvals may not be received on expected timeframes or at all; the possibility that personnel changes will not proceed as planned; the possibility that the cost of additional capital may be more than expected; the possibility that a change in the interest rate environment may reduce net interest margins; asset/liability re - pricing risks and liquidity risks; pending legal matters may take longer or cost more to resolve or may be resolved adversely; general economic conditions, either nationally or in the market areas in which the entities operate or anticipate doing business, are less favorable than expected; and environmental conditions, including natural disasters, may disrupt business, impede operations, or negatively affect the values of collateral securing loans.
Corporate Profile NYSE : AF » Astoria Financial, with assets of $14.8 billion is the holding company for Astoria Bank (established in 1888), with deposits of $8.9 billion, and is the eighth largest publicly traded financial institution in our core market » 22 consecutive years of core profitability as a public company (1) » Stable and healthy credit metrics throughout the financial crisis » Clean , well capitalized balance sheet » On October 28, 2015, Astoria Financial Corporation entered into a definitive agreement to merge with New York Community Bancorp » On April 26, 2016 at a special meeting of shareholders, Astoria’s shareholders voted overwhelmingly to approve the merger. 4 (1) Refers to net income recalculated to exclude net realized gains and losses on securities, amortization of intangibles and impairment of goodwill, and other nonrecurring items. Core profitability is a non - GAAP financial measure .

Strategy and Business Fundamentals 5 Conservative Corporate Strategy • Core competencies: - Mortgage lending - Retail banking - Business banking • Reposition asset/liability mix - Focus on multi - family & commercial real estate loans - Expand business banking presence - Increase core deposits, decrease CDs • Disciplined cost control Disciplined Lending • Multi - family & commercial real estate lending - High quality - Approximately 85% of multi - family loan portfolio and pipeline loans are subject to rent control or rent stabilization - Low LTVs • Residential lending - Geographically diverse loan portfolio - Low LTVs and no sub - prime, payment option or negative amortization loans - Primarily jumbo 5/1 and 7/1 ARMs and 15 year fixed rate loans Attractive and Stable Franchise • Significant deposit market share (1) • Core market is more densely populated and wealthier than U.S. average (1) Strong Leadership and Culture • Solid & seasoned management team • Significant community involvement through funding and volunteer efforts Sources: SNL Financial LC, Company filings. (1) Deposit market share as of June 30, 2016. Core market includes Long Island market consisting of Kings, Queens, Nassau and Suffolk counties .

Strong Capital Position 6 Tier 1 Leverage Common Equity Tier 1 Risk-Based Tier 1 Risk-Based Total Risk-Based Tangible Common Equity 11.75% 21.07% 21.07% 22.14% 10.61% 17.58% 19.09% 20.17% 9.52% Bank Holding Company At September 30, 2016 Note: The regulatory capital ratios represent calculations under the Basel III Capital Rules, which became effective for Astoria Bank and Astoria Financial Corporation on January 1, 2015, and the Dodd - Frank Act. Prior to 2015, Astoria Financial Corporation was not subject to regulatory capital requirements.
Multi - family/Commercial Real Estate Lending MF/CRE loan portfolio grew by $116.1 million for the 12 months ended September 30, 2016 and represents 46% of the total loan portfolio at September 30 , 2016, compared to 42% at September 30 , 2015. » $4.9 billion portfolio 3Q16 originations of $209.3 million, with a weighted average LTV at origination of approximately 47% and weighted average debt service coverage ratio of approximately 1.61, all in footprint Weighted average LTV (1) on total MF/CRE loan portfolio < 44% » Focus on rent controlled, rent stabilized apartments in New York City Approximately 85% of the multi - family loan portfolio and pipeline loans are subject to rent control or rent stabilization Pipeline of approximately $99.6 million at September 30, 2016 with weighted average coupon of approximately 3.16% 7 (1) LTV ratios are based on current principal balances and original appraised values .

Residential Mortgage Lending » $5.5 billion portfolio Primarily prime, jumbo 5/1 and 7/1 hybrid ARMs and 15 year fixed rate loans No sub - prime, payment option or negative amortization ARM lending 3Q16 originations of $261.5 million with a weighted average LTV at origination of approximately 62% Weighted average LTV (1) on total residential loan portfolio < 57% Pipeline of approximately $368.3 million at September 30, 2016 » Multiple delivery channels provide flexibility & efficiency Retail Commissioned brokers Third party originators » Geographically diversified portfolio Reduces lending concentrations 8 (1) LTV ratios are based on current principal balances and original appraised values . Regardless of channel, all loans underwritten to Astoria’s stringent standards

Retail Banking Philosophy » Consultative approach to helping consumers achieve financial health and well - being » Pro - active sales culture – PEAK Process » Focus on customer service High customer satisfaction Favorably positioned against the competition » Community involvement Support over 700 local organizations and not - for - profit agencies 9 Astoria Bank is an integral part of the fabric of the communities it serves
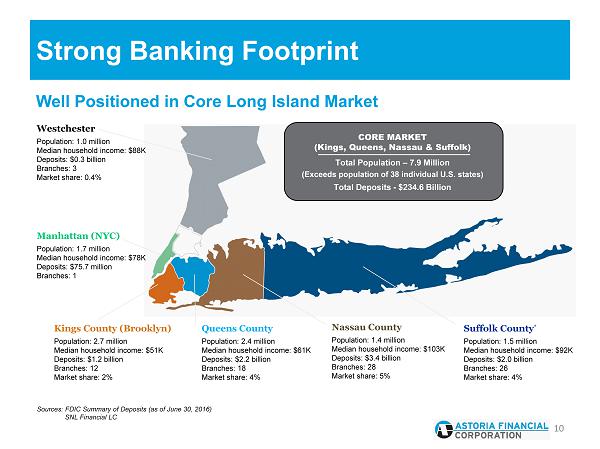
Strong Banking Footprint 10 CORE MARKET (Kings, Queens, Nassau & Suffolk) Total Population – 7.9 Million (Exceeds population of 38 individual U.S. states) Total Deposits - $234.6 Billion Kings County (Brooklyn) Population: 2.7 million Median household income: $51K Deposits: $ 1.2 billion Branches: 12 Market share: 2% Queens County Population: 2.4 million Median household income: $61K Deposits: $ 2.2 billion Branches: 18 Market share: 4% Nassau County Population: 1.4 million Median household income: $103K Deposits: $3.4 billion Branches: 28 Market share: 5 % Suffolk County * Population: 1.5 million Median household income: $92K Deposits: $ 2.0 billion Branches: 26 Market share: 4% Manhattan (NYC) Population: 1.7 million Median household income: $78K Deposits: $75.7 million Branches : 1 Westchester Population: 1.0 million Median household income: $88K Deposits: $0.3 billion Branches: 3 Market share: 0.4% Well Positioned in Core Long Island Market Sources: FDIC Summary of Deposits (as of June 30, 2016) SNL Financial LC
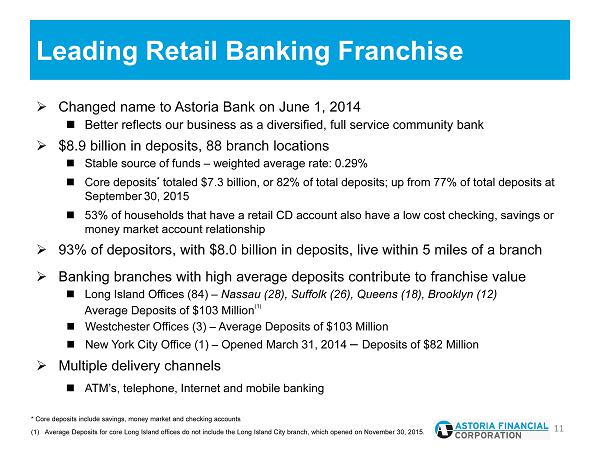
Leading Retail Banking Franchise » Changed name to Astoria Bank on June 1, 2014 Better reflects our business as a diversified, full service community bank » $8.9 billion in deposits, 88 branch locations Stable source of funds – weighted average rate: 0.29% C ore deposits * totaled $7.3 billion , or 82% of total deposits; up from 77% of total deposits at September 30, 2015 53% of households that have a retail CD account also have a low cost checking, savings or money market account relationship » 93% of depositors, with $8.0 billion in deposits, live within 5 miles of a branch » Banking branches with high average deposits contribute to franchise value Long Island Offices ( 84) – Nassau (28), Suffolk ( 26), Queens ( 18), Brooklyn (12) Average Deposits of $103 Million (1) Westchester Offices (3) – Average Deposits of $103 Million New York City Office (1) – Opened March 31, 2014 – Deposits of $82 Million » Multiple delivery channels ATM’s, telephone, Internet and mobile banking 11 * Core deposits include savings, money market and checking accounts (1) Average Deposits for core Long Island offices do not include the Long Island City branch, which opened on November 30, 2015 .

Business Banking Expansion » 46 employees currently supporting the business at September 30, 2016, up from 21 at year - end 2012 _ » Approximately 70% of Astoria Bank’s 88 branches are headed by experienced commercial bankers » Business loans, including commercial real estate loans originated through business banking operations have grown 26% in the past twelve months » Opened a business banking office in mid - town Manhattan in September 2013, our first full - service branch in Manhattan on March 31, 2014, a full - service branch in Melville on December 1, 2014, and a full - service branch in Long Island City on November 30, 2015. 12 Business deposits grew 14% from September 30, 2015, to $1.2 billion at September 30 , 2016.

Current Focus » Balance Sheet Repositioning » Net Interest Margin Improvement » Interest Rate Risk Management » Asset Quality Improvement 13

Residential 60% MF 31% CRE 7% Other 2% Residential 56% MF 35% CRE 7% Other 2% Residential 52% MF 39% CRE 7% Other 2% Balance Sheet Repositioning Trend 14 Deposits Core 77% CDs 23% Core 82% CDs 18% Loans At September 30, 2016 2014 Core 70% CDs 30% 2015

Current Focus » Balance Sheet Repositioning » Net Interest Margin Improvement » Interest Rate Risk Management » Asset Quality Improvement 15

Net Interest Margin 16 2012 2013 2014 2015 1Q16 2.16% 2.25% 2.32% 2.36% 2.37% 2012 2013 2014 2015 YTD 2016 Cost of interest - bearing liabilities 1.64% 1.24% 1.09% 1.00 % 0.96% Yield on interest - earning assets 3.73% 3.41% 3.34% 3.29% 3.25%

Asset and Liability Repricing » CDs were either issued or repriced during September 2016 with a weighted average rate of 0.14% » CDs scheduled to mature: 4Q16: $0.2 billion with a weighted average rate of 0.26% » Borrowings scheduled to mature: 4Q16: $1.0 billion with a weighted average rate of 0.72% » Residential hybrid ARMs scheduled to reset into 1 year ARMs: 4Q16: $0.6 billion with a weighted average rate of 3.35% 17 * Does not foot due to rounding .

» Balance Sheet Repositioning » Net Interest Margin Improvement » Interest Rate Risk Management » Asset Quality Improvement Current Focus 18
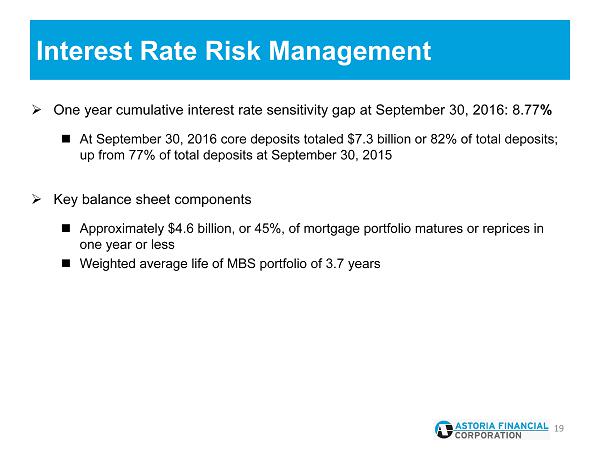
Interest Rate Risk Management » One year cumulative interest rate sensitivity gap at September 30, 2016: 8.77 % At September 30, 2016 core deposits totaled $7.3 billion or 82% of total deposits; up from 77% of total deposits at September 30, 2015 » Key balance sheet components Approximately $4.6 billion, or 45%, of mortgage portfolio matures or reprices in one year or less Weighted average life of MBS portfolio of 3.7 years 19
» Balance Sheet Repositioning » Net Interest Margin Improvement » Interest Rate Risk Management » Asset Quality Improvement Current Focus 20

Asset Quality » Conservative underwriting, top quality loans, low LTV $3.1 billion , or 56% of residential portfolio, originated 2008 through 3Q16 with a weighted average LTV of 55% ( 1 ) , substantially all of which are current Residential I/O portfolio reduced by $2.0 billion, or 82% over last 3 years ($500.9 million, or 54% over the last year alone) to $431.7 million at September 30, 2016 Top quality multi - family and commercial real estate loan portfolios ▪ Approximately 85% of multi - family loan portfolio and pipeline loans are subject to rent control or rent stabilization ▪ Average LTV for portfolio loans < 44% ( 1 ) » Top quality MBS portfolio 99.9% GSE/agency Average life 3.7 years 21 (1) LTV ratios are based on current principal balances and original appraised values .

Asset Quality 22 (1) Includes $138.1 million of home equity loans. (2) Includes $38.0 million of residential loans, $3.9 million of multi - family loans, $5.2 million of CRE loans, in each case, which were current or less than 90 days past due. (3) Does not foot due to rounding. (4) Includes loans which were current totaling $ 38.8 million at September 30, 2016 . $48.0 million at September 30, 2015, $58.8 million at September 30, 2014 Consumer & Multi-family Loan portfolio balance $ 5,535.0 $ 4,094.6 $ 758.0 $ 243.1 (1) $ 10,630.7 Non-performing loans (NPLs) (2) $ 134.9 $ 5.7 $ 5.2 $ 5.0 $ 150.9 (3) NPLs/total loans 1.27% 0.05% 0.05% 0.05% 1.42% Net loan charge-offs (recoveries) 3Q16 $ 2.4 $ (0.4) $ (0.6) $ 0.0 $ 1.3 (3) Net loan charge-offs (recoveries) YTD $ 4.6 (1.6) (0.5) 0.7 3.2 Other Residential TotalCRE Selected asset quality metrics at September 30, 2016, except as noted ($ in millions ) + = At September, 2014 $ 95.6 $ 70.3 $ 44.8 $ 115.1 $ 210.7 163.9 At September, 2015 $ 95.4 $ 59.1 $ 72.6 $ 131.7 $ 227.1 163.9 At September, 2016 $ 84.7 $ 47.1 $ 103.8 $ 150.9 $ 235.6 Delinquent Loans 30-89 Days Past Due NPLs 90 Days or More NPLs Less Than 90 Days Past Due (4) Past Due NPLs Total Delinquent Loans and NPLs Total Two year delinquent loan migration trend (in millions)

Investment Summary » Conservative Corporate Strategy Quality mortgage lending Quality retail and business banking Disciplined cost control Well capitalized for all bank regulatory purposes » Disciplined Lending Multi - family/CRE 3Q16 originations of $209.3 million with a weighted average LTV at origination of approximately 47% and weighted average debt service coverage ratio of approximately 1.61 all in footprint Residential 3Q16 originations of $261.5 million with a weighted average LTV at origination of approximately 62% $3.1 billion, or 56% of residential portfolio, originated 2008 through 3Q16, with weighted average LTVs of approximately 55% (1) , substantially all of which are current No Alt A loans originated since 2007 Residential I/O portfolio reduced by $2.0 billion, or 82% over last 3 years ($500.9 million, or 54% over the last year alone) to $431.7 million at September 30, 2016 » Attractive and Stable Franchise Significant deposit market share in core market (2 ) Core deposit growth – emphasis on personal and business checking, marketing campaigns » Strong Leadership and Culture Average of 36 years of executive management experience Insider ownership at 11% 23 (1) LTV ratios are based on current principal balances and original appraised values. (2) Core market includes Kings, Queens, Nassau and Suffolk counties.

Addendum

Solid and Seasoned Management Team 25 Responsibility Age Years in Banking Monte N. Redman President & CEO Chief Executive Officer 66 42 Hugh J. Donlon Sr. EVP & CLO Chief Lending Officer 53 31 Alan P. Eggleston Sr. EVP & CRO Chief Risk Officer 63 36 Frank E. Fusco Sr. EVP & CFO Chief Financial Officer 53 26 Gerard C. Keegan Vice Chairman, Sr. EVP & COO Chief Operating Officer 70 45 Josie Callari Executive Vice President Chief Support Services Officer 63 44 Robert J. DeStefano Executive Vice President Chief Information Officer 57 37 Brian T. Edwards Executive Vice President Managing Director, Retail Banking Group 55 23 Stephen J. Sipola Executive Vice President Managing Director, Business Banking Group 58 37
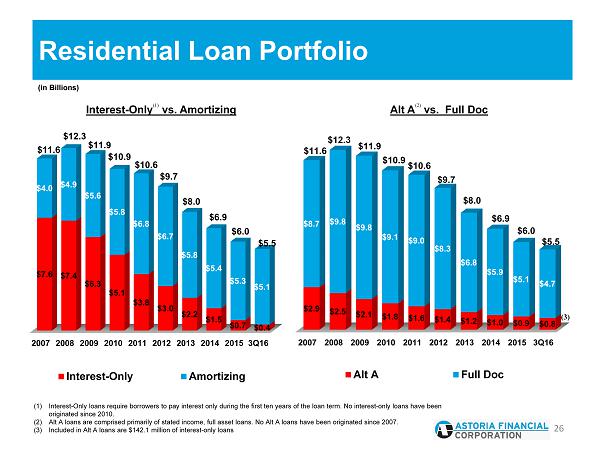
Residential Loan Portfolio 26 2007 2008 2009 2010 2011 2012 2013 2014 2015 3Q16 $7.6 $7.4 $6.3 $5.1 $3.8 $3.0 $2.2 $1.5 $0.7 $0.4 $4.0 $4.9 $5.6 $5.8 $6.8 $6.7 $5.8 $5.4 $5.3 $5.1 $11.6 $12.3 $11.9 $10.9 $10.6 $9.7 $8.0 $6.9 $6.0 $5.5 Interest-Only Amortizing 2007 2008 2009 2010 2011 2012 2013 2014 2015 3Q16 $2.9 $2.5 $2.1 $1.8 $1.6 $1.4 $1.2 $1.0 $0.9 $0.8 $8.7 $9.8 $9.8 $9.1 $9.0 $8.3 $6.8 $5.9 $5.1 $4.7 $11.6 $12.3 $11.9 $10.9 $10.6 $9.7 $8.0 $6.9 $6.0 $5.5 Alt A Full Doc Interest - Only (1) vs . Amortizing Alt A (2 ) vs. Full Doc (in Billions ) (1) Interest - Only loans require borrowers to pay interest only during the first ten years of the loan term. No interest - only loans h ave been originated since 2010. (2) Alt A loans are comprised primarily of stated income, full asset loans. No Alt A loans have been originated since 2007 . (3) Included in Alt A loans are $142.1 million of interest - only loans (3)
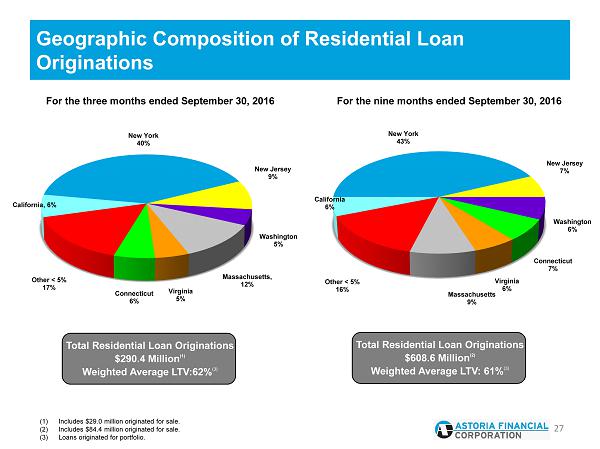
Geographic Composition of Residential Loan Originations 27 New York 40% New Jersey 9% Washington 5% Massachusetts , 12% Virginia 5% Connecticut 6% Other < 5% 17% California, 6% New York 43% New Jersey 7% Washington 6% Connecticut 7% Virginia 6% Massachusetts 9% Other < 5% 16% California 6% For the three months ended September 30, 2016 For the nine months ended September 30, 2016 Total Residential Loan Originations $290.4 Million (1) Weighted Average LTV:62% (3) Total Residential Loan Originations $608.6 Million (2) Weighted Average LTV: 61% (3) (1) Includes $29.0 million originated for sale . (2) Includes $84.4 million originated for sale. (3) Loans originated for portfolio.

Significant Market Share Penetration 28 June 30, 2016 Market # of DepositsInstitution Deposits Share Branches Per Branch 1 Chase $ 54,232 23.1% 345 $157 2 Citibank 27,222 11.6 122 223 3 Capital One 25,464 10.9 159 160 4 NY Community Bancorp 15,602 6.7 118 132 5 TD Bank 15,496 6.6 119 130 6 Bank of America 12,184 5.2 118 103 7 HSBC 10,978 4.7 78 141 8 ASTORIA* 8,756 3.7 84 104 9 Signature Bank 8,384 3.6 15 559 10 Santander 7,570 3.2 38 199 Total - Top 10 $ 185,888 79.2% 1,196 $155 Total - Core Market $ 234,643 100.0% 1,728 $136 Brooklyn, Queens, Nassau and Suffolk Ranked by June 2016 Market Share ($ in millions) * Astoria’s deposits highlighted above are comprised of retail and business community deposits. Astoria does not solicit broker or municipal deposits . Source: FDIC Summary of Deposits. Data as of June 30, 2016. Data represents the top ten institutions ranked by market share.

Retail CDs: $2.7B @ 1.47 % Core Deposits (Savings , Money Market and Checking): $6.8B @ 0.11% Core Deposits (Savings , Money Market and Checking): $7.3B @ 0.13% Retail CDs: $1.6B @ 0.98% 82% 18% 70% 30% 77% 23% Retail CDs: $2.1B @ 1.15% Core Community Deposits 29 Core Deposits (Savings , Money Market and Checking): $6.9B @ 0.12 % 2014 53 % of the households that have a retail CD account also have a low cost checking, savings or money market account relationship. 2015 Low - cost core deposits increasing as a percentage of total deposits Retail CDs: $2.8B @ 1.50% Core Deposits (Savings , Money Market and Checking): $6.8B @ 0.11 % At September 30, 201 6

Sales – PEAK Process » A “needs” based approach to sales rather than “product” based approach » Highly interactive program – daily and weekly meetings create a focus that is shared throughout the branch network » Incentives for strong performance, both individual and team 30 P erformance based on E nthusiasm, A ctions and K nowledge “Sales Oriented and Service Obsessed”

Customer Satisfaction » 77% of Astoria customers are highly satisfied » 74% of Astoria customers are highly likely to recommend Astoria to friend/family member » Satisfaction with the branch is by far the strongest driver of overall satisfaction – 87% of Astoria customers are highly satisfied with quality of branch service 31 Key Findings: Favorably Positioned Against Competitors Results are based on a 2014 Customer Satisfaction Survey.

Community Involvement » Education First Supports lifelong learning, promotes savings and provides meaningful financial solutions to improve the way our customers live and the neighborhoods we serve » Neighborhood Outreach Through funding and volunteer efforts, supports over 700 community - based organizations and not - for - profit agencies that enrich the communities within our market area Reinforces community involvement by promoting neighborhood news and events in our local community branches 32 Key Initiatives Astoria Bank is an integral part of the fabric of the communities it serves

Contact Information 33 Web Site: www.astoriabank.com Email: ir@astoriabank.com Telephone: (516) 327 - 7877 Address: Astoria Financial Corporation Attn: Investor Relations One Astoria Bank Plaza Lake Success, NY 11042