Attached files
| file | filename |
|---|---|
| EX-99.1 - EX-99.1 - EP Energy LLC | a16-20953_1ex99d1.htm |
| 8-K - 8-K - EP Energy LLC | a16-20953_18k.htm |
Exhibit 99.2
November 16, 2016 Senior Secured Notes Offering Investor Presentation

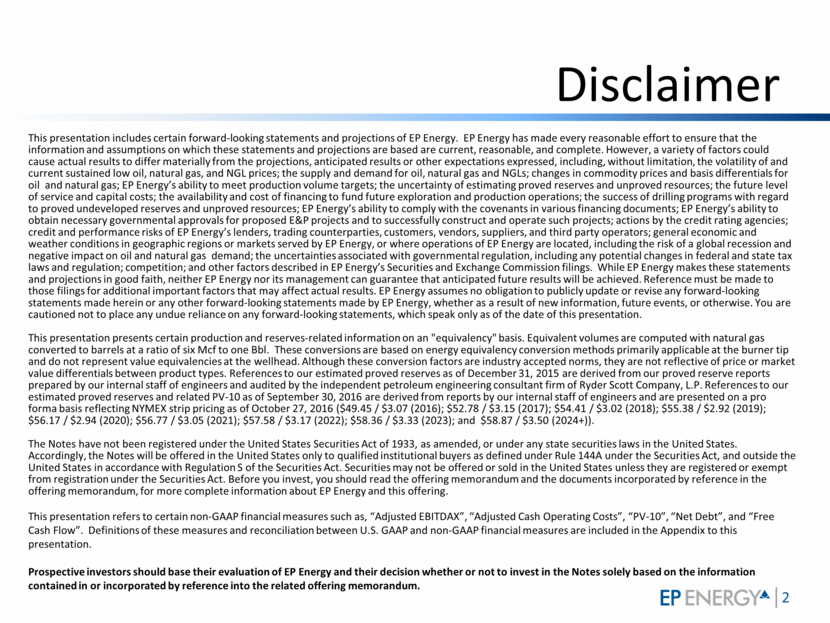
Disclaimer This presentation includes certain forward-looking statements and projections of EP Energy. EP Energy has made every reasonable effort to ensure that the information and assumptions on which these statements and projections are based are current, reasonable, and complete. However, a variety of factors could cause actual results to differ materially from the projections, anticipated results or other expectations expressed, including, without limitation, the volatility of and current sustained low oil, natural gas, and NGL prices; the supply and demand for oil, natural gas and NGLs; changes in commodity prices and basis differentials for oil and natural gas; EP Energy’s ability to meet production volume targets; the uncertainty of estimating proved reserves and unproved resources; the future level of service and capital costs; the availability and cost of financing to fund future exploration and production operations; the success of drilling programs with regard to proved undeveloped reserves and unproved resources; EP Energy’s ability to comply with the covenants in various financing documents; EP Energy’s ability to obtain necessary governmental approvals for proposed E&P projects and to successfully construct and operate such projects; actions by the credit rating agencies; credit and performance risks of EP Energy’s lenders, trading counterparties, customers, vendors, suppliers, and third party operators; general economic and weather conditions in geographic regions or markets served by EP Energy, or where operations of EP Energy are located, including the risk of a global recession and negative impact on oil and natural gas demand; the uncertainties associated with governmental regulation, including any potential changes in federal and state tax laws and regulation; competition; and other factors described in EP Energy’s Securities and Exchange Commission filings. While EP Energy makes these statements and projections in good faith, neither EP Energy nor its management can guarantee that anticipated future results will be achieved. Reference must be made to those filings for additional important factors that may affect actual results. EP Energy assumes no obligation to publicly update or revise any forward-looking statements made herein or any other forward-looking statements made by EP Energy, whether as a result of new information, future events, or otherwise. You are cautioned not to place any undue reliance on any forward-looking statements, which speak only as of the date of this presentation. This presentation presents certain production and reserves-related information on an "equivalency" basis. Equivalent volumes are computed with natural gas converted to barrels at a ratio of six Mcf to one Bbl. These conversions are based on energy equivalency conversion methods primarily applicable at the burner tip and do not represent value equivalencies at the wellhead. Although these conversion factors are industry accepted norms, they are not reflective of price or market value differentials between product types. References to our estimated proved reserves as of December 31, 2015 are derived from our proved reserve reports prepared by our internal staff of engineers and audited by the independent petroleum engineering consultant firm of Ryder Scott Company, L.P. References to our estimated proved reserves and related PV-10 as of September 30, 2016 are derived from reports by our internal staff of engineers and are presented on a pro forma basis reflecting NYMEX strip pricing as of October 27, 2016 ($49.45 / $3.07 (2016); $52.78 / $3.15 (2017); $54.41 / $3.02 (2018); $55.38 / $2.92 (2019); $56.17 / $2.94 (2020); $56.77 / $3.05 (2021); $57.58 / $3.17 (2022); $58.36 / $3.33 (2023); and $58.87 / $3.50 (2024+)). The Notes have not been registered under the United States Securities Act of 1933, as amended, or under any state securities laws in the United States. Accordingly, the Notes will be offered in the United States only to qualified institutional buyers as defined under Rule 144A under the Securities Act, and outside the United States in accordance with Regulation S of the Securities Act. Securities may not be offered or sold in the United States unless they are registered or exempt from registration under the Securities Act. Before you invest, you should read the offering memorandum and the documents incorporated by reference in the offering memorandum, for more complete information about EP Energy and this offering. This presentation refers to certain non-GAAP financial measures such as, “Adjusted EBITDAX”, “Adjusted Cash Operating Costs”, “PV-10”, “Net Debt”, and “Free Cash Flow”. Definitions of these measures and reconciliation between U.S. GAAP and non-GAAP financial measures are included in the Appendix to this presentation. Prospective investors should base their evaluation of EP Energy and their decision whether or not to invest in the Notes solely based on the information contained in or incorporated by reference into the related offering memorandum.
I. Introduction
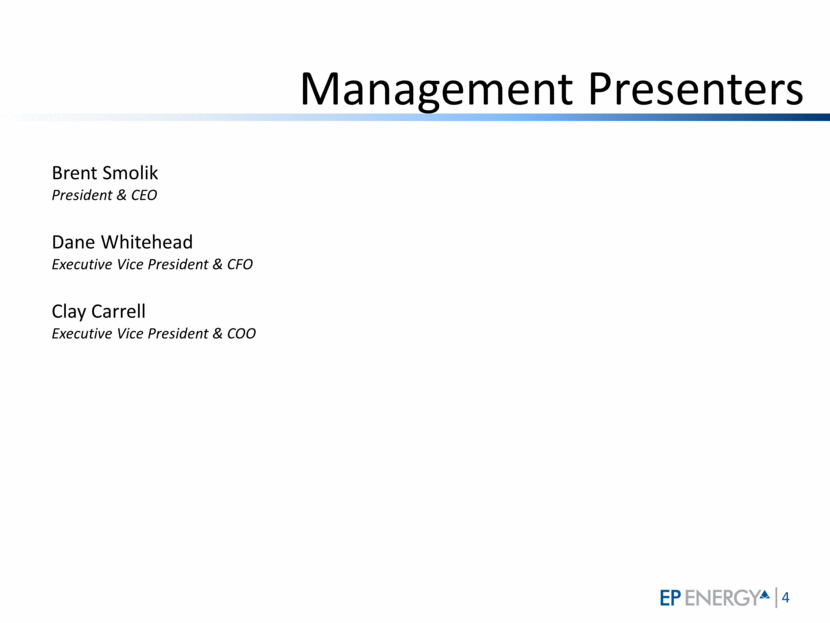
Management Presenters Brent Smolik President & CEO Dane Whitehead Executive Vice President & CFO Clay Carrell Executive Vice President & COO
II. Transaction Summary
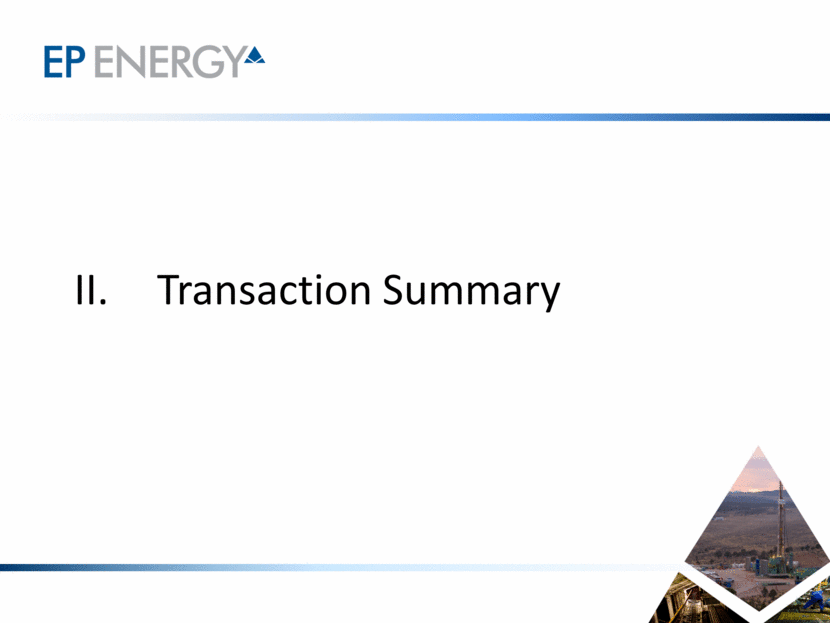
Sources, Uses and Pro Forma Capitalization Note: See the Appendix to this presentation for the Company’s non-GAAP reconciliations and definitions. 1 Borrowings do not include $17mm of L/C outstanding. Assumes that pro forma borrowing base under the RBL Facility is reduced to $1.55bn as a result of the automatic reduction of the borrowing base by $105mm under the terms of the RBL Facility as a result of the issuance of the notes. In November 2016, the Company completed its semi-annual redetermination and the borrowing base of the RBL Facility remained at $1.65bn. The next redetermination will be on or around May 1, 2017. 2 The applicable margin varies depending on the percentage of the borrowing base utilized at a given time and ranges from 250 – 350 basis points per annum for LIBOR based borrowings. 3 If the aggregate principal amount of the 2020 Senior Notes exceeds $325mm 91 days prior to maturity, the maturity date of the Term Loan will be 91 days prior to maturity of the 2020 Senior Notes. 4 Market Value of Equity as of November 14, 2016 per CapIQ. 5 PD Strip PV-10 and 1P Strip PV-10 use reserve amounts as of September 30, 2016 run on NYMEX strip prices as of October 27, 2016. Includes value of future hedge settlements at September 30, 2016 using NYMEX strip prices as of October 27, 2016 and discounted at 10% ($188mm). 6 Coverage calculated through new Senior Secured Notes assuming fully-funded RBL. Sources of Funds ($mm) Uses of Funds ($mm) New Senior Secured Notes $ 350 RBL Paydown $ 343 Est. Transaction Fees and Expenses 7 Total Sources $ 350 Total Uses $ 350 Transaction Pro Forma x LTM ($ in millions) 9/30/2016 Adjustments 9/30/2016 Adj. EBITDAX Pricing Floor Maturity Cash & Cash Equivalents $ 37 $ 37 RBL Credit Facility ($1,545mm BB) 1 $ 870 $(343) $ 527 0.4 x L + 300 - 24-May-19 New Senior Secured Notes - 350 350 0.7 - - - Term Loan Due 2021 580 580 1.2 L + 875 1.00 % 30-Jun-21 Total Priority Lien Debt $ 1,450 $ 7 $ 1,457 1.2 x Cov-Lite Term Loan B-3 21 21 1.2 L + 275 0.75 % 24-May-18 Cov-Lite Term Loan B-2 8 8 1.2 L + 350 1.00 % 30-Apr-19 Total Secured Debt $ 1,479 $ 7 $ 1,486 1.2 x Senior Notes due 2020 1,576 1,576 2.5 9.375 % - 01-May-20 Senior Notes due 2022 250 250 2.7 7.750 % - 01-Sep-22 Senior Notes due 2023 551 551 3.2 6.375 % - 15-Jun-23 Total Debt $ 3,856 $ 7 $ 3,863 3.2 x Market Value of Equity 4 939 939 4.0 Total Capitalization $ 4,795 $ 4,802 4.0 x LTM 3Q16 Adjusted EBITDAX $ 1,209 $ 1,209 Total Net Priority Lien Debt / LTM Adj. EBITDAX 1.2 x 1.2 x Total Net Debt / LTM Adj. EBITDAX 3.2 x 3.2 x PD Strip PV-10 5 $ 2,170 $ 2,170 1P Strip PV-10 5 $ 3,948 $ 3,948 PD Strip PV-10 Coverage 6 N/A 1.1 x 1P Strip PV-10 Coverage 6 N/A 2.1 x Liquidity Analysis ($mm) Cash & Cash Equivalents $ 37 $ 37 (+) Borrowing Base 1 1,650 1,545 (-) RBL Drawn (870) (527) (-) Outstanding Letters of Credit (17) (17) Total Liquidity $ 800 $ 1,038 3 2
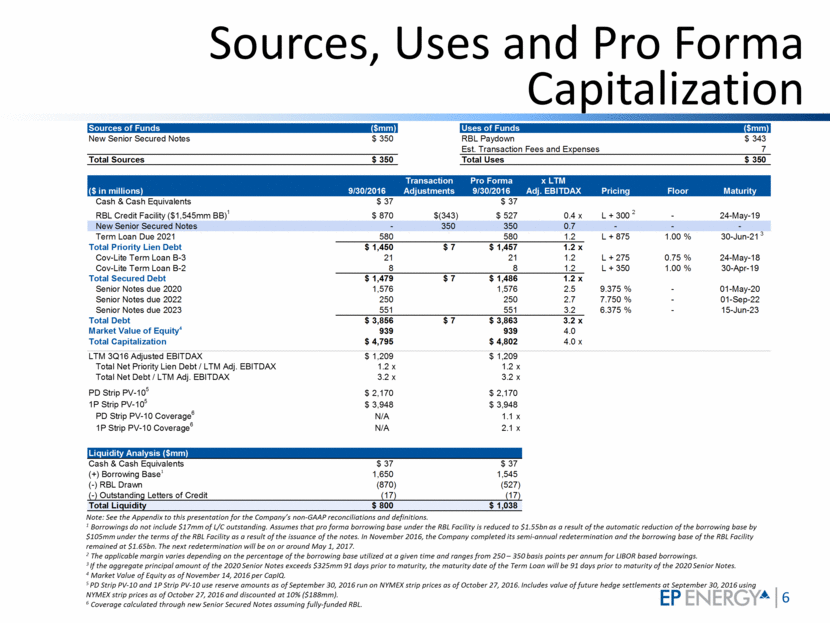
New Senior Secured Notes Collateral Coverage1 Note: $ in millions. See the Appendix to this presentation for the Company’s non-GAAP reconciliations and definitions. 1 Based on PD Strip PV-10 and 1P Strip PV-10 which use reserve amounts as of September 30, 2016 run on NYMEX strip prices as of October 27, 2016. MTM Hedges represents value of future hedge settlements at September 30, 2016 using NYMEX strip prices as of October 27, 2016 and discounted at 10%. 2 Assumes that pro forma borrowing base under the RBL Facility is reduced to $1.55 billion as a result of the automatic reduction of the borrowing base by $105 million under the terms of the RBL Facility as a result of the issuance of the notes. $3,761 $1,982 $188 $188 $3,948 $2,170 - $ 1,500 $ 3,000 $ 4,500 Strip 1P PV-10 (10/27/2016) Strip PD PV-10 (10/27/2016) PV-10 MTM Hedges $1,895 mm through the new Senior Secured Notes and full RBL Borrowing Base 2 $877 mm through the new Senior Secured Notes and RBL Borrowings 2.1x 1.1x 4.5x 2.5x
III. Company Update
EP Energy Corporation UT Reagan Irion Net Acres: ~181,000 3Q’16 Net Production (MBoe/d): 16.8 Gross Drilling Locations: 1,282 ALTAMONT Net Acres: ~178,000 3Q’16 Net Production (MBoe/d): 22.1 Gross Drilling Locations: 3,264 WOLFCAMP Net Acres: ~94,000 3Q’16 Net Production (MBoe/d): 40.6 Gross Drilling Locations: 973 EAGLE FORD EP Energy Acreage 2016 Key Initiatives Further enhance asset performance and returns Continue to improve low-cost, efficient operations Reduce debt Maintain financial flexibility and liquidity 1 3Q’16 net production volumes. 2 As of December 31, 2015 excluding Haynesville Shale asset, sale closed on May 3, 2016. 3 As of September 30, 2016 excluding Haynesville Shale asset, sale closed on May 3, 2016. Overview Improving execution in all asset areas while reducing capital and operating costs 79.6 MBoe/d net production1 ~453,000 total net acres2 ~516 MMBoe proved reserves3 5,519 risked drilling locations2 ~74% economic below $40/Bbl
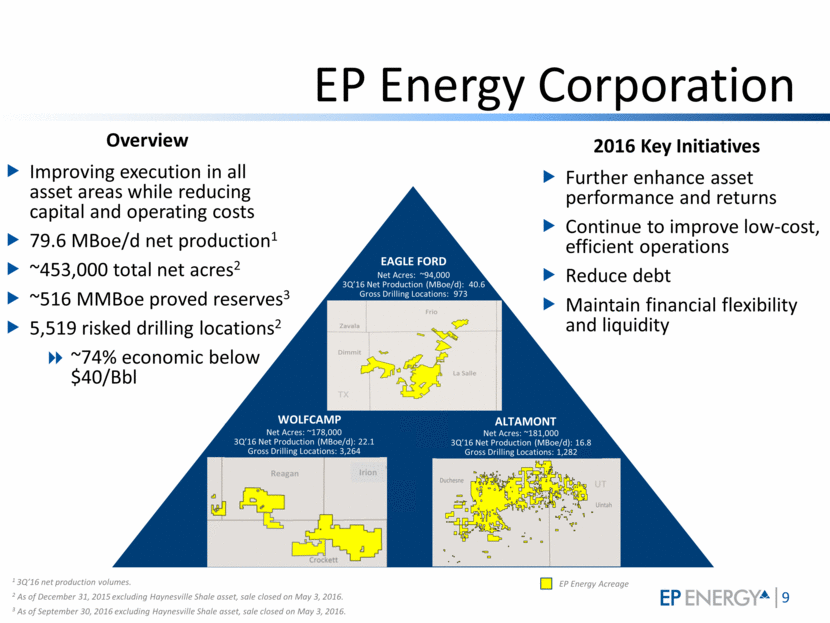
Successfully Adding Value Through Proactive Measures Note: All amounts pro forma for completed and pending asset sales. Building value while positioning for future opportunities Increasing Asset Value Improved well performance and increased efficiencies Significantly reduced well cost and LOE Transformational changes in Wolfcamp program Improved realized pricing, relative to WTI Lower break-even prices Adding Financial Flexibility Reduced net debt by ~$1B since YE’15 Increased oil and natural gas hedges Haynesville divestiture Amended and extended term loans Recently completed Borrowing Base Redetermination at $1.65B No significant debt maturities for nearly 3 years
Key Investment Highlights Significant inventory of high-quality drilling locations Strong operational execution Low cost structure and solid margins Stabilized oil production Leading hedge program Improved financial position Focused on enhancing asset value
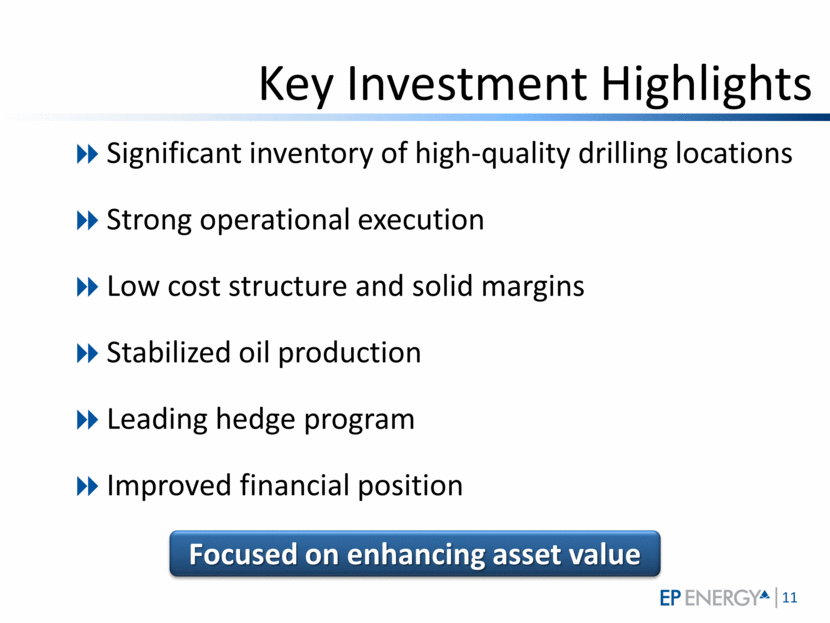
Significant High Quality Future Drilling Inventory Drilling locations by break-even prices 3,264 4,000+ locations economic below $40/Bbl Note: Based on 2015 year-end inventory of all gross locations. We do not have booked reserves associated with 4,654 of these drilling locations, as of year-end 2015. While we believe that the geology/structure of these estimated locations are similar to our prior wells drilled and our PUD locations, there are no assurances that these locations will perform like our historical wells have. All of our assumptions and estimates with respect to economic breakeven prices are speculative in nature and based on the assumptions set forth above and in the Appendix, which may prove to be inaccurate. See the Appendix to this presentation for the Company’s Type Well Economics assumptions. Analysis assumes $2.50 per MMBtu (Henry Hub). 2,687 753 658 347 148 295 230 72 239 90 Wolfcamp Eagle Ford Altamont < $40 $40 - $50 $50 - $60 > $60 1,282 973
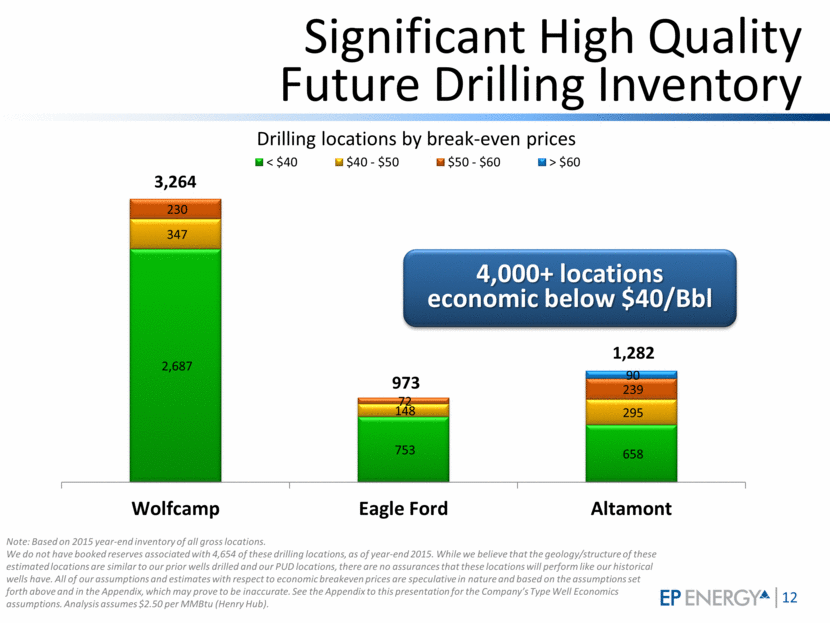
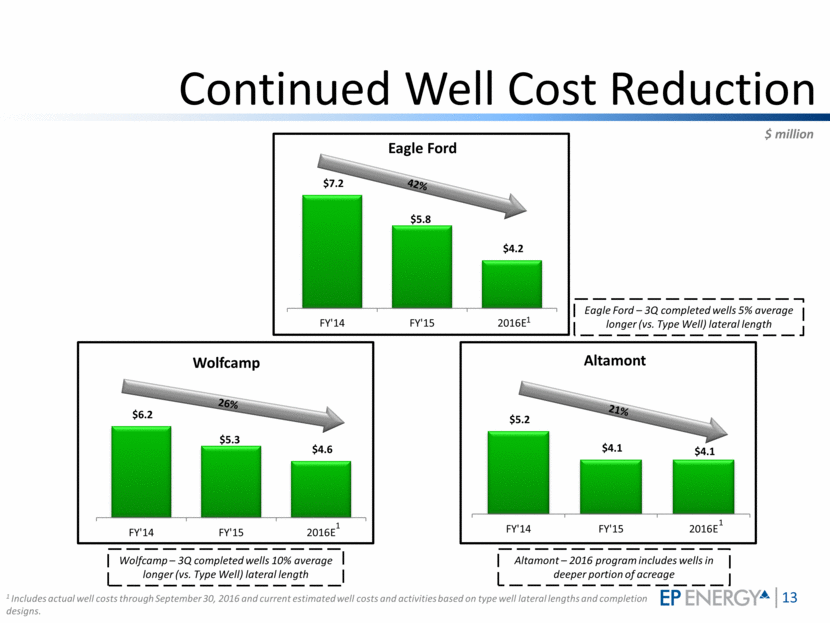
Continued Well Cost Reduction 1 Includes actual well costs through September 30, 2016 and current estimated well costs and activities based on type well lateral lengths and completion designs. 26% 42% Eagle Ford Wolfcamp Altamont $ million 21% 1 1 1 Eagle Ford – 3Q completed wells 5% average longer (vs. Type Well) lateral length Wolfcamp – 3Q completed wells 10% average longer (vs. Type Well) lateral length Altamont – 2016 program includes wells in deeper portion of acreage $7.2 $5.8 $4.2 FY'14 FY'15 2016E $6.2 $5.3 $4.6 FY'14 FY'15 2016E $5.2 $4.1 $4.1 FY'14 FY'15 2016E
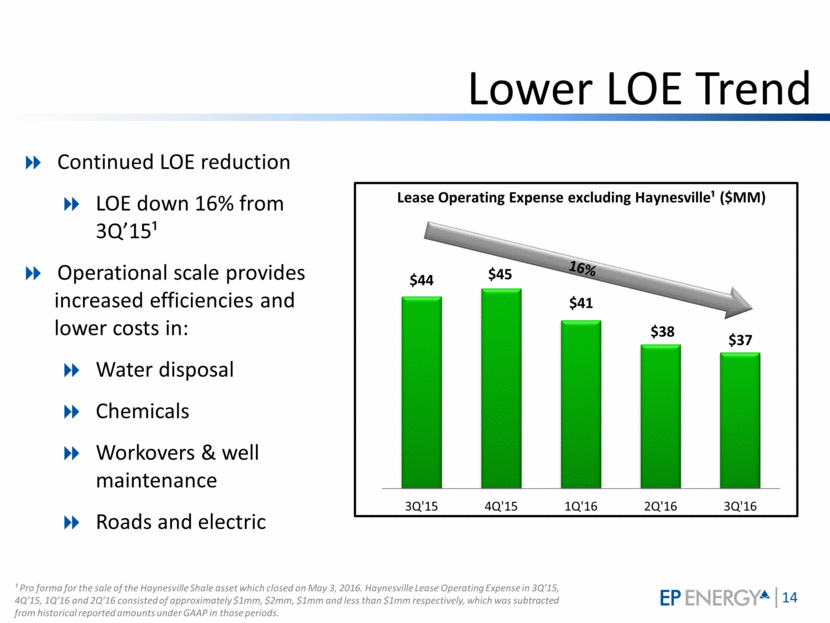
Lower LOE Trend ¹ Pro forma for the sale of the Haynesville Shale asset which closed on May 3, 2016. Haynesville Lease Operating Expense in 3Q’15, 4Q’15, 1Q’16 and 2Q’16 consisted of approximately $1mm, $2mm, $1mm and less than $1mm respectively, which was subtracted from historical reported amounts under GAAP in those periods. Continued LOE reduction LOE down 16% from 3Q’15¹ Operational scale provides increased efficiencies and lower costs in: Water disposal Chemicals Workovers & well maintenance Roads and electric 16% 3Q'15 4Q'15 1Q'16 2Q'16 3Q'16 $44 $45 $41 $38 Lease Operating E xpense excluding Haynesville¹ ($MM) $37
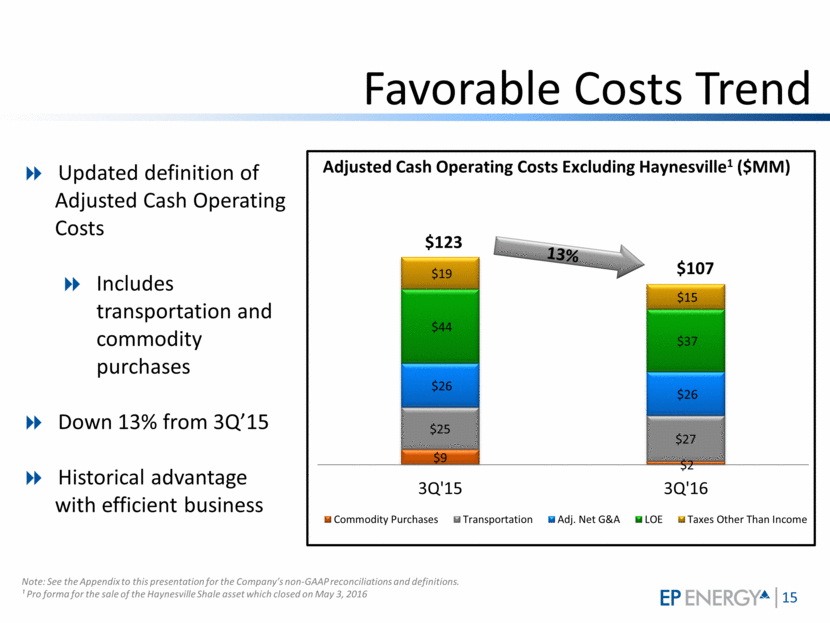
Favorable Costs Trend Note: See the Appendix to this presentation for the Company’s non-GAAP reconciliations and definitions. ¹ Pro forma for the sale of the Haynesville Shale asset which closed on May 3, 2016 13% Updated definition of Adjusted Cash Operating Costs Includes transportation and commodity purchases Down 13% from 3Q’15 Historical advantage with efficient business $9 $2 $25 $27 $26 $26 $44 $37 $19 $15 3Q'15 3Q'16 Commodity Purchases Transportation Adj. Net G&A LOE Taxes Other Than Income $107 $123 Adjusted Cash Operating Costs Excluding Haynesville 1 ($MM)
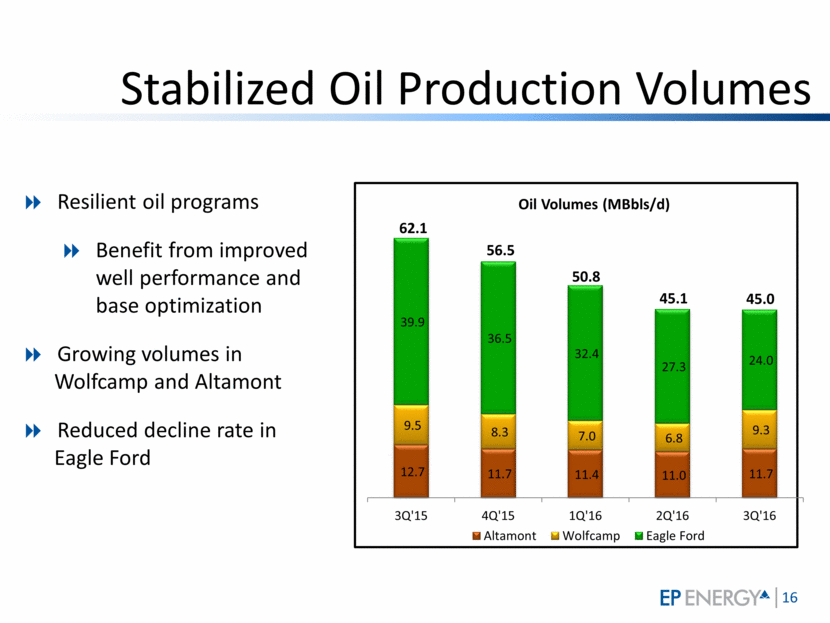
Stabilized Oil Production Volumes Resilient oil programs Benefit from improved well performance and base optimization Growing volumes in Wolfcamp and Altamont Reduced decline rate in Eagle Ford Oil Volumes (MBbls/d) 62.1 56.5 50.8 45.1 45.0 12.7 11.7 11.4 11.0 11.7 9.5 8.3 7.0 6.8 9.3 39.9 36.5 32.4 27.3 24.0 3Q'15 4Q'15 1Q'16 2Q'16 3Q'16 Altamont Wolfcamp Eagle Ford
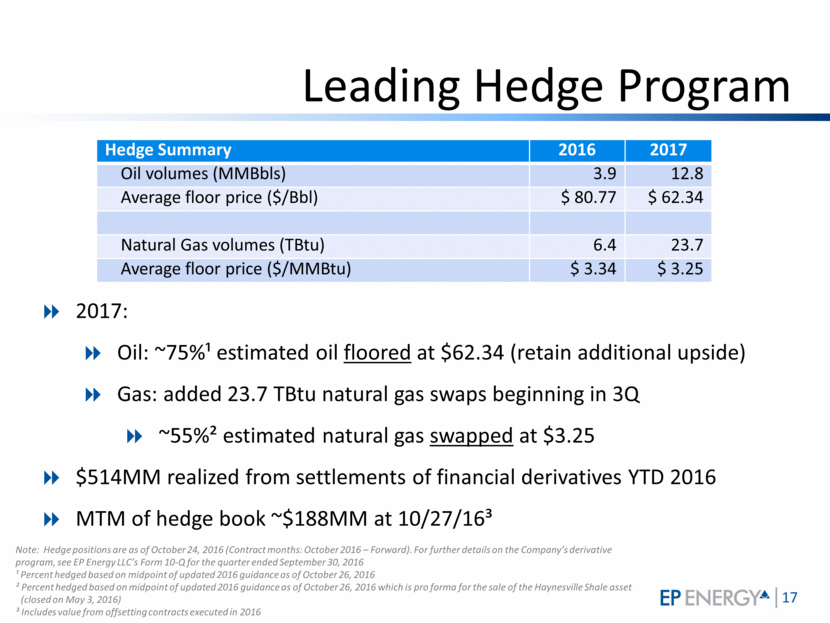
Leading Hedge Program Hedge Summary 2016 2017 Oil volumes (MMBbls) 3.9 12.8 Average floor price ($/Bbl) $ 80.77 $ 62.34 Natural Gas volumes (TBtu) 6.4 23.7 Average floor price ($/MMBtu) $ 3.34 $ 3.25 Note: Hedge positions are as of October 24, 2016 (Contract months: October 2016 – Forward). For further details on the Company’s derivative program, see EP Energy LLC’s Form 10-Q for the quarter ended September 30, 2016 ¹ Percent hedged based on midpoint of updated 2016 guidance as of October 26, 2016 ² Percent hedged based on midpoint of updated 2016 guidance as of October 26, 2016 which is pro forma for the sale of the Haynesville Shale asset (closed on May 3, 2016) ³ Includes value from offsetting contracts executed in 2016 2017: Oil: ~75%¹ estimated oil floored at $62.34 (retain additional upside) Gas: added 23.7 TBtu natural gas swaps beginning in 3Q ~55%² estimated natural gas swapped at $3.25 $514MM realized from settlements of financial derivatives YTD 2016 MTM of hedge book ~$188MM at 10/27/16³
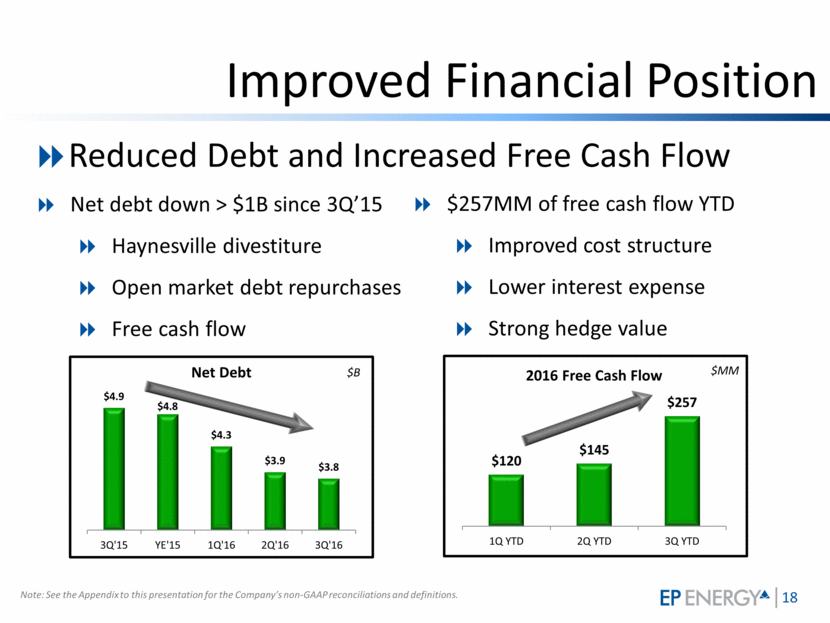
Improved Financial Position Net debt down > $1B since 3Q’15 Haynesville divestiture Open market debt repurchases Free cash flow $MM $B $257MM of free cash flow YTD Improved cost structure Lower interest expense Strong hedge value Note: See the Appendix to this presentation for the Company’s non-GAAP reconciliations and definitions. Reduced Debt and Increased Free Cash Flow $4.9 $4.8 $4.3 $3.9 $3.8 3Q'15 YE'15 1Q'16 2Q'16 3Q'16 Net Debt $ 120 $ 145 $ 257 1Q YTD 2Q YTD 3Q YTD 2016 Free Cash Flow
IV. Asset Overview
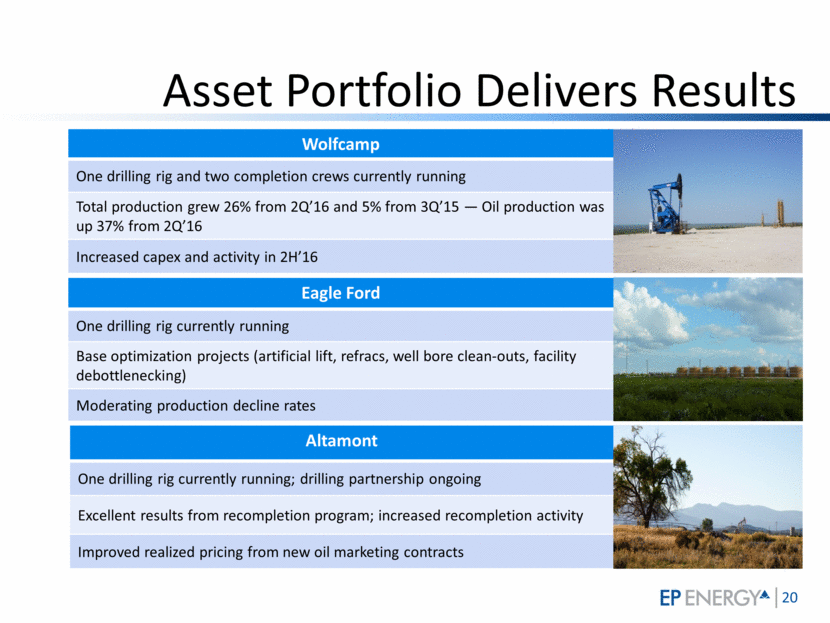
Wolfcamp One drilling rig and two completion crews currently running Total production grew 26% from 2Q’16 and 5% from 3Q’15 — Oil production was up 37% from 2Q’16 Increased capex and activity in 2H’16 Eagle Ford One drilling rig currently running Base optimization projects (artificial lift, refracs, well bore clean-outs, facility debottlenecking) Moderating production decline rates Asset Portfolio Delivers Results Altamont One drilling rig currently running; drilling partnership ongoing Excellent results from recompletion program; increased recompletion activity Improved realized pricing from new oil marketing contracts
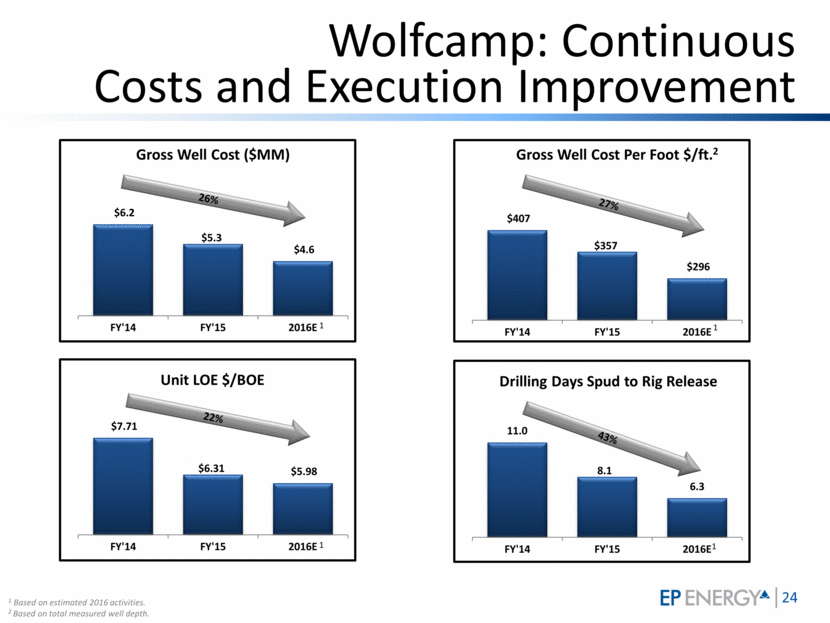
Type Well Economics Eagle Ford Altamont Well Cost: ~ $4.2MM Lateral Length: 5,700 ft Break-even Price: ~$35 per Bbl Well Cost: ~ $4.3MM Vertical Depth: ~13,000 ft Break-even Price: ~$33 per Bbl NYMEX WTI NYMEX WTI Note: WTI price required to generate a 10% pre-tax IRR using $2.50 per MMBtu (Henry Hub) natural gas price. See the Appendix to this presentation for the Company’s Type Well Economics assumptions. BTAX IRR BTAX IRR Well Cost: ~ $4.0MM Lateral Length: 7,500 ft Break-even Price: ~$32 per Bbl Wolfcamp BTAX IRR NYMEX WTI 0% 15% 30% 45% $40.00 $50.00 $60.00 0% 15% 30% 45% $40.00 45 $50.00 55 $60.00 0% 15% 30% 45% 60% 75% $40.00 $50.00 $60.00
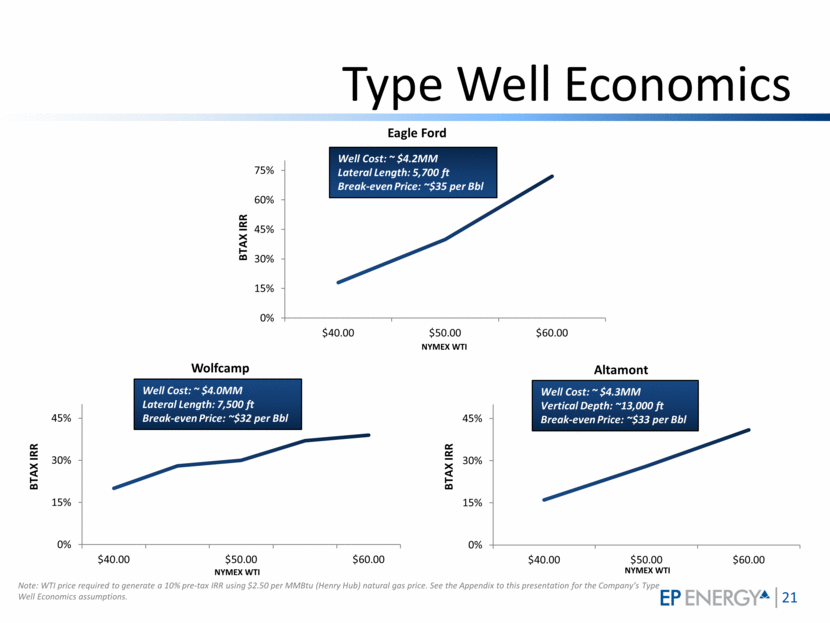
Eagle Ford: Continuous Improvement Continuing to reduce costs and increase operational efficiencies <$5.00 LOE per Boe Improved realized pricing relative to WTI ~$35 break-even oil price¹ DUC inventory provides flexibility in 2H’16 Base production optimization Advancing completion and reservoir modeling Gross Well Cost2 ($MM) Total Well Cost per Foot2 ($/ft.) Rig Days (Spud to Rig Release) 1 Break-even oil price (WTI) required to generate a 10 percent pre-tax IRR using latest well costs and Eagle Ford type curve and a $2.50 per MMBtu (Henry Hub) natural gas price for 5 to 10 year activity period. See the Appendix to this presentation for the Company’s Type Well Economics assumptions. ² Includes drilling, completing and well site facilities. 49% 50% 43% $8.3 $7.4 $7.2 $5.8 $4.2 2012 2013 2014 2015 2016E $569 $498 $489 $379 $286 2012 2013 2014 2015 2016E 14 12 10 9 8 2012 2013 2014 2015 2016E
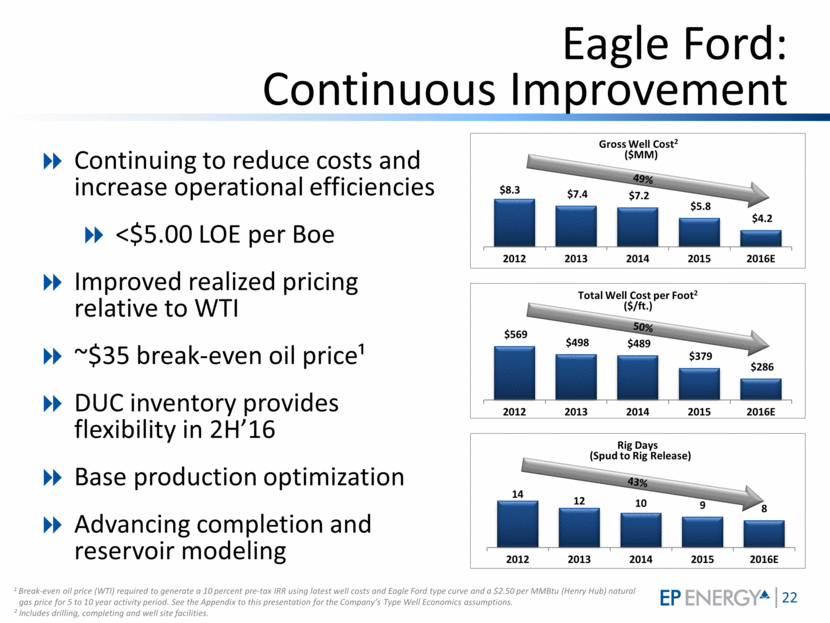
Altamont: Long-term Asset With Improved Results Enhanced well economics with on-going drilling partnership ~$33 break-even oil price¹ Continued cost reductions and operational efficiencies Base production improvements Strong recompletion results drive increased activity Improved oil marketing contracts Gross Well Cost2 ($MM) Total Well Cost per foot2 ($/ft.) Rig Days (Spud to Rig Release) 1 Break-even oil price (WTI) required to generate a 10 percent pre-tax IRR using latest well costs and Altamont type curve, and a $2.50 per MMBtu (Henry Hub) natural gas price for 5 to 10 year activity period. See the Appendix to this presentation for the Company’s Type Well Economics assumptions. 2 Includes drilling, completing and well site facilities. 3 2016E Altamont well depths are greater than previous period averages. 3 31% 32% 13% 3 3 $5.9 $5.4 $5.2 $4.1 $ 4.1 2012 2013 2014 2015 2016E $472 $441 $425 $344 $322 2012 2013 2014 2015 2016E 31 24 21 13 27 2012 2013 2014 2015 2016E
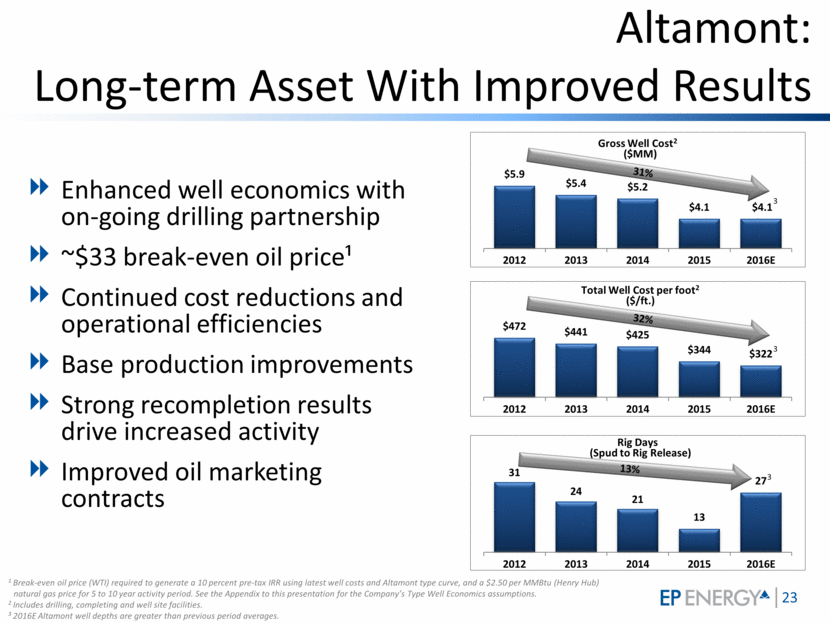
1 Based on estimated 2016 activities. 2 Based on total measured well depth. 26% Gross Well Cost ($MM) 22% Unit LOE $/BOE 1 43% Drilling Days Spud to Rig Release 1 27% Gross Well Cost Per Foot $/ft.2 Wolfcamp: Continuous Costs and Execution Improvement 1 1 $6.2 $5.3 $ 4.6 FY'14 FY'15 2016E $7.71 $6.31 $5.98 FY'14 FY'15 2016E 11.0 8.1 6.3 FY'14 FY'15 2016E $407 $357 $296 FY'14 FY'15 2016E
Wolfcamp: Increasing Capital Allocation 3,264 future drilling locations1 High oil-in-place area of basin Large contiguous acreage Single royalty owner Multiple landing zones A, B and C benches ~900’ total pay-zone Contiguous block supports efficient low-cost operations Large-scale, shared facilities 1 As of December 31, 2015
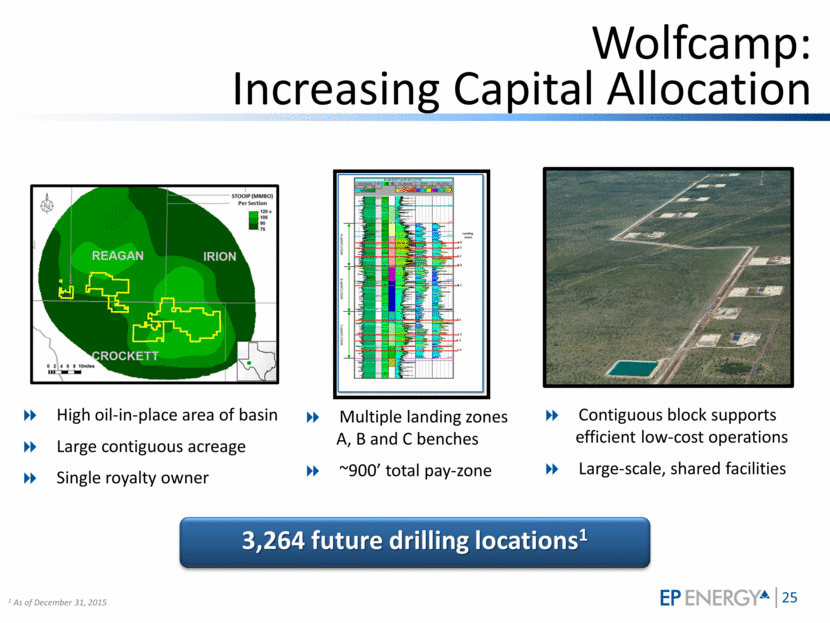
Wolfcamp: Enhancing Asset Value Advancing technical understanding Refining landing zone targets Continued completion optimization Dynamic earth model progression Top tier operational execution, capital and operating costs Current well performance enhancements Testing longer laterals Modifying fluid designs Expanding development into Reagan County 1 Break-even oil price (WTI) required to generate a 10 percent pre-tax IRR using latest well cost, current 600 MBoe type curve and a $2.50 per MMBtu (Henry Hub) natural gas price for 5 to 10 year activity period. See the Appendix to this presentation for the Company’s Type Well Economics assumptions. Completed UL development amendment Improved economics ~$32/Bbl break-even price1 38% BTAX IRR at $55/Bbl Program returns competitive with Northern Midland Basin Ability to invest long-term, through cycles
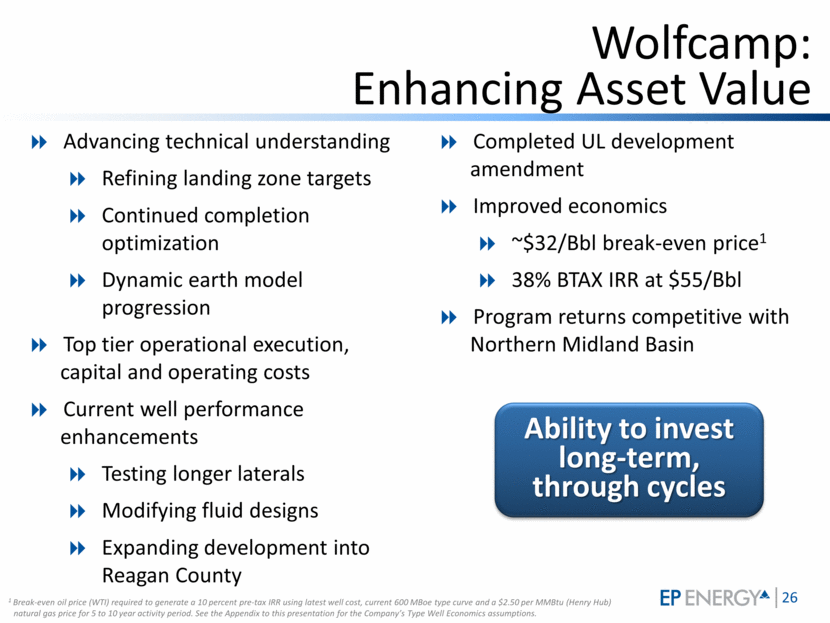
Relative Rock Strength STOOIP Mechanical Properties Lithology Shales Limestones Spraberry Organics Wolfcamp A/B/C Earth Model 3D Seismic Define sub-surface using the Earth Model Reservoir and petrophysical properties Mechanical properties 3D seismic Define optimal landing zone Highest oil in place Competent rock to maintain wellbore stability Avoidance of drilling and completion hazards Efficiently geosteer lateral in +/- 10 foot target window Finalize completion design using “as drilled” data RES RHOB PHIT YMS SHMIN BRIT SWT GR A 1.5 target Completion Planner Wolfcamp: Advancing Technical Understanding
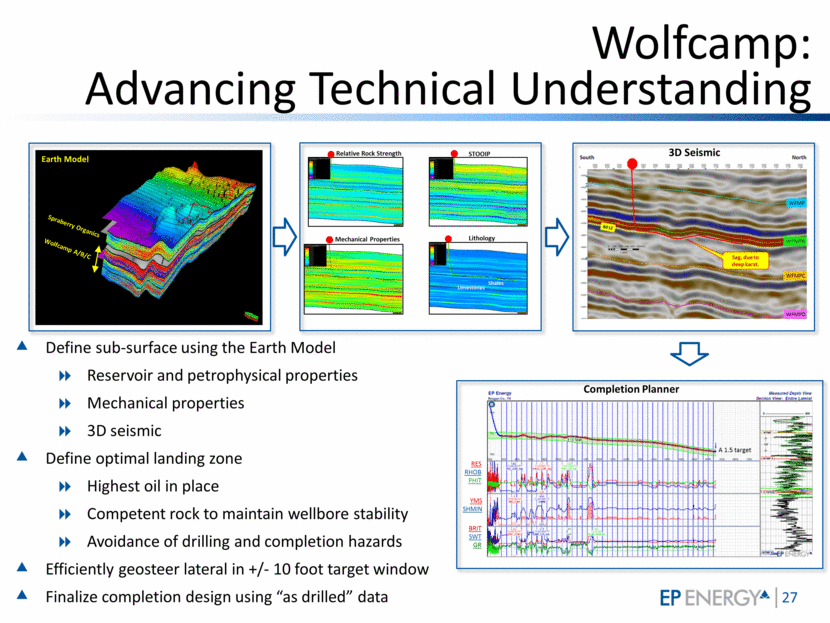
Wolfcamp: Rapidly Improving Program Capital efficient production growth Higher returns Improved well performance Increased oil percentage Reduced operating and capital costs Benefitting from sliding scale royalty Increased technical understanding Expanded activities in Reagan and Crockett Counties 9.5 8.3 7.0 6.8 9.3 3Q'15 4Q'15 1Q'16 2Q'16 3Q'16 Oil Production (MBbls/d) 0 10 20 30 40 50 60 70 80 0 50 100 150 200 250 300 350 400 Cumulative Production, MBO Normalized Time, Days Generation 1 Generation 2 Generation 3 600 MBOE
Appendix
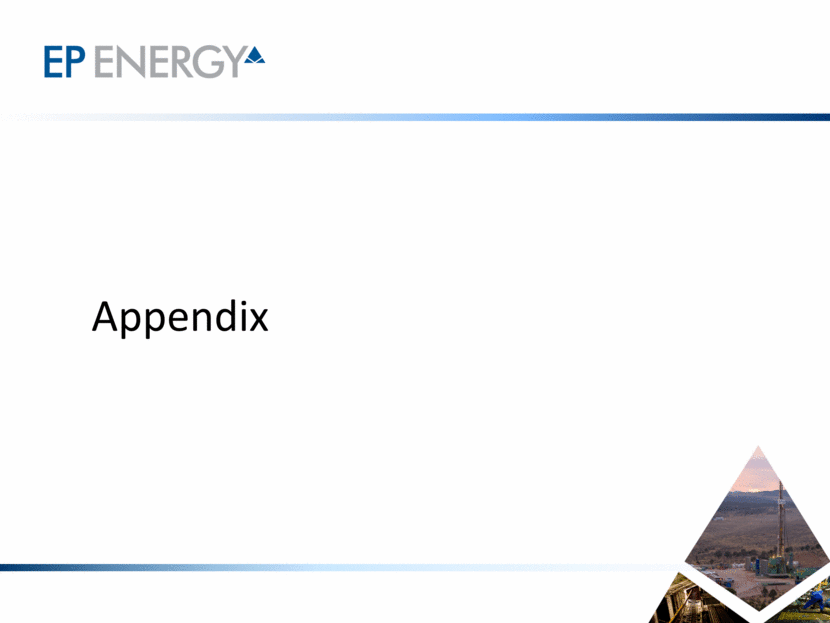
Glossary This contains a glossary of terms used in this presentation. They are for reference only and may not be comparable to similarly titled measures used at other companies. Non-GAAP Financial Measures Adjusted EBITDAX EBITDAX is defined as net income (loss) plus interest and debt expense, income taxes, depreciation, depletion and amortization and exploration expense. Adjusted EBITDAX is defined as EBITDAX, adjusted as applicable in the relevant period for the net change in the fair value of derivatives (mark-to-market effects of financial derivatives, net of cash settlements and cash premiums paid or received related to these derivatives), the non-cash portion of compensation expense (which represents non-cash compensation expense under long-term incentive programs adjusted for cash payments made under long-term incentive plans), transition, restructuring and other costs that affect comparability, gains and losses on extinguishment of debt, gains and/or losses on sales of assets and impairment charges. Adjusted EBITDAX is used by management and we believe provides investors with additional information (i) to evaluate our ability to service debt adjusting for items required or permitted in calculating covenant compliance under our debt agreements, (ii) to provide an important supplemental indicator of the operational performance of our business without regard to financing methods and capital structure, (iii) for evaluating our performance relative to our peers, (iv) to measure our liquidity (before cash capital requirements and working capital needs) and (v) to provide supplemental information about certain material non-cash and/or other items that may not continue at the same level in the future. Adjusted EBITDAX has limitations as an analytical tool and should not be considered in isolation or as a substitute for analysis of our results as reported under U.S. GAAP or as an alternative to net income (loss), operating income (loss), operating cash flows or other measures of financial performance or liquidity presented in accordance with U.S. GAAP. For example, our presentation of Adjusted EBITDAX may not be comparable to similarly titled measures used by other companies in our industry. Furthermore, our presentation of Adjusted EBITDAX should not be construed as an inference that our future results will be unaffected by the items noted above or what we believe to be other unusual items, or that in the future we may not incur expenses that are the same as or similar to some of the adjustments in this presentation. Adjusted Cash Operating Costs Adjusted cash operating costs is a non-GAAP measure used by management as a performance measure, and we believe provides investors valuable information related to our operating performance and our operating efficiency relative to other industry participants and comparatively over time across our historical results. Adjusted cash operating costs is defined as total operating expenses, excluding depreciation, depletion and amortization expense, exploration expense, impairment charges, gains and/or losses on sales of assets, the non-cash portion of compensation expense (which represents compensation expense under long-term incentive programs adjusted for cash payments made under long-term incentive plans) and transition, restructuring and other costs that affect comparability. We use this measure to describe the costs required to directly or indirectly operate our existing assets and produce and sell our oil and natural gas, including the costs associated with the delivery and purchases and sales of produced commodities. Accordingly, we exclude depreciation, depletion, and amortization and impairment charges as such costs are non-cash in nature. We exclude exploration expense from our measure as it is substantially non-cash in nature and is not related to the costs to operate our existing assets. Similarly, gains and losses on the sale of assets are excluded as they are unrelated to the operation of our assets. We exclude the non-cash portion of compensation expense as well as transition, restructuring and other costs that affect comparability, as we believe such adjustments allow investors to evaluate our costs against others in our industry and these items can vary across companies due to different ownership structures, compensation objectives or the occurrence of transactions. This measure is subject to limitations as analytical tools, and should not be considered in isolation as a substitute for analysis of our results as reported under U.S. GAAP or as an alternative to operating expenses, operating cash flows or other measures of financial performance or liquidity presented in accordance with U.S. GAAP. This measure may also not be comparable to similarly titled measures used by other companies. Free Cash Flow Free Cash Flow is a non-GAAP measure defined as net cash provided by operating activities less cash paid for capital expenditures. Free Cash Flow is used by management and we believe provides investors with useful information for analysis of the company’s ability to internally fund capital expenditures and to service or incur additional debt. For the quarter ended March 31, 2016, the Company’s free cash flow was approximately $120 million (net cash provided by operating activities of approximately $299 million less cash paid for capital expenditures of approximately $179 million). For the six months ended June 30, 2016, the Company’s free cash flow was approximately $145 million (net cash provided by operating activities of approximately $403 million less cash paid for capital expenditures of approximately $258 million). For the nine months ended September 30, 2016, the Company’s free cash flow was approximately $257 million (net cash provided by operating activities of approximately $655 million less cash paid for capital expenditures of approximately $398 million).
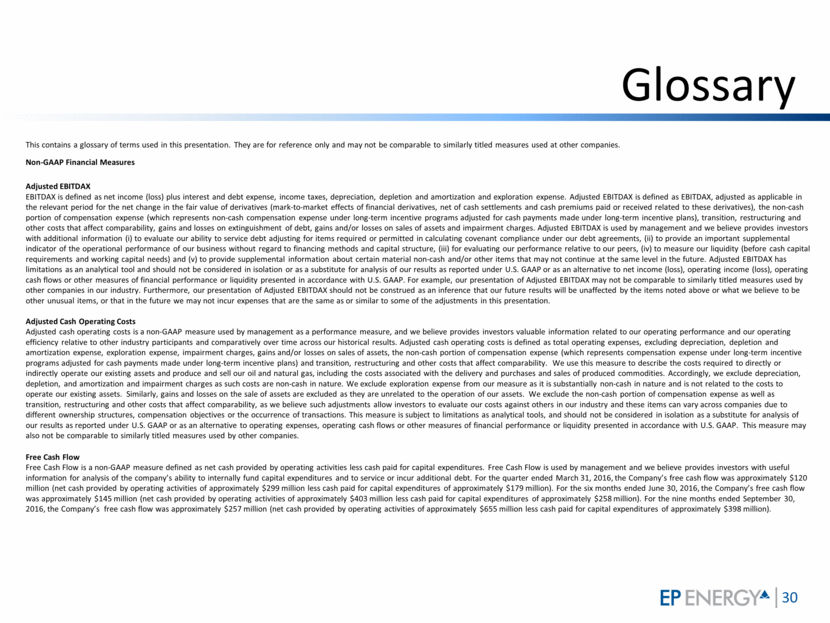
Glossary (Cont’d) This contains a glossary of terms used in this presentation. They are for reference only and may not be comparable to similarly titled measures used at other companies. Non-GAAP Financial Measures (Cont’d) Net Debt Net Debt is a non-GAAP measure defined as long-term debt less cash and cash equivalents. We believe Net Debt provides useful information to investors for analysis of the Company’s financial position and/or liquidity; however, this measure may not be comparable to similarly titled measures used by other companies and is subject to several of the same limitations as analytical tools as noted in the paragraphs above. Net Debt should not be considered in isolation as a substitute to long-term debt as reported under U.S. GAAP or as an alternative to other measures of financial position or liquidity presented in accordance with U.S. GAAP. At September 30, 2015, the Company’s net debt was approximately $4.9 billion (total debt of approximately $4,931 million less cash and cash equivalents of approximately $25 million). At December 31, 2015, the company's net debt was approximately $4.8 billion (total debt of approximately $4,869 million less cash and cash equivalents of approximately $24 million). At March 31, 2016, the Company’s net debt was approximately $4.3 billion (total long-term debt of approximately $4,348 million less cash and cash equivalents of approximately $89 million). At June 30, 2016, the Company’s net debt was approximately $3.9 billion (total long-term total debt of approximately $3,916 million less cash and cash equivalents of approximately $36 million). At September 30, 2016, the Company's net debt was approximately $3.8 billion (total debt of approximately $3,856 million less cash and cash equivalents of approximately $37 million). PV-10 PV-10 is a non GAAP measure and is derived from the standardized measure of discounted future net cash flows, which is the most directly comparable GAAP financial measure. Our PV-10 differs from our standardized measure because our standardized measure reflects discounted future income taxes related to our domestic operations. We believe that the presentation of PV-10 is relevant and useful to investors because it presents the relative monetary significance of our oil, natural gas and NGLs properties regardless of tax structure. Further, investors may utilize the measure as a basis for comparison of the relative size and value of our reserves to other companies. We use this measure when assessing the potential return on investment related to our oil, natural gas and NGLs properties. PV-10, however, is not a substitute for the standardized measure of discounted future net cash flows. Our PV-10 measure and the standardized measure of discounted future net cash flows do not purport to present the fair value of our oil (including NGLs) and natural gas reserves. The unweighted arithmetic average of the historical first day of the month prices for the prior 12 months was $50.28 per barrel of oil (WTI) and $2.59 per MMBtu of natural gas (Henry Hub) as of December 31, 2015, and $41.68 per barrel of oil (WTI) and $2.28 per MMBtu of natural gas (Henry Hub) as of September 30, 2016. Pricing used to calculate the standardized measure of discounted future net cash flows is based on SEC Regulation S-X, Rule 4-10 as amended, using the 12-month average price calculated as the unweighted arithmetic average of the spot price on the first day of each month preceding the 12-month period prior to the end of the reporting period.
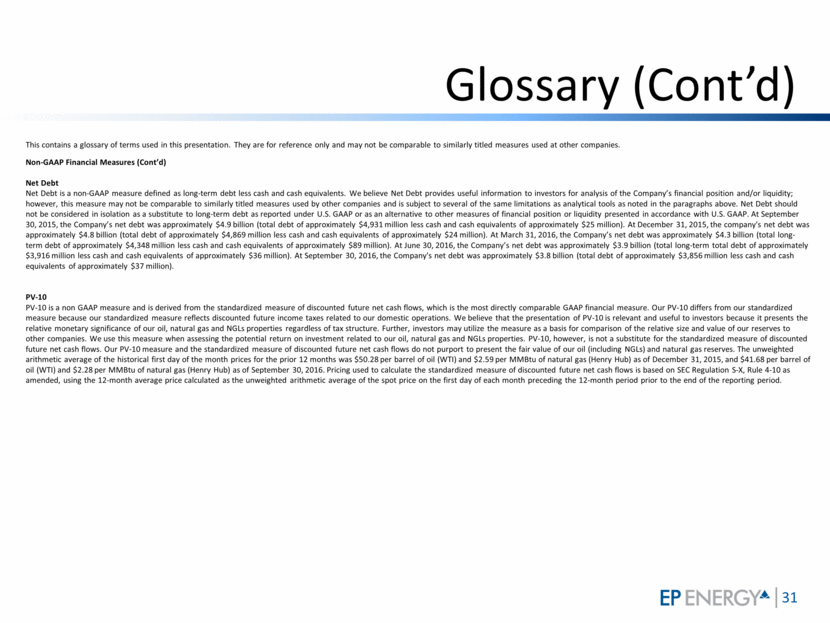
Reconciliation of Adjusted EBITDAX ¹ The LTM ended September 30, 2016 is calculated by subtracting the nine months ended September 30, 2015 from the twelve months ended December 31, 2015 and adding the nine months ended September 31, 2016. 2 Represents the income statement impact of financial derivatives. 3 Represents actual cash settlements related to financial derivatives. No cash premiums were received or paid for the nine months ended September 30, 2016 and 2015 or the twelve months ended December 31, 2015. 4 For the nine months ended September 30, 2016 and 2015, cash payments were approximately $3 million and $8 million, respectively. For the twelve months ended December 31, 2015, cash payments were approximately $8 million. 5 Reflects transition and severance costs related to workforce reductions for the nine months ended September 30, 2016 and 2015 and the twelve months ended December 31, 2015. 6 Represents the gain on sale of our Haynesville Shale assets sold in May 2016. 7 Represents the gain on extinguishment of debt recorded related to the repurchase of over $800 million in aggregate principal amount of our senior unsecured notes and term loans for the nine months ended September 30, 2016. Represents the loss on extinguishment of debt recorded related to the repayment in May 2015 of our 2019 $750 million senior secured notes for the nine months ended September 31, 2015 and the twelve months ended December 31, 2015. ($ in millions) Nine months ended September 30, 2015 Twelve months ended December 31, 2015 Nine months ended September 30, 2016 LTM ended September 30, 2016¹ Net (loss) income $(17) $(3,212) $119 $(3,076) Income tax benefit (13) (1,114) (5) (1,106) Interest expense, net of capitalized interest 249 330 231 312 Depreciation, depletion and amortization 737 983 342 588 Exploration expense 12 18 3 9 EBITDAX 968 (2,995) 690 (3,273) Mark-to-market on financial derivatives² (458) (667) 20 (189) Cash settlements and cash premiums on financial derivatives³ 649 942 514 807 Non-cash portion of compensation expense? 8 13 12 17 Transition, restructuring and other costs? 8 8 10 10 Gain on sale of assets ? - - (78) (78) Loss (gain) on extinguishment of debt? 41 41 (384) (384) Impairment charges - 4,299 - 4,299 Adjusted EBITDAX $1,216 $1,641 $784 $1,209
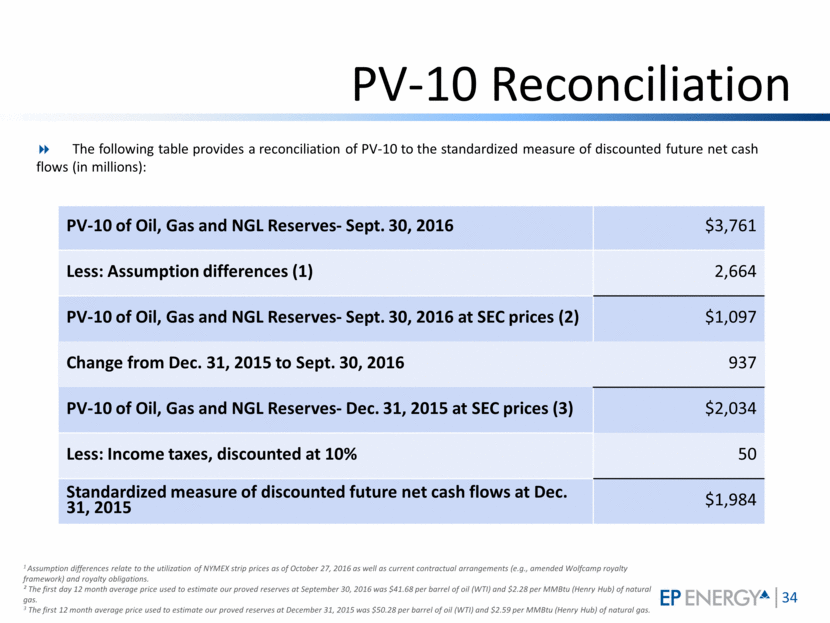
Reconciliation of Pro Forma Adjusted Cash Operating Costs Note: The Adjusted Cash Operating Costs table above is presented on a pro forma basis to give effect to the divestiture of the Haynesville Shale in May 2016 for approximately $420 million in cash (with net proceeds of approximately $388 million after customary adjustments). ¹ Both of the quarters ended September 30, 2016 and 2015, include $5 million of non-cash compensation expense. ($ in millions) Reported Haynesville Pro Forma Reported Haynesville Pro Forma Oil and natural gas purchases $2 $- $2 $9 - $9 Transportation costs 27 - 27 30 5 25 Lease operating expense 37 - 37 45 1 44 General and administrative 31 - 31 32 1 31 Depreciation, depletion and amortization 132 - 132 260 9 251 Loss on sale of assets 4 4 - - - - Exploration and other expense 1 - 1 2 - 2 Taxes, other than income taxes 15 - 15 20 1 19 Total operating expenses $249 $4 $245 $398 $17 $381 Adjustments: Depreciation, depletion and amortization (132) - (132) (260) (9) (251) Loss on sale of assets (4) (4) - - - - Exploration expense (1) - (1) (2) - (2) Transition/restructuring costs, non-cash portion of compensation expense and other ¹ (5) - (5) (5) - (5) Adjusted cash operating costs $107 $- $107 $131 $8 $123 Quarter ended September 30, 2016 Quarter ended September 30, 2015
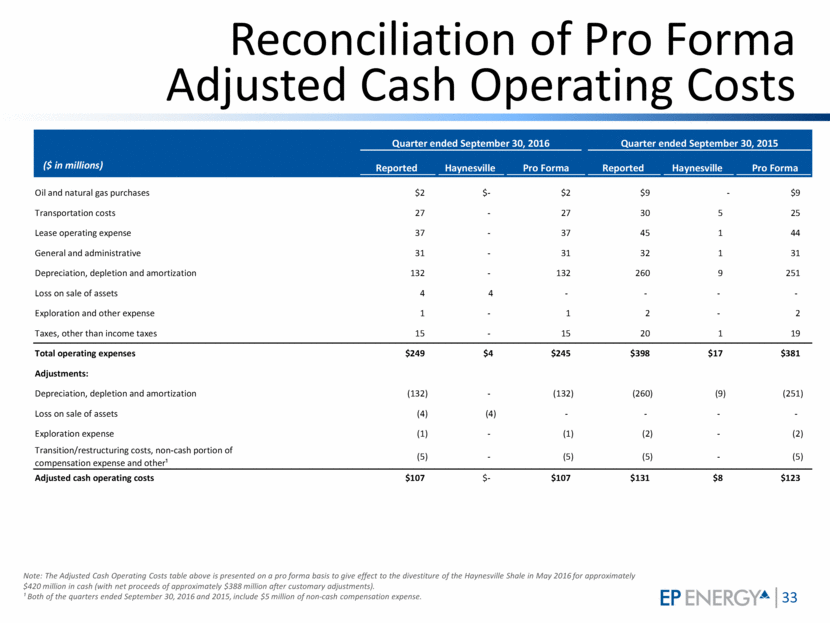
As of September 30, 2015 PV-10 of Oil, Gas and NGL Reserves- Sept. 30, 2016 $3,761 Less: Assumption differences (1) 2,664 PV-10 of Oil, Gas and NGL Reserves- Sept. 30, 2016 at SEC prices (2) $1,097 Change from Dec. 31, 2015 to Sept. 30, 2016 937 PV-10 of Oil, Gas and NGL Reserves- Dec. 31, 2015 at SEC prices (3) $2,034 Less: Income taxes, discounted at 10% 50 Standardized measure of discounted future net cash flows at Dec. 31, 2015 $1,984 PV-10 Reconciliation The following table provides a reconciliation of PV-10 to the standardized measure of discounted future net cash flows (in millions): 1 Assumption differences relate to the utilization of NYMEX strip prices as of October 27, 2016 as well as current contractual arrangements (e.g., amended Wolfcamp royalty framework) and royalty obligations. ² The first day 12 month average price used to estimate our proved reserves at September 30, 2016 was $41.68 per barrel of oil (WTI) and $2.28 per MMBtu (Henry Hub) of natural gas. 3 The first 12 month average price used to estimate our proved reserves at December 31, 2015 was $50.28 per barrel of oil (WTI) and $2.59 per MMBtu (Henry Hub) of natural gas.
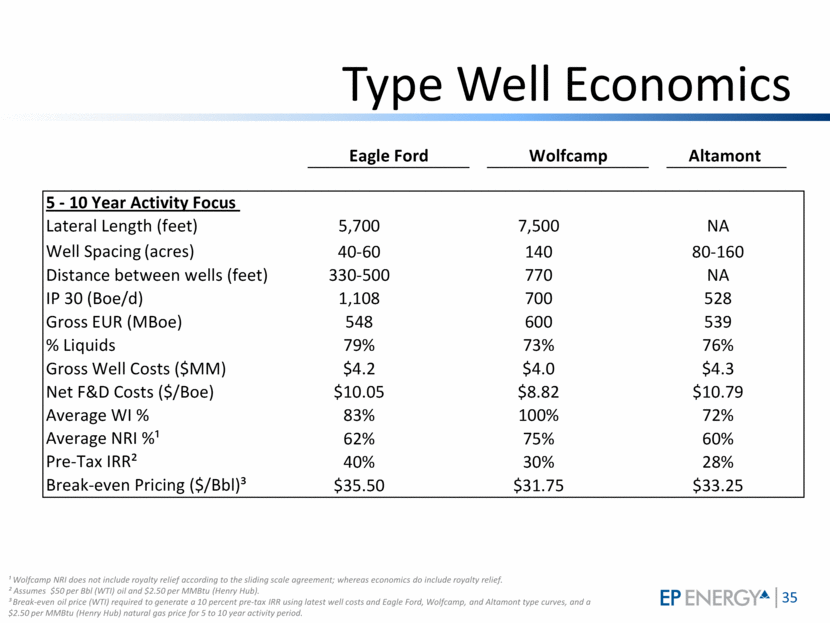
Type Well Economics ¹ Wolfcamp NRI does not include royalty relief according to the sliding scale agreement; whereas economics do include royalty relief. ² Assumes $50 per Bbl (WTI) oil and $2.50 per MMBtu (Henry Hub). ³ Break-even oil price (WTI) required to generate a 10 percent pre-tax IRR using latest well costs and Eagle Ford, Wolfcamp, and Altamont type curves, and a $2.50 per MMBtu (Henry Hub) natural gas price for 5 to 10 year activity period. 5 - 10 Year Activity Focus Lateral Length (feet) 5,700 7,500 NA Well Spacing (acres) 40-60 140 80-160 Distance between wells (feet) 330-500 770 NA IP 30 (Boe/d) 1,108 700 528 Gross EUR (MBoe) 548 600 539 % Liquids 79% 73% 76% Gross Well Costs ($MM) $4.2 $4.0 $4.3 Net F&D Costs ($/Boe) $10.05 $8.82 $10.79 Average WI % 83% 100% 72% Average NRI % ¹ 62% 75% 60% Pre-Tax IRR ² 40% 30% 28% Break-even Pricing ($/Bbl) ³ $35.50 $31.75 $33.25 Eagle Ford Wolfcamp Altamont
