Attached files
| file | filename |
|---|---|
| EX-99.1 - EXHIBIT 99.1 - Superior Drilling Products, Inc. | v453088_ex99-1.htm |
| 8-K - 8-K - Superior Drilling Products, Inc. | v453088_8k.htm |
Exhibit 99.2

© 2016 Superior Drilling Products Third Quarter 2016 Financial Results Conference Call November 15, 2016 NYSE MKT: SDPI
© 2016 Superior Drilling Products 2 Safe Harbor Statement These slides and the accompanying oral presentation contain “forward - looking statements” within the meaning of the safe harbor provisions, 15 U.S.C. † 78u - 5, of the Private Securities Litigation Reform Act of 1995. All statements, other than statements of historical fact included in these slides and the accompanying oral presentation, regarding our strategy, future operations, financial position, estimated revenue and losses, projected costs, prospects, plans and objectives of management, are forward - looking statements. The use of words “could,” “believe,” “anticipate,” “intend,” “estimate,” “expect,” “may,” “continue,” “predict,” “potential,” “project”, “forecast,” “should” or “plan, and similar expressions are intended to identify forward - looking statements, although not all forward - looking statements contain such identifying words. Certain statements in these slides and the accompanying oral presentation may constitute forward - looking statements, including statements regarding the Company’s financial position, market success with specialized tools, effectiveness of its sales efforts, success at developing future tools, and the Company’s effectiveness at executing its business strategy and plans. These statements reflect the beliefs and expectations of the Company and are subject to risks and uncertainties that may cause actual results to differ materially. These risks and uncertainties include, among other factors, our business strategy and prospects for growth; our cash flows and liquidity; our financial strategy, budget, projections and operating results; the amount, nature and timing of capital expenditures; the availability and terms of capital; competition and government regulations; and general economic conditions. These and other factors could adversely affect the outcome and financial effects of the Company’s plans and described herein. Therefore, you should not rely on any of these forward - looking statements. Any forward - looking statement made by us in these slides and the accompanying oral presentation is based only on information currently available to us and speaks only as of the date on which it is made. We undertake no obligation to publicly update any forward - looking statement, whether written or oral, that may be made from time to time, whether as a result of new information, future developments or otherwise.
© 2016 Superior Drilling Products Troy Meier Chairman and Chief Executive Officer

© 2016 Superior Drilling Products 4 $1.0 $0.2 $0.4 $2.0 $0.9 $1.9 Q3 2015 Q2 2016 Q3 2016 Contract Services Revenue Tool Revenue ($ in millions) Revenue $3.0 $2.3 $ 1.1 ► Sequential increase in tool revenue reflects DTI agreement ▪ Yet at early stages of customer development ▪ Growth also shows value of royalty and repair revenue (in other) ► Rig count up 40% from historic low in May 2016, but still down 18% from beginning of year ► Contract Services revenue doubled sequentially due to market recovery Revenue Turning Point Tool Revenue by Category ($ in thousands) Q3 2015 Q4 2015 Q1 2016 Q2 2016 Q3 2016 Tool sales $ - $ - $ - $ 427 $ 1,633 Tool rental 1,831 1,623 902 419 93 Other related revenue 159 137 52 42 119 Total tool revenue $ 1,990 $ 1,760 $ 954 $ 888 $ 1,845

© 2016 Superior Drilling Products 5 ► Operators and service companies benefitting from improved wellbore quality ▪ Less time to back - out of well after reaching target depth ▪ Creates efficiencies for production ► Improved Rotary Steerable System (RSS) performance ► Helps get RSS through curve to drill laterals more effectively ► Average tool size increasing ► Growing end user base (since July) ▪ Nine new end users including several oilfield service companies ▪ New basins: Eagle Ford & Canada Drill - N - Ream ® Driving Record Setting Performance Operators achieving greater footage in less time

© 2016 Superior Drilling Products 6

© 2016 Superior Drilling Products Financial Results Christopher D. Cashion Chief Financial Officer
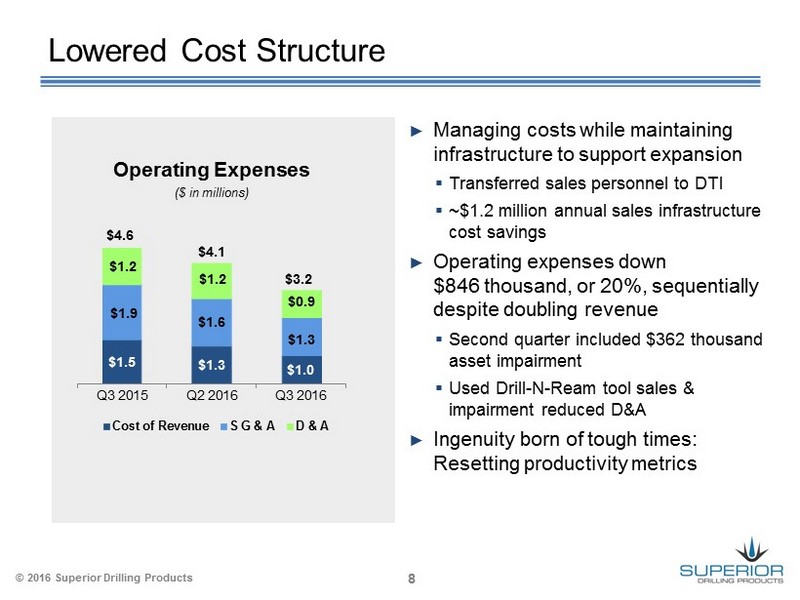
© 2016 Superior Drilling Products 8 $1.5 $1.3 $1.0 $1.9 $1.6 $1.3 $1.2 $1.2 $0.9 Q3 2015 Q2 2016 Q3 2016 Cost of Revenue S G & A D & A $ 4.6 $ 3.2 $ 4.1 ($ in millions) Operating Expenses ► Managing costs while maintaining infrastructure to support expansion ▪ Transferred sales personnel to DTI ▪ ~$1.2 million annual sales infrastructure cost savings ► Operating expenses down $846 thousand, or 20%, sequentially despite doubling revenue ▪ Second quarter included $362 thousand asset impairment ▪ Used Drill - N - Ream tool sales & impairment reduced D&A ► Ingenuity born of tough times: Resetting productivity metrics Lowered Cost Structure

© 2016 Superior Drilling Products 9 Created Better Margin Business Model $0.1 ($1.2) $0.2 Q3 2015 Q2 2016 Q3 2016 Adjusted EBITDA* * Adjusted EBITDA and is a non - GAAP financial measures . Please see supplemental slides for a reconciliation between GAAP net income and non - GAAP adjusted EBITDA and other important disclaimers regarding Superior Drilling Products’ use of adjusted EBITDA ($ in millions) Net Loss ($1.9) ($3.1) ($1.2) Q3 2015 Q2 2016 Q3 2016 ► Measurably reduced capital requirements and overhead with distributor model ► Driving operational efficiencies ► Doubled Adj. EBITDA on lower revenue ► Royalty revenue 100% margin ► Reduced cash burn to $500 thousand per quarter
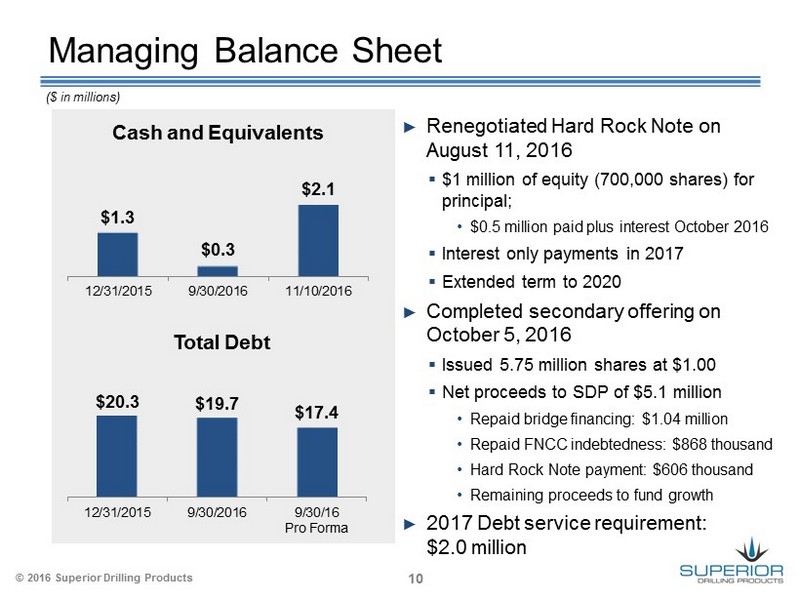
© 2016 Superior Drilling Products 10 Managing Balance Sheet Cash and Equivalents Total Debt $20.3 $19.7 $17.4 12/31/2015 9/30/2016 9/30/16 Pro Forma ($ in millions) $1.3 $0.3 $2.1 12/31/2015 9/30/2016 11/10/2016 ► Renegotiated Hard Rock Note on August 11, 2016 ▪ $1 million of equity (700,000 shares) for principal; • $0.5 million paid plus interest October 2016 ▪ Interest only payments in 2017 ▪ Extended term to 2020 ► Completed secondary offering on October 5, 2016 ▪ Issued 5.75 million shares at $1.00 ▪ Net proceeds to SDP of $5.1 million • Repaid bridge financing: $1.04 million • Repaid FNCC indebtedness: $868 thousand • Hard Rock Note payment: $606 thousand • Remaining proceeds to fund growth ► 2017 Debt service requirement: $2.0 million

© 2016 Superior Drilling Products Overview and Outlook Troy Meier Chairman and Chief Executive Officer
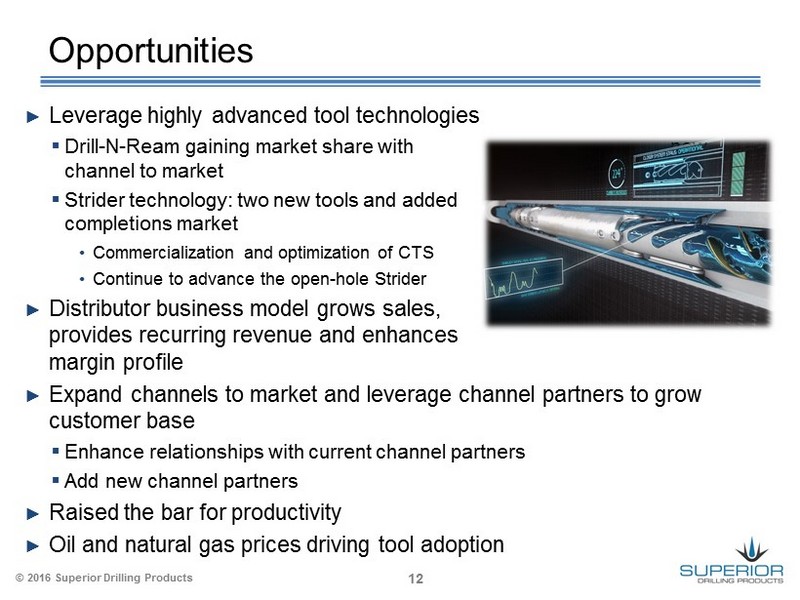
© 2016 Superior Drilling Products 12 Opportunities ► Leverage highly advanced tool technologies ▪ Drill - N - Ream gaining market share with new channel to market ▪ Strider technology: two new tools and added completions market • Commercialization and optimization of CTS • Continue to advance the open - hole Strider ► Distributor business model grows sales, provides recurring revenue and enhances margin profile ► Expand channels to market and leverage channel partners to grow customer base ▪ Enhance relationships with current channel partners ▪ Add new channel partners ► Raised the bar for productivity ► Oil and natural gas prices driving tool adoption

© 2016 Superior Drilling Products Supplemental Information
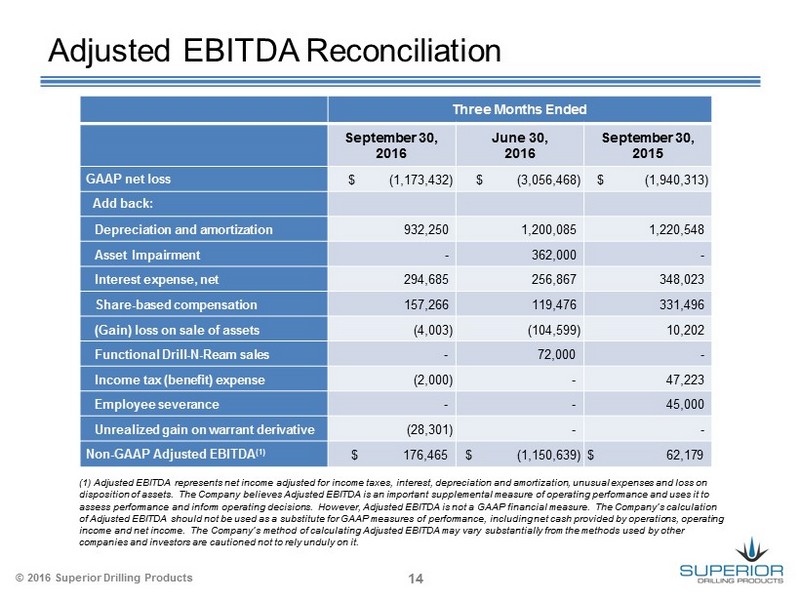
© 2016 Superior Drilling Products 14 Adjusted EBITDA Reconciliation (1) Adjusted EBITDA represents net income adjusted for income taxes, interest, depreciation and amortization, unusual expense s a nd loss on disposition of assets. The Company believes Adjusted EBITDA is an important supplemental measure of operating performance an d u ses it to assess performance and inform operating decisions. However, Adjusted EBITDA is not a GAAP financial measure. The Company’s cal culation of Adjusted EBITDA should not be used as a substitute for GAAP measures of performance, including net cash provided by operat ion s, operating income and net income. The Company’s method of calculating Adjusted EBITDA may vary substantially from the methods used by o the r companies and investors are cautioned not to rely unduly on it. Three Months Ended September 30, 2016 June 30, 2016 September 30, 2015 GAAP net loss $ (1,173,432) $ (3,056,468) $ (1,940,313) Add back: Depreciation and amortization 932,250 1,200,085 1,220,548 Asset Impairment - 362,000 - Interest expense, net 294,685 256,867 348,023 Share - based compensation 157,266 119,476 331,496 (Gain) loss on sale of assets (4,003) (104,599) 10,202 Functional Drill - N - Ream sales - 72,000 - Income tax (benefit) expense (2,000) - 47,223 Employee severance - - 45,000 Unrealized gain on warrant derivative (28,301) - - Non - GAAP Adjusted EBITDA (1) $ 176,465 $ (1,150,639) $ 62,179