Attached files
| file | filename |
|---|---|
| 8-K - FORM 8-K - SmartStop Self Storage REIT, Inc. | d293975d8k.htm |
Exhibit 99.1
Investor Presentation STABILIZED INCOME PRODUCING SELF STORAGE PROPERTIES Third Quarter Update Presented by: H. Michael Schwartz Chairman & CEO Investor Presentation Strategic Storage Trust II, Inc.
|
|
Disclaimer and Risk Factors 2 2 This investor presentation may contain certain forward-looking statements within the meaning of Section 27A of the Securities Act of 1933, as amended, and Section 21E of the Securities Exchange Act of 1934, as amended. Such forward-looking statements can generally be identified by our use of forward-looking terminology such as may, will, expect, intend, anticipate, estimate, believe, continue, or other similar words. Because such statements include risks, uncertainties and contingencies, actual results may differ materially from the expectations, intentions, beliefs, plans or predictions of the future expressed or implied by such forwardlooking statements. These risks, uncertainties and contingencies include, but are not limited to: uncertainties relating to changes in general economic and real estate conditions; uncertainties relating to the implementation of our real estate investment strategy; uncertainties relating to financing availability and capital proceeds; uncertainties relating to the closing of property acquisitions; uncertainties related to the timing and availability of distributions; and other risk factors as outlined in the Company s public filings with the Securities and Exchange Commission. This is neither an offer nor a solicitation to purchase securities. See our Form 10-K and recent Form 10-Q for specific risks associated with an investment in Strategic Storage Trust II, Inc. As of September 30, 2016, our accumulated deficit was approximately $39.3 million, and we anticipate that our operations will not be profitable in 2016. We have paid distributions from sources other than our cash flows from operations, including from the net proceeds of this offering. We are not prohibited from undertaking such activities by our charter, bylaws or investment policies, and we may use an unlimited amount from any source to pay our distributions. From our inception through September 30, 2016, the payment of distributions has been paid from offering proceeds. Until we generate cash flows sufficient to pay distributions to you, we may pay distributions from the net proceeds of this offering or from borrowings in anticipation of future cash flows. No public market currently exists for shares of our common stock and we may not list our shares on a national securities exchange before three to five years after completion of this offering, if at all; therefore, it may be difficult to sell your shares. If you sell your shares, it will likely be at a substantial discount. Our charter does not require us to pursue a liquidity transaction at any time. This is an initial public offering; we have little prior operating history, and the prior performance of real estate programs sponsored by affiliates of our sponsor may not be indicative of our future results. This is a best efforts offering. If we are unable to raise substantial funds in this offering, we may not be able to invest in a diverse portfolio of real estate and real estate-related investments, and the value of your investment may fluctuate more widely with the performance of specific investments. We are a blind pool because we have not identified any properties to acquire with the net proceeds from this offering. As a result, you will not be able to evaluate the economic merits of our future investments prior to their purchase. We may be unable to invest the net proceeds from this offering on acceptable terms to investors, or at all. There are substantial conflicts of interest among us and our sponsor, advisor, property manager and dealer manager. Our advisor will face conflicts of interest relating to the purchase of properties, including conflicts with Strategic Storage Growth Trust, Inc., and such conflicts may not be resolved in our favor, which could adversely affect our investment opportunities. We will pay substantial fees and expenses to our advisor, its affiliates and participating broker-dealers for the services they provide to us, which will reduce cash available for investment and distribution. We may be required to pay our advisor a significant distribution if our advisory agreement is involuntarily terminated. We may incur substantial debt, which could hinder our ability to pay distributions to our stockholders or could decrease the value of your investment. We may fail to qualify as a REIT, which could adversely affect our operations and our ability to make distributions. Our board of directors may change any of our investment objectives without your consent. Investor Presentation Strategic Storage Trust II, Inc.
|
|
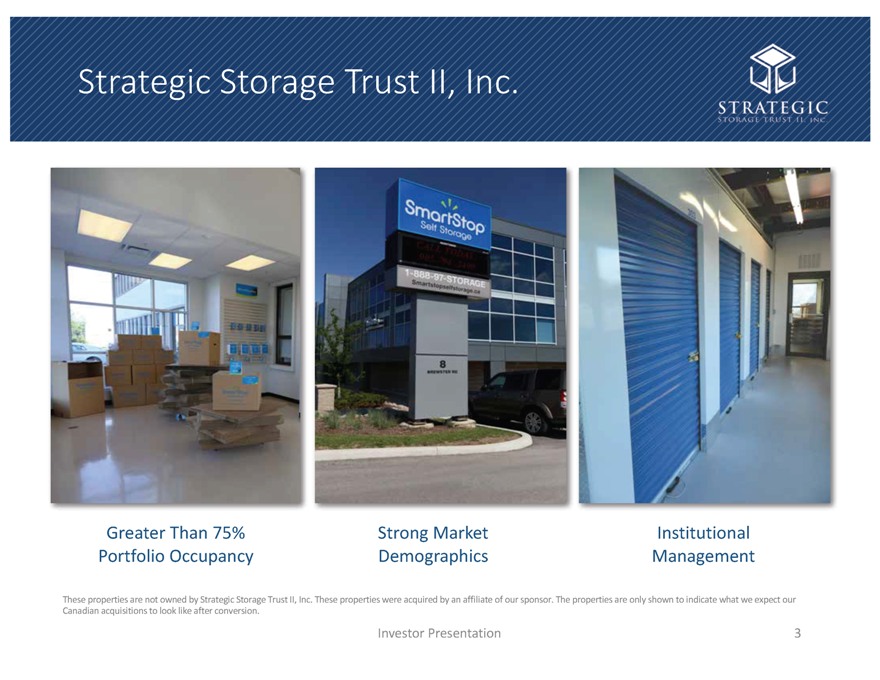
Strategic Storage Trust II, Inc. 3 3 These properties are not owned by Strategic Storage Trust II, Inc. These properties were acquired by an affiliate of our sponsor. The properties are only shown to indicate what we expect our Canadian acquisitions to look like after conversion. Greater Than 75% Portfolio Occupancy Institutional Management Strong Market Demographics Investor Presentation Strategic Storage Trust II, Inc.
|
|
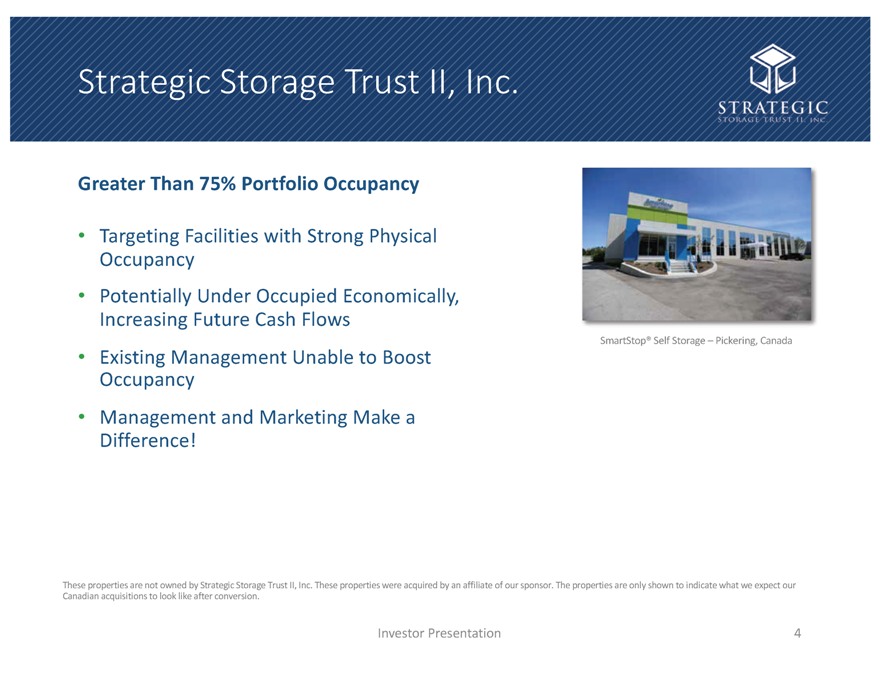
Strategic Storage Trust II, Inc. Investor Presentation 4 These properties are not owned by Strategic Storage Trust II, Inc. These properties were acquired by an affiliate of our sponsor. The properties are only shown to indicate what we expect our Canadian acquisitions to look like after conversion. Greater Than 75% Portfolio Occupancy Targeting Facilities with Strong Physical Occupancy Potentially Under Occupied Economically, Increasing Future Cash Flows Existing Management Unable to Boost Occupancy Management and Marketing Make a Difference! SmartStop Self Storage Pickering, Canada Strategic Storage Trust II, Inc.
|
|
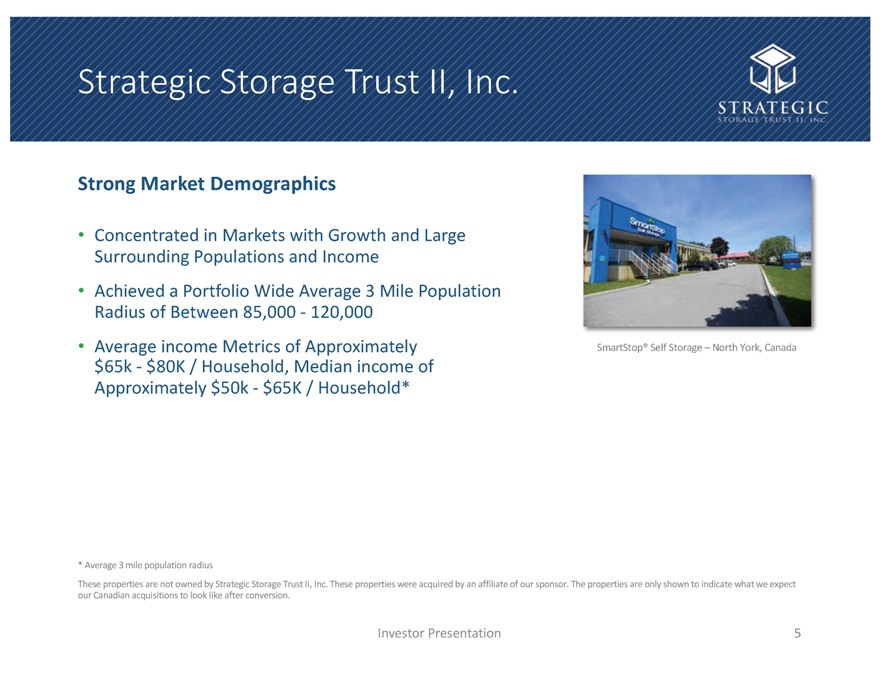
Strategic Storage Trust II, Inc. Investor Presentation 5 These properties are not owned by Strategic Storage Trust II, Inc. These properties were acquired by an affiliate of our sponsor. The properties are only shown to indicate what we expect our Canadian acquisitions to look like after conversion. Strong Market Demographics Concentrated in Markets with Growth and Large Surrounding Populations and Income Achieved a Portfolio Wide Average 3 Mile Population Radius of Between 85,000—120,000 Average income Metrics of Approximately $65k—$80K / Household, Median income of Approximately $50k—$65K / Household* SmartStop Self Storage North York, Canada * Average 3 mile population radius Strategic Storage Trust II, Inc.
|
|
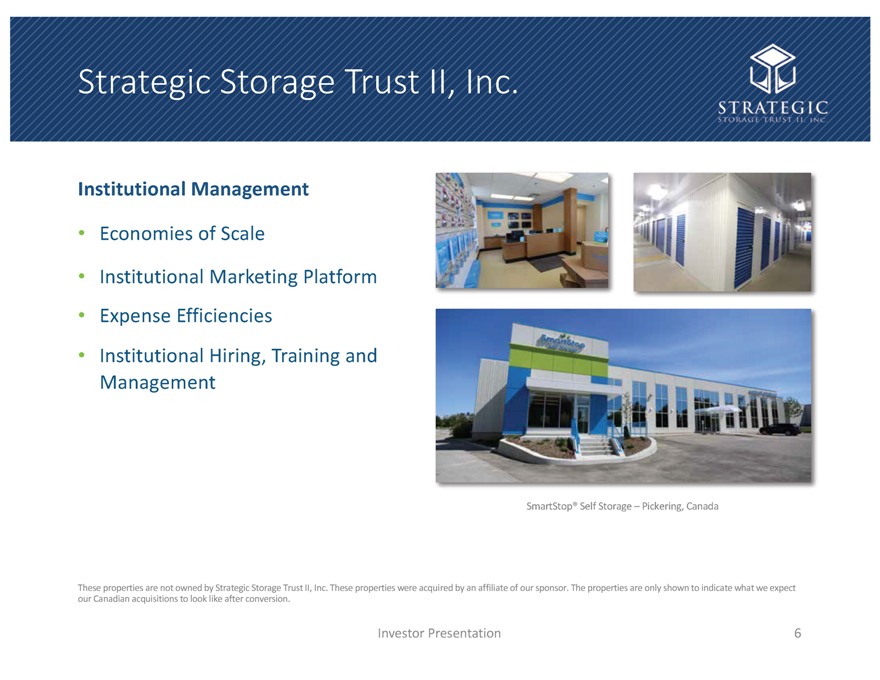
Strategic Storage Trust II, Inc. Investor Presentation 6 These properties are not owned by Strategic Storage Trust II, Inc. These properties were acquired by an affiliate of our sponsor. The properties are only shown to indicate what we expect our Canadian acquisitions to look like after conversion. Institutional Management Economies of Scale Institutional Marketing Platform Expense Efficiencies Institutional Hiring, Training and Management SmartStop Self Storage Pickering, Canada Strategic Storage Trust II, Inc.
|
|
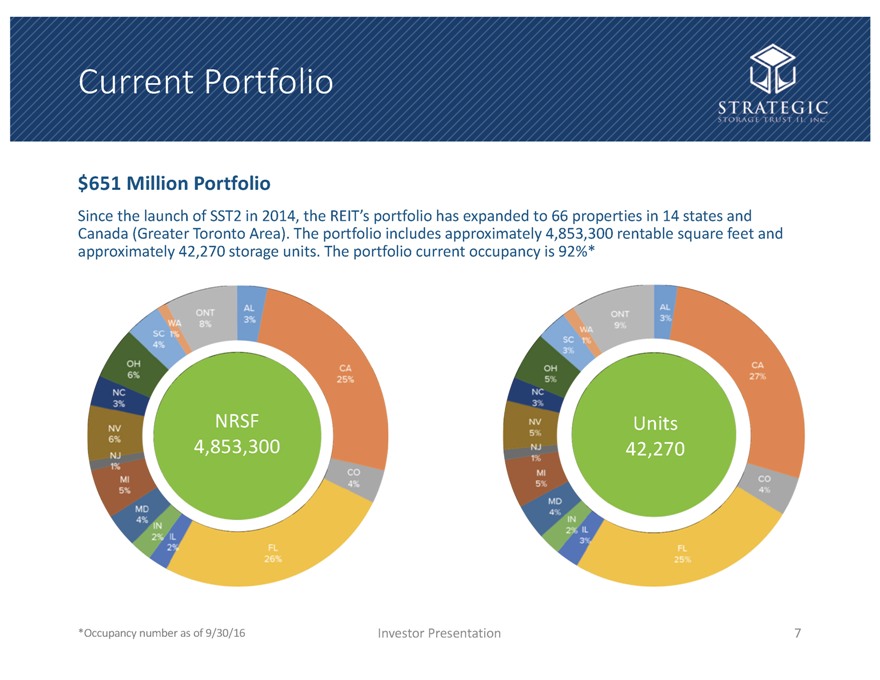
Current Portfolio Investor Presentation 7 $651 Million Portfolio Since the launch of SST2 in 2014, the REIT s portfolio has expanded to 66 properties in 14 states and Canada (Greater Toronto Area). The portfolio includes approximately 4,853,300 rentable square feet and approximately 42,270 storage units. The portfolio current occupancy is 92%* NRSF 4,853,300 Units 42,270 *Occupancy number as of 9/30/16 Strategic Storage Trust II, Inc.
|
|
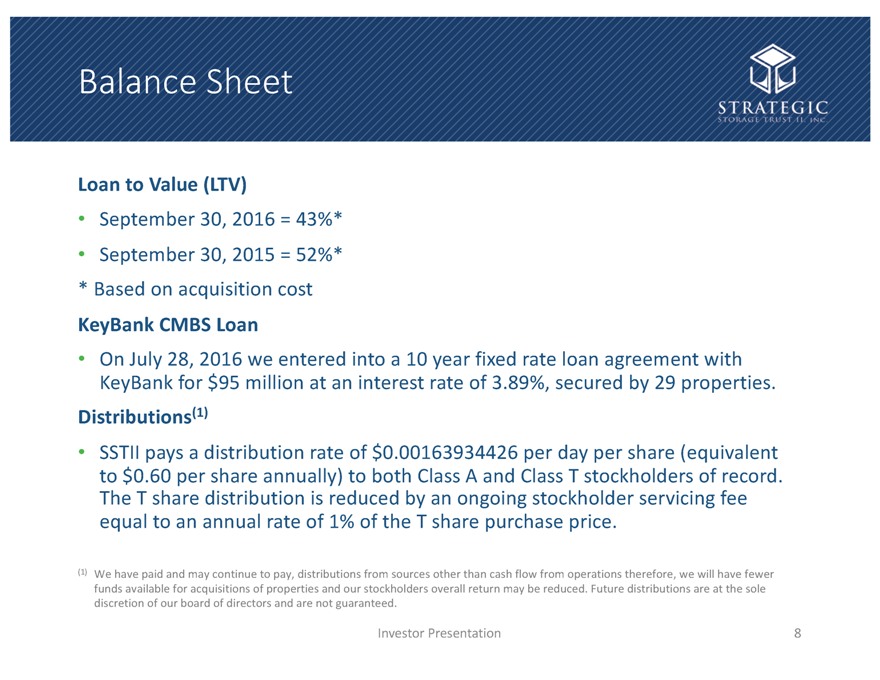
Balance Sheet Loan to Value (LTV) September 30, 2016 = 43%* September 30, 2015 = 52%* * Based on acquisition cost KeyBank CMBS Loan On July 28, 2016 we entered into a 10 year fixed rate loan agreement with KeyBank for $95 million at an interest rate of 3.89%, secured by 29 properties. Distributions(1) SSTII pays a distribution rate of $0.00163934426 per day per share (equivalent to $0.60 per share annually) to both Class A and Class T stockholders of record. The T share distribution is reduced by an ongoing stockholder servicing fee equal to an annual rate of 1% of the T share purchase price. Investor Presentation 8 (1) We have paid and may continue to pay, distributions from sources other than cash flow from operations therefore, we will have fewer funds available for acquisitions of properties and our stockholders overall return may be reduced. Future distributions are at the sole discretion of our board of directors and are not guaranteed. Strategic Storage Trust II, Inc.
|
|
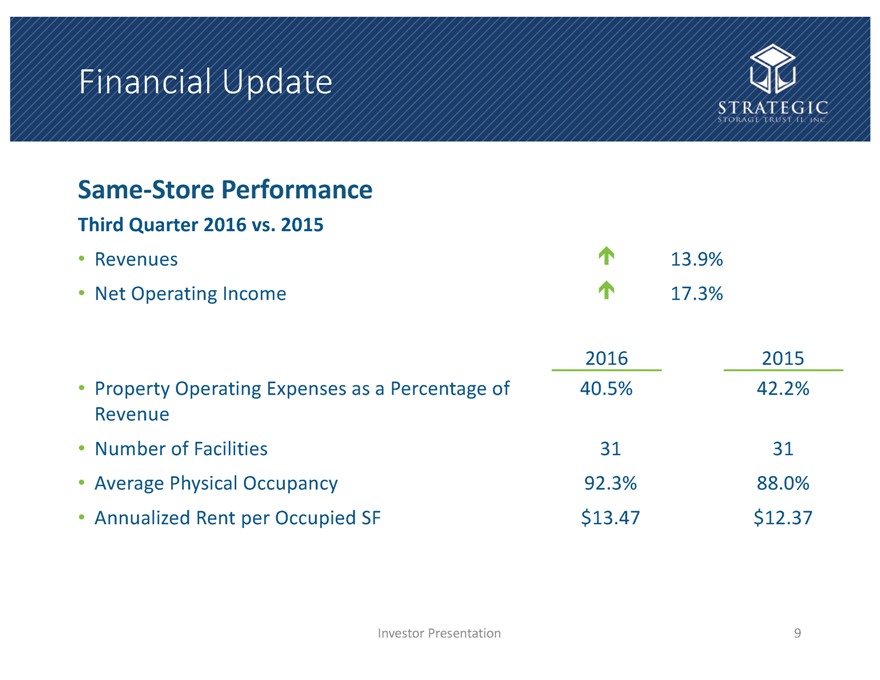
Financial Update Investor Presentation 9 Third Quarter 2016 vs. 2015 Revenues 13.9% Net Operating Income 17.3% 2016 2015 Property Operating Expenses as a Percentage of Revenue 40.5% 42.2% Number of Facilities 31 31 Average Physical Occupancy 92.3% 88.0% Annualized Rent per Occupied SF $13.47 $12.37 Same-Store Performance Strategic Storage Trust II, Inc.
|
|
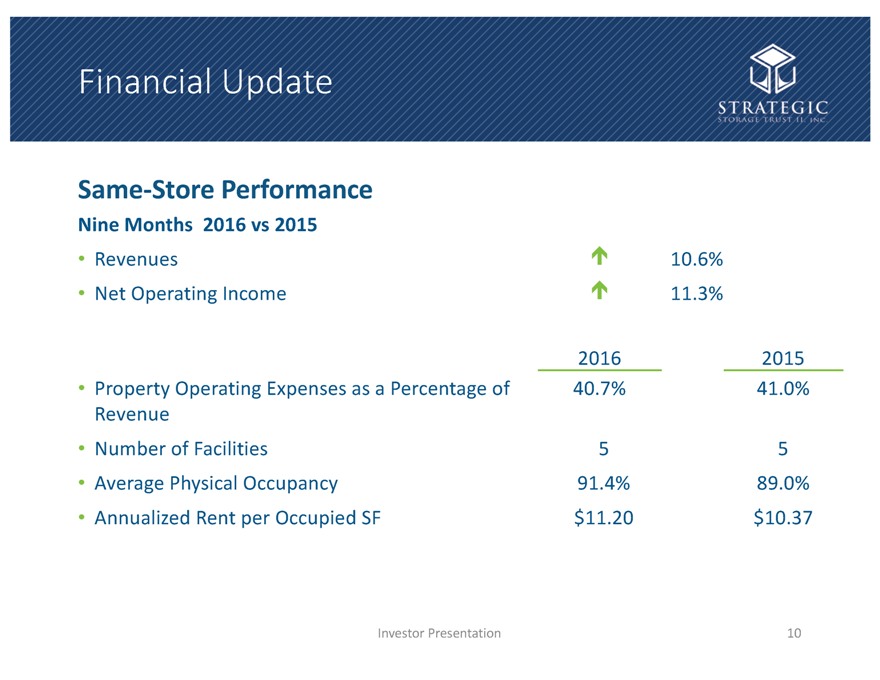
Financial Update Investor Presentation 10 Nine Months 2016 vs 2015 Revenues 10.6% Net Operating Income 11.3% 2016 2015 Property Operating Expenses as a Percentage of Revenue 40.7% 41.0% Number of Facilities 5 5 Average Physical Occupancy 91.4% 89.0% Annualized Rent per Occupied SF $11.20 $10.37 Same-Store Performance Strategic Storage Trust II, Inc.
|
|
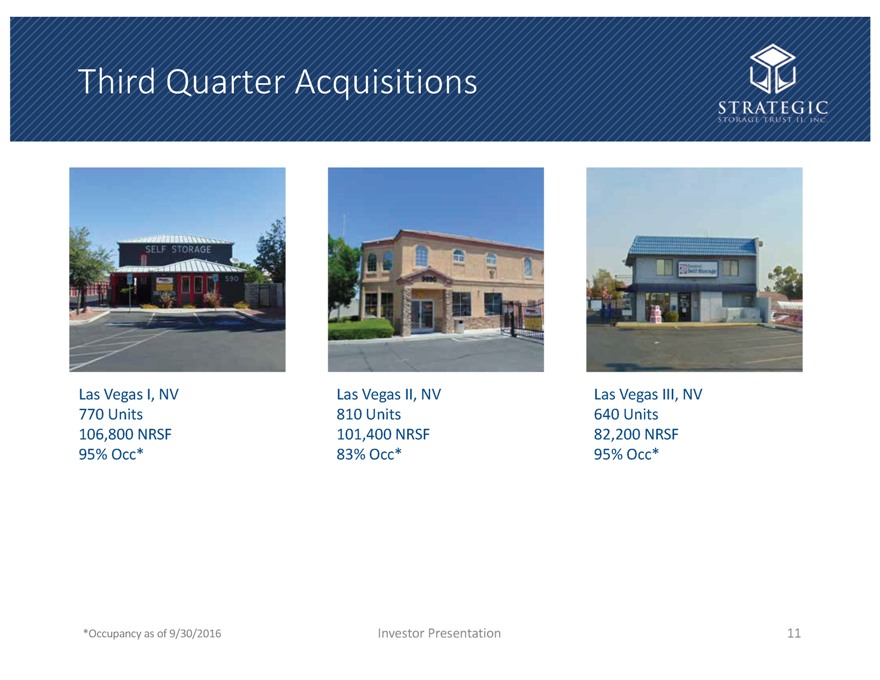
Third Quarter Acquisitions Investor Presentation 11 Las Vegas I, NV 770 Units 106,800 NRSF 95% Occ* Las Vegas II, NV 810 Units 101,400 NRSF 83% Occ* Las Vegas III, NV 640 Units 82,200 NRSF 95% Occ* *Occupancy as of 9/30/2016 Strategic Storage Trust II, Inc.
|
|
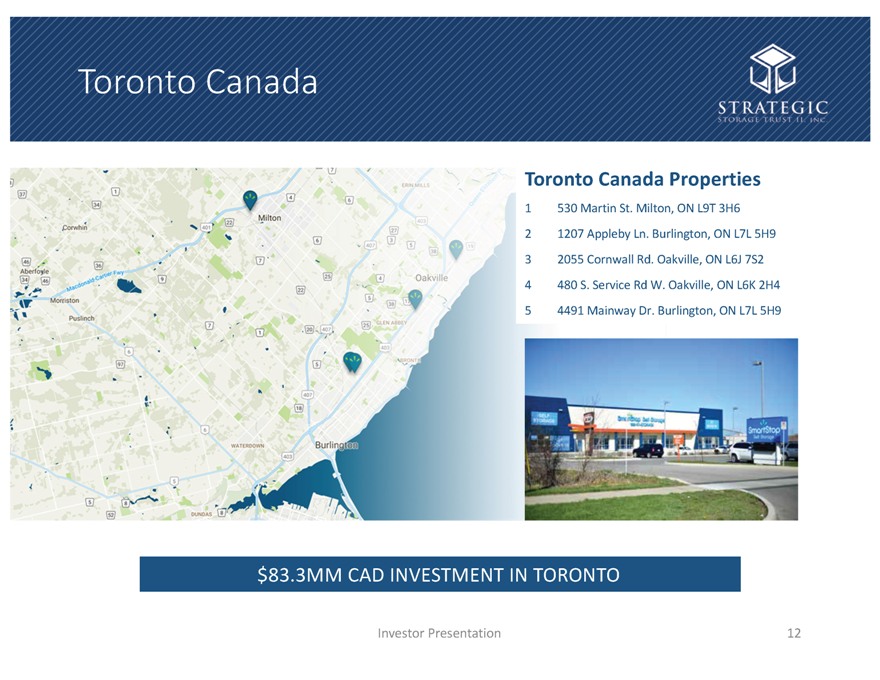
Toronto Canada Investor Presentation 12 1 530 Martin St. Milton, ON L9T 3H6 2 1207 Appleby Ln. Burlington, ON L7L 5H9 3 2055 Cornwall Rd. Oakville, ON L6J 7S2 4 480 S. Service Rd W. Oakville, ON L6K 2H4 5 4491 Mainway Dr. Burlington, ON L7L 5H9 Toronto Canada Properties $83.3MM CAD INVESTMENT IN TORONTO Strategic Storage Trust II, Inc.
|
|
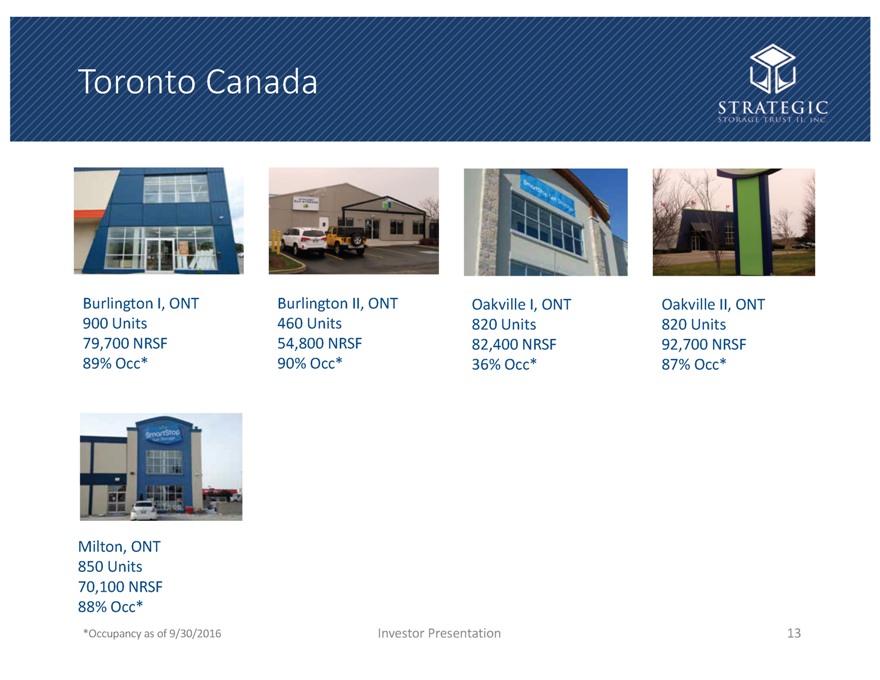
Toronto Canada *Occupancy as of 9/30/2016 Investor Presentation 13 Milton, ONT 850 Units 70,100 NRSF 88% Occ* Oakville II, ONT 820 Units 92,700 NRSF 87% Occ* Oakville I, ONT 820 Units 82,400 NRSF 36% Occ* Burlington I, ONT 900 Units 79,700 NRSF 89% Occ* Burlington II, ONT 460 Units 54,800 NRSF 90% Occ* Strategic Storage Trust II, Inc.
|
|
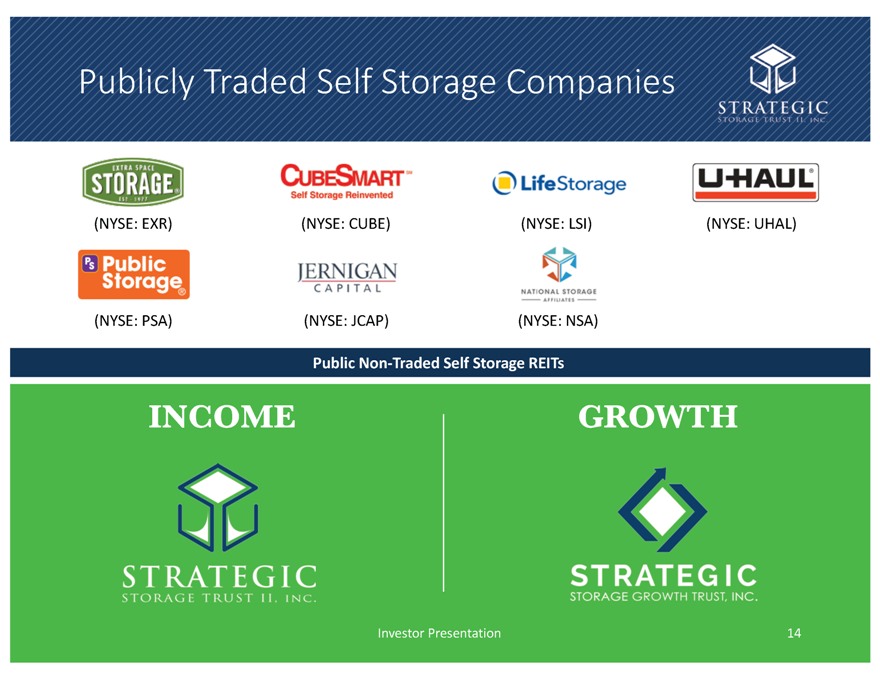
Publicly Traded Self Storage Companies 14 Public Non-Traded Self Storage REITs INCOME GROWTH (NYSE: CUBE) (NYSE: LSI) (NYSE: UHAL) (NYSE: PSA) (NYSE: JCAP) (NYSE: NSA) (NYSE: EXR) Investor Presentation Strategic Storage Trust II, Inc.
|
|
15 QUESTIONS Strategic Storage Trust II, Inc.
|
|
Additional Information Regarding NOI Net Operating Income ( NOI ) NOI is a non-GAAP measure that we define as net income (loss), computed in accordance with GAAP, generated from properties before corporate general and administrative expenses, asset management fees, interest expense, depreciation, amortization, acquisition expenses and other non-property related expenses. We believe that NOI is useful for investors as it provides a measure of the operating performance of our operating assets because NOI excludes certain items that are not associated with the operation of the properties. Additionally, we believe that NOI is a widely accepted measure of comparative operating performance in the real estate community. However, our use of the term NOI may not be comparable to that of other real estate companies as they may have different methodologies for computing this amount. Investor Presentation 16