Attached files
| file | filename |
|---|---|
| 8-K - FORM 8-K - Strategic Storage Growth Trust, Inc. | d293739d8k.htm |
Exhibit 99.1
Third Quarter Update Investor Presentation Presented by: H. Michael Schwartz Chairman & CEO LEASE-UP EXPANSION DEVELOPMENT/REDEVELOPMENT SELF STORAGE PROPERTIES Strategic Storage Growth Trust, Inc.
|
|
Disclaimer and Risk Factors Investor Presentation 2 This investor presentation may contain certain forward-looking statements within the meaning of Section 27A of the Securities Act of 1933, as amended, and Section 21E of the Securities Exchange Act of 1934, as amended. Such forward-looking statements can generally be identified by our use of forward-looking terminology such as may, will, expect, intend, anticipate, estimate, believe, continue, or other similar words. Because such statements include risks, uncertainties and contingencies, actual results may differ materially from the expectations, intentions, beliefs, plans or predictions of the future expressed or implied by such forward-looking statements. These risks, uncertainties and contingencies include, but are not limited to: uncertainties relating to changes in general economic and real estate conditions; uncertainties relating to the implementation of our real estate investment strategy; uncertainties relating to financing availability and capital proceeds; uncertainties relating to the closing of property acquisitions; uncertainties related to the timing and availability of distributions; and other risk factors as outlined in the Company s public filings with the Securities and Exchange Commission. This is neither an offer nor a solicitation to purchase securities. See our Form 10-K and recent Form 10-Q for specific risks associated with an investment in Strategic Storage Growth Trust, Inc. As of September 30, 2016, our accumulated deficit was approximately $12.1 million, and we anticipate that our operations will not be profitable in 2016. We have paid distributions from sources other than our cash flows from operations, including from the net proceeds of this offering. We are not prohibited from undertaking such activities by our charter, bylaws or investment policies, and we may use an unlimited amount from any source to pay our distributions. From commencement of paying distributions in November 2015 through September 30, 2016, the payment of distributions has been paid from offering proceeds. Until we generate cash flows sufficient to pay distributions to you, we may pay distributions from the net proceeds of this offering or from borrowings in anticipation of future cash flows. No public market currently exists for shares of our common stock and we may not list our shares on a national securities exchange before three to five years after completion of this offering, if at all; therefore, it may be difficult to sell your shares. If you sell your shares, it will likely be at a substantial discount. Our charter does not require us to pursue a liquidity transaction at any time. This is an initial public offering; we have little prior operating history, and the prior performance of real estate programs sponsored by affiliates of our sponsor may not be indicative of our future results. This is a best efforts offering. If we are unable to raise substantial funds in this offering, we may not be able to invest in a diverse portfolio of real estate and real estate-related investments, and the value of your investment may fluctuate more widely with the performance of specific investments. We are a blind pool because we have not identified any properties to acquire with the net proceeds from this offering. As a result, you will not be able to evaluate the economic merits of our future investments prior to their purchase. We may be unable to invest the net proceeds from this offering on acceptable terms to investors, or at all. There are substantial conflicts of interest among us and our sponsor, advisor, property manager, and dealer manager. Our advisor will face conflicts of interest relating to the purchase of properties, including conflicts with Strategic Storage Trust II, Inc., and such conflicts may not be resolved in our favor, which could adversely affect our investment opportunities. We will pay substantial fees and expenses to our advisor, its affiliates, and participating broker-dealers for the services they provide to us, which will reduce cash available for investment and distribution. We may be required to pay our advisor a significant distribution if our advisory agreement is involuntarily terminated. We may incur substantial debt, which could hinder our ability to pay distributions to our stockholders or could decrease the value of your investment. We may fail to qualify as a REIT, which could adversely affect our operations and our ability to make distributions. Our board of directors may change any of our investment objectives without your consent. Strategic Storage Growth Trust, Inc.
|
|
Investment Strategy Investment Strategy Lease-up 75% or Less Occupancy, Redevelop/Expansion, Develop Investment Objectives(1) Future Income Needs Greater Capital Appreciation Potential Modest Leverage (between 55% to 65% loan to cost)(2) Geographic Area Moderate to High Density (top 100 MSAs) 3-5 year Anticipated Hold After Completion of Offering(3) Investor Presentation 3 (1) There is no assurance that these objectives will be met. (2) Our charter limits borrowing to 75% of the cost of our assets. At times our leverage may be greater than 65%. See page 74-75 of our prospectus for details of our borrowing policy. (3) The timing of our exit strategy is subject to market conditions and the discretion of our Board of Directors. There is no assurance that we will achieve one or more of the liquidity events we intend to seek within this time frame or at all. Strategic Storage Growth Trust, Inc.
|
|
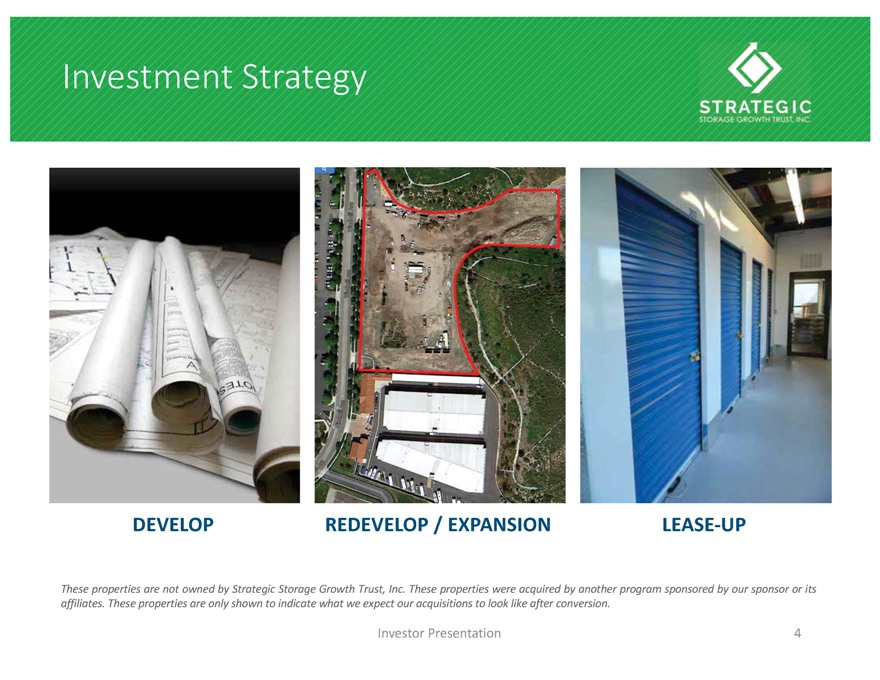
Investment Strategy Investor Presentation 4 DEVELOP REDEVELOP / EXPANSION LEASE-UP These properties are not owned by Strategic Storage Growth Trust, Inc. These properties were acquired by another program sponsored by our sponsor or its affiliates. These properties are only shown to indicate what we expect our acquisitions to look like after conversion. Strategic Storage Growth Trust, Inc.
|
|
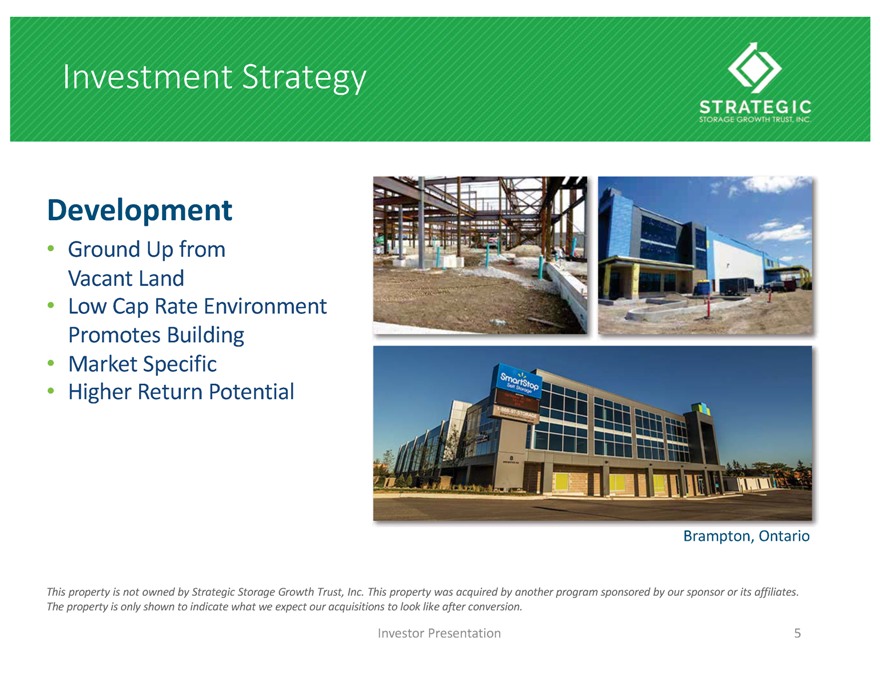
Investment Strategy Investor Presentation 5 This property is not owned by Strategic Storage Growth Trust, Inc. This property was acquired by another program sponsored by our sponsor or its affiliates. The property is only shown to indicate what we expect our acquisitions to look like after conversion. Development Ground Up from Vacant Land Low Cap Rate Environment Promotes Building Market Specific Higher Return Potential Brampton, Ontario Strategic Storage Growth Trust, Inc.
|
|
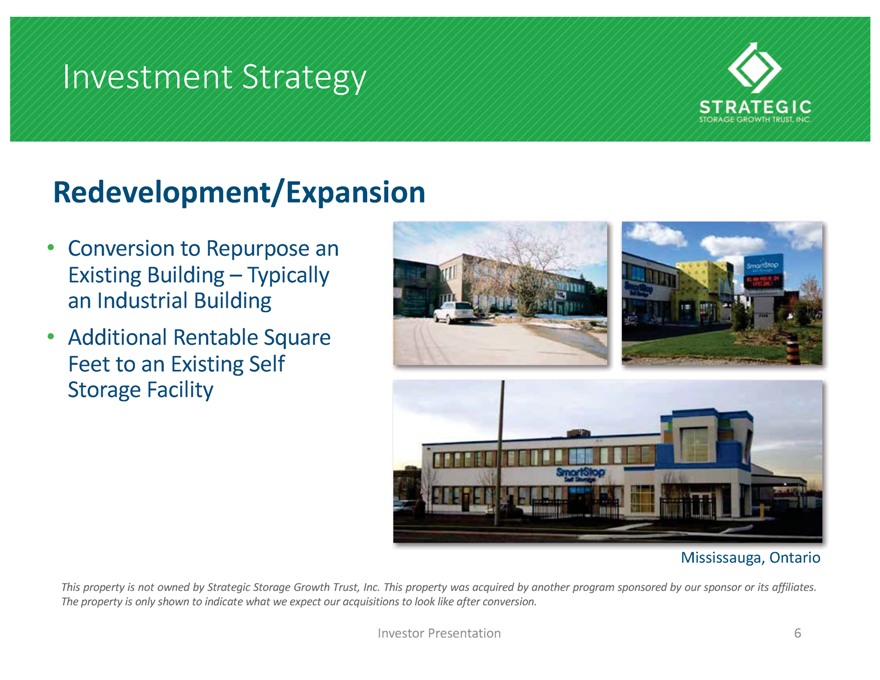
Investment Strategy Conversion to Repurpose an Existing Building Typically an Industrial Building Additional Rentable Square Feet to an Existing Self Storage Facility Investor Presentation 6 This property is not owned by Strategic Storage Growth Trust, Inc. This property was acquired by another program sponsored by our sponsor or its affiliates. The property is only shown to indicate what we expect our acquisitions to look like after conversion. Mississauga, Ontario Redevelopment/Expansion Strategic Storage Growth Trust, Inc.
|
|
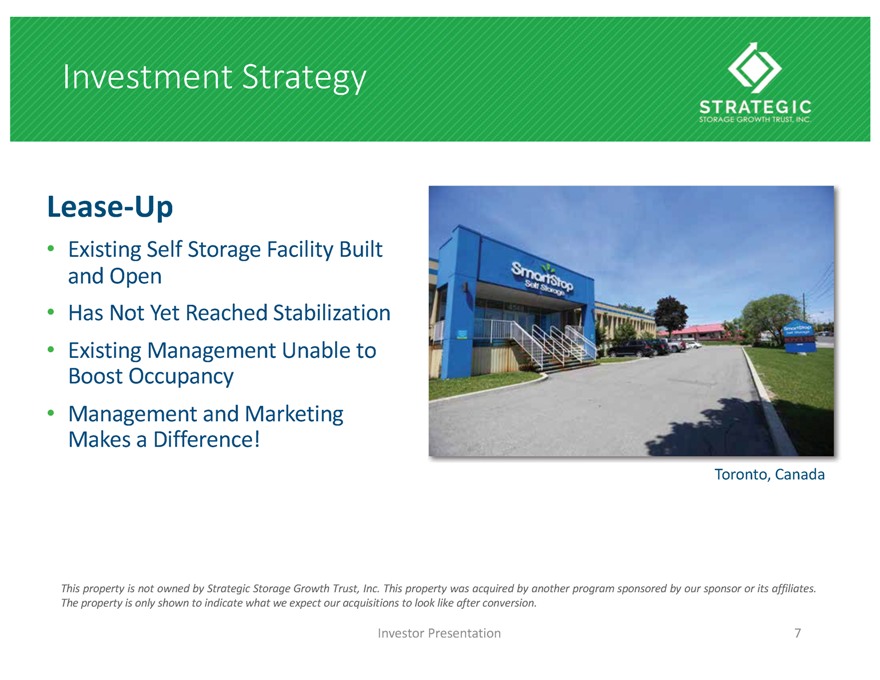
Investment Strategy Lease-Up Existing Self Storage Facility Built and Open Has Not Yet Reached Stabilization Existing Management Unable to Boost Occupancy Management and Marketing Makes a Difference! Investor Presentation 7 This property is not owned by Strategic Storage Growth Trust, Inc. This property was acquired by another program sponsored by our sponsor or its affiliates. The property is only shown to indicate what we expect our acquisitions to look like after conversion. Toronto, Canada Strategic Storage Growth Trust, Inc.
|
|
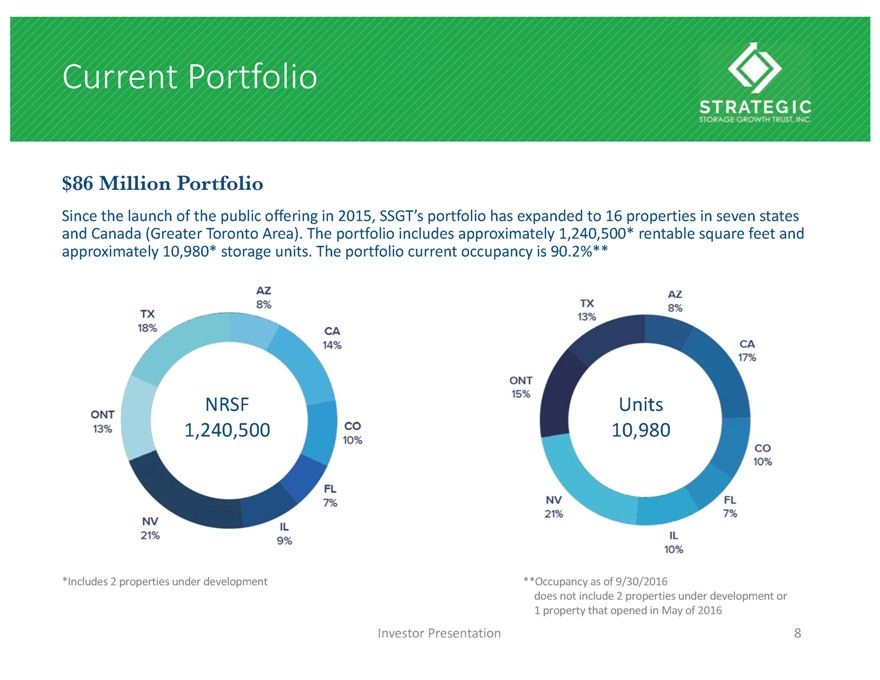
Current Portfolio Investor Presentation 8 $86 Million Portfolio Since the launch of the public offering in 2015, SSGT s portfolio has expanded to 16 properties in seven states and Canada (Greater Toronto Area). The portfolio includes approximately 1,240,500* rentable square feet and approximately 10,980* storage units. The portfolio current occupancy is 90.2%** NRSF 1,240,500 Units 10,980 *Includes 2 properties under development **Occupancy as of 9/30/2016 does not include 2 properties under development or 1 property that opened in May of 2016 Strategic Storage Growth Trust, Inc.
|
|
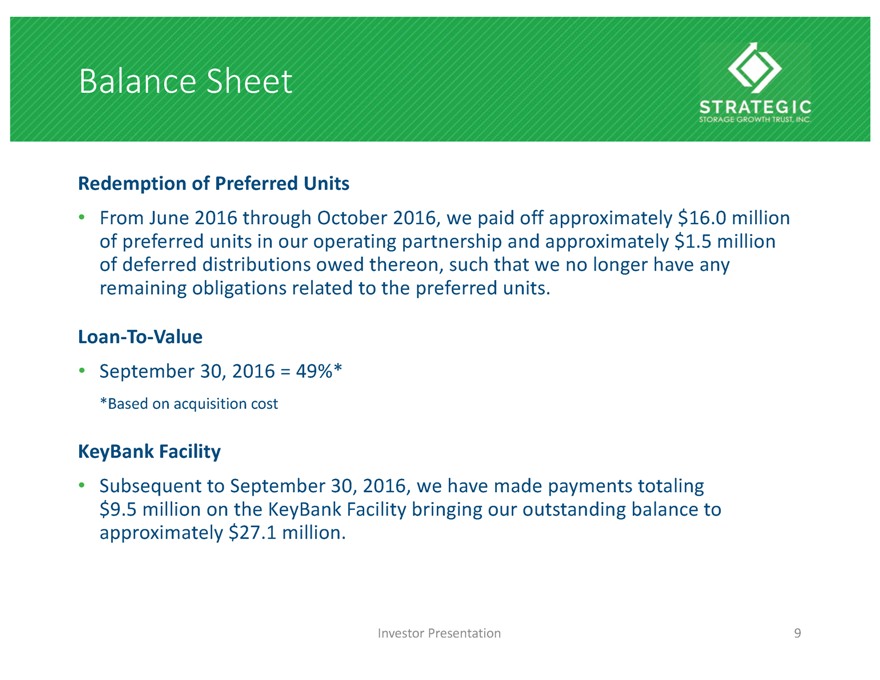
Balance Sheet Redemption of Preferred Units From June 2016 through October 2016, we paid off approximately $16.0 million of preferred units in our operating partnership and approximately $1.5 million of deferred distributions owed thereon, such that we no longer have any remaining obligations related to the preferred units. Loan-To-Value September 30, 2016 = 49%* *Based on acquisition cost KeyBank Facility Subsequent to September 30, 2016, we have made payments totaling $9.5 million on the KeyBank Facility bringing our outstanding balance to approximately $27.1 million. Investor Presentation 9 Strategic Storage Growth Trust, Inc.
|
|
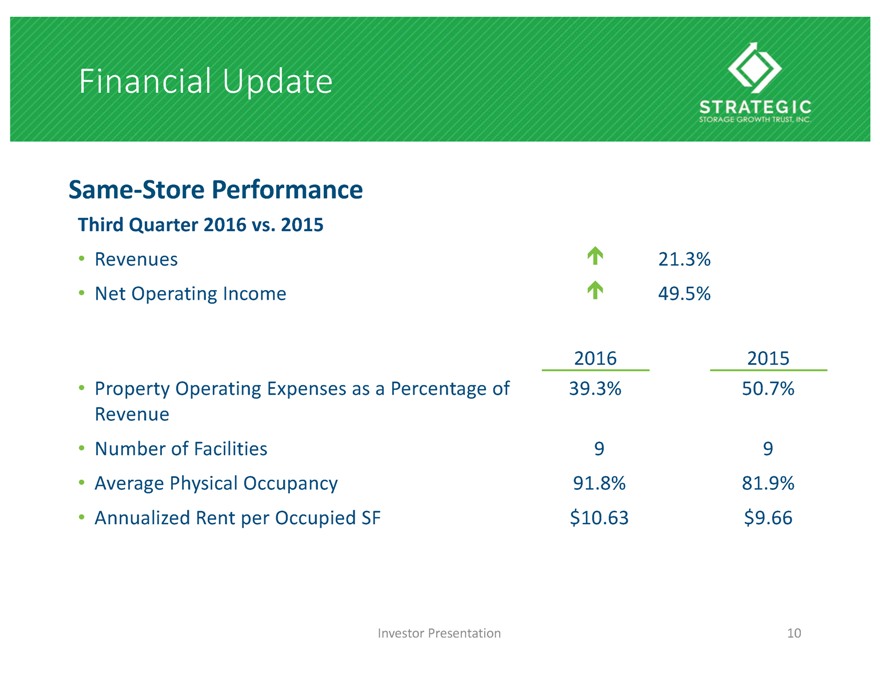
Financial Update Investor Presentation 10 Third Quarter 2016 vs. 2015 Revenues 21.3% Net Operating Income 49.5% 2016 2015 Property Operating Expenses as a Percentage of Revenue 39.3% 50.7% Number of Facilities 9 9 Average Physical Occupancy 91.8% 81.9% Annualized Rent per Occupied SF $10.63 $9.66 Same-Store Performance Strategic Storage Growth Trust, Inc.
|
|
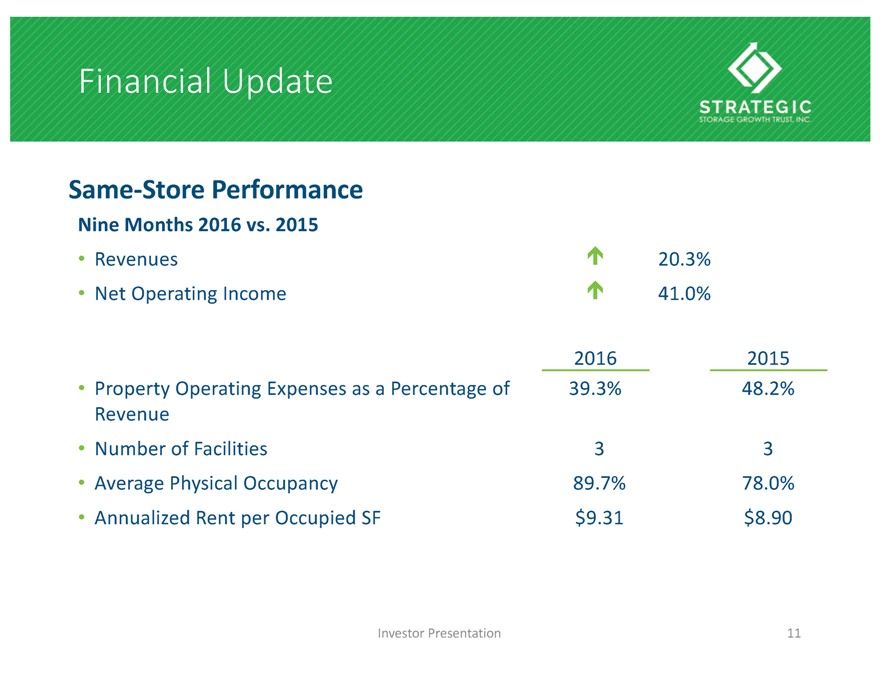
Financial Update Investor Presentation 11 Nine Months 2016 vs. 2015 Revenues 20.3% Net Operating Income 41.0% 2016 2015 Property Operating Expenses as a Percentage of Revenue 39.3% 48.2% Number of Facilities 3 3 Average Physical Occupancy 89.7% 78.0% Annualized Rent per Occupied SF $9.31 $8.90 Same-Store Performance Strategic Storage Growth Trust, Inc.
|
|
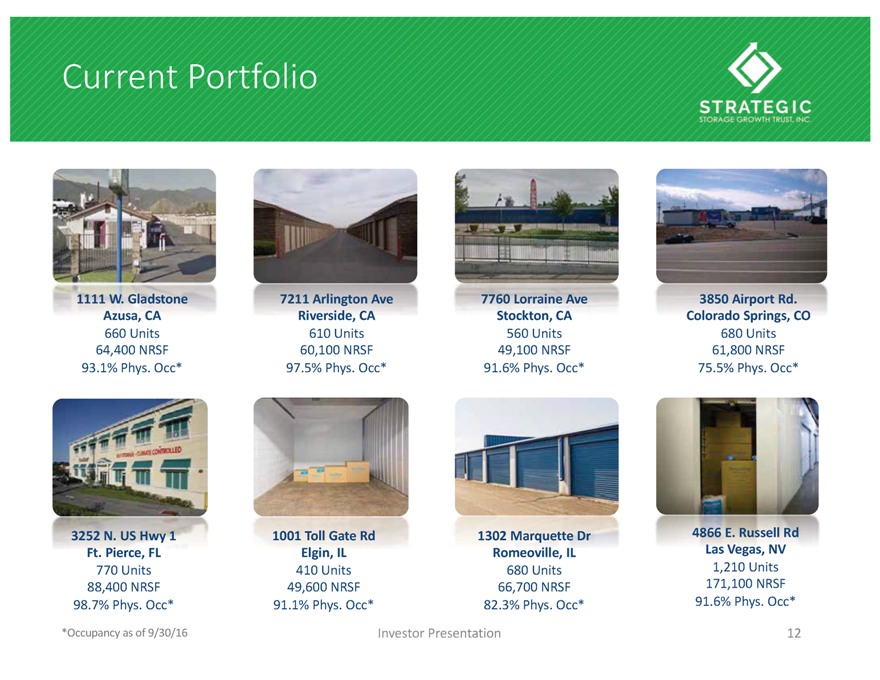
Current Portfolio *Occupancy as of 9/30/16 Investor Presentation 12 7211 Arlington Ave Riverside, CA 610 Units 60,100 NRSF 97.5% Phys. Occ* 1001 Toll Gate Rd Elgin, IL 410 Units 49,600 NRSF 91.1% Phys. Occ* 3252 N. US Hwy 1 Ft. Pierce, FL 770 Units 88,400 NRSF 98.7% Phys. Occ* 1302 Marquette Dr Romeoville, IL 680 Units 66,700 NRSF 82.3% Phys. Occ* 1111 W. Gladstone Azusa, CA 660 Units 64,400 NRSF 93.1% Phys. Occ* 7760 Lorraine Ave Stockton, CA 560 Units 49,100 NRSF 91.6% Phys. Occ* 3850 Airport Rd. Colorado Springs, CO 680 Units 61,800 NRSF 75.5% Phys. Occ* 4866 E. Russell Rd Las Vegas, NV 1,210 Units 171,100 NRSF 91.6% Phys. Occ* Strategic Storage Growth Trust, Inc.
|
|
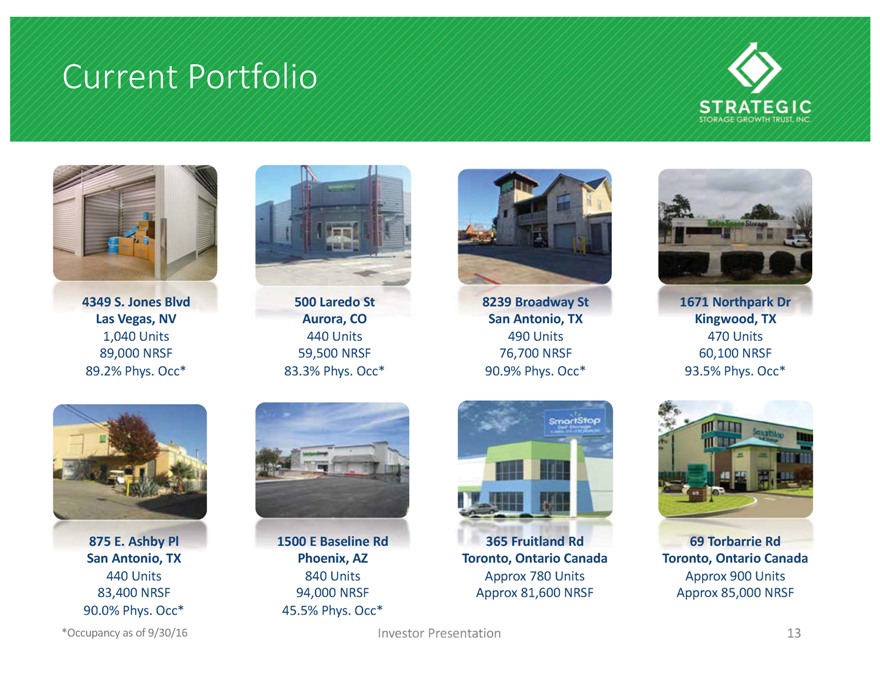
Current Portfolio *Occupancy as of 9/30/16 Investor Presentation 13 4349 S. Jones Blvd Las Vegas, NV 1,040 Units 89,000 NRSF 89.2% Phys. Occ* 365 Fruitland Rd Toronto, Ontario Canada Approx 780 Units Approx 81,600 NRSF 500 Laredo St Aurora, CO 440 Units 59,500 NRSF 83.3% Phys. Occ* 8239 Broadway St San Antonio, TX 490 Units 76,700 NRSF 90.9% Phys. Occ* 1671 Northpark Dr Kingwood, TX 470 Units 60,100 NRSF 93.5% Phys. Occ* 875 E. Ashby Pl San Antonio, TX 440 Units 83,400 NRSF 90.0% Phys. Occ* 69 Torbarrie Rd Toronto, Ontario Canada Approx 900 Units Approx 85,000 NRSF 1500 E Baseline Rd Phoenix, AZ 840 Units 94,000 NRSF 45.5% Phys. Occ* Strategic Storage Growth Trust, Inc.
|
|
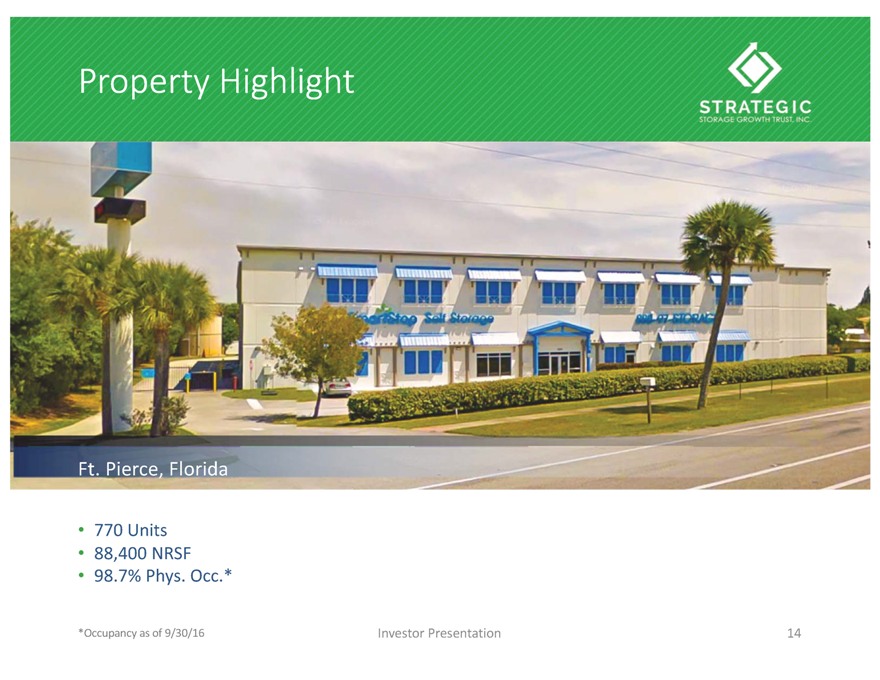
Property Highlight Investor Presentation 14 770 Units 88,400 NRSF 98.7% Phys. Occ.* Ft. Pierce, Florida *Occupancy as of 9/30/16 Strategic Storage Growth Trust, Inc.
|
|
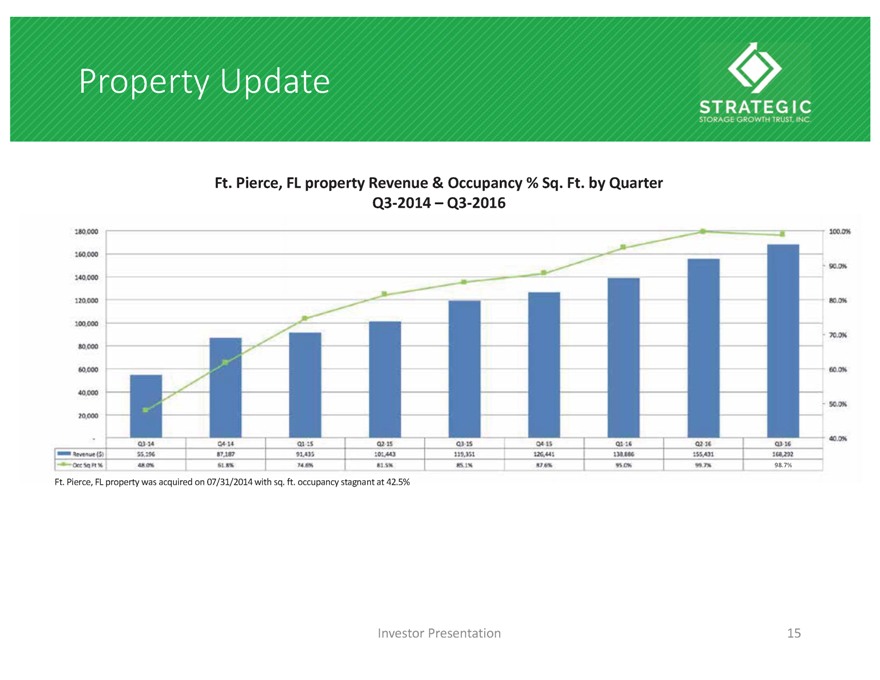
Property Update Investor Presentation 15 Ft. Pierce, FL property Revenue & Occupancy % Sq. Ft. by Quarter Q3-2014 Q3-2016 Ft. Pierce, FL property was acquired on 07/31/2014 with sq. ft. occupancy stagnant at 42.5% 98.7% Strategic Storage Growth Trust, Inc.
|
|
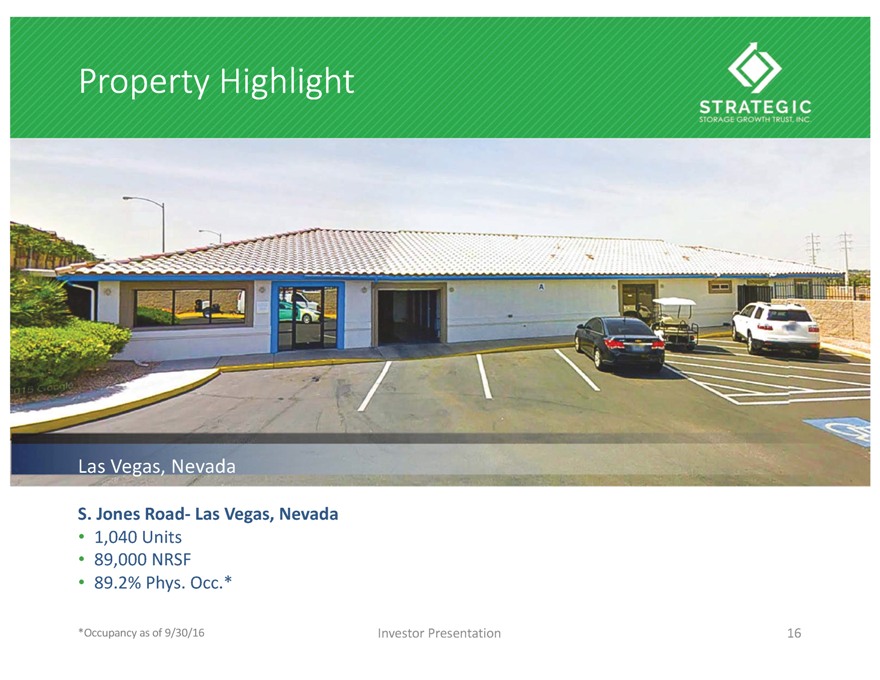
Property Highlight Investor Presentation 16 S. Jones Road- Las Vegas, Nevada 1,040 Units 89,000 NRSF 89.2% Phys. Occ.* Las Vegas, Nevada *Occupancy as of 9/30/16 Strategic Storage Growth Trust, Inc.
|
|
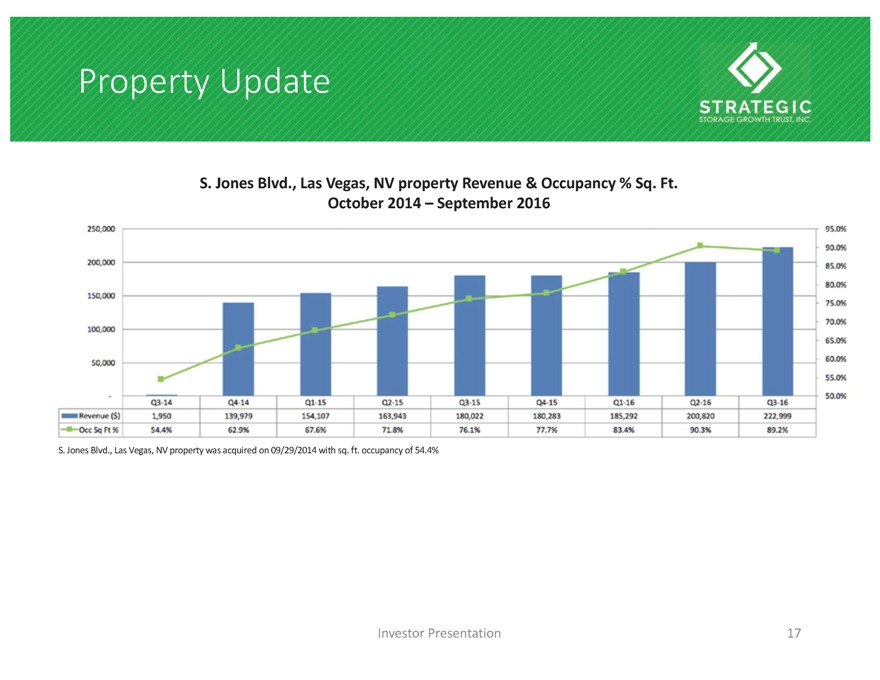
Property Update Investor Presentation 17 S. Jones Blvd., Las Vegas, NV property Revenue & Occupancy % Sq. Ft. October 2014 September 2016 S. Jones Blvd., Las Vegas, NV property was acquired on 09/29/2014 with sq. ft. occupancy of 54.4% Strategic Storage Growth Trust, Inc.
|
|
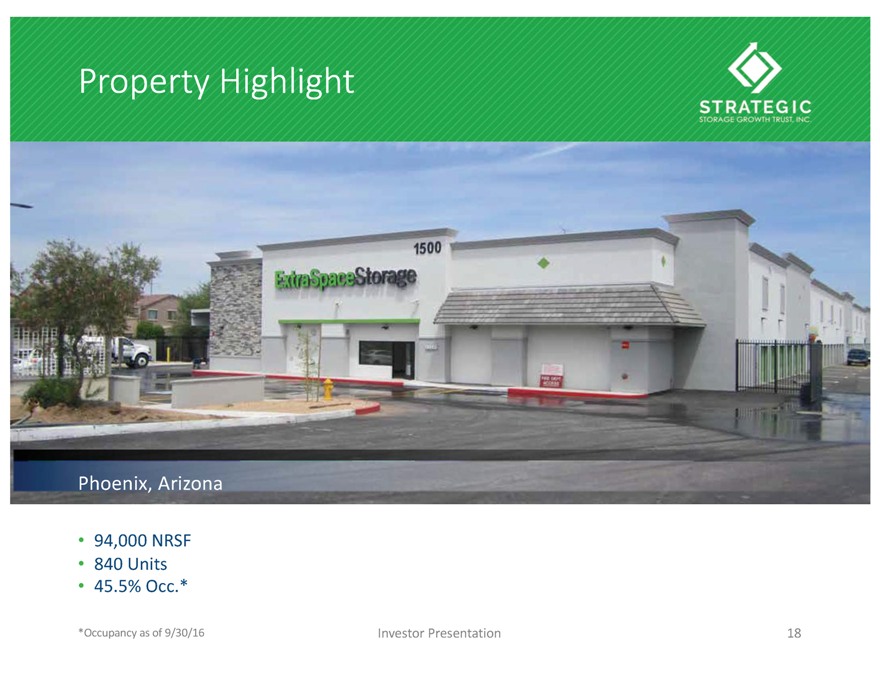
Property Highlight Investor Presentation 18 Phoenix, Arizona *Occupancy as of 9/30/16 94,000 NRSF 840 Units 45.5% Occ.* Strategic Storage Growth Trust, Inc.
|
|
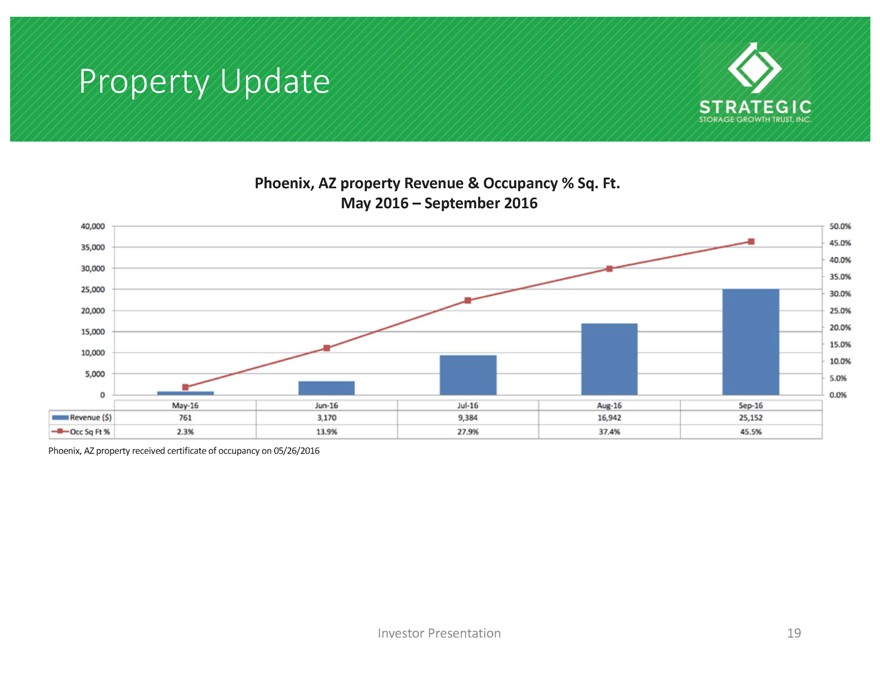
Property Update Investor Presentation 19 Phoenix, AZ property Revenue & Occupancy % Sq. Ft. May 2016 September 2016 Phoenix, AZ property received certificate of occupancy on 05/26/2016 Strategic Storage Growth Trust, Inc.
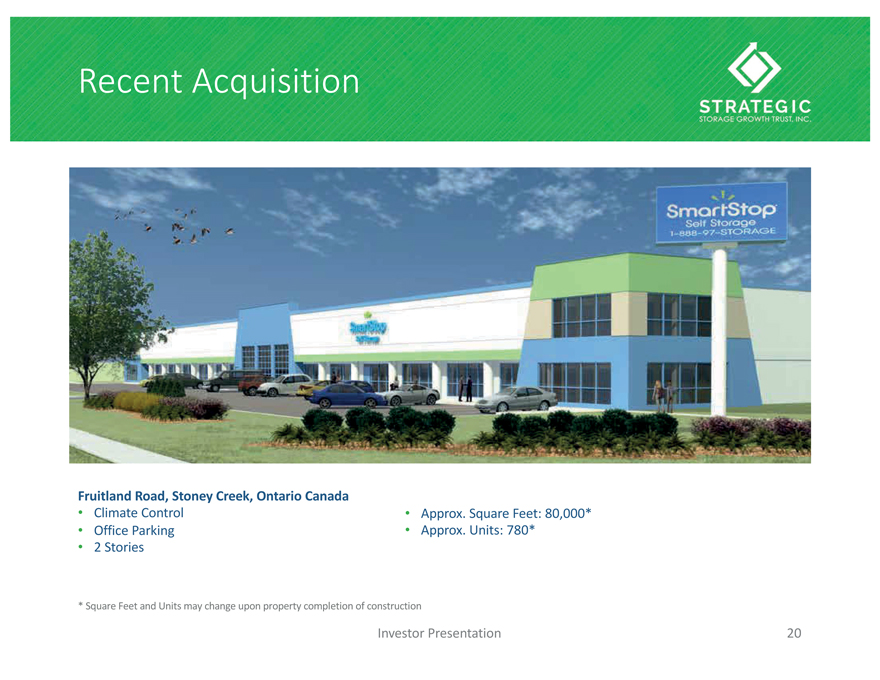
Recent Acquisition
Fruit l and Road, Stoney Creek, Ontario Canada
Climate Control Approx. Square Feet: 80,000*
Office Parking Approx. Units: 780*
2 Stories
*Square Feetand Units may change upon property completion of construction
Investor Presentation 20
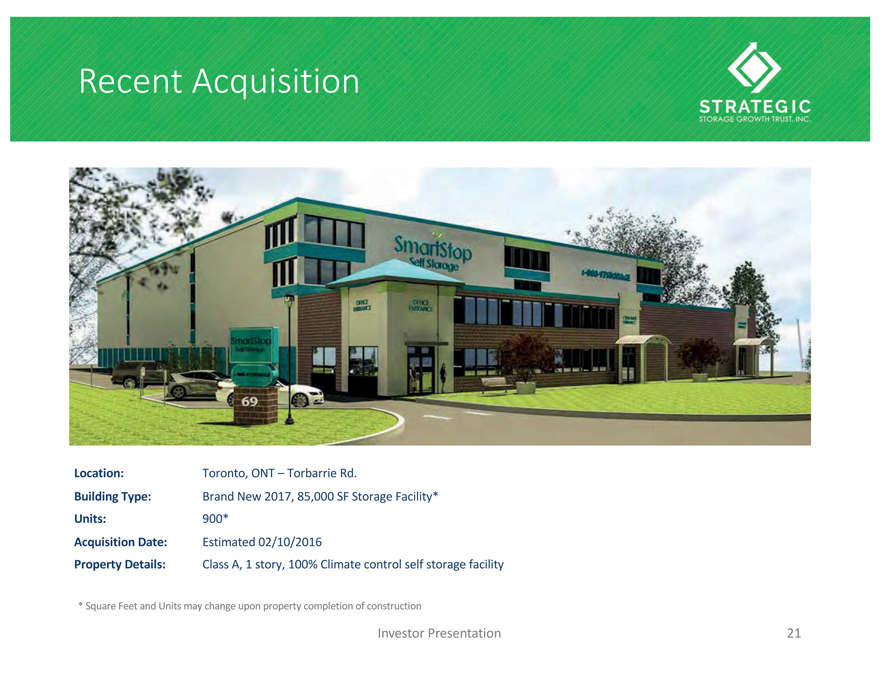
Recent Acquisition
Location: Toronto, ONT– Torbarrie Rd.
Building Type: Brand New 2017, 85, 000 SF Storage Facility*
Units: 900*
Acquisition Date: Estimated 02/10/2016
Property Details: ClassA, 1story, 100% Climate control self storage facility
*Square Feet and Units may change upon property completion of construction
Investor Presentation 21
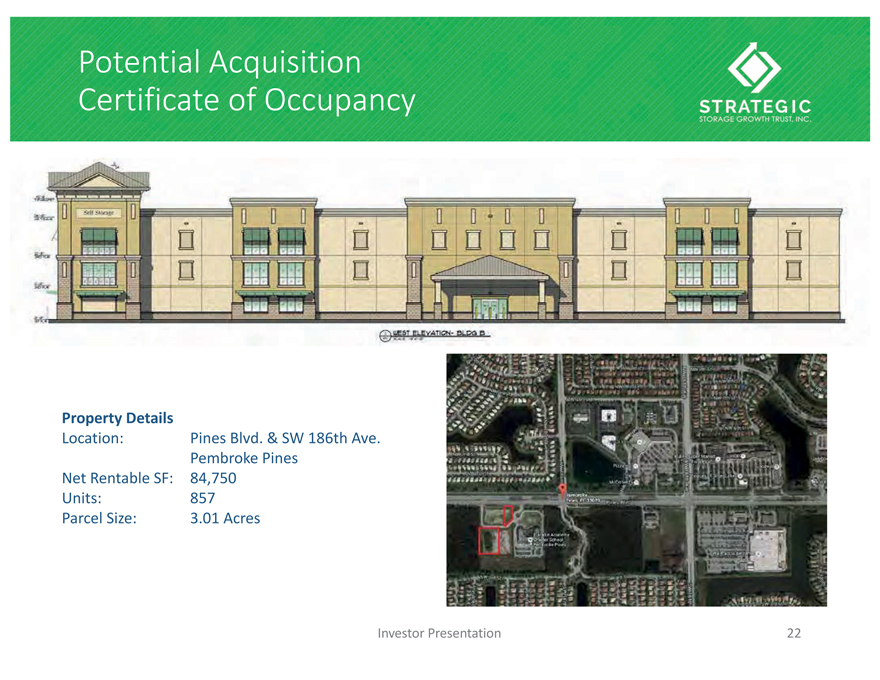
Potential Acquisition Certificate of Occupancy
Property Details
Location: Pines Blvd. & SW 186th Ave. Pembroke Pines Net Rentable SF: 84,750 Units: 857 Parcel Size: 3.01Acres
Investor Presentation 22
|
|
Additional Information Regarding NOI Net Operating Income or NOI is a non-GAAP measure that we define as net income (loss), computed in accordance with GAAP, generated from properties before corporate general and administrative expenses, asset management fees, interest expense, depreciation, amortization, acquisition expenses and other non-property related expenses. We believe that NOI is useful for investors as it provides a measure of the operating performance of our operating assets because NOI excludes certain items that are not associated with the operation of the properties. Additionally, we believe that NOI is a widely accepted measure of comparative operating performance in the real estate community. However, our use of the term NOI may not be comparable to that of other real estate companies as they may have different methodologies for computing this amount. Investor Presentation 21 Strategic Storage Growth Trust, Inc.
|
|
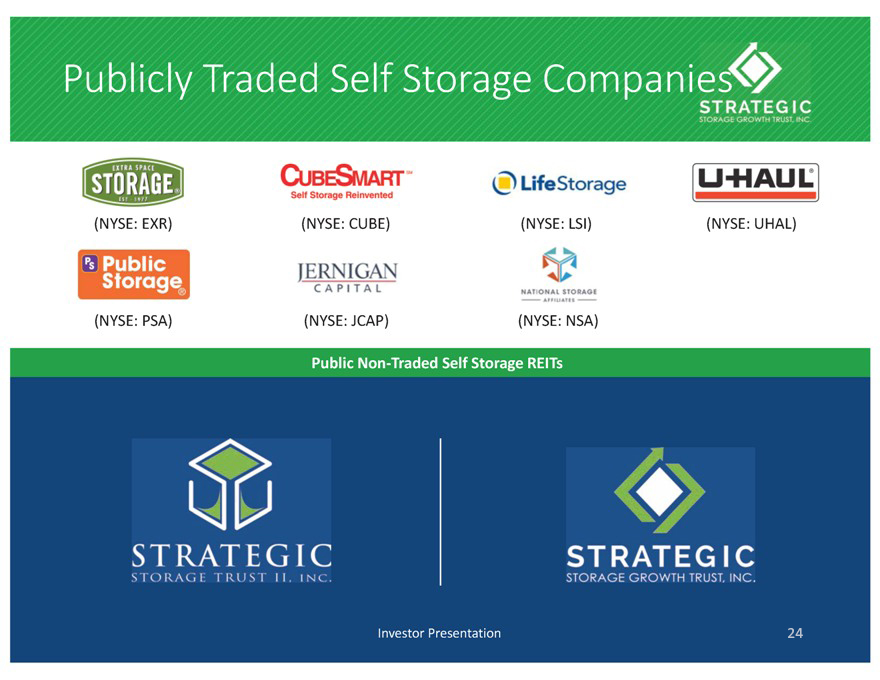
Investor Presentation 24 Publicly Traded Self Storage Companies Public Non-Traded Self Storage REITs (NYSE: CUBE) (NYSE: LSI) (NYSE: UHAL) (NYSE: PSA) (NYSE: JCAP) (NYSE: NSA) (NYSE: EXR) Strategic Storage Growth Trust, Inc.
|
|
Investor Presentation 25 QUESTIONS Strategic Storage Growth Trust, Inc.