Attached files
| file | filename |
|---|---|
| 8-K - 8-K - Northern Power Systems Corp. | d271507d8k.htm |
| EX-99.1 - EX-99.1 - Northern Power Systems Corp. | d271507dex991.htm |
November 15, 2016 Q3 2016 Earnings Presentation Northern Power Systems Ciel Caldwell President and COO Eric Larson VP and CAO Exhibit 99.2
Forward Looking Statement and non-gaap disclosures All statements and other information contained in this document related to anticipated future events or results constitute forward-looking statements. Forward-looking statements often, but not always, are identified by the use of words such as “seek”, “anticipate”, “believe”, “plan”, “estimate”, “expect”, “intend”, “forecast”, “project”, “likely”, “potential”, “targeted” and “possible” and statements that an event or result “may”, “will”, “would”, “should”, “could” or “might” occur or be achieved and other similar expressions. Forward-looking statements are subject to known and unknown business and economic risks and uncertainties and other factors that could cause actual results of operations to differ materially from those expressed or implied by the forward-looking statements. Forward-looking statements are based on estimates and opinions of management at the date the statements are made. Northern Power Systems does not undertake any obligation to update forward-looking statements even if circumstances or management’s estimates or opinions should change, except as required by law. For the reasons set forth above, investors should not place undue reliance on forward-looking statements. This presentation references non-GAAP financial measures with the required reconciliation referenced in the table captioned “Non-GAAP Reconciliations” to the most comparable GAAP financial measures.
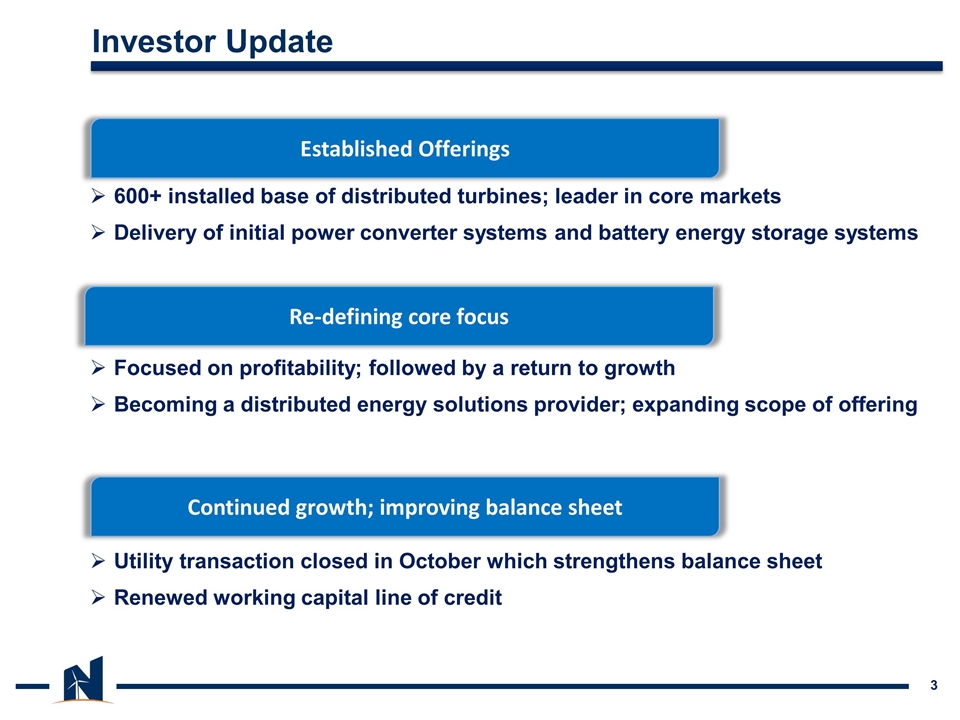
600+ installed base of distributed turbines; leader in core markets Delivery of initial power converter systems and battery energy storage systems Investor Update Established Offerings Re-defining core focus Continued growth; improving balance sheet Utility transaction closed in October which strengthens balance sheet Renewed working capital line of credit Focused on profitability; followed by a return to growth Becoming a distributed energy solutions provider; expanding scope of offering
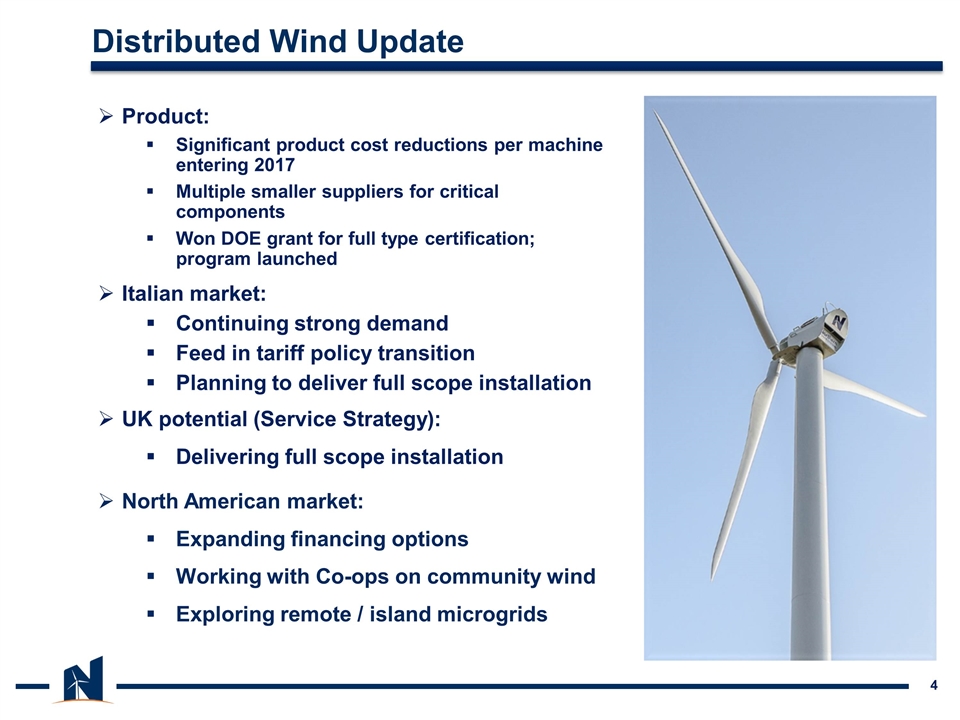
Product: Significant product cost reductions per machine entering 2017 Multiple smaller suppliers for critical components Won DOE grant for full type certification; program launched Italian market: Continuing strong demand Feed in tariff policy transition Planning to deliver full scope installation UK potential (Service Strategy): Delivering full scope installation North American market: Expanding financing options Working with Co-ops on community wind Exploring remote / island microgrids Distributed Wind Update
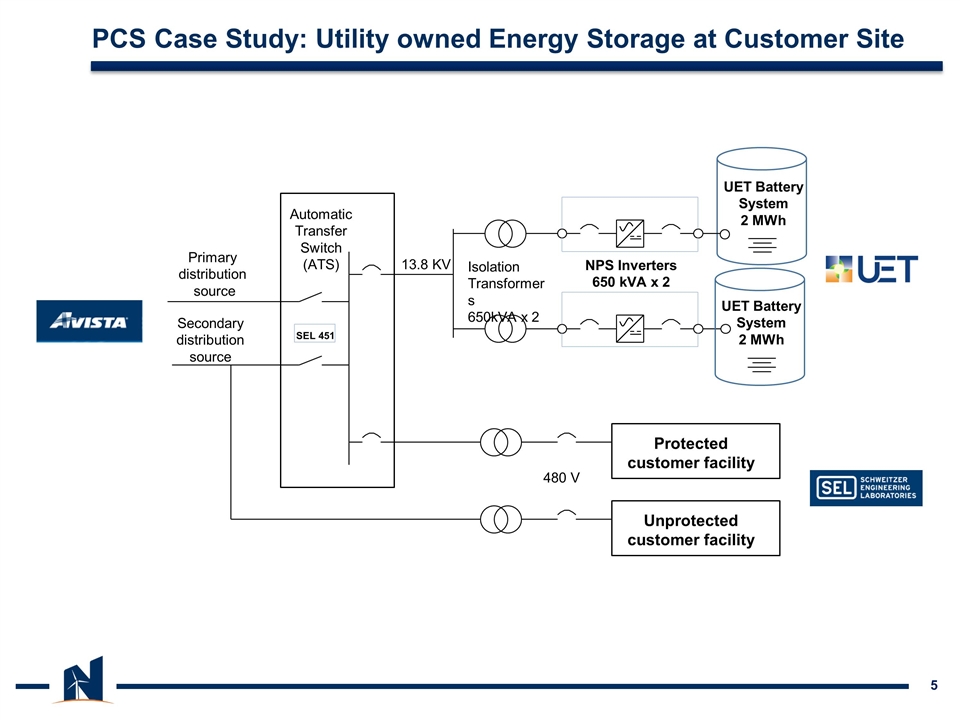
PCS Case Study: Utility owned Energy Storage at Customer Site UET Battery System 2 MWh Primary distribution source Secondary distribution source UET Battery System 2 MWh NPS Inverters 650 kVA x 2 Isolation Transformers 650kVA x 2 13.8 KV Automatic Transfer Switch (ATS) Protected customer facility SEL 451 Unprotected customer facility 480 V
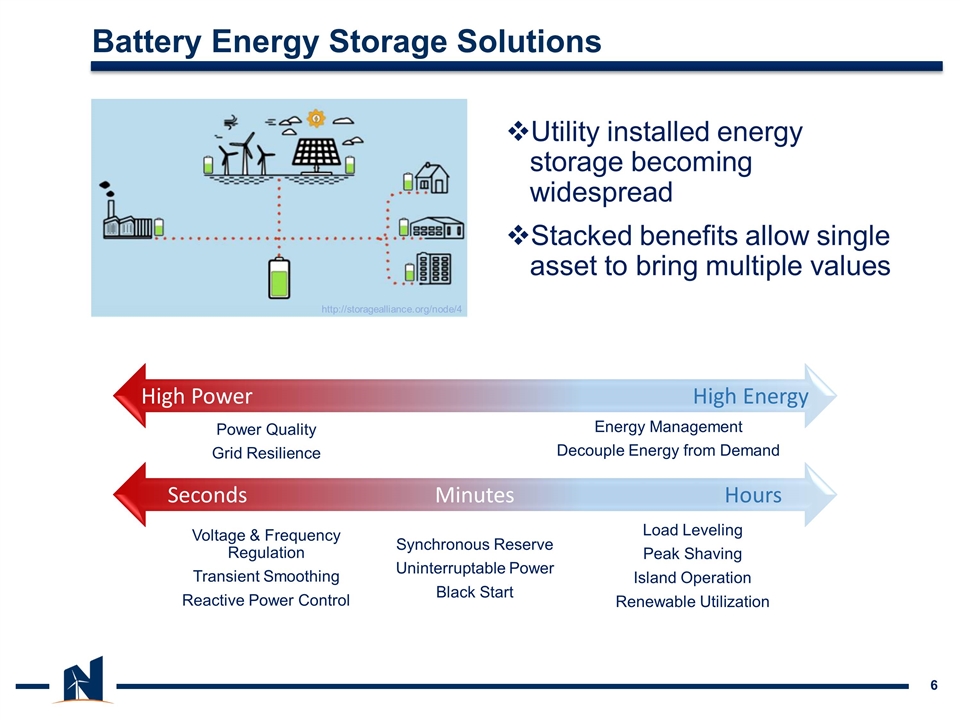
Utility installed energy storage becoming widespread Stacked benefits allow single asset to bring multiple values Battery Energy Storage Solutions High Power High Energy Power Quality Grid Resilience Energy Management Decouple Energy from Demand Seconds Minutes Hours Voltage & Frequency Regulation Transient Smoothing Reactive Power Control Load Leveling Peak Shaving Island Operation Renewable Utilization Synchronous Reserve Uninterruptable Power Black Start http://storagealliance.org/node/4
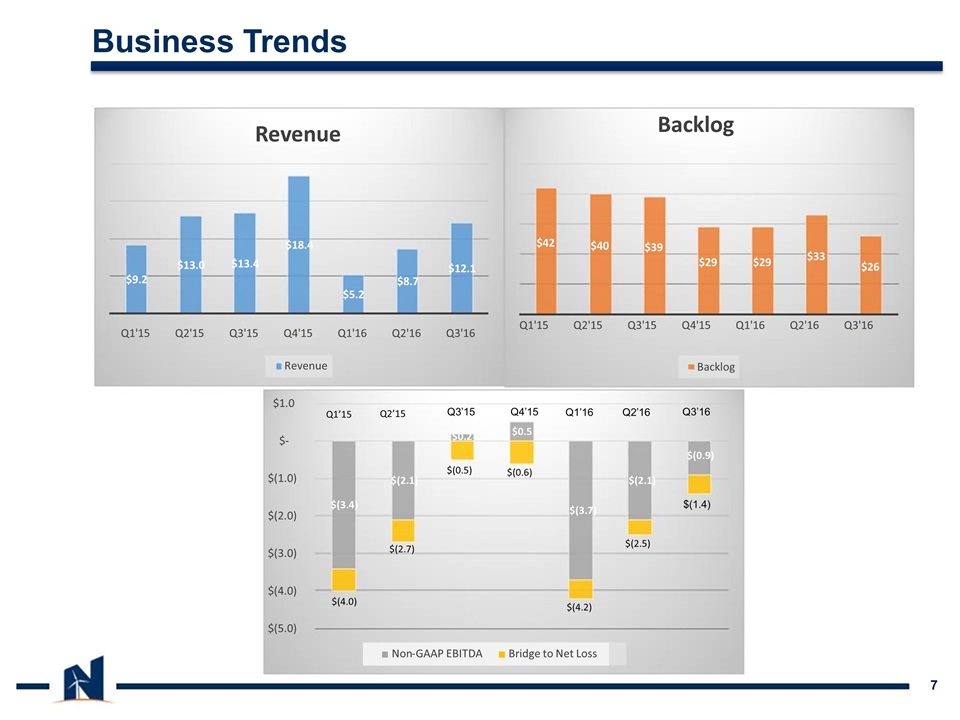
Business Trends Q3’15 Q4’15 Q1’16 Q2’16 Q3’16 $(1.4) $9.2 $13.0 $13.4 $18.4 $5.2 $8.7 $12.1 Q1'15 Q2'15 Q3'15 Q4'15 Q1'16 Q2'16 Q3'16 Revenue Revenue $42 $40 $39 $29 $29 $33 $26 Q1'15 Q2'15 Q3'15 Q4'15 Q1'16 Q2'16 Q3'16 Backlog Backlog $(3.4) $(2.1) $(3.7) $(2.1) $(5.0) $(4.0) $(3.0) $(2.0) $(1.0) $ - $1.0 Non - GAAP EBITDA Bridge to Net Loss Q1’15 Q2’15 $(4.0) $(2.7) $(0.5) $(0.6) $(4.2) $(2.5) $0.2 $0.5 $(0.9)
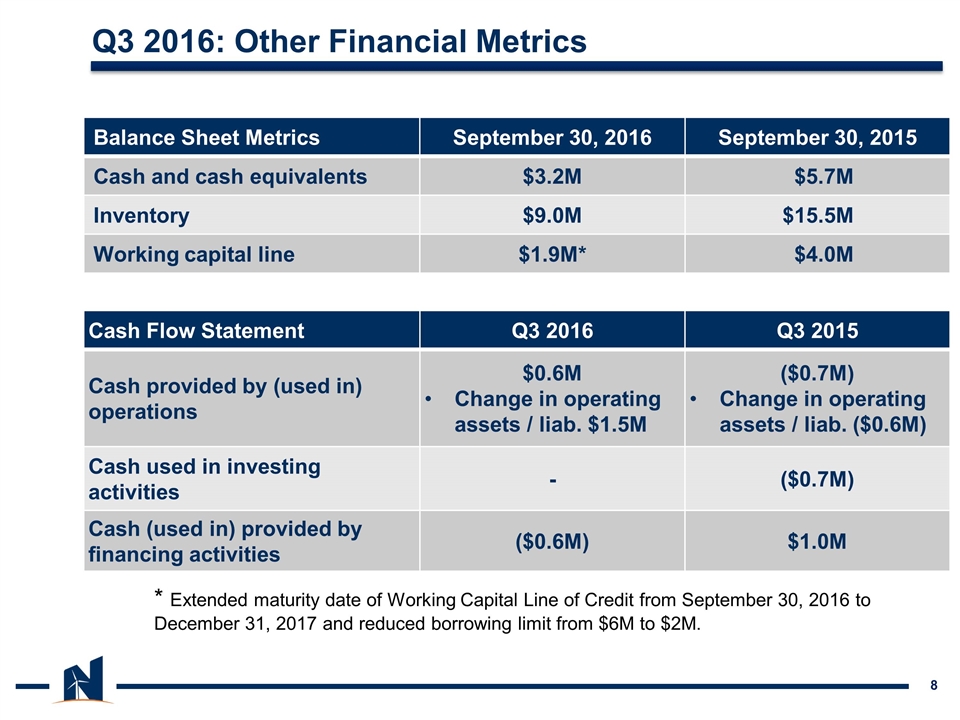
Cash Flow Statement Q3 2016 Q3 2015 Cash provided by (used in) operations $0.6M Change in operating assets / liab. $1.5M ($0.7M) Change in operating assets / liab. ($0.6M) Cash used in investing activities - ($0.7M) Cash (used in) provided by financing activities ($0.6M) $1.0M Q3 2016: Other Financial Metrics Balance Sheet Metrics September 30, 2016 September 30, 2015 Cash and cash equivalents $3.2M $5.7M Inventory $9.0M $15.5M Working capital line $1.9M* $4.0M * Extended maturity date of Working Capital Line of Credit from September 30, 2016 to December 31, 2017 and reduced borrowing limit from $6M to $2M.
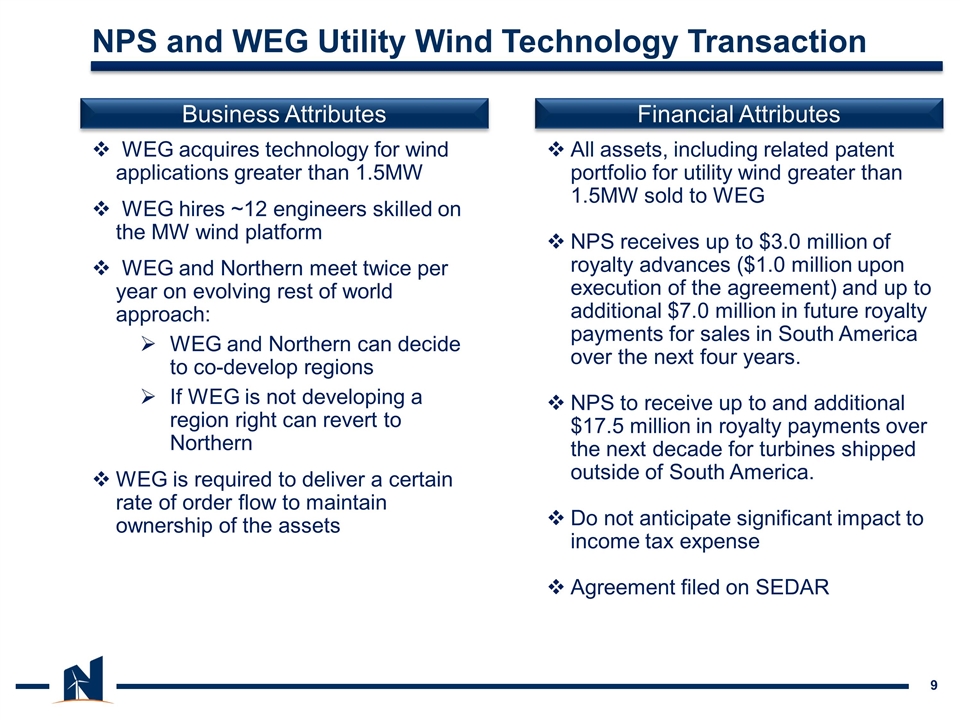
WEG acquires technology for wind applications greater than 1.5MW WEG hires ~12 engineers skilled on the MW wind platform WEG and Northern meet twice per year on evolving rest of world approach: WEG and Northern can decide to co-develop regions If WEG is not developing a region right can revert to Northern WEG is required to deliver a certain rate of order flow to maintain ownership of the assets All assets, including related patent portfolio for utility wind greater than 1.5MW sold to WEG NPS receives up to $3.0 million of royalty advances ($1.0 million upon execution of the agreement) and up to additional $7.0 million in future royalty payments for sales in South America over the next four years. NPS to receive up to and additional $17.5 million in royalty payments over the next decade for turbines shipped outside of South America. Do not anticipate significant impact to income tax expense Agreement filed on SEDAR NPS and WEG Utility Wind Technology Transaction Business Attributes Financial Attributes
Non-GAAP Reconciliations
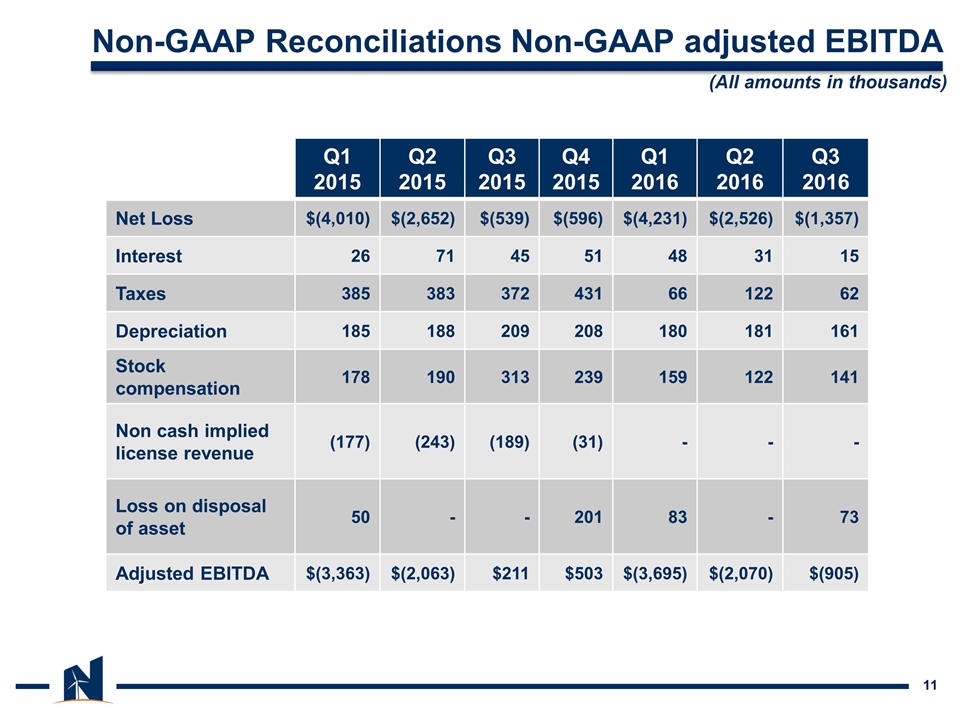
Non-GAAP Reconciliations Non-GAAP adjusted EBITDA Q1 2015 Q2 2015 Q3 2015 Q4 2015 Q1 2016 Q2 2016 Q3 2016 Net Loss $(4,010) $(2,652) $(539) $(596) $(4,231) $(2,526) $(1,357) Interest 26 71 45 51 48 31 15 Taxes 385 383 372 431 66 122 62 Depreciation 185 188 209 208 180 181 161 Stock compensation 178 190 313 239 159 122 141 Non cash implied license revenue (177) (243) (189) (31) - - - Loss on disposal of asset 50 - - 201 83 - 73 Adjusted EBITDA $(3,363) $(2,063) $211 $503 $(3,695) $(2,070) $(905) (All amounts in thousands)
