Attached files
| file | filename |
|---|---|
| 8-K - FORM 8-K - NEW YORK COMMUNITY BANCORP INC | d293262d8k.htm |
 Third
Quarter 2016 Investor Presentation
Exhibit 99.1 |
 New York Community Bancorp, Inc. 2 Cautionary Statements This presentation may include forward-looking statements by
the Company and our authorized officers pertaining to such matters as our goals, intentions, and expectations regarding revenues, earnings, loan production, asset quality, capital levels, and acquisitions, among other matters,
including the proposed merger with Astoria Financial Corporation
(“Astoria Financial” or “Astoria”); our estimates of future costs and benefits of the actions we may take; our assessments of probable losses on loans; our assessments of interest rate and other market risks; and our ability to
achieve our financial and other strategic goals.
Forward-looking
statements are typically identified by such words as “believe,” “expect,” “anticipate,” “intend,” “outlook,” “estimate,” “forecast,” “project,”
forward-looking
statements speak only as of the date they are made; the Company does not assume any duty, and does not undertake, to update our forward-looking statements. Furthermore, because forward-looking statements are subject to assumptions and uncertainties, actual results or future and other similar words and expressions, and are subject to numerous assumptions, risks, and uncertainties, which change over time. Additionally, events could differ, possibly materially, from those anticipated in our statements, and our future performance could differ materially from our
historical results.
shareholder and regulatory approvals of any acquisitions we may propose, including
regulatory approval of the proposed Astoria Financial merger; our ability
to successfully integrate any assets, liabilities, customers, systems, and management personnel we may acquire into our operations, and our ability to realize related revenue synergies and cost savings within expected time frames; changes in legislation, regulations, and policies;
and a variety of other matters which, by their nature, are subject to
significant uncertainties and/or are beyond our control. Our forward-looking statements are subject to the following principal risks and uncertainties: general economic conditions and trends, either nationally
or locally; conditions in the securities markets; changes in interest rates; changes in
deposit flows, and in the demand for deposit, loan, and
investment products and other financial services; changes in real estate values; changes in the quality or composition of our loan or investment portfolios; changes in competitive pressures among financial institutions or from non-financial institutions; our ability to obtain the necessary other risks and uncertainties, including those we may discuss in this presentation, or in our SEC filings, which are accessible on our website and at the SEC’s website, www.sec.gov. More information regarding some of these factors is provided in the Risk Factors section of our Form 10-K for the year ended December 31,
2015, our Form 10-Q for the three months ended September 30, 2016, and
in other SEC reports we file. Our forward-looking statements may also be subject to Our Supplemental Use of Non-GAAP Financial Measures This presentation may contain certain non-GAAP financial measures which management believes to be useful to investors in understanding the
companies’ performance and financial condition, and in comparing
their performance and financial condition with those of other banks. Such non-GAAP financial measures are supplemental to, and are not to be considered in isolation or as a substitute for, measures calculated in accordance with GAAP. Forward-Looking Information |
 New York Community Bancorp, Inc. 3 At 9/30/16 Pro Forma with Astoria Assets With assets of $49.5 billion, we are the 22nd
largest U.S. bank holding company.
With pro forma assets of $63.7 billion (b) , we expect to rank 21st among U.S. bank holding companies. Multi-Family Loan Portfolio With a portfolio of $27.1 billion, we are a leading
producer of multi-family loans in New York City. With a pro forma portfolio of $31.2 billion (b) , we expect to augment our position as a leading multi- family lender in New York City. Deposits With deposits of $29.1 billion and 255 branches,
we currently rank 26th among the nation’s largest
depositories. With pro forma deposits of $38.1 billion (b) and 343 branches, we expect to rank 23rd among the nation’s largest depositories. Deposit Market Share With deposits of $23.1 billion (c) in the NY MSA, our rank among regional banks is currently #3 for deposit market share. With pro forma deposits of $32.2 billion (c) in the NY MSA, we expect our rank among regional banks to rise to #2. Market Cap With a market cap of $6.9 billion at 9/30/16, we rank 21st among the nation’s publicly traded banks and thrifts. With a pro forma market cap of $8.4 billion (d) , we expect to rank 20th among the nation’s publicly traded banks and thrifts. Note: Except as otherwise indicated, all information regarding Astoria in this presentation was provided by Astoria;
all industry data was provided by SNL Financial
as of 11/10/16. Currently pending regulatory approval, the Astoria merger is expected to result in significant asset, loan, and deposit growth. (a) (a) On November 9, 2016, we announced that, based on discussions with our regulators, we do not expect to receive the regulatory approvals required
to consummate the proposed merger with Astoria by the end of 2016.
Under the terms of the merger agreement with Astoria, either the Company
or Astoria may terminate the agreement, without penalty, if the merger
has not occurred by December 31, 2016. Both we and Astoria remain committed to the transaction, but any extension of such date or other modification under the merger agreement is subject to the discretionary approval of the Boards of
Directors of both companies, and there can be no assurance that both
Boards will agree to any such extension or other modification.
(b) Pro forma assets, deposits, and multi-family loans are based on our balances and Astoria’s at 9/30/16 and include purchase accounting
adjustments. (c)
Data from SNL Financial is as of 6/30/16.
(d) Our pro forma market cap was calculated by multiplying our closing price at 9/30/16 by the sum of our outstanding shares and Astoria’s at
that date. |
 The Core Components
of our Business Model |
 Multi-Family
Loan Production |
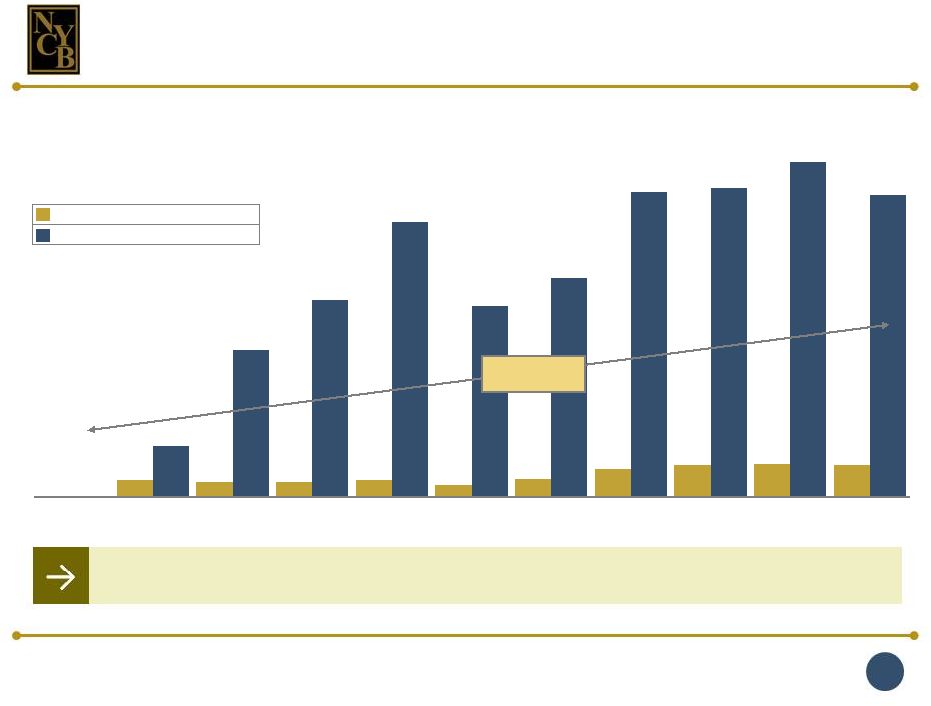
 New York Community Bancorp, Inc. 6 $18,605 $20,714 $23,849 $25,989 $27,083 $4,093 12/31/12 12/31/13 12/31/14 12/31/15 9/30/16 9/30/16 NYCB Portfolio Statistics at or for the 9 Mos. Ended 9/30/16 % of non-covered loans held for investment = 72.5% Average principal balance = $5.4 million Weighted average life = 2.9 years % of our multi-family loans located in Metro New York = 78.6% % of HFI loan originations = 63.3% Multi-Family Loan Portfolio (in millions) The vast majority of our multi-family loans are collateralized by non-luxury buildings in NYC with rent-regulated units. Originations: $5,791 $7,417 $7,584 $9,214 $4,530 $572 NYCB Astoria |
 New York Community Bancorp, Inc. 7 Of the loans in our portfolio that are collateralized by multi-family buildings in the five boroughs of New York City, 88% are collateralized by buildings with rent-regulated units featuring below-market rents. Rent-regulated buildings are more likely to retain their tenants – and, therefore, their revenue stream – in downward credit cycles. Together with our conservative underwriting standards, our focus on multi-family lending in this niche market has resulted in our record of superior asset quality. Multi-family loans are less costly to produce and service than other types
of loans, and therefore contribute to our superior efficiency. Our focus on this particular multi-family lending niche has enabled us to distinguish ourselves from our industry peers. |
 Asset Quality |
 New York Community Bancorp, Inc. 9 2.91% 4.00% 4.05% 3.41% 2.35% 1.46% 2.48% 2.10% 2.83% 1.51% 12/31/89 12/31/90 12/31/91 12/31/92 12/31/93 S & L Crisis Great Recession Current Credit Cycle Non-Performing Loans (a)(b) / Total Loans (a) (a) Non-performing loans and total loans exclude covered loans and non-covered purchased credit-impaired (“PCI”) loans.
(b) Non-performing loans are defined as non-accrual loans and loans 90 days or more past due but still accruing interest.
1.11%
2.71%
4.17%
3.56%
0.11%
0.51%
2.47%
2.63%
12/31/07
12/31/08
12/31/09
12/31/10
2.60%
2.22%
1.66%
1.26%
1.07%
0.98%
1.28%
0.96%
0.35%
0.23%
0.13%
0.12%
12/31/11
12/31/12
12/31/13
12/31/14
12/31/15
9/30/16
Average NPLs/Total Loans
NYCB: 2.08% SNL U.S. Bank and Thrift Index: 3.34% Average NPLs/Total Loans NYCB: 1.43% SNL U.S. Bank and Thrift Index: 2.89% Average NPLs/Total Loans NYCB: 0.51% SNL U.S. Bank and Thrift Index: 1.63% Our record of asset quality in downward credit cycles has consistently distinguished us from our industry peers. NYCB SNL U.S. Bank and Thrift Index |
 New York Community Bancorp, Inc. 10 0.68% 1.63% 2.83% 2.89% 0.00% 0.03% 0.13% 0.21% 2007 2008 2009 2010 0.54% 1.28% 1.50% 1.17% 0.91% 0.00% 0.00% 0.04% 0.07% 0.06% 1989 1990 1991 1992 1993 S & L Crisis Net Charge-Offs/ Average Loans 5-Year Total NYCB: 17 bp SNL U.S. Bank and Thrift Index: 540 bp 4-Year Total NYCB: 37 bp SNL U.S. Bank and Thrift Index: 803 bp Great Recession Current Credit Cycle 5.75-Year Total NYCB: 52 bp SNL U.S. Bank and Thrift Index: 521 bp Few of our non-performing loans have resulted in actual losses. 1.77% 1.24% 0.76% 0.53% 0.46% 0.45% 0.35% 0.13% 0.05% 0.01% 2011 2012 2013 2014 2015 9M 2016 (0.02)% (0.00)% * Annualized * SNL U.S. Bank and Thrift Index NYCB |
 New York Community Bancorp, Inc. 11 Conservative Underwriting Conservative loan-to-value ratios Conservative debt service coverage ratios: 120% for multi-family loans and 130% for CRE
loans Multi-family and CRE loans are based on the lower of economic or market value.
Active Board Involvement All loans originated for portfolio are presented to the Mortgage or Credit Committee of the
Community Bank Board or Commercial Bank Board.
A member of the Mortgage or Credit Committee participates in inspections on
multi-family loans in excess of $7.5 million, and CRE and ADC loans
in excess of $4.0 million. All loans of $20 million or more originated by
the Community Bank and all loans of $10 million or more
originated by the Commercial Bank are reported to the Board.
Multiple Appraisals All properties are appraised by independent appraisers. All independent appraisals are reviewed by in-house appraisal officers. A second independent appraisal review is performed on loans that are large and complex.
Risk-Averse Mix of Non-Covered Loans Held for Investment (at 9/30/16)
Multi-family: 72.5%
CRE: 20.8% One-to-Four Family: 0.9% ADC: 1.0% Commercial & Industrial: 4.8% The quality of our assets reflects the nature of our lending niche and our strong underwriting standards. |
 Efficiency |
 New York Community Bancorp, Inc. 13 Factors Driving Our Efficiency Multi-family and CRE lending are both broker-driven, with the
borrower paying fees to the mortgage brokerage firm.
Products and services are typically developed by third-party
providers and the sale of these products generates
additional revenues. Franchise expansion has largely
stemmed from mergers and acquisitions; we rarely engage
in de novo branch development. Most of our deposits have
been acquired through earnings-accretive
acquisitions.
SNL U.S. Bank and Thrift Index
NYCB Astoria We are a highly efficient institution. 66.59% 65.93% 65.41% 62.01% 64.18% 40.75% 42.71% 43.16% 43.81% 43.72% 2012 2013 2014 2015 9M 2016 9M 2016 Efficiency Ratio Anticipated Benefits of the Astoria Merger In-market nature of the merger underscores the potential for significant
cost savings
Estimated
cost saves = ~ 50% of Astoria’s non-interest expense Opportunity to leverage our mortgage platform and Astoria’s retail origination model Provides immediate scale to absorb higher SIFI compliance-related costs Expanded customer base represents an opportunity for revenue growth (e.g., through sales of third-party investment products and other financial
services)
72.81%
(a) Excludes the impact of the $773.8 million debt repositioning charge recorded in net interest income and state and local non-income taxes of
$5.4 million resulting from the debt repositioning charge that were
recorded in operating expenses. Including these items, our efficiency ratio was 99.48% in 2015. Please see the reconciliation of our efficiency ratio and adjusted efficiency ratio on page 34.
(a) |
 Residential Mortgage Banking |
 New York Community Bancorp, Inc. 15 Features Loans can be originated in all 50 states and the District of Columbia. Loan production is driven by our proprietary real time, web-accessible mortgage
banking technology platform, which securely controls the lending process while mitigating business and regulatory risks. We have approximately 900 approved clients, including community banks, credit unions, mortgage companies, and mortgage brokers. 100% of loans funded are full documentation, prime credit loans. Credit Quality As of September 30, 2016, 99.8% of all funded loans were current. Limited Repurchase Risk Of the $45.7 billion of 1-4 family loans sold to GSEs since 2010--when we launched
our mortgage banking business--only 28 loans totaling $7.9 million (0.017%) have been repurchased. Benefits Since January 2010, our mortgage banking business has generated mortgage banking income of $662.6 million. Our proprietary mortgage banking platform has enabled us to expand our revenues,
market share, and product line.
At September 30, 2016, the portfolio of 1-4 family loans serviced for GSEs totaled $21.1 billion. Our mortgage banking platform has been a source of revenues since 2010. |
 Growth Through
Acquisitions |
 New York Community Bancorp, Inc. 17 Significantly Increases our Earnings ~ 20% pro forma earnings accretion (a) ~ 15.5% return on average tangible common equity (ROATCE) Expected cost saves (~ 50% of Astoria’s non- interest expense) maintain our longstanding record of efficiency Expands our margin Increases our revenue stream Significantly Strengthens our Balance Sheet De-risking strategies greatly enhance our balance sheet profile ~ 6% tangible book value per share (TBVPS) accretion at the close (a) Boosts deposits by ~ $9 billion and substantially increases our share of deposits in core markets Heightens liquidity while reducing our cost of funds Extends our longstanding record of exceptional asset quality Reduces our interest rate sensitivity Builds capital (a) Including the strategic debt repositioning and capital raise completed in 4Q 2015.
The Astoria merger is expected to build our earnings, our
capital, and our shareholder returns. |
 New York Community Bancorp, Inc. 18 (in millions) Deposits w/ HAVN w/ RCBK w/ RSLN w/ LICB w/ ABNY w/ PFSB, Doral, & SYNF w/ AmTrust w/ Desert Hills w/ Astoria Total Deposits: $3,268 $5,472 $10,360 $12,168 $12,764 $13,311 $22,418 $21,890 $24,878 $28,427 $29,140 $38,100 Total Branches: 86 120 139 152 166 217 276 276 275 258 255 343 CDs NOW, MMAs, and Savings Demand deposits Like our earlier transactions, the Astoria merger is expected to enhance our
liquidity, reduce our funding costs, and boost our deposit market
share. w/ Aurora
(a) Pro forma deposits are based on our balances and Astoria’s at 9/30/16 and include purchase accounting adjustments.
(a) $1,874 $2,408 $4,362 $5,247 $5,945 $6,913 $9,054 $7,835 $9,121 $5,312 $7,384 $9,066 $1,223 $2,609 $5,278 $6,015 $5,554 $4,975 $11,494 $12,122 $12,998 $20,611 $18,827 $25,045 $171 $455 $720 $906 $1,265 $1,423 $1,870 $1,933 $2,759 $2,504 $2,929 $3,989 12/31/00 12/31/01 12/31/03 12/31/05 12/31/06 12/31/07 12/31/09 12/31/10 12/31/12 12/31/15 9/30/16 9/30/16 Pro Forma |
 New York Community Bancorp, Inc. 19 Note: Data from SNL Financial is as of 6/30/16. Long Island Brooklyn Queens Westchester 53% 87% 92% Within 1 Mile Within 3 Miles Within 5 Miles Astoria NYCB % of Astoria branches near an NYCB branch The Astoria merger is expected to boost our market share in Nassau and Suffolk Counties, Queens, and Brooklyn. |
 New York Community Bancorp, Inc. 20 Boosts our deposit market share in Metro New York from 7% to 9% Infusion of low-cost core deposits enhances our funding mix Expands our customer base and opportunities to increase non-interest revenues Potential improvement in deposit pricing power due to increased scale The Astoria merger is expected to increase our rank among regional banks in the NY MSA from #3 to #2. Note: Data from SNL Financial is as of 6/30/16. (a) Excludes international banks and money centers, including JPMorgan, Bank of New York Mellon, HSBC Holdings, Citigroup, Bank of America, TD, Wells
Fargo, Bank of China, and Banco Santander.
A Stronger Deposit Franchise
2016 Rank Top Regional Banks in the NY MSA (a) Deposits ($mm) 1 Capital One $51,919 2 NYCB Pro Forma 32,239 2 Signature 29,539 3 NYCB 23,092 4 M&T Bank 22,164 5 PNC 21,945 6 Valley National 13,775 7 Investors 12,839 8 Apple Financial 11,716 9 First Republic 10,487 10 Sterling 9,748 11 Astoria Financial 9,147 |
 New York Community Bancorp, Inc. 21 The Astoria merger is expected to enhance our asset and funding mix. NYCB Astoria Pro Forma (a) Total HFI Loans: $39.1 bn Yield on Loans: 3.77% Multi-family 69% CRE 20% ADC 1% C&I 4% 1-4 Family (Non-covered) 1% Covered Loans 5% Other 0% Multi-family 38% CRE 7% C&I 1% 1-4 Family (Non-covered) 52% Other 2% Multi-family 63% CRE 17% ADC 1% C&I 4% 1-4 Family (Non-covered) 12% Covered Loans 3% Other 0% NYCB NOW and MMA 46% Savings 19% CDs 25% N-I-B 10% Astoria NOW and MMA 46% Savings 23% CDs 19% N-I-B 12% Pro Forma (a) NOW and MMA 46% Savings 20% CDs 24% N-I-B 10% Total Deposits: $29.1 bn Cost of I-B Deposits: 0.64% Total HFI Loans: $10.6 bn Yield on Loans: 3.49% Total HFI Loans: $49.7 bn Yield on Loans: 3.71% Total Deposits: $8.9 bn Cost of I-B Deposits: 0.30% Total Deposits: $38.1 bn Cost of I-B Deposits: 0.55% (a) Pro forma deposit and loan data is based on our balances and Astoria’s at 9/30/16 and includes purchase accounting adjustments.
|
 New York Community Bancorp, Inc. 22 $1,946 $3,255 $7,368 $12,854 $14,529 $14,055 $16,736 $16,802 $18,605 $25,989 $27,083 $31,152 $324 $566 $1,445 $2,888 $3,114 $3,826 $4,987 $5,438 $7,437 $7,860 $7,767 $8,505 $1,366 $1,584 $1,686 $1,287 $2,010 $2,482 $1,654 $1,467 $1,243 $1,914 $2,511 $8,239 12/31/00 12/31/01 12/31/03 12/31/05 12/31/06 12/31/07 12/31/09 12/31/10 12/31/12 12/31/15 9/30/16 9/30/16 Pro Forma After HAVN After RCBK After RSLN After LICB After ABNY After PFSB, Doral, & SYNF After AmTrust After Desert Hills HFI Loans Outstanding: $3,636 $5,405 $10,499 $17,029 $19,653 $20,363 $23,377 $23,707 $27,285 $35,763 $37,361 $47,896 HFI Originations: $616 $1,150 $4,330 $6,332 $4,971 $4,853 $3,392 $4,329 $8,969 $12,673 $7,156 $8,301 After Aurora Multi-family CRE All other HFI loans (in millions) Like our earlier transactions, the Astoria merger is expected to provide funding for the growth of our high-yielding loan portfolio. After Astoria (a) Excludes covered loans and non-covered PCI loans. (b) Pro forma loan amounts are based on our balances and Astoria’s at 9/30/16 and include purchase accounting adjustments.
(b) Loan Portfolio Held-for-Investment (a) |
 New York Community Bancorp, Inc. 23 * The Astoria merger was announced in October 2015. All other mergers on this page were completed in the months and years indicated.
The number of branches indicated for our earlier transactions is the number of branches
in our current franchise that stemmed from each.
Transaction Type:
Savings Bank Commercial Bank Branch FDIC Deposit The Astoria merger is expected to leverage our expertise in managing post-merger integrations. 1. Nov. 2000 Haven Bancorp (HAVN) Assets: $2.7 billion Deposits: $2.1 billion Branches: 25 2. July 2001 Richmond County Financial Corp. (RCBK) Assets: $3.7 billion Deposits: $2.5 billion Branches: 24
3. Oct. 2003
Roslyn Bancorp, Inc. (RSLN) Assets: $10.4 billion Deposits: $5.9 billion Branches: 38
4. Dec. 2005
Long Island Financial Corp. (LICB) Assets: $562 million Deposits: $434 million Branches: 9
5. April 2006
Atlantic Bank of New York (ABNY) Assets: $2.8 billion Deposits: $1.8 billion Branches: 14 6. April 2007 PennFed Financial Services, Inc. (PFSB) Assets: $2.3 billion Deposits: $1.6 billion Branches: 21 7. July 2007 NYC branch network of Doral Bank, FSB (Doral- NYC) Assets: $485 million Deposits: $370 million Branches: 11
8. Oct. 2007
Synergy Financial Group, Inc. (SYNF) Assets: $892 million Deposits: $564 million Branches: 16 9. Dec. 2009 AmTrust Bank Assets: $11.0 billion Deposits: $8.2 billion Branches: 64
10. March 2010
Desert Hills Bank Assets: $452 million Deposits: $375 million Branches: 3
11. June 2012
Aurora Bank FSB Assets: None Deposits: $2.2 billion Branches: 0
Payment Received: $24.0 million 12. Oct. 2015* Astoria Financial Corporation (AF) Assets: $15.0 billion Deposits: $9.1 billion Branches:
88 |
 New York Community Bancorp, Inc. 24 36% 44% 2010 3Q 2016 Following enactment of the Dodd-Frank Act, we began allocating significant resources towards SIFI
preparedness.
The degree to which we have already leveraged the cost of SIFI
compliance is reflected in the ~ 800-basis point
increase in our efficiency ratio since the enactment of Dodd-Frank. The merger will provide the additional scale to leverage the remaining SIFI compliance costs.
We expect the merger to bring us well beyond the current
SIFI threshold.
Preparing for SIFI Status
NYCB Efficiency Ratio
Prior to and Since Dodd-Frank
SIFI Compliance Key infrastructure investments to date include: — Enhanced ERM and corporate governance frameworks — Bottom-up capital planning and stress testing capabilities — Substantial expansion of regulatory compliance staff Remaining costs of SIFI compliance include LCR, CCAR reporting, and Living Will |
 New York Community Bancorp, Inc. 25 14 % 13 % 26 % 4 % 19 % 29 % 52 % 32 % 23 % 29 % 32 % 27 % 35 % 31 % 21 % 32 % 28 % 27 % 25 % 29 % 21 % 36 % 24 % 21 % 5 % 32 % 18 % 13 % 23 % 35 % 38 % 35 % 41 % 34 % 39 % 50 % 40 % 50 % 51 % 55 % 59 % 71 % 57 % 78 % 86 % 14 % 18 % 26 % 36 % 37 % 42 % 55 % 58 % 67 % 67 % 68 % 69 % 70 % 71 % 72 % 78 % 78 % 80 % 88 % 92 % 93 % 102 % 107 % ZION BAC MTB C MS JPM NYCB PF 2017 BBT CFG STI HBAN CMA WFC USB COF FITB PNC KEY STT RF DFS NTRS BK AXP As we continue to grow, we would expect our total payout ratio to be more consistent with the total payout ratio for our SIFI peers. Dividends Approved in 2015 Share Repurchases Approved in 2015 |
 3Q 2016 Performance Highlights |
 New York Community Bancorp, Inc. 27 (dollars in thousands, except per share data) (a) ROTA and ROTE are non-GAAP financial measures. Please see page 35 for additional information.
Our 3Q 2016 performance reflected the benefit of the
strategic debt repositioning we completed in 4Q 2015.
3Q 2016 3Q 2015 Strong Profitability Measures: Earnings $125,299 $114,688 EPS $0.26 $0.26 Return on average assets 1.02% 0.94% Return on average stockholders’ equity 8.24 7.88 Return on average tangible assets (a) 1.08 0.99 Return on average tangible stockholders’ equity (a) 13.79 13.66 Net interest margin 2.91 2.56 Efficiency ratio 44.27 46.07 |
 New York Community Bancorp, Inc. 28 From 9/30/14 to 9/30/16, we managed our assets below the current SIFI threshold
while maintaining our high-volume production of multi-family and CRE
loans. Strategic Asset
Management Total Assets 9/30/14 $48.7 Billion • Reduced securities by $3.7 billion through a combination of repayments, sales, and calls • Sold loans of $3.9 billion: $2.4 billion of multi-family loans (largely through participations) $918.5 million of CRE loans (largely through participations) $631.3 million of 1–4 family loans • Other balance sheet reductions included loan satisfactions and refinancings of $10.4 billion Total Assets 9/30/16 $49.5 Billion • Originated $15.6 billion of multi-family loans • Originated $3.2 billion of CRE loans Result: A $782.8 million increase in total assets from 9/30/14 – 9/30/16. |
 New York Community Bancorp, Inc. 29 (a) Non-performing loans and total loans exclude covered loans and non-covered PCI loans.
(b) Non-performing assets and total assets exclude covered loans, covered OREO, and non-covered PCI loans.
Our balance sheet measures reflect stability and strength.
Company Capital
9/30/16 Stockholders’ equity / total assets 12.31% Common equity tier 1 capital ratio 10.25 Leverage capital ratio 7.95 Bank Capital 9/30/16 The Community Bank: Common equity tier 1 capital ratio 10.83% Leverage capital ratio 8.43 The Commercial Bank: Common equity tier 1 capital ratio 13.31% Leverage capital ratio 10.26 Balance Sheet 9/30/16 Loans, net / total assets 80.2% Securities / total assets 7.7 Deposits / total assets 58.9 Wholesale borrowings / total assets 27.6 Asset Quality At or for the Three Months Ended 9/30/16 Non-performing loans (a) / total loans (a) 0.12% Non-performing assets (b) / total assets (b) 0.12 Net charge-offs / average loans (non- annualized) 0.00 |
 Total Return on Investment |
 New York Community Bancorp, Inc. 31 244% 213% 209% 245% 168% 260% 393% 450% 461% 449% 717% 2,059% 2,754% 3,843% 2,670% 3,069% 4,265% 4,319% 11/23/93 12/31/99 12/31/08 12/31/09 12/31/10 12/31/11 12/31/12 12/31/13 12/31/14 12/31/15 9/30/16 CAGR since IPO: 24.7% (a) Bloomberg Total Return on Investment As a result of nine stock splits between 1994 and 2004, our charter shareholders have 2,700 shares of NYCB stock for each 100 shares originally purchased. SNL U.S. Bank and Thrift Index NYCB (a) Our commitment to building value for our investors is reflected in our total return over the course of our public life. 4,682%
4,215% |
 New York Community Bancorp, Inc. 32 11/15/16 Visit our website: ir.myNYCB.com E-mail requests to: ir@myNYCB.com Call Investor Relations at: (516) 683-4420 Write to: Investor Relations New York Community Bancorp, Inc. 615 Merrick Avenue Westbury, NY 11590 For More Information |
 Reconciliations of GAAP
and Non-GAAP
Financial Measures |
 New York Community Bancorp, Inc. 34 Our adjusted efficiency ratio is calculated by dividing our adjusted operating expenses by the sum of our adjusted net interest income and our non-interest income during the twelve months ended December 31, 2015. Our adjusted operating expenses exclude the aforementioned $5.4 million of non-income taxes and our adjusted net interest income excludes the aforementioned $773.8 million debt repositioning charge. While our adjusted efficiency ratio, adjusted operating expenses, and adjusted net interest income are not GAAP measures, we believe it is
important to disclose them in this investor presentation for the reasons cited below: 1. Given the significant impact of the debt repositioning charge on our 2015 net interest income and operating expenses, a comparison of these line
items with those reported in the past and going forward would not be
meaningful; 2.
For the same reason, a comparison of our 2015 efficiency ratio with those reported in the past and going forward would not be useful, given the degree to which it was impacted by the debt repositioning charge; 3. The efficiency ratio is a measure utilized by both management and investors to assess the profitability of the company, both independent of, and in comparison with, its peers. Given the significant impact of the debt repositioning charge on our 2015 net interest income and, to a lesser extent, our operating expenses, providing the efficiency ratio on both a GAAP and non-GAAP basis clarifies that impact and facilitates an understanding of our 2015 results. Our adjusted efficiency ratio, adjusted operating expenses, and adjusted net interest income are supplemental to, and should not be considered in isolation or as a substitute for our efficiency ratio, operating expenses, net interest income, or any other profitability measure that is calculated in accordance with GAAP. Moreover, the manner in which we calculate these non-GAAP measures may differ from that of other companies reporting non-GAAP measures with a similar name. The following table reconciles our efficiency ratio and adjusted efficiency ratio and the respective GAAP and non-GAAP components for the
twelve months ended December 31, 2015: Reconciliation of our 2015
Efficiency Ratio and Adjusted Efficiency Ratio and the Related
Components (dollars in thousands)
For the Twelve Months Ended
December 31, 2015 Operating expenses (GAAP) $ 615,600 Adjustment: State and local non-income taxes resulting from the debt repositioning charge and recorded as G&A expense
(5,440) Adjusted operating expenses (non-GAAP) $ 610,160 Net interest income (GAAP ) $ 408,075 Non-interest income (GAAP) 210,763 Sum of net interest income and non-interest income (GAAP) $ 618,838 Adjustment: Debt repositioning charge recorded in net interest income $ 773,756 Adjusted sum of net interest income and non-interest income (non-GAAP) $1,392,594 Efficiency ratio 99.48% Adjusted efficiency ratio 43.81% The efficiency ratio is a measure of profitability reported by U.S. banks to convey the degree to which the pre-tax revenues they generate
during a period are utilized to cover the cost of their compensation and
benefits, occupancy and equipment, and general and administrative (“G&A")
expenses (together, their "operating expenses") during that time. We calculate our efficiency ratio by dividing our total operating expenses by the sum of our (i) net interest income and (ii) non-interest
income (together, our pre-tax revenues). The lower the ratio, the more efficient the institution; the less a bank spends on its operating expenses, the more of its pre-tax earnings it retains.
While all three components of our 2015 efficiency ratio are calculated in accordance
with U.S. generally accepted accounting principles ("GAAP"), we have supplemented the presentation of our GAAP efficiency ratio with the presentation of a non-GAAP “adjusted efficiency ratio” to reflect the impact of the $773.8 million strategic debt
repositioning charge we recorded in 2015. As further described below, two of the components of our adjusted efficiency ratio are not calculated in accordance with GAAP. In 2015, we prepaid $10.4 billion of wholesale borrowings with an average cost of 3.16% and replaced them with a like amount of wholesale
borrowings with an average cost of 1.58%. While the benefit of the
strategic debt repositioning is reflected in our earnings for the three and nine months
ended September 30, 2016, it adversely impacted our 2015 efficiency ratio in a variety of ways. First, we recorded a debt repositioning charge of $773.8 million as interest expense, which resulted in our recording a net interest loss, rather than net interest income,
for the year. Second, we recorded $5.4 million of non-income tax
expenses in our 2015 G&A expense.
|
 New York Community Bancorp, Inc. 35 While average stockholders’ equity, average assets, return on average assets, and return on average stockholders’ equity are financial
measures that are recorded in accordance with U.S. generally accepted
accounting principles (“GAAP”), average tangible stockholders’ equity, average tangible assets, return on average tangible assets, and return on average tangible stockholders’ equity are not. Nevertheless, it is management’s belief that these non-GAAP measures should be disclosed in our
SEC filings, earnings releases, and other investor communications, for
the following reasons: 1.
Average tangible stockholders’ equity and average tangible assets are important
indications of the Company’s ability to grow organically and through business combinations, as well as our ability to pay dividends and to engage in various capital management strategies.
2. Returns on average tangible assets and average tangible stockholders’ equity are among the profitability measures considered by current and
prospective investors, both independent of, and in comparison with, our
peers. We calculate average tangible stockholders’ equity by
subtracting from average stockholders’ equity the sum of our average goodwill and core deposit intangibles (“CDI”), and calculate average tangible assets by subtracting the same sum from our average assets.
Average tangible stockholders’ equity, average tangible assets, and the related
non-GAAP profitability measures should not be considered in isolation or as a substitute for average stockholders’ equity, average assets, or any other profitability or capital measure calculated in accordance with GAAP. Moreover, the manner in which we calculate these non- GAAP measures may differ from that of other companies reporting non-GAAP measures with similar names. The following table presents reconciliations of our average stockholders’ equity and average tangible stockholders’ equity, our average assets and average tangible assets, and the related GAAP and non-GAAP profitability measures for the three months ended September 30, 2016 and 2015: Reconciliations of our GAAP and Non-GAAP Profitability Measures (1) To calculate our returns on average assets and average stockholders’ equity for a period, we divide the net income generated during that
period by the average assets and the average stockholders’ equity
recorded during that time.
(2) To calculate our returns on average tangible assets and average tangible stockholders’ equity for a period, we adjust the net income generated during that period by adding back the amortization of CDI, net of tax, and then divide that adjusted net income by the average tangible assets and the average tangible stockholders’ equity recorded during that
time. For the Three Months Ended Sept. 30,
(dollars in thousands)
2016 2015 Average stockholders’ equity $ 6,081,003 $ 5,822,699 Less: Average goodwill and core deposit intangibles (2,437,092) (2,440,708) Average tangible stockholders’ equity $ 3,643,911 $ 3,381,991 Average assets $49,159,171 $48,970,353 Less: Average goodwill and core deposit intangibles (2,437,092) (2,440,708) Average tangible assets $46,722,079 $46,529,645 Net income (1) $125,299 $114,688 Add back: Amortization of core deposit intangibles, net of tax 325 768 Adjusted net income (2) $125,624 $115,456 GAAP: Return on average assets 1.02% 0.94% Return on average stockholders’ equity 8.24 7.88 Non-GAAP: Return on average tangible assets 1.08 0.99 Return on average tangible stockholders’ equity 13.79 13.66 |