Attached files
| file | filename |
|---|---|
| 8-K - 8-K - Mead Johnson Nutrition Co | form8-kxnovember152016.htm |

Kasper Jakobsen
President and CEO
Morgan Stanley Global
Consumer & Retail Conference
November 15, 2016
Safe Harbor Statement
2
Forward-Looking Statements
Certain statements in this presentation are forward-looking as defined in the Private Securities Litigation Reform Act of 1995. These forward-looking statements
may be identified by the fact they use words such as “should,” “expect,” “anticipate,” “estimate,” “target,” “may,” “project,” “guidance,” “intend,” “plan,” “believe” and
other words and terms of similar meaning and expression. Such statements are likely to relate to, among other things, a discussion of goals, plans and projections
regarding financial position, results of operations, cash flows, market position, market growth and trends, product development, product approvals, sales efforts,
expenses, capital expenditures, performance or results of current and anticipated products and the outcome of contingencies such as legal proceedings and
financial results. Forward-looking statements can also be identified by the fact that they do not relate strictly to historical or current facts. Such forward-looking
statements are based on current expectations that involve inherent risks, uncertainties and assumptions that may cause actual results to differ materially from
expectations as of the date of this presentation. These risks include, but are not limited to: (1) the ability to sustain brand strength, particularly the Enfa family of
brands; (2) the effect on the company's reputation of real or perceived quality issues; (3) the effect of regulatory restrictions related to the company’s products; (4)
the adverse effect of commodity costs; (5) increased competition from branded, private label, store and economy-branded products; (6) the effect of an economic
downturn on consumers' purchasing behavior and customers' ability to pay for product; (7) inventory reductions by customers; (8) the adverse effect of changes in
foreign currency exchange rates; (9) the effect of changes in economic, political and social conditions in the markets where we operate; (10) changing consumer
preferences; (11) the possibility of changes in the Women, Infant and Children (WIC) program, or participation in WIC; (12) legislative, regulatory or judicial action
that may adversely affect the company's ability to advertise its products, maintain product margins, or negatively impact the company’s reputation or result in fines
or penalties that decrease earnings; and (13) the ability to develop and market new, innovative products. For additional information regarding these and other
factors, see the company’s filings with the United States Securities and Exchange Commission (the SEC), including its most recent Annual Report on Form 10-K
and Quarterly Reports on Form 10-Q, which filings are available upon request from the SEC or at www.meadjohnson.com. The company cautions readers not to
place undue reliance on any forward-looking statements, which speak only as of the date made. The company undertakes no obligation to publicly update any
forward-looking statement, whether as a result of new information, future events or otherwise.
Factors Affecting Comparability – Non-GAAP Financial Measures
This presentation contains non-GAAP financial measures. The items included in GAAP measures, but excluded for the purpose of determining the non-GAAP
financial measures, include significant income/expenses not indicative of underlying operating results, including the related tax effect and, at times, the impact of
foreign exchange. The non-GAAP measures represent an indication of the company’s underlying operating results and are intended to enhance an investor’s
overall understanding of the company’s financial performance and ability to compare the company’s performance to that of its peer companies. In addition, this
information is among the primary indicators the company uses as a basis for evaluating company performance, setting incentive compensation targets and
planning and forecasting of future periods. This information is not intended to be considered in isolation or as a substitute for financial measures prepared in
accordance with GAAP.
For more information:
Kathy MacDonald, Vice President – Investor Relations, Mead Johnson Nutrition Company, 847-832-2182, kathy.macdonald@mjn.com
Investment Thesis Intact
3
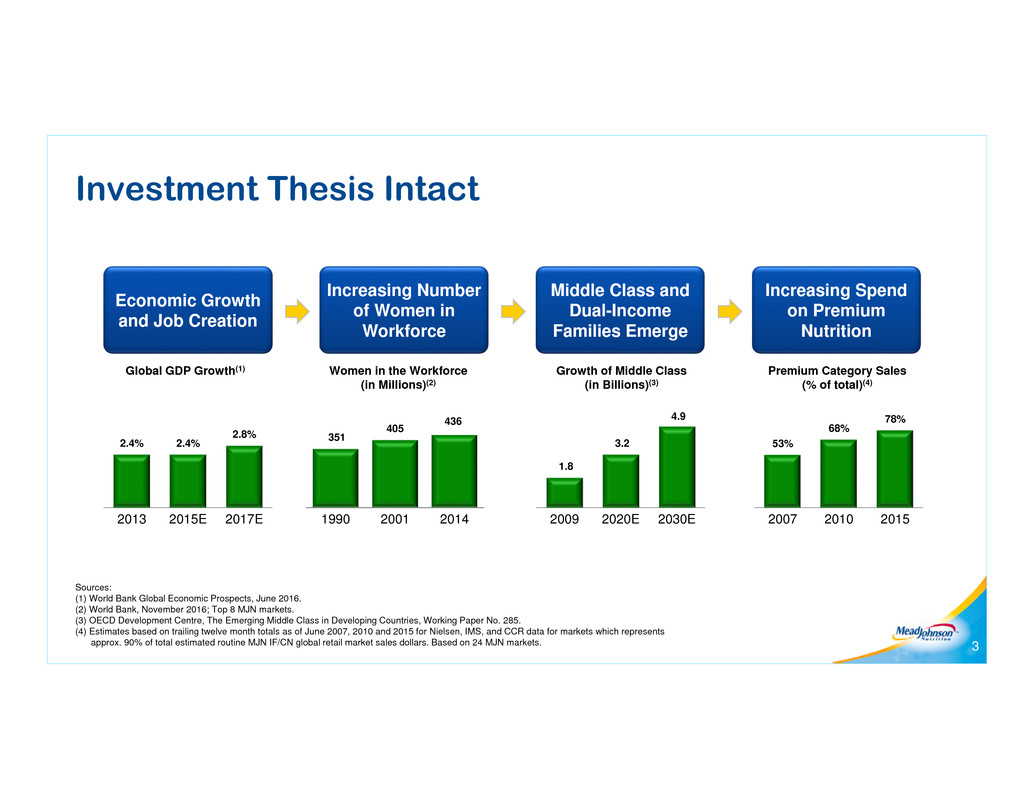
2.4% 2.4%
2.8%
2013 2015E 2017E
Sources:
(1) World Bank Global Economic Prospects, June 2016.
(2) World Bank, November 2016; Top 8 MJN markets.
(3) OECD Development Centre, The Emerging Middle Class in Developing Countries, Working Paper No. 285.
(4) Estimates based on trailing twelve month totals as of June 2007, 2010 and 2015 for Nielsen, IMS, and CCR data for markets which represents
approx. 90% of total estimated routine MJN IF/CN global retail market sales dollars. Based on 24 MJN markets.
Global GDP Growth(1) Growth of Middle Class
(in Billions)(3)
Economic Growth
and Job Creation
Middle Class and
Dual-Income
Families Emerge
Increasing Spend
on Premium
Nutrition
1.8
3.2
4.9
2009 2020E 2030E
53%
68%
78%
2007 2010 2015
Premium Category Sales
(% of total)(4)
Women in the Workforce
(in Millions)(2)
Increasing Number
of Women in
Workforce
351
405
436
1990 2001 2014

Near-term Headwinds and Tailwinds
4
• Weak macroeconomic environment
• Hong Kong channel
• Mixed execution performance
– United States
– Philippines
• Well executed strategy yields results:
– China
– Mexico
– Canada
– Europe
ChallengesGood Progress

North America
and Europe
5

Despite Challenges, U.S. Market Remains Attractive
Infant Formula Value Share
34%
36%
38%
40%
42%
44%
6Source: Nielsen Total US XAOC, Infant includes routine and specialty products
• Strong competitive activity
• MJN execution lapses
• Addressing internal execution
• Increasing demand-generating
investments
• Recovery takes time—as we
acquire a new cohort of babies
Top Competitor
Enfamil

MJN Abbott Nestle
• In 2015, ~47% of babies in the U.S. benefited
from WIC; program participation is declining
• MJN is WIC segment leader
• Contracts for ~1/3 of WIC births up for bid in 2017
• Higher rebate levels in recently awarded contracts
Increasing Demand-Generating WIC* Investment
7
*WIC = Special Supplemental Nutrition Program for Women, Infants and Children
Source: CTS and CDC.gov and MJN company analysis as of November 2016.
In case of split Milk and Soy contracts, the map represents the Milk contract.
Benefit from Participating in WIC
• Full price sales from product purchased beyond
rebated volume
• WIC contracts boost presence in hospitals and
retailers
WIC Statistics

U.S. - Strong Brands and Competition
8
Invest to Drive
Market Share
Win with an Innovative
Portfolio
Drive Toddler
Growth
• Strong MJN Brand Equity
• Science-based brain benefit highly
compelling
• Inherent strong infrastructure
• Long history of market leadership
shifts
MJN’s Growth Ambition
9
Driving Success with High Value Offerings
* Source: Nielsen Infant Market Share (4 week value shares)
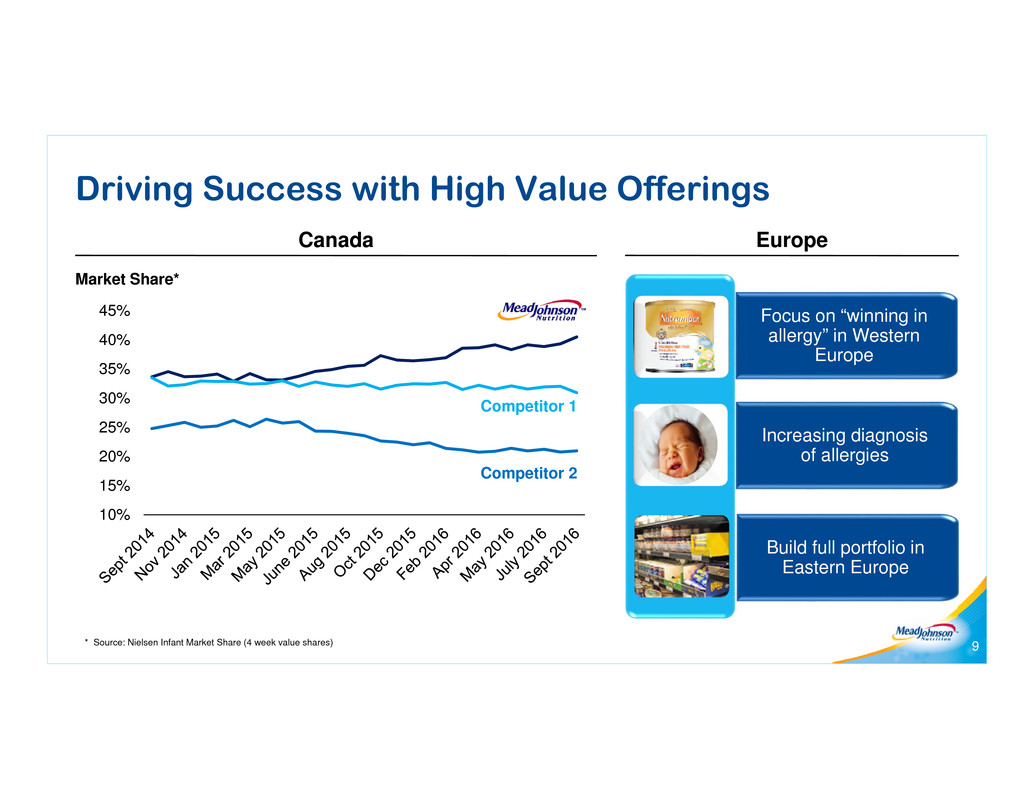
Market Share*
Focus on “winning in
allergy” in Western
Europe
Increasing diagnosis
of allergies
Build full portfolio in
Eastern Europe
EuropeCanada
10%
15%
20%
25%
30%
35%
40%
45%
Competitor 1
Competitor 2

China /
Hong Kong
10

China: Clear and Focused Strategy
11
Imported
Baby
Stores
B2C
Super
High
Premium
• Preferred country of origin
(e.g. the Netherlands)
• Strong brand equity
• Connection with Mothers
• Superior science
• Innovative packaging
• Preferred country of origin
(e.g. the Netherlands)
• Strength of product
portfolio
• Expanding coverage
• Building strong retailer
relationships
• Strength of product
portfolio
• Investment in growing
B2C e-commerce
• Advanced digital
capabilities

2014
Q4
2015
Q3
2016
Q1
2016
Q3
Industry Channels Shifting(1) Successful MJN Portfolio Transition(2)
(1) MJN analysis based on multiple sources.
(2) MJN mainland China sales.
China Evolving Channels
12
45%
Imported
Local
28%
60%
5%
Modern
Trade Hong Kong
e-Commerce
(includes
cross-border)
Baby Stores
Category
Growth
MJN
Market
Share

Q1 2015 Q2 2015 Q3 2015 Q4 2015 Q1 2016 Q2 2016 Q3 2016
Recent HK Protests(2)
(1) MJN Hong Kong average offtake
(2) News article: Ming Pao Daily, Hong Kong, Nov 7, 2016
Hong Kong Channel Expected to Diminish
13
MJN Offtake: Shift to e-commerce(1)
• Expect fewer mainland visitors
• Channel shift to e-commerce
• Regulatory changes and unrest
Online
Offline

14
Growing Baby Store & B2C Presence
MJN analysis based on multiple sources.
2015 YTD Sept 2016 YTD Sept
Market Share
+ 1 point
May 2016 Jun 2016 Jul 2016 Aug 2016 Sep 2016
(Enfinitas)
Retail Offtake
B2C Market Share Growth

(1) Guidance provided in the company’s earnings release on October 27, 2016.
(2) The company is unable to reconcile 2017 non-GAAP expectations to GAAP because the following factors are not yet determinable: foreign exchange, mark-to-market pension adjustments and
restructuring charges.
Strategic Roadmap
15
• Operating expense reductions to support
investment
• Building capabilities needed for the future
• Enhancing China product portfolio
• Contribution from new
growth initiatives
• Emerging Markets
expected to stabilize
• China Portfolio and
Channel transition
completed and regulatory
environment rebalances
• Emerging market growth
expected to normalize
• Full effect of strategy and
mitigation plans
Transition Building Growth Momentum
Drive Profitable
Growth
2017 2018 & Beyond2016
2016(1) 2017(2)
Reiterate guidance
communicated on October
27, 2016
• Only modest constant dollar sales
and EPS improvement
• Expect constant dollar sales and
EPS above 2016 levels
Key Takeaways
16
• Strategy Remains Compelling
• Continue to Invest in Our Future
• Disciplined Approach to Cost Management
• Creating a Stronger and More Agile Company
• Commitment to Shareholder Value Creation
