Attached files
| file | filename |
|---|---|
| 8-K - FORM 8-K - ConnectOne Bancorp, Inc. | f8k_111516.htm |
Exhibit 99.1

November 2016 Investor Presentation
Forward - Looking Statements This presentation contains forward - looking statements . Any statements about our expectations, beliefs, plans, predictions, forecasts, objectives, assumptions or future events or performance are not historical facts and may be forward - looking . These statements are often, but not always, made through the use of words or phrases such as “anticipate,” “believes,” “can,” “could,” “may,” “predicts,” “potential,” “should,” “will,” “estimate,” “plans,” “projects,” “continuing,” “ongoing,” “expects,” “intends” and similar words or phrases . Accordingly, these statements are only predictions and involve estimates, known and unknown risks, assumptions and uncertainties that could cause actual results to differ materially from those expressed in them . Our actual results could differ materially from those anticipated in such forward - looking statements as a result of several factors more fully described under “Risk Factors” in our Annual Report on Form 10 - k, Item 1 A . Any or all of our forward - looking statements in this presentation may turn out to be inaccurate . The inclusion of this forward - looking information should not be regarded as a representation by us that the future plans, estimates or expectations contemplated by us will be achieved . We have based these forward - looking statements largely on our current expectations and projections about future events and financial trends that we believe may affect our financial condition, results of operations, business strategy and financial needs . There are important factors that could cause our actual results, level of activity, performance or achievements to differ materially from the results, level of activity, performance or achievements expressed or implied by the forward looking statements including, but not limited to : ( 1 ) changes in general economic and financial market conditions ; ( 2 ) changes in the regulatory environment ; ( 3 ) economic conditions generally and in the financial services industry ; ( 4 ) changes in the economy affecting real estate values ; ( 5 ) our ability to achieve loan and deposit growth ; ( 6 ) the completion of our future acquisitions or business combinations and our ability to integrate the acquired business into our business model ; ( 7 ) projected population and income growth in our targeted market areas ; and ( 8 ) volatility and direction of market interest rates and a weakening of the economy which could materially impact credit quality trends and the ability to generate loans . All forward - looking statements are necessarily only estimates of future results and actual results may differ materially from expectations . You are, therefore, cautioned not to place undue reliance on such statements which should be read in conjunction with the other cautionary statements that are included elsewhere in this presentation . Further, any forward - looking statement speaks only as of the date on which it is made and we undertake no obligation to update or revise any forward - looking statement to reflect events or circumstances after the date on which the statement is made or to reflect the occurrence of unanticipated events . 2

ConnectOne Bancorp, Inc. Overview ( NASDAQ: CNOB) □ Holding company for ConnectOne Bank, headquartered in Englewood Cliffs, NJ □ Approximately $ 4.3 billion in total assets, $ 3.5 billion in total loans and $ 3.3 billion in total deposits □ 21 locations across Manhattan, Bergen, Essex, Hudson, Mercer, Monmouth, Morris and Union counties □ One of the largest New Jersey - based banking institutions with increased scale, technology and lending capabilities serving middle market commercial businesses □ Market capitalization: ~$640 million □ Current quarterly dividend $0.075 per common share; approximately 1.4% yield 3 □ Strategically placed offices throughout the NJ/NY metro area □ Tactical expansion strategy □ Retail locations serve as “business hubs”
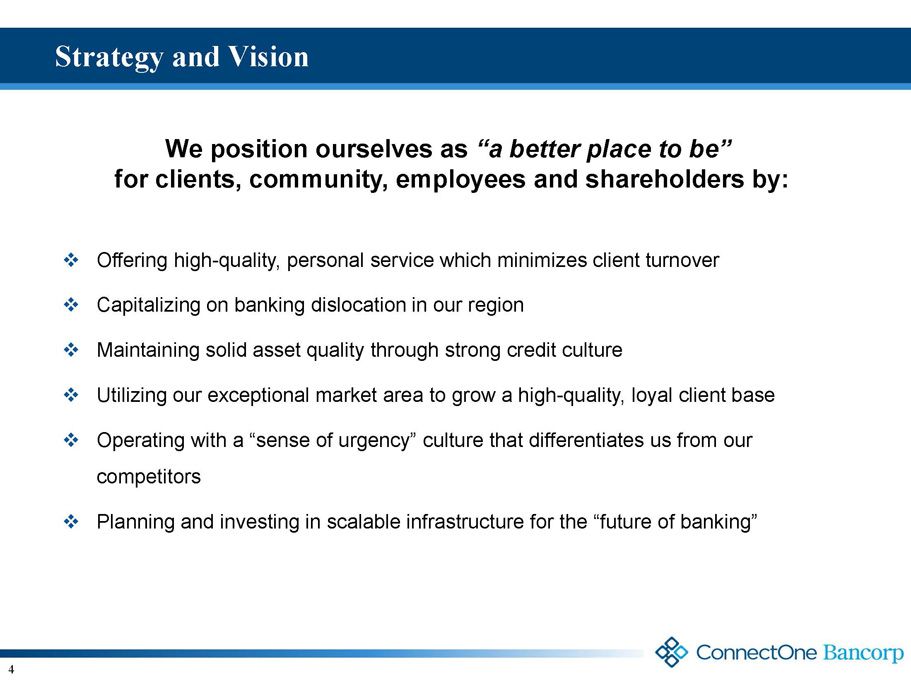
Strategy and Vision □ Offering high - quality, personal service which minimizes client turnover □ Capitalizing on banking dislocation in our region □ Maintaining solid asset quality through strong credit culture □ Utilizing our exceptional market area to grow a high - quality, loyal client base □ Operating with a “sense of urgency” culture that differentiates us from our competitors □ Planning and investing in scalable infrastructure for the “future of banking” 4 We position ourselves as “a better place to be” for clients, community, employees and shareholders by:

5 □ Strategically placed offices throughout the NJ/NY metro area □ Densely populated, high - growth markets □ $ 1.6 trillion on the United States $16 trillion GDP is in our market footprint □ New Jersey ranks 2 nd in the nation in median household income, 4 th in per capita income, and 2 nd in population density – Bergen County ranks among the top in the state in relation to these demographics □ Market is largely dominated by the largest institutions in the country, leaving tremendous opportunity for banks catering to middle market business □ Retail locations serve as “business hubs” supporting clients beyond their geographic footprint because of the technology bank offers Highly Attractive Operating Area

6 ConnectOne Milestones

7 Performance Trends *Excludes non - operating items. See appendix for a reconciliation of GAAP and non - GAAP measures. $0.34 $0.35 $0.36 $0.31 $0.34 $0.36 $0.39 $0.33 $0.33 $0.35 $0.36 $0.36 $0.38 $0.40 $0.24 $0.28 $0.32 $0.36 $0.40 $0.44 Q1 2015 Q2 2015 Q3 2015 Q4 2015 Q1 2016 Q2 2016 Q3 2016 Earnings Per Share GAAP Diluted EPS Core Diluted EPS*

8 Performance Trends (cont.) See appendix for a reconciliation of GAAP and non - GAAP measures. $9.86 $10.02 $10.26 $10.51 $10.78 $11.09 $11.60 $8.00 $8.50 $9.00 $9.50 $10.00 $10.50 $11.00 $11.50 $12.00 $12.50 3/31/2015 6/30/2015 9/30/2015 12/31/2015 3/31/2016 6/30/2016 9/30/2016 Tangible Book Value Per Share Consistently building shareholder value

9 Performance Trends (cont.) *Excludes non - operating items. See appendix for a reconciliation of GAAP and non - GAAP measures. 1 ) Peer group includes banks and thrifts between $1.0B and $7.5B in assets located in Northeast and Mid - Atlantic regions. Median reflects the most recent 5 quarters of reported results. Data sourced from SNL Financial. 1.21% 1.20% 1.17% 1.16% 1.13% 1.13% 1.14% 1.29% 1.26% 1.22% 1.03% 1.09% 1.09% 1.14% 0.40% 0.60% 0.80% 1.00% 1.20% 1.40% Q1 2015 Q2 2015 Q3 2015 Q4 2015 Q1 2016 Q2 2016 Q3 2016 Return on Average Tangible Assets Core Return* "GAAP" Return Peer Median 1)

10 Performance Trends (cont.) *Excludes non - operating items. See appendix for a reconciliation of GAAP and non - GAAP measures. 1 ) Peer group includes banks and thrifts between $1.0B and $7.5B in assets located in Northeast and Mid - Atlantic regions. Median reflects the most recent 5 quarters of reported results. Data sourced from SNL Financial. 14.56% 14.11% 13.99% 12.07% 13.03% 13.23% 13.77% 13.69% 13.43% 13.47% 13.58% 13.53% 13.77% 13.84% 8.00% 9.00% 10.00% 11.00% 12.00% 13.00% 14.00% 15.00% 16.00% Q1 2015 Q2 2015 Q3 2015 Q4 2015 Q1 2016 Q2 2016 Q3 2016 Return on Average Tangible Common Equity Core Return* "GAAP" Return Peer Median 1)

11 Performance Trends (cont.) *Excludes non - operating items. See appendix for a reconciliation of GAAP and non - GAAP measures. 1 ) Peer group includes banks and thrifts between $1.0B and $7.5B in assets located in Northeast and Mid - Atlantic regions. Median reflects the most recent 5 quarters of reported results. Data sourced from SNL Financial. 41.8% 41.8% 41.5% 41.6% 43.5% 42.2% 41.7% 25.0% 35.0% 45.0% 55.0% 65.0% 75.0% 85.0% 95.0% Q1 2015 Q2 2015 Q3 2015 Q4 2015 Q1 2016 Q2 2016 Q3 2016 Operating Efficiency Ratio* Peer Median 1) CAGR in operating expenses of 13% reflects continued investments in technology and infrastructure to support our growth

12 Capital Strength 8.39% 8.49% 9.25% 9.38% 11.69% 9.59% 9.57% 10.58% 10.58% 11.57% 0.00% 2.00% 4.00% 6.00% 8.00% 10.00% 12.00% 14.00% TCE Ratio Leverage Ratio CET 1 Ratio Tier 1 Ratio Risk-based Capital Ratio At September 30, 2016 Bancorp Bank Well Capitalized

13 Loan Portfolio Diversification As of 9/30/16 - $ 3.5 Billion Type Balance Percentage Type Balance Percentage CRE- Retail 324$ 9% OOC – Retail 77$ 2% CRE – Office 146 4% OOC - Warehouse / Industrial 63 2% CRE - Warehouse / Industrial 113 3% OOC – Office 57 2% CRE - Other / Misc 95 3% OOC - Office / Warehouse or Mixed Use 44 1% CRE - Mixed Use 86 2% OOC - Other 22 1% CRE - Land Loan for Future Development 78 2% Total CRE- Owner Occupied 263 8% CRE - Land Loan (Land Only - No Construction) 35 1% Total CRE - Non-Owner Occupied 877 24% C&I – Service 201 6% C&I – Transportation 119 3% Construction - 1 to 4 Family (For Sale / Rental) 150 4% Commercial – Schools 111 3% Construction - 64 to 99 Units 94 3% C&I - Residential 1 to 4 Family 73 2% Construction - 10 to 24 Units 54 2% C&I – Others 67 2% Construction - 25 to 64 Units 50 1% C&I - Contractors 62 2% Construction – Retail 44 1% C&I - Distribution 7 <1% Construction - 100 or More Units 38 1% C&I - Manufacturing 4 <1% Construction - 5 to 9 Units 24 1% Total C&I 644 18% Construction - 1 to 4 Family (Personal Use) 10 <1% Total Business Loans $ 907 26% Construction - Office 5 <1% Construction - Mixed Use 2 <1% Total Construction 471 13% Total CRE - Other $ 1,348 37% Multifamily - 25 to 64 units 315$ 9% Residential - 1st Lien 177$ 5% Multifamily - 10 to 24 unit 297 9% Home Equity - 2nd Lien (LOC) 49 2% Multifamily - 100 units or more 149 4% Home Equity - 1st Lien (Fixed) 3 <1% Multifamily - 64 units to 99 units 114 3% Home Equity - 2nd Lien (Fixed) 3 <1% Multifamily - 5 units to 9 units 86 2% Consumer - Personal (Unsecured) 1 <1% Total Multifamily $ 961 27% Total Residential & Consumer $ 233 7% Other CRE 38% Multifamily 28% Business Loans 27% Residential/ Consumer 7%
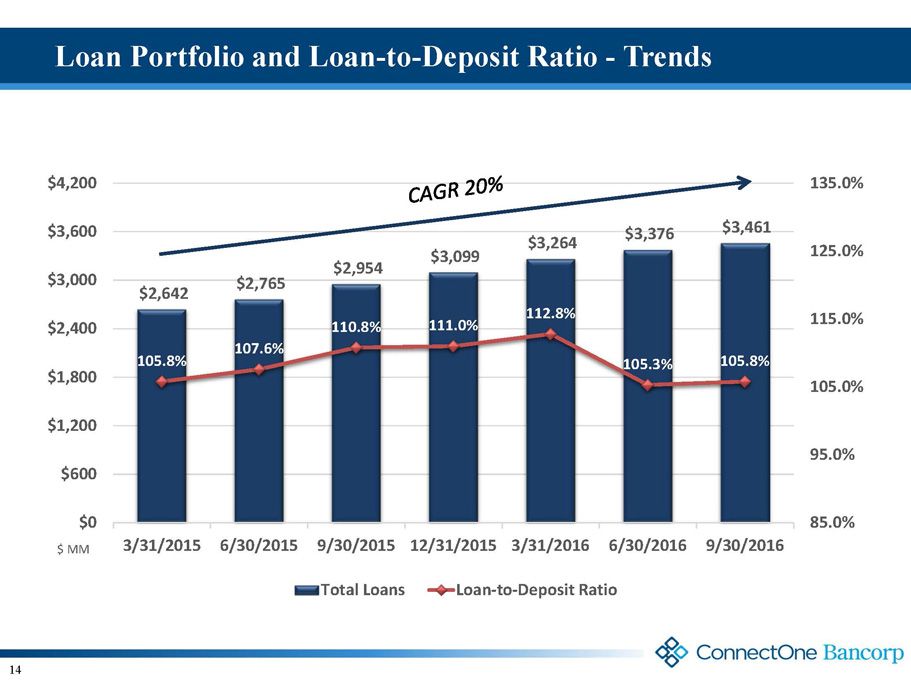
14 Loan Portfolio and Loan - to - Deposit Ratio - Trends $2,642 $2,765 $2,954 $3,099 $3,264 $3,376 $3,461 105.8% 107.6% 110.8% 111.0% 112.8% 105.3% 105.8% 85.0% 95.0% 105.0% 115.0% 125.0% 135.0% $0 $600 $1,200 $1,800 $2,400 $3,000 $3,600 $4,200 3/31/2015 6/30/2015 9/30/2015 12/31/2015 3/31/2016 6/30/2016 9/30/2016 Total Loans Loan-to-Deposit Ratio $ MM

15 Loan Funding Metrics $237 $279 $238 $229 $91 $114 $126 $141 $146 $165 $112 $88 4.02% 4.00% 4.17% 4.28% 2.50% 2.75% 3.00% 3.25% 3.50% 3.75% 4.00% 4.25% 4.50% $- $50 $100 $150 $200 $250 $300 $350 $400 $450 Q4 2015 Q1 2016 Q2 2016 Q3 2016 Gross Loan Fundings Loans Paid-off Net Growth Average Funding Rate $ MM

16 Commitment to Solid Credit Quality □ Comprehensive underwriting standards and processes Disciplined LTV and DSC standards Loan origination process supported by specialized teams of credit analysts □ We stick to what we do best High quality direct commercial lending No reliance on participations or wholesale loan purchases Stay away from riskier lending, e.g., indirect auto, 2nd lien positions, leasing, SBA lending or anything “sub - prime ” □ Lending within geographic footprint NYC Metro region economically strong and diverse □ Multi - faceted stress testing Every loan tested during underwriting process Quarterly modeling performed in conjunction with ALCO and ERM processes Annual third - party testing conducted on more than 2/ 3 rd ’s of the portfolio □ Continued focus on loan monitoring and collection by a team of portfolio managers and loan workout specialists
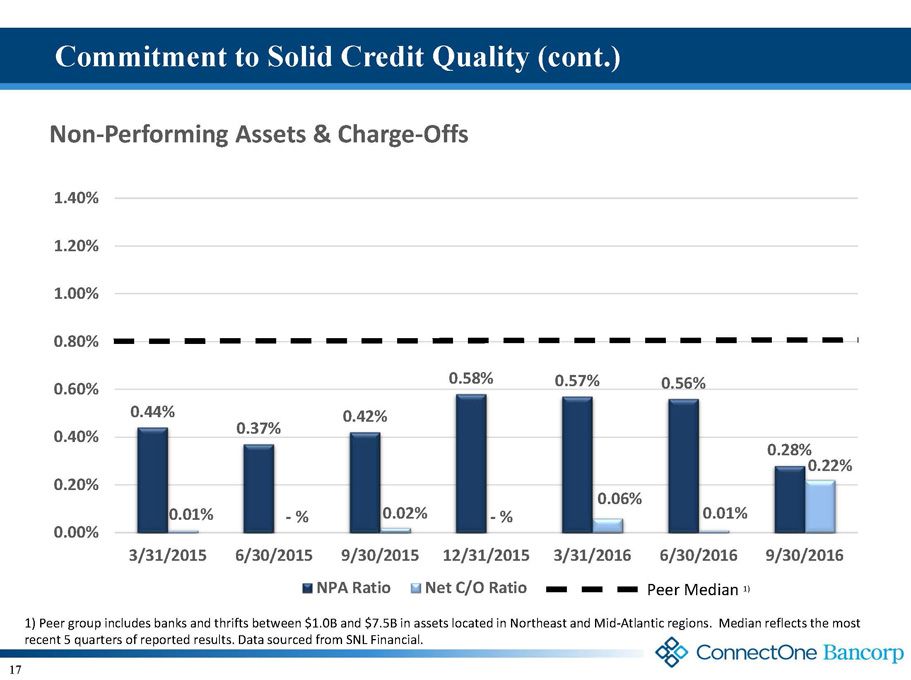
17 Commitment to Solid Credit Quality (cont.) 1 ) Peer group includes banks and thrifts between $1.0B and $7.5B in assets located in Northeast and Mid - Atlantic regions. Median reflects the most recent 5 quarters of reported results. Data sourced from SNL Financial. 0.44% 0.37% 0.42% 0.58% 0.57% 0.56% 0.28% 0.01% - % 0.02% - % 0.06% 0.01% 0.22% 0.00% 0.20% 0.40% 0.60% 0.80% 1.00% 1.20% 1.40% 3/31/2015 6/30/2015 9/30/2015 12/31/2015 3/31/2016 6/30/2016 9/30/2016 Non - Performing Assets & Charge - Offs NPA Ratio Net C/O Ratio Peer Median 1)

18 CRE Concentrations - Positive Trends □ ConnectOne has maintained high levels of CRE concentration for an extended period of time □ Our combination of strong organic growth and sound asset quality is our hallmark □ We continue to focus on loan diversification □ Our policies and procedures have stood up to regulatory scrutiny □ ConnectOne and Legacy ConnectOne regulated by the FDIC and NJ DOBI over the last 11+ years Loans By Call Code; ratios prior to 2014 represent Legacy ConnectOne Bank (1) Proforma reflects merger of ConnectOne and Union Center, which was consummated on 7/1/14 (2) Reflects 15% annualized growth rate from 9/30/2016. 473% 533% 423% 436% 405% 400% 68% 86% 75% 81% 110% 133% 0% 100% 200% 300% 400% 500% 600% 700% 2011 2012 2013 2014 2015 Q3 2016 CRE as a Percentage of Total Risk Based Capital CRE Construction 290% 74% 101% 0% 100% 200% 300% 400% 9/30/2016 Projected 9/30/17 Trailing 36 Month Growth Rate Actual Proforma 1) 2 ) (includes merger) (excludes merger)
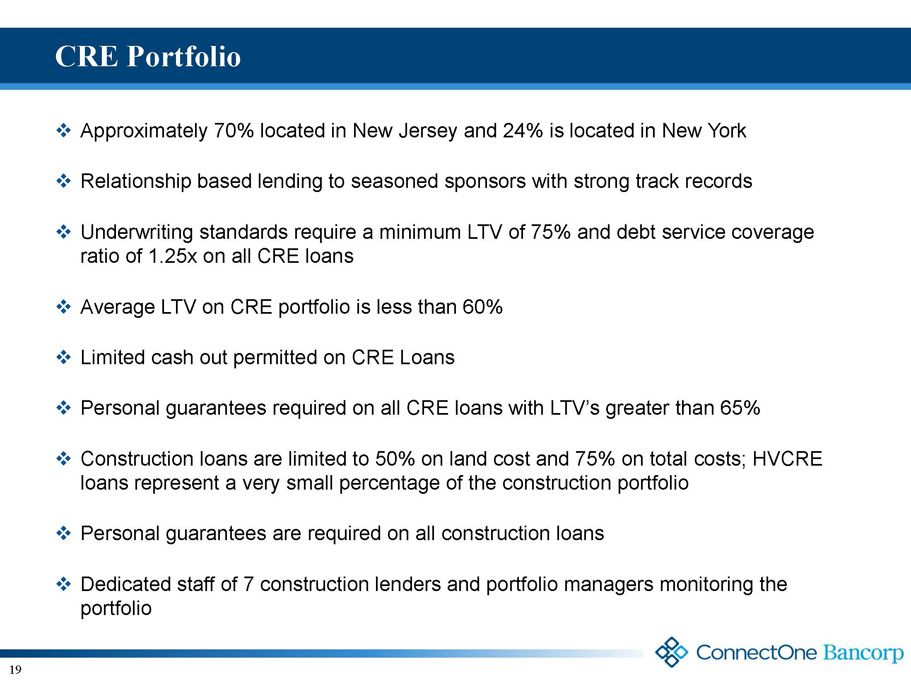
19 CRE Portfolio □ Approximately 70% located in New Jersey and 24% is located in New York □ Relationship based lending to seasoned sponsors with strong track records □ Underwriting standards require a minimum LTV of 75% and debt service coverage ratio of 1.25x on all CRE loans □ Average LTV on CRE portfolio is less than 60% □ Limited cash out permitted on CRE Loans □ Personal guarantees required on all CRE loans with LTV’s greater than 65% □ Construction loans are limited to 50% on land cost and 75% on total costs; HVCRE loans represent a very small percentage of the construction portfolio □ Personal guarantees are required on all construction loans □ Dedicated staff of 7 construction lenders and portfolio managers monitoring the portfolio

20 Multifamily Portfolio □ Total portfolio $961 million; approximately 90% located in Northern New Jersey □ Portfolio average loan size $1.9mm; approximate duration 3 years; yield ~3.70% □ Targeted concentration: 25% to 35% of the total loan portfolio □ We have been originating multifamily loans since the inception of the bank □ We focus on relationship lending to seasoned operators with strong track records and on properties located in rent - controlled districts. Shy away from “one - off” transactions □ Underwriting criteria includes maximum 75% LTV and a 1.25x DSCR based on our estimates of operating performance □ Our team originates loans directly. We meet the borrowers, visit our properties and loans are subject to our strict underwriting criteria □ Our portfolio does not contain any loans purchased in the open market

21 C&I Lending □ Objective is to increase non - CRE lending and increase relationship deposits □ C&I teams are targeting both small and middle - market businesses, including manufacturing, service - related and distributors □ Business sizes range from $2 million to $100 million in average annual revenues. Credit extended approximately ranges from $1 million to $20 million □ Provide various solutions including, but not limited to, working capital, equipment finance, and asset - based lending □ A leading provider of banking services to Independent Schools in New Jersey □ Focused effort on growing NYC market share which is now supported by our NYC office located in Midtown Manhattan

22 Taxi Medallion Portfolio □ Exposure, net of reserves, totaled $ 90.2 million at September 30 , 2016; 2.61% of total loans and 22.4% of Bank’s Tier 1 capital □ Only NYC - Manhattan medallions; no exposure to non - NYC medallions □ Exclusively first lien direct obligations of medallion owners □ Low level of delinquencies reflecting 95% of portfolio in corporate medallions □ No additional lending in this sector dating back to 2014 □ $95.2 million of performing TDR’s □ $3.7 million on nonaccrual □ $12.5 million specific reserve is reflective of an estimated valuation of $700k per corporate medallion based on a weighted combination from a cashflow model and recent market transfer values as reflected by the New York City Taxi and Limousine Commission □ Given this portfolio represents a small portion of total loans, even in a highly stressed case the bank remains well - capitalized and we believe can continue to pursue our strategic plans and goals

23 Total Deposit Composition Wholesale 18% Interest Transaction 60% CDs 15% Noninterest Demand 25% Franchise Deposits 82% As of 09/30/16 - $3.3 Billion Note: Wholesale deposits include brokered deposits, excluding reciprocal, and listing services.

24 Noninterest - bearing Deposit Trends $482 $510 $560 $608 $609 $582 $640 $480 $558 $587 $651 $615 $649 $656 $250 $350 $450 $550 $650 $750 3/31/2015 6/30/2015 9/30/2015 12/31/2015 3/31/2016 6/30/2016 9/30/2016 Average Quarterly Balance As of Balance

25 Stock Price Performance □ CRE Concentrations Proven track records as a longstanding strong CRE focused bank □ Taxi Medallions Reserves building, industry stabilizing, proactive internal approach □ Deposit Growth and Loan - to - Deposit ratio Strong 3Q 2016 d eposit growth, LTD ratio stable □ Liquidity Strong breadth and depth of on/off balance sheet liquidity - Over $1 billion in total available Recent Headwinds CNOB KBW Bank Index Since IPO* 96.4% 48.4% Since September 1, 2015 13.1% 19.0% Price Performance as of November 11, 2016 *CNOB price of $28 at IPO adjusted to $10.77; represents 2.6x shares exchange in the Union Center Merger

26 Liquidity Management □ We focus on core deposit growth, particularly noninterest - bearing demand Recent strategic initiatives have proven successful towards both growing upon existing relationships and attracting new clients □ ConnectOne has historically managed a loan - to - deposit ratio over 100%. Our loan to deposit ratio was ~105% at quarter - end □ We utilize attractively priced wholesale funding along the curve to manage interest rate risk □ We are continuously aiming to build on the breadth and depth of our sources of funds including commercial customers, our retail branch network, public funds, the FHLB, brokered and listing services □ Our philosophy balances liquidity, interest rate risk and core deposits to support growth, enhance returns and maximize franchise value
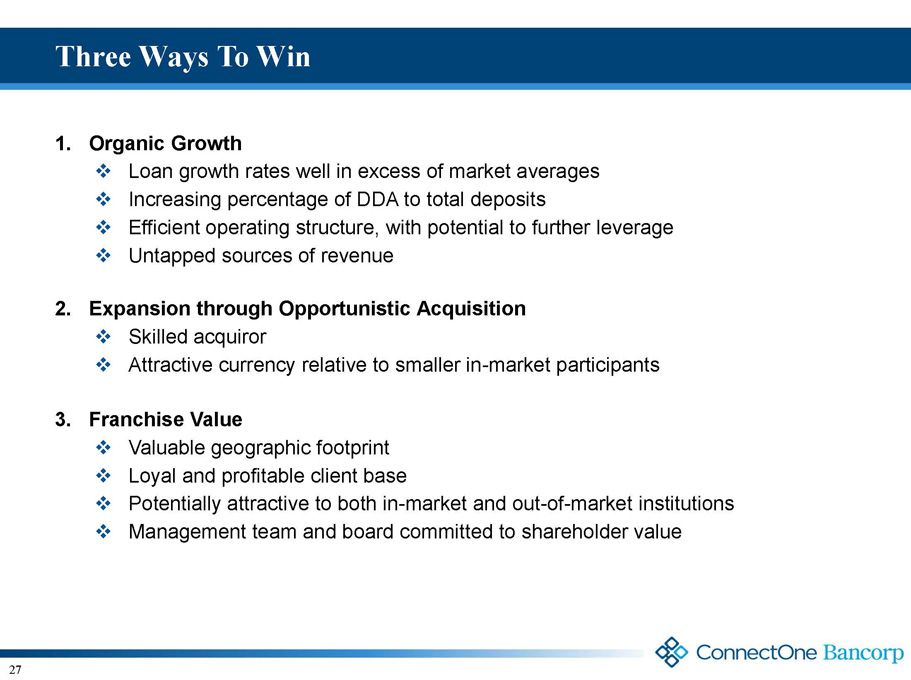
27 Three Ways To Win 1. Organic Growth □ Loan growth rates well in excess of market averages □ Increasing percentage of DDA to total deposits □ Efficient operating structure, with potential to further leverage □ Untapped sources of revenue 2. Expansion through Opportunistic Acquisition □ Skilled acquiror □ Attractive currency relative to smaller in - market participants 3. Franchise Value □ Valuable geographic footprint □ Loyal and profitable client base □ Potentially attractive to both in - market and out - of - market institutions □ Management team and b oard committed to shareholder value
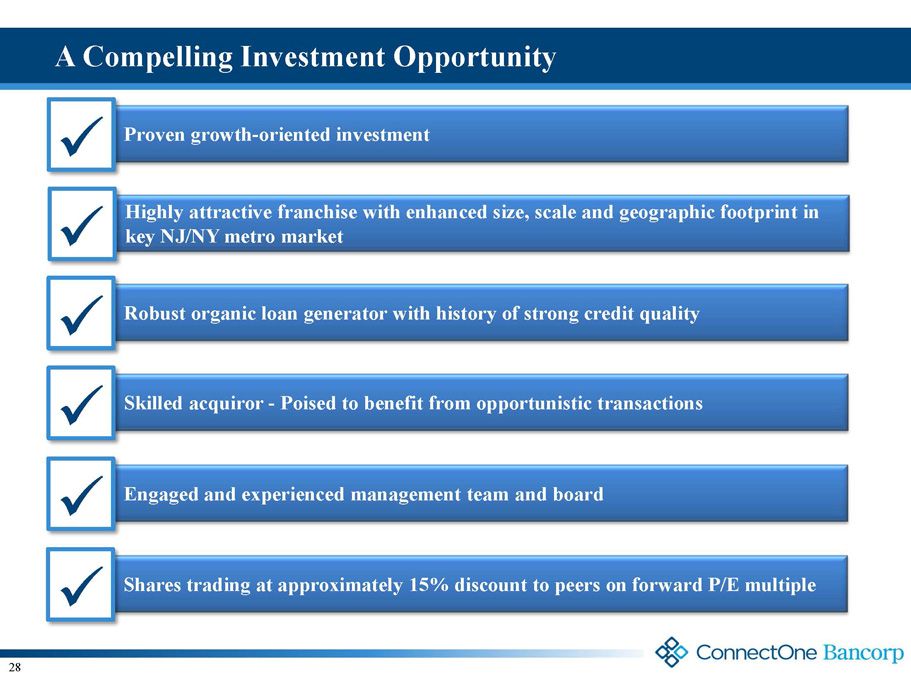
Proven growth - oriented investment Highly attractive franchise with enhanced size, scale and geographic footprint in key NJ/NY metro market Robust organic loan generator with history of strong credit quality Skilled acquiror - Poised to benefit from opportunistic transactions Engaged and experienced management team and board S hares trading at approximately 15% discount to peers on forward P/E multiple x x x x x x A Compelling Investment Opportunity 28
29

APPENDIX 30

31 Appendix Reconciliation of GAAP and non - GAAP measures Sept. 30, June 30, Mar. 31, Dec. 31, Sept. 30, (dollars in thousands, except share data) 2016 2016 2016 2015 2015 Net income (GAAP) 11,856 10,859 10,391 9,568 10,842 Less: preferred dividends - - 22 28 28 Net income available to common stockholders (GAAP) 11,856 10,859 10,369 9,540 10,814 Reconciliation of GAAP Earnings to Operating Earnings Net gains on sales of securities (4,131)$ (103)$ -$ (1,138)$ (2,067)$ Partial settlements of pension obligation 69 87 103 106 168 Insurance recovery - - - - - Merger-related expenses - - - - - Loss on debt extinguishment - - - - - Amortization of intangible assets 193 217 217 217 217 Provision related to maturity and extension of acquired portfolio loans 220 229 397 512 590 Provision related to taxi cab medallion loans 5,000 1,750 1,487 2,500 2,000 Provision for pending disposition of Union Center operations bldg. - - - 1,304 - Charge due to wire fraud - - - - - Accretion of purchase accounting fair value marks (1,077) (1,277) (1,367) (1,416) (1,340) Non-core items 274 903 837 2,085 (432) Income tax (expense) benefit 99 326 301 751 (156) Non-core items, after taxes (36%) 175 577 536 1,334 (276) Core earnings available to common stockholders (non-GAAP) 12,031$ 11,436$ 10,905$ 10,874$ 10,538$ Weighted average diluted shares outstanding 30,401,684 30,340,376 30,257,676 30,310,905 30,335,571 Diluted EPS (GAAP) 0.39$ 0.36$ 0.34$ 0.31$ 0.36$ Core Diluted EPS (Non-GAAP) (1) 0.40 0.38 0.36 0.36 0.35 Three Months Ended

32 Appendix Reconciliation of GAAP and non - GAAP measures (cont.) Sept. 30, June 30, Mar. 31, Dec. 31, Sept. 30, (dollars in thousands, except share data) 2016 2016 2016 2015 2015 Return on Assets Measures Core earnings available to common stockholders (non-GAAP) 12,031$ 11,436$ 10,905$ 10,874$ 10,538$ Add: preferred dividends - - 22 28 28 Core net income (non-GAAP) 12,031$ 11,436$ 10,927$ 10,902$ 10,566$ Average assets 4,344,795$ 4,212,307$ 4,034,375$ 3,891,885$ 3,729,503$ Less: average intangible assets (149,317) (149,525) (149,741) (149,959) (150,178) Average tangible assets 4,195,478$ 4,062,782$ 3,884,634$ 3,741,926$ 3,579,325$ Return on avg. assets (GAAP) 1.09% 1.04% 1.04% 0.98% 1.15% Core return on avg. assets (Non-GAAP) (2) 1.10% 1.09% 1.09% 1.11% 1.12% Return on avg. tangible assets (Non-GAAP) (3) 1.14% 1.09% 1.09% 1.03% 1.22% Core return on avg. tangible assets (Non-GAAP) (4) 1.14% 1.13% 1.13% 1.16% 1.17% Return on Equity Measures Core earnings available to common stockholders 12,031$ 11,436$ 10,905$ 10,874$ 10,538$ Average common equity 495,141$ 483,519$ 473,849$ 467,669$ 460,432$ Less: average intangible assets (149,317) (149,525) (149,741) (149,959) (150,178) Average tangible common equity 345,824$ 333,994$ 324,108$ 317,710$ 310,254$ Return on avg. common equity (GAAP) 9.53% 9.03% 8.80% 8.09% 9.32% Core return on avg. common equity (non-GAAP) (5) 9.67% 9.51% 9.26% 9.23% 9.08% Return on avg. tangible common equity (non-GAAP) (6) 13.77% 13.23% 13.03% 12.07% 13.99% Core return on avg. tangible common equity (non-GAAP) (7) 13.84% 13.77% 13.53% 13.58% 13.47% Three Months Ended

33 Appendix Reconciliation of GAAP and non - GAAP measures (cont.) Sept. 30, June 30, Mar. 31, Dec. 31, Sept. 30, (dollars in thousands, except share data) 2016 2016 2016 2015 2015 Efficiency Measures Total noninterest expenses 14,551$ 14,352$ 14,353$ 13,579$ 13,301$ Partial settlements of pension obligation (69) (87) (103) (106) (168) Foreclosed property expense (37) 10 (167) (387) (121) Amortization of intangible assets and fair value marks (193) (217) (217) (217) (217) Operating noninterest expense 14,252$ 14,058$ 13,866$ 12,869$ 12,795$ Net interest income (FTE) 33,762$ 33,112$ 31,985$ 31,102$ 30,382$ Impact of purchase accounting fair value marks (1,045) (1,245) (1,335) (1,384) (1,314) Noninterest income 5,576 1,570 1,202 2,363 3,819 Net gains on sales of securities (4,131) (103) - (1,138) (2,067) Operating revenue 34,162$ 33,334$ 31,852$ 30,943$ 30,820$ Operating efficiency ratio (non-GAAP) (8) 41.7% 42.2% 43.5% 41.6% 41.5% Net Interest Margin Average interest-earning assets 4,041,020$ 3,912,802$ 3,728,958$ 3,582,408$ 3,441,151$ Net interest income (FTE) 33,762$ 33,112$ 31,985$ 31,102$ 30,382$ Impact of purchase accounting fair value marks (1,045) (1,245) (1,335) (1,384) (1,314) Adjusted net interest income 32,717$ 31,867$ 30,650$ 29,718$ 29,068$ Net interest margin (GAAP) 3.32% 3.40% 3.45% 3.44% 3.50% Adjusted net interest margin (non-GAAP) (9) 3.22% 3.28% 3.31% 3.29% 3.35% Three Months Ended
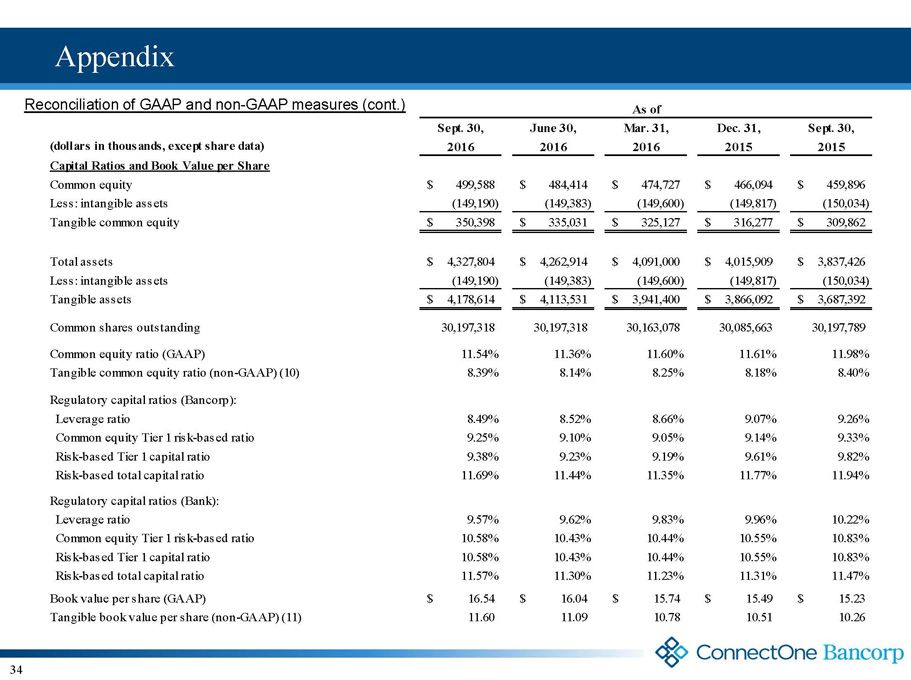
34 Appendix Reconciliation of GAAP and non - GAAP measures (cont.) Sept. 30, June 30, Mar. 31, Dec. 31, Sept. 30, (dollars in thousands, except share data) 2016 2016 2016 2015 2015 Capital Ratios and Book Value per Share Common equity 499,588$ 484,414$ 474,727$ 466,094$ 459,896$ Less: intangible assets (149,190) (149,383) (149,600) (149,817) (150,034) Tangible common equity 350,398$ 335,031$ 325,127$ 316,277$ 309,862$ Total assets 4,327,804$ 4,262,914$ 4,091,000$ 4,015,909$ 3,837,426$ Less: intangible assets (149,190) (149,383) (149,600) (149,817) (150,034) Tangible assets 4,178,614$ 4,113,531$ 3,941,400$ 3,866,092$ 3,687,392$ Common shares outstanding 30,197,318 30,197,318 30,163,078 30,085,663 30,197,789 Common equity ratio (GAAP) 11.54% 11.36% 11.60% 11.61% 11.98% Tangible common equity ratio (non-GAAP) (10) 8.39% 8.14% 8.25% 8.18% 8.40% Regulatory capital ratios (Bancorp): Leverage ratio 8.49% 8.52% 8.66% 9.07% 9.26% Common equity Tier 1 risk-based ratio 9.25% 9.10% 9.05% 9.14% 9.33% Risk-based Tier 1 capital ratio 9.38% 9.23% 9.19% 9.61% 9.82% Risk-based total capital ratio 11.69% 11.44% 11.35% 11.77% 11.94% Regulatory capital ratios (Bank): Leverage ratio 9.57% 9.62% 9.83% 9.96% 10.22% Common equity Tier 1 risk-based ratio 10.58% 10.43% 10.44% 10.55% 10.83% Risk-based Tier 1 capital ratio 10.58% 10.43% 10.44% 10.55% 10.83% Risk-based total capital ratio 11.57% 11.30% 11.23% 11.31% 11.47% Book value per share (GAAP) 16.54$ 16.04$ 15.74$ 15.49$ 15.23$ Tangible book value per share (non-GAAP) (11) 11.60 11.09 10.78 10.51 10.26 As of

35 Appendix Reconciliation of GAAP and non - GAAP measures (cont.) Sept. 30, June 30, Mar. 31, Dec. 31, Sept. 30, (dollars in thousands, except share data) 2016 2016 2016 2015 2015 NCO Detail Net loan charge-offs: Charge-offs 1,910$ 77$ 512$ 18$ 519$ Recoveries (12) (16) (15) (2) (342) Net loan charge-offs 1,898$ 61$ 497$ 16$ 177$ as a % of average total loans (annualized) 0.22% 0.01% 0.06% 0.00% 0.02% Asset Quality Nonaccrual loans 11,493$ 21,911$ 21,450$ 20,737$ 12,888$ Other real estate owned 626 2,029 1,696 2,549 3,244 Total nonperforming assets 12,119$ 23,940$ 23,146$ 23,286$ 16,132$ Performing troubled debt restructurings 105,338$ 97,831$ 95,122$ 85,925$ 77,882$ Loans past due 90 days and still accruing (non-PCI) -$ -$ -$ -$ 268$ Nonaccrual loans as a % of loans receivable 0.33% 0.65% 0.66% 0.67% 0.44% Nonperforming assets as a % of total assets 0.28% 0.56% 0.57% 0.58% 0.42% Allowance for loan losses as a % of nonaccrual loans 327.3% 149.5% 135.5% 128.1% 167.1% Loans receivable 3,445,476$ 3,375,620$ 3,263,813$ 3,099,007$ 2,953,381$ Acquired loans (736,894) (799,851) (825,047) (866,878) (923,210) Loans receivable, excluding acquired loans 2,708,582$ 2,575,769$ 2,438,766$ 2,232,129$ 2,030,171$ Allowance for loan losses 37,615$ 32,763$ 29,074$ 26,572$ 21,533$ Accretable credit risk discount on acquired loans 10,408 11,198 12,101 12,955 13,893 Total allowance for loan losses and accretable credit risk discount on acquired loans 48,023$ 43,961$ 41,175$ 39,527$ 35,426$ Allowance for loan losses as a % of loans receivable 1.09% 0.97% 0.89% 0.86% 0.73% Allowance for loan losses as a % of loans receivable, excluding acquired loans 1.39% 1.27% 1.19% 1.19% 1.06% Allowance for loan losses and accretable credit risk discount on loans as a % of loans receivable 1.39% 1.30% 1.26% 1.28% 1.20% Three Months Ended
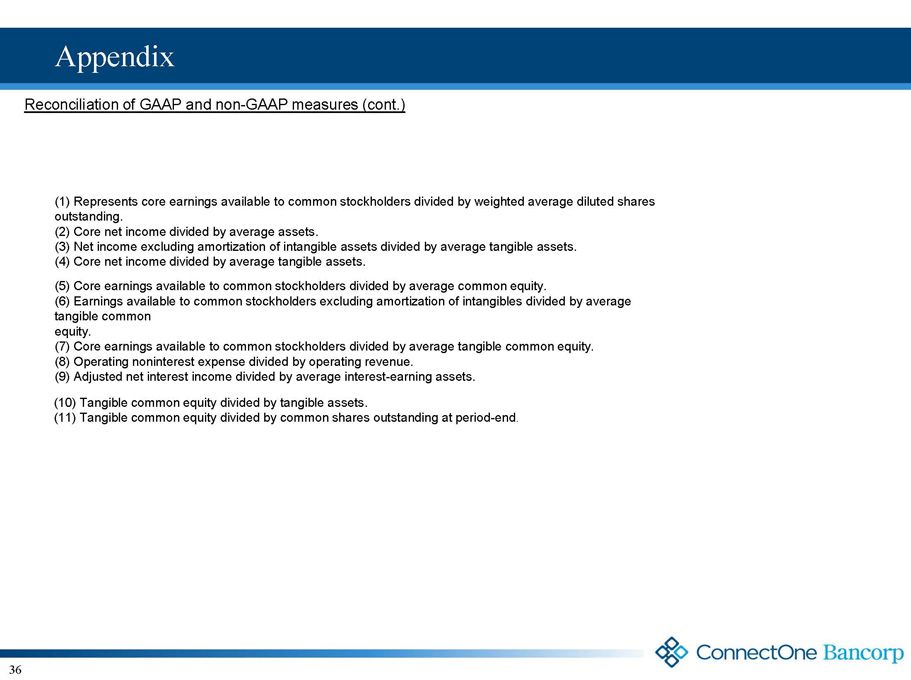
36 Appendix Reconciliation of GAAP and non - GAAP measures (cont.) (1) Represents core earnings available to common stockholders divided by weighted average diluted shares outstanding. (2) Core net income divided by average assets. (3) Net income excluding amortization of intangible assets divided by average tangible assets. (4) Core net income divided by average tangible assets. (5) Core earnings available to common stockholders divided by average common equity. (6) Earnings available to common stockholders excluding amortization of intangibles divided by average tangible common equity. (7) Core earnings available to common stockholders divided by average tangible common equity. (8) Operating noninterest expense divided by operating revenue. (9) Adjusted net interest income divided by average interest - earning assets. (10) Tangible common equity divided by tangible assets. (11) Tangible common equity divided by common shares outstanding at period - end .