Attached files
| file | filename |
|---|---|
| 8-K - FORM 8-K - XCel Brands, Inc. | v452927_8-k.htm |
Exhibit 99.1

Investor Presentation November 2016 I LOVE XCEL BRANDS (NASDAQ:XELB)
Safe Harbor Statement 2 Certain statements in this presentation, as well as certain oral statements made by management during the presentation, constitute “forward - looking statements” within the meaning of the United States Private Securities Litigation Reform Act of 1995 . These statements include, without limitation, statements expressed or implied regarding our plans and milestones, plans to fund our current activities, statements concerning our strategic relationships and activities, strategy, future operations and expansion, future financial position, future sales and revenues, projected costs, and market penetration . In some cases, forward - looking statements can be identified by terminology such as “may, “will”, “should”, “expects”, “seeks”, “plans”, “anticipates”, “believes”, “estimates”, “predicts”, “potential”, “projects”, “continue”, “intends”, “could”, “opportunity”, or negative of such terms or other comparable terminology . These statements are based on our current expectations and assumptions and are not guarantees of future performance . You should not place undue reliance on our forward - looking statements, which are subject to a multitude of known and unknown risks and uncertainties that could cause actual results, future circumstance or events to differ materially from those stated in or implied by the forward - looking statements . These risks and uncertainties include, but are not limited to, the ability of our licensees to produce, market and sell quality products bearing our brand names, continued market acceptance of our brands and any future brands we acquire, our ability to service our significant debt obligations, our ability to raise capital for any future acquisitions, concentration of a substantial portion of our licensing revenue from a limited number licensees, our dependence on QVC, restrictions in our agreements with QVC and other licensees on our ability to sell products with certain retailers, our dependence on promotional services of our spokesperson, limitations on our ownership of the H Halston brands, impacts on our H Halston brands resulting from the operations of the related Halston brands by their owner, our ability to manage expected future growth, our ability to identify and acquire additional trademarks, competition for licensees, competition in our licensee’s markets, our ability to protect our intellectual property, our dependence on our CEO and other key executive officers, the success of our e - commerce strategy and other risks and uncertainties detailed from time to time in our public disclosure documents or other filings with the Securities and Exchange Commission . Additional risks and uncertainties relating to us and our business can be found in the “Risk Factors” section of our latest annual report on Form 10 - K as well as in our other public filings . The forward - looking statements are made as of the date hereof, and we disclaim any intention and have no obligation or responsibility, except as required by law, to update or revise any forward - looking statements, whether as a result of new information, future events or otherwise .

Agenda 3 » INDUSTRY UPDATE » COMPANY OVERVIEW Working Capital Light, Owned Dynamic Brands, Virtual Vertical, Highly Scalable, Strong Growth » OUR BRANDS Dynamic Brands, Ubiquitous - Channel Distribution » HISTORICAL PERFORMANCE Consistent Growth of Revenues and Earnings, Strong Balance Sheet » FUTURE GROWTH OPPORTUNITIES Organic and Acquisitions
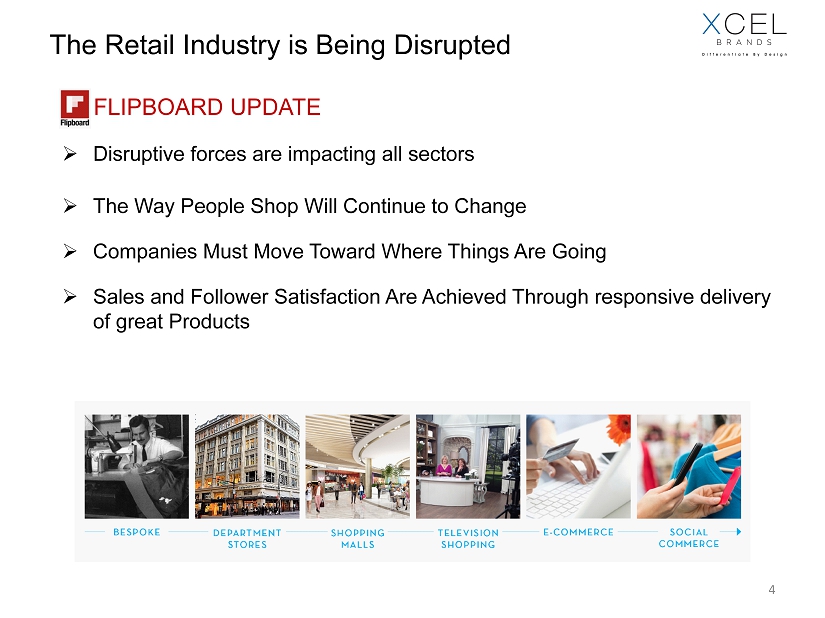
FLIPBOARD UPDATE » Disruptive forces are impacting all sectors » The Way People Shop Will Continue to Change » Companies Must Move Toward Where Things Are Going » Sales and Follower Satisfaction Are Achieved Through responsive delivery of great Products The Retail Industry is Being Disrupted 4

Disruptive Forces Effecting our Industry 5 The way customers shop is rapidly changing, primarily caused by the following five disruptive forces:

Xcel Brands - Innovation for the Retail Industry 6 Xce l Brands Inc . (NASDAQ : XELB) is a media and brand management platform company that owns , li c en s e s, de sign s, manages production of products, generates media content an d m arket s a portfolio of dynami c consume r brands that engage our customers and followers

Mission, Vision & Core Values 7 THE MISSION To design and produce the best products for our followers and partners THE VISION To re - imagine shopping, entertainment and social as one CORE VALUES Be open and honest Listen to our followers Collaborate fairly to win Grow through the two - second advantage Foster the team

Strategy 8 Xcel’s strategy is to monetize the convergence of shopping , entertainment and social We accomplish this through four key tactics : » We own and license dynamic brands featuring designers and creative directors who have significant media presence » We develop captivating media content and engage in conversations with customers » We design products through a quick - time response (QTR) (short lead production) model that reacts to both qualitative and quantitative customer feedback. We act as a virtual vertical for our retail partners without taking inventory risk. » We collaborate with media companies QVC, and The Shopping Channel, collectively reaching 350 million households, 100 million social media followers.

Highly Differentiated Business Model 9 TRADITIONAL WHOLESALE LICENSED BRANDS TRADITIONAL WHOLESALE OWNED BRANDS FAST - FASHION Inventory Position - Inventory Turnover - Supply Chain Management Responsiveness / Lead Time Long Lead Long Lead Fast Fast Design Distribution Channels Retail, E - Comm Retail, E - Comm Retail, E - Comm Unbiquitous (All) Media Content Print / Social Print/ Social Print / Social Print / Social / TV Organic Growth

Ubiquitous - Channel Distribution 10 Interactive Television Wholesale Specialty » QVC, Inc. (USA) » QVC International (UK, Germany, Italy, France, Japan, China) » The Shopping Channel (Canada) » CJo Shopping (Korea) » Hudson Bay Company » Lord & Taylor » Better Dept Stores » 1800 Flowers » Hewlett Packard » Best Buy » Johnson & Johnson » Revlon (2017) » Bed Bath & Beyond (2017)

Our Brands 11 Interactive Television Wholesale (Brick & Mortar + E - Commerce) Specialty

12

13

14

15

16

17

18

19

20 Specialty JOHNSON & JOHNSON HEWLETT PACKARD KLEENEX BEST BUY 1800 FLOWERS

Best In Class Retail Partners 21 Our brands are distributed through a Ubiquitous - Channel Sales strategy through best - in - class retail partners across Direct - Response Television, Bricks - and - Mortar, and Digital channels including :

$114.0MM $142.0MM $212.0MM $380.0MM Retail Sales and EBITDA Scorecard 22 (1) Adjusted EBITDA is a non - GAAP unaudited term. See Exhibit I for the definition of Adjusted EBITDA and a reconciliation to net in come (loss). $ 1.350B 2011 (pro - forma) 2012 2013 2014 2015 ▪ EST. SALES AT RETAIL $114MM $142MM $212MM $380MM $450MM ▪ Xcel Brands Revenue - $12.7MM $13.4MM $20.7MM $27.7MM ▪ Xcel Brands Adjusted EBITDA (1) - $4.5MM $4.2MM $7.0MM $9.3MM $4.5MM $3.9MM $7.0MM $9.3MM $12.7MM $13.4MM $21.7MM $27.7MM $450.0MM

25.6 10.4 Total Debt (1) Cash & Cash Equiv. Net Debt (3) Leverage (4) Strong Balance Sheet 23 As of September 30 , 2016 , Xcel had $ 15 . 2 MM of cash against $ 29 . 8 MM of Term Debt, which resulted in Net Debt ( 3 ) of $ 14 . 5 MM . (1) Total Debt is based on Senior Term Debt with Bank Hapoalim, Seller Notes and Contingent Obligations. (2) Earn - Outs based upon achieving certain targets as disclosed in the Company’s latest financial filings, payable in cash or stock at the Company’s option. As of September 30, 2016, no earn - out amounts have been earned. (3) Net Debt is calculated as Senior Term Debt and Seller Notes less Cash and Cash Equivalents. (4) Based upon Net Debt divided by Adjusted EBITDA for the trailing 12 months ended September 30, 2016. Earn - Outs (2) $6.6 MM Seller Notes (3) $ 4.1 MM Senior Debt $25.7MM Cash $15.2MM Senior Debt Leverage Ratio 1.5X Net Debt $14.6MM

• Expansion of 1800 Flowers partnership • New deals signed in 2016 for Bed Bath & Beyond and Revlon; Home and other opportunities remain. • Opportunities with specialty retailers in Canada, Mexico, and globally • IMNYC, H Halston, C. Wonder and Highline Collective - 3 brands launched in 450 shop - in - shops (all - doors) at Lord & Taylor and The Bay, • Footwear launched under 2 brands in Fall 2016 • Mens’ to launch Spring 2017 • Handbags, Intimates to launch Spring 2017 • Continued expansion of licenses in ancillary categories • Expansion to Kaufoff planned 2017 • Opportunity to expand existing brands to Dillards and department stores in other countries ( Liverpool , El Corte , and others) • Ability to leverage platform to expand to other retailers under new or acquired brands. Built - In Growth Category Growth Geographic Growth Organic Growth Opportunities 24 • H by Halston – Full Year of performance in 2016 • C. Wonder – Launched Spring 2016 • Additional categories to launch in 2017 including Denim, expansion of Home which launched in 2016, and other opportunities. • Launched brands on QVC in UK , Italy , Germany , France , and Japan in 2014/2015 • Launched Isaac Mizrahi on Cjo in Korea in 2015 • Expected opportunities in China and other countries

$350MM $900MM Current Retail Sales (1) 3-Year Opportunity(2) Sizing the Opportunities 25 Direct - Response Television Growth Drivers : » Organic Growth of Existing Brands - continued growth of C. Wonder and Halston - geographic expansion within QVC and to other networks » New developed brands/JV’s » Acquisitions (1) Projected 2016 gross retail sales across all networks. Figures are preliminary and subject to change. (2) Opportunity is based upon management’s estimates for potential growth over 3 years including assumptions related to organic g row th, developed brands/JV’s and acquisition opportunities. (3) There can be no assurance that these assumptions will be realized or that actual results will not differ materially.

$45MM $600MM Current Retail Sales(1) 3-Year Opportunity(2) Sizing the Opportunities 26 QTR Platform - Department Stores / Traditional Retailers Growth Drivers : » Full - year of existing brands at HBC in 2017 » Continued growth of existing brands - Core businesses (results = market share) - Ancillary categories - Expansion to Kaufoff , other international retailers » New developed brands/JV’s » Acquisitions (1) Projected 2016 gross retail sales at HBC. Figures are preliminary and subject to change. (2) Opportunity is based upon management’s estimates for potential growth over 3 years including assumptions related to organic g row th, developed brands/JV’s, new retailers and acquisition opportunities. (3) There can be no assurance that these assumptions will be realized or that actual results will not differ materially. NEW BUSINESS LAUNCHED MARCH 2016
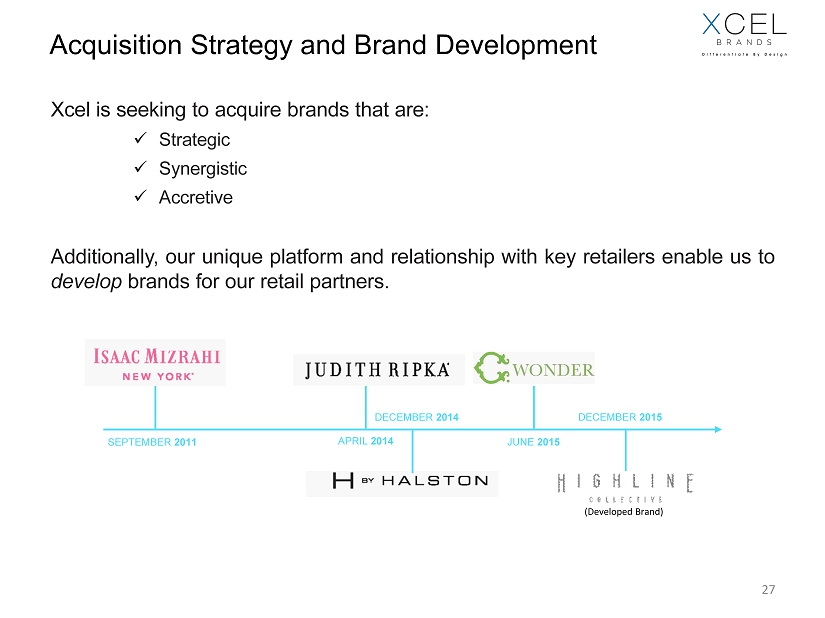
Acquisition Strategy and Brand Development Xcel is seeking to acquire brands that are : x Strategic x Synergistic x Accretive Additionally, our unique platform and relationship with key retailers enable us to develop brands for our retail partners . 27 SEPTEMBER 2011 APRIL 2014 DECEMBER 2014 JUNE 2015 DECEMBER 2015 (Developed Brand)

Summary 28 » Xcel Brands is built to develop innovative solutions to address the changes in our industry. » Xcel’s “Virtual Vertical” business model is working capital light but its design, sourcing, and marketing infrastructure provides a highly scalable platform for strong organic growth. » We own dynamic, iconic brands that engage customers through media and an Ubiquitous - Channel sales strategy. » We have a strong track record of growth in both revenues, EBITDA and net income, and a strong and stable balance sheet. » We are well - positioned to continue to grow through organic growth of our existing brands, and acquisitions and development of new brands in the future.

Exhibit I Reconciliation of Net Income (loss) to Adjusted EBITDA 30 (amounts in thousands) Year Ended Twelve Months 2016 2015 12/31/2015 Ended 09/30/2016 Net (loss) income (17)$ 1,806$ 2,574$ 751$ Depreciation and amortization 1,172 953 1,379 1,598 Interest and finance expense 1,427 1,376 1,804 1,855 Income tax (benefit) expense (3) 35 156 118 State and local franchise taxes 75 83 108 100 Stock-based compensation 3,754 3,413 4,640 4,981 Loss on extinguishment of debt - 1,371 1,371 - Gain on reduction of contingent obligations - (3,000) (3,000) - Non-recurring property exit charges 670 - - 670 Loss from discontinued operations, net - 281 272 (9) Adjusted EBITDA 7,078$ 6,318$ 9,304$ 10,064$ Nine Months Ended September 30, Adjusted EBITDA is a non-GAAP unaudited measure, which we define as net income (loss) before stock-based compensation, interest expense and other financing costs (including gain (loss) on extinguishment of debt), income taxes, other state and local franchise taxes, depreciation and amortization, gain on the reduction of contingent obligations, non-recurring facility exit charges, and net loss from discontinued operations. Management uses Adjusted EBITDA as a measure of operating performance to assist in comparing performance from period to period on a consistent basis and to identify business trends relating to our results of operations. Management believes Adjusted EBITDA is also useful because it provides supplemental information to assist investors in evaluating our financial results. Adjusted EBITDA should not be considered in isolation or as an alternative to net income (loss) or any other measure of financial performance calculated and presented in accordance with GAAP. Given that Adjusted EBITDA is a non-GAAP financial measure and is susceptible to varying calculations, our Adjusted EBITDA may not be comparable to similarly titled measures of other companies, including companies in our industry, because other companies may calculate Adjusted EBITDA in a different manner than we calculate this measure. In evaluating Adjusted EBITDA, you should be aware that in the future we may or may not incur expenses similar to some of the adjustments listed above. Our presentation of Adjusted EBITDA does not imply that our future results will be unaffected by these expenses or any unusual or non-recurring items. When evaluating our performance, you should consider Adjusted EBITDA alongside other financial performance measures, including our net income (loss) and other GAAP results, and not rely on any single financial measure. Exhibit I Reconciliation of Net Income (Loss) to Adjusted EBITDA