Attached files
| file | filename |
|---|---|
| 8-K - FORM 8-K - Clifton Bancorp Inc. | d289733d8k.htm |
Sandler O’Neill & Partners, LP EAST COAST FINANICAL SERVICES CONFERENCE November 16 – 18, 2016 Exhibit 99.1
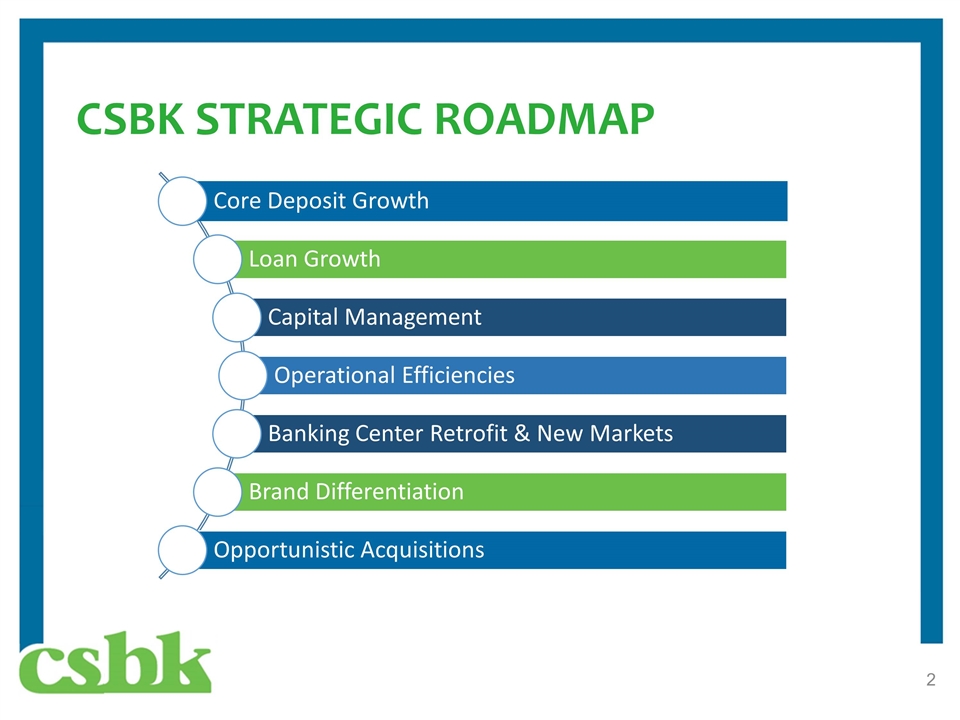
CSBK STRATEGIC ROADMAP Core Deposit Growth Loan Growth Capital Management Operational Efficiencies Banking Center Retrofit & New Markets Brand Differentiation Opportunistic Acquisitions
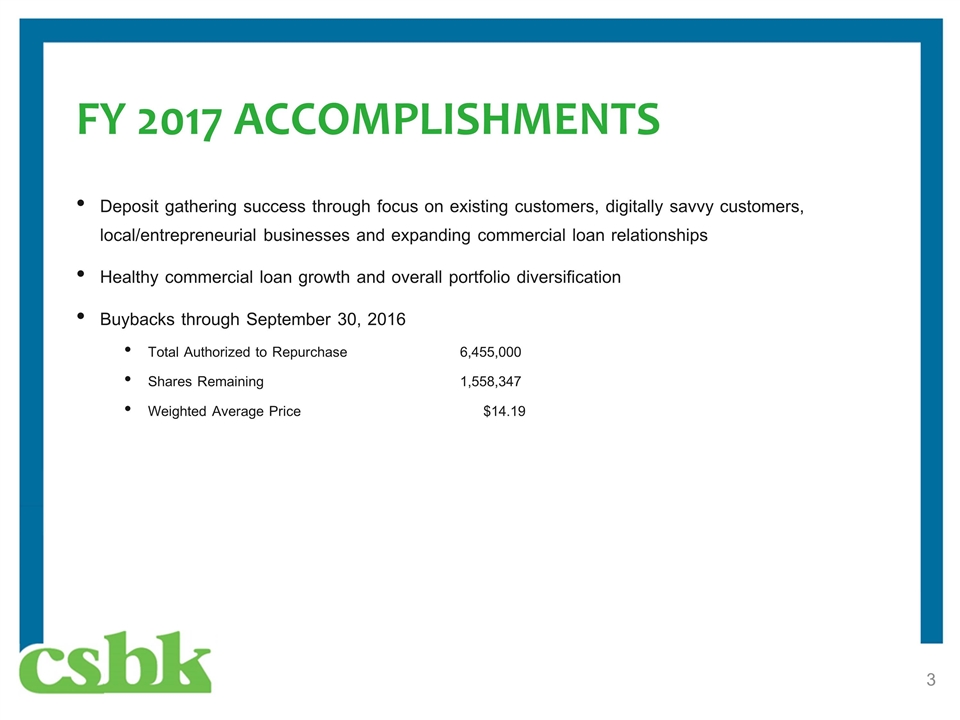
FY 2017 ACCOMPLISHMENTS Deposit gathering success through focus on existing customers, digitally savvy customers, local/entrepreneurial businesses and expanding commercial loan relationships Healthy commercial loan growth and overall portfolio diversification Buybacks through September 30, 2016 Total Authorized to Repurchase6,455,000 Shares Remaining 1,558,347 Weighted Average Price $14.19
FY 2017 ACCOMPLISHMENTS Completion of new concept Banking Center in Montclair, NJ; deposit growth on-track Product launches completed in 2016: Mobile & Digital Banking Platform Business Digital Banking Platform (Multi-user interface, Personal Financial Software integration, Mobile application) Cash Management Tools (ACH/Wires, Remote Deposit Scanner) Municipal Deposit Program Additional enhancements surrounding mobile and online channel in development
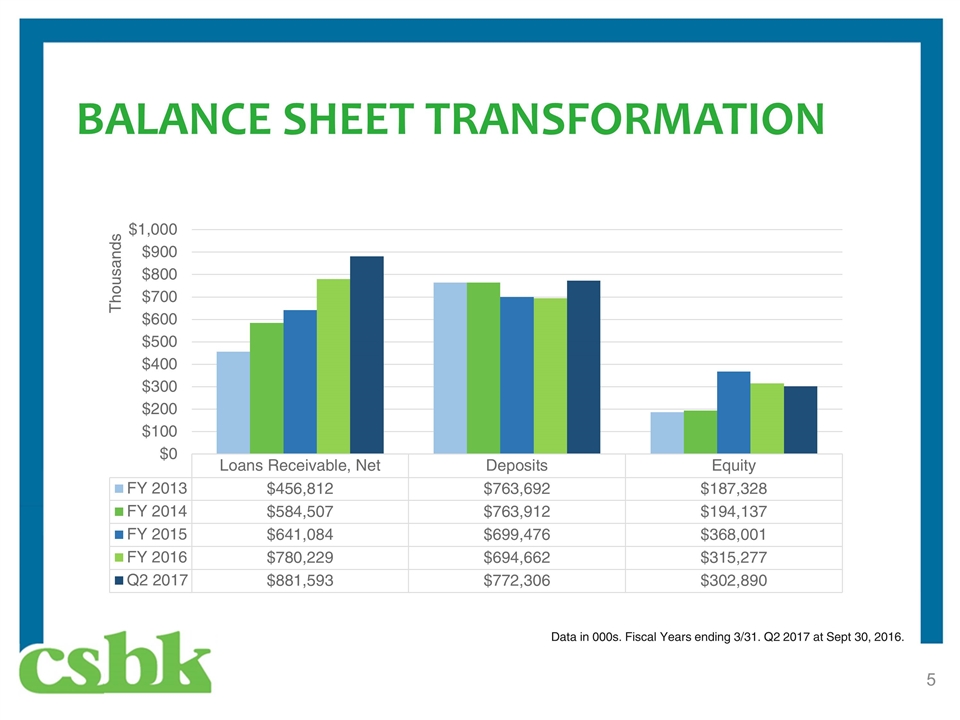
BALANCE SHEET TRANSFORMATION Data in 000s. Fiscal Years ending 3/31. Q2 2017 at Sept 30, 2016.
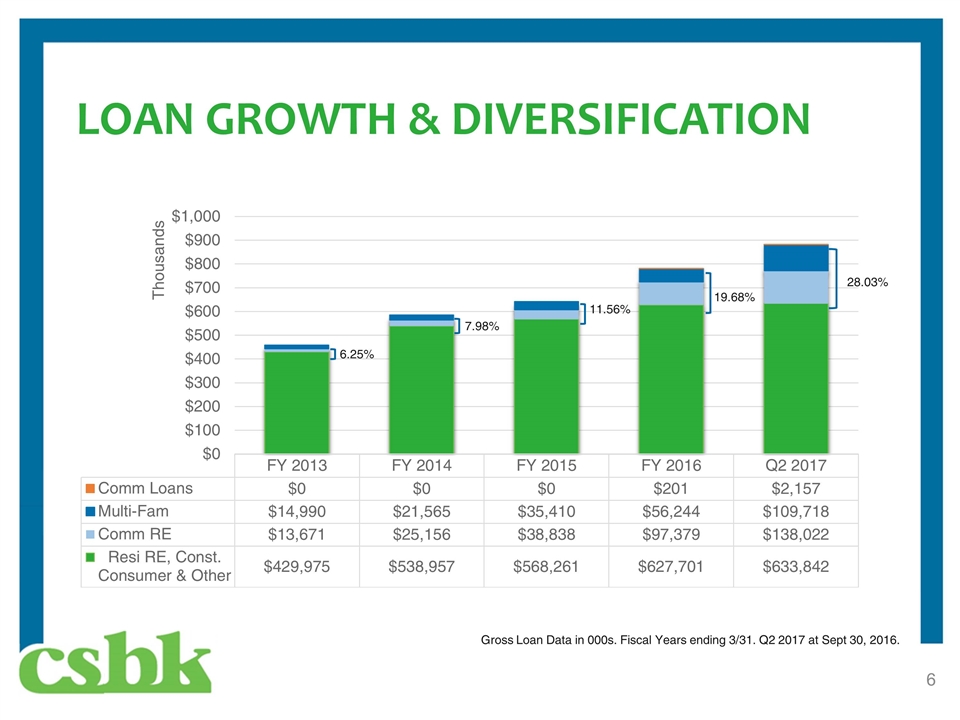
LOAN GROWTH & DIVERSIFICATION 28.03% Gross Loan Data in 000s. Fiscal Years ending 3/31. Q2 2017 at Sept 30, 2016. 6.25% 11.56% 19.68%
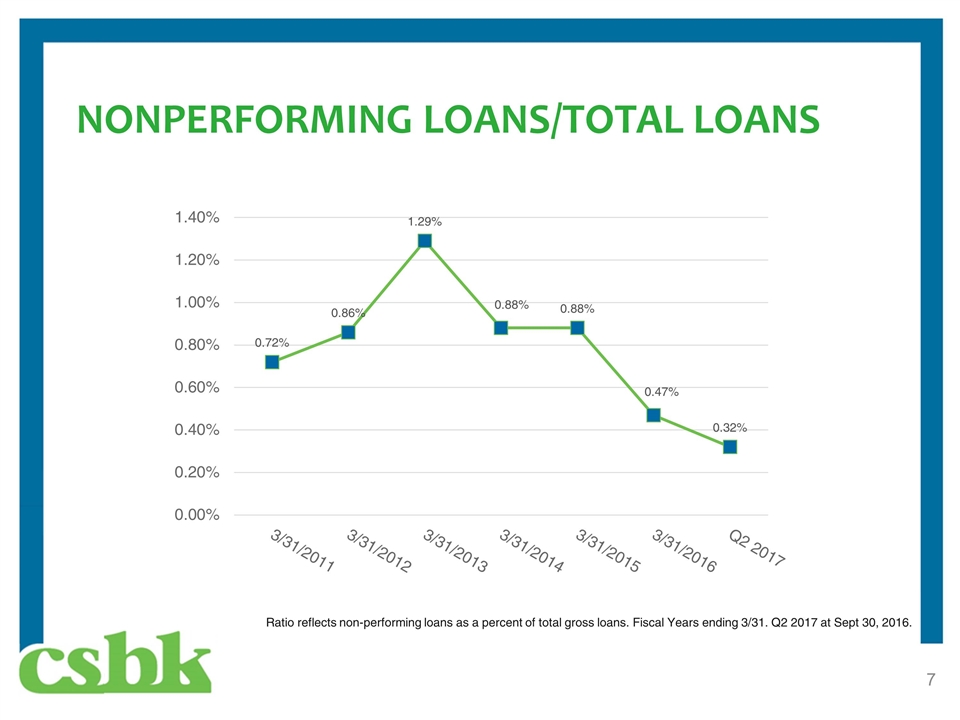
NONPERFORMING LOANS/TOTAL LOANS Ratio reflects non-performing loans as a percent of total gross loans. Fiscal Years ending 3/31. Q2 2017 at Sept 30, 2016.
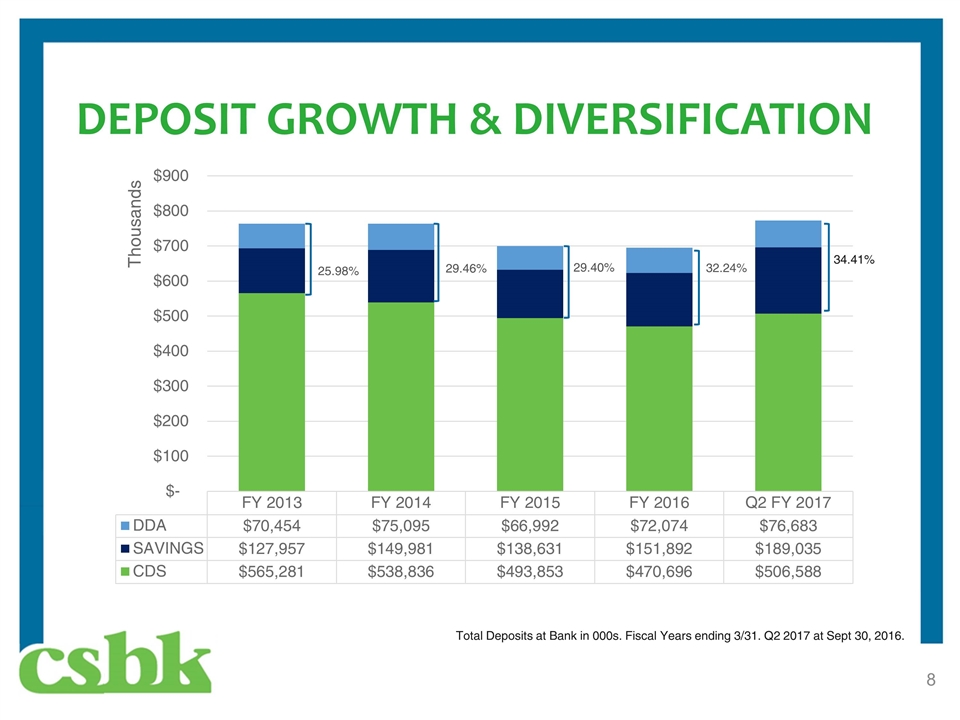
DEPOSIT GROWTH & DIVERSIFICATION 34.41% Total Deposits at Bank in 000s. Fiscal Years ending 3/31. Q2 2017 at Sept 30, 2016.
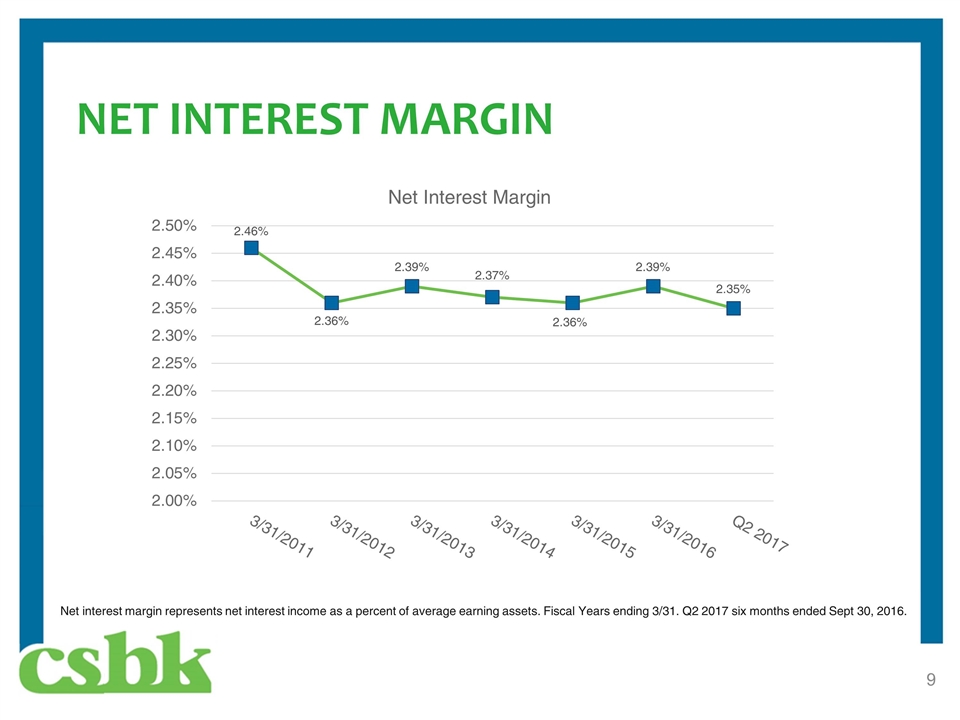
NET INTEREST MARGIN Net interest margin represents net interest income as a percent of average earning assets. Fiscal Years ending 3/31. Q2 2017 six months ended Sept 30, 2016.
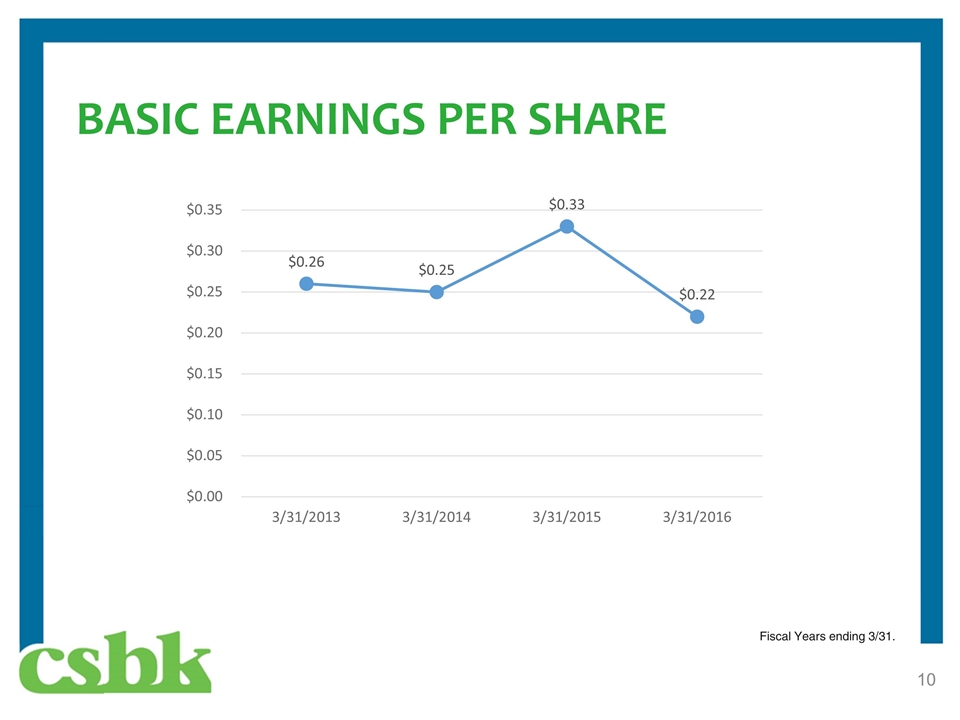
BASIC EARNINGS PER SHARE Fiscal Years ending 3/31.
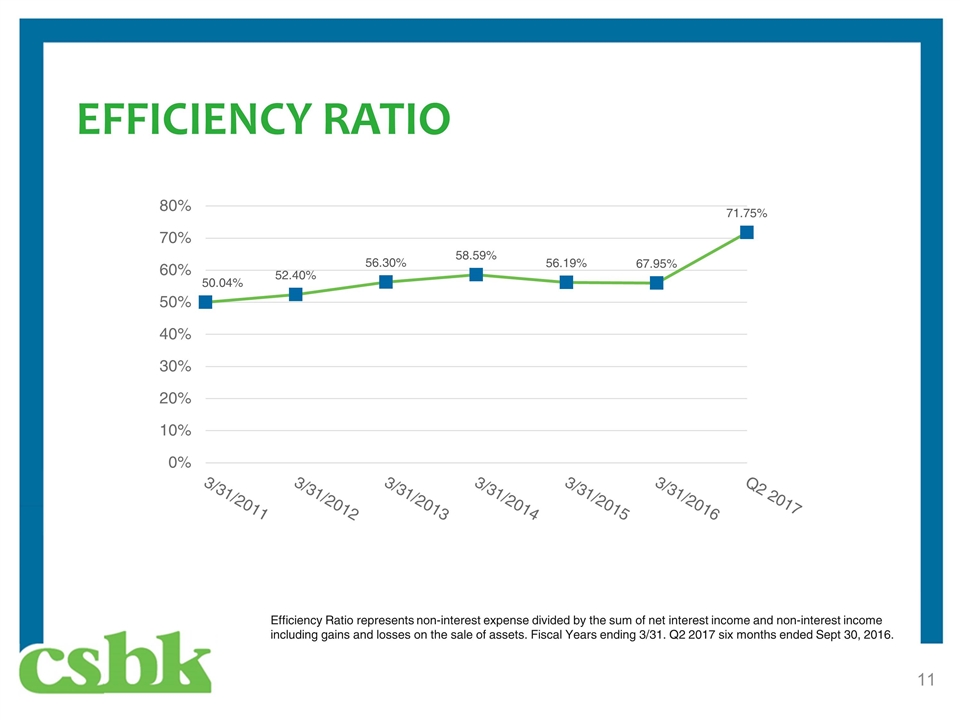
EFFICIENCY RATIO Efficiency Ratio represents non-interest expense divided by the sum of net interest income and non-interest income including gains and losses on the sale of assets. Fiscal Years ending 3/31. Q2 2017 six months ended Sept 30, 2016.
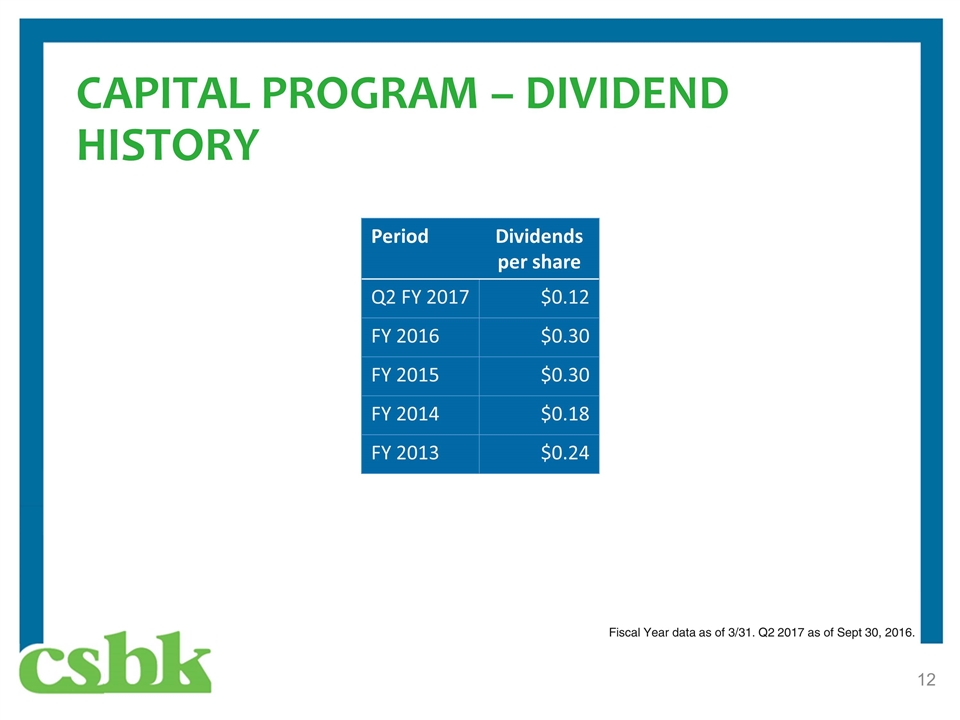
CAPITAL PROGRAM – DIVIDEND HISTORY Period Dividends per share Q2 FY 2017 $0.12 FY 2016 $0.30 FY 2015 $0.30 FY 2014 $0.18 FY 2013 $0.24 Fiscal Year data as of 3/31. Q2 2017 as of Sept 30, 2016.
Thank you for your continued support.
