Attached files
| file | filename |
|---|---|
| 8-K - 8-K - Sprague Resources LP | form8-k3q16invupdate.htm |

1
Sprague Resources LP
Quarterly Investor Update
November 7, 2016

2
Safe Harbor
Quarterly Investor Update: This presentation contains unaudited quarterly results which should not be taken as an indication of the results of
operations to be reported for any subsequent period or for the full fiscal year.
Forward-Looking Statements: Some of the statements in this presentation may contain forward-looking statements within the meaning of the
safe harbor provisions of the U.S. Private Securities Litigation Reform Act of 1995. Forward-looking statements can be identified by words such
as “may,” “assume,” “forecast,” “position,” “predict,” “strategy,” “expect,” “intend,” “plan,” “estimate,” “anticipate,” “believe,” “will,” “project,” “budget,”
“potential,” or “continue,” and similar references to future periods. However, the absence of these words does not mean that a statement is not
forward looking. Descriptions of our objectives, goals, plans, projections, estimates, anticipated capital expenditures, cost savings, strategy for
customer retention and strategy for risk management and other statements of future events or conditions are also forward looking statements.
Forward-looking statements are neither historical facts nor assurances of future performance. Instead, they are based only on our current beliefs,
expectations and assumptions regarding the future of our business, future plans and strategies, projections, anticipated events and trends, the
economy and other future conditions. Our actual future results and financial condition may differ materially from those indicated in the forward-
looking statements. These forward-looking statements involve risks and uncertainties and other factors that are difficult to predict and many of
which are beyond management’s control. Therefore, you should not rely on any of these forward-looking statements. Important factors that could
cause our actual results and financial condition to differ materially from those indicated in the forward-looking statements include, but are not
limited to, increased competition for our products or services; changes in supply or demand for our products; changes in operating conditions and
costs; changes in the level of environmental remediation spending; potential equipment malfunction; potential labor issues; the legislative or
regulatory environment; terminal construction repair/delays; nonperformance by major customers or suppliers; litigation, and political, economic
and capital market conditions, including the impact of potential terrorist acts and international hostilities. For a more detailed description of these
and other risks and uncertainties, please see the “Risk Factors” section in our most recent Annual Report on Form 10-K and/or most recent 10-Q,
form 8-K and other items filed with the U.S. Securities and Exchange Commission and also available in the “Investor Relations” section of our
website www.spragueenergy.com.
Any forward-looking statement made by us in this presentation is based only on information currently available to us and speaks only as of the
date of this presentation. We undertake no obligation to publicly update any forward-looking statement, whether written or oral, that may be made
from time to time, whether as a result of new information, future developments or otherwise.
Non-GAAP Measures: In this presentation, and in statements we make in connection with this presentation, we refer to certain historical and
forward looking financial measures not prepared in accordance with U.S. generally accepted accounting principles, or GAAP. Non-GAAP
measures include adjusted gross margin, EBITDA, adjusted EBITDA, distributable cash flow, coverage ratio, permanent leverage ratio, liquidity,
maintenance capex and expansion capex. For more information on the non-GAAP measures used in this presentation, including definitions and
reconciliations with comparable GAAP financial measures, please refer to the Non-GAAP Measures Supplement available under Investor
Relations section of our website www.spragueenergy.com.
3
Sprague Overview
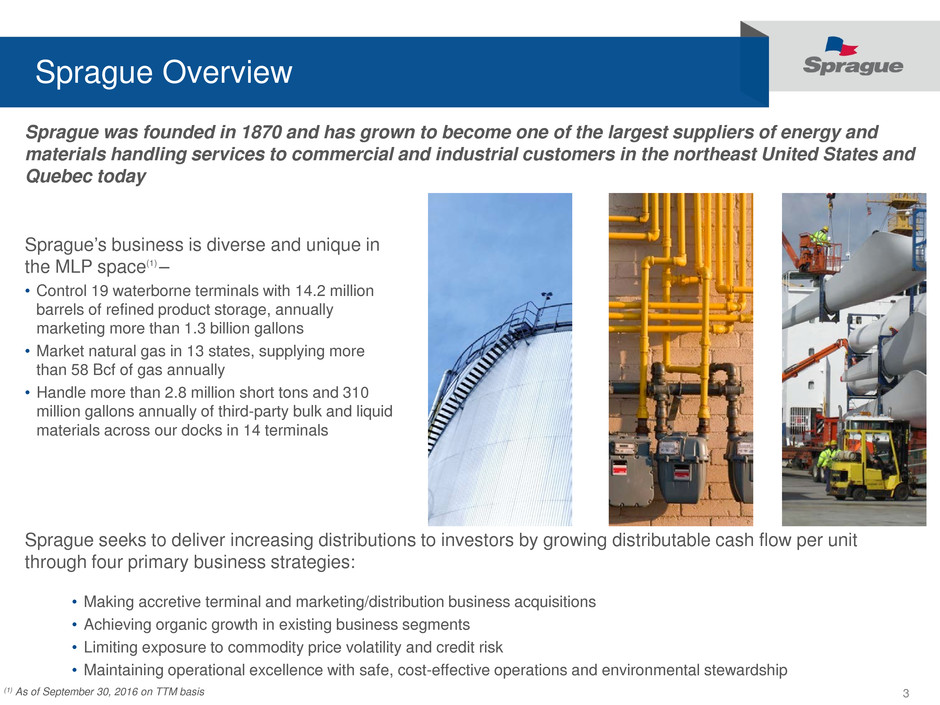
Sprague was founded in 1870 and has grown to become one of the largest suppliers of energy and
materials handling services to commercial and industrial customers in the northeast United States and
Quebec today
Sprague’s business is diverse and unique in
the MLP space(1) –
• Control 19 waterborne terminals with 14.2 million
barrels of refined product storage, annually
marketing more than 1.3 billion gallons
• Market natural gas in 13 states, supplying more
than 58 Bcf of gas annually
• Handle more than 2.8 million short tons and 310
million gallons annually of third-party bulk and liquid
materials across our docks in 14 terminals
Sprague seeks to deliver increasing distributions to investors by growing distributable cash flow per unit
through four primary business strategies:
• Making accretive terminal and marketing/distribution business acquisitions
• Achieving organic growth in existing business segments
• Limiting exposure to commodity price volatility and credit risk
• Maintaining operational excellence with safe, cost-effective operations and environmental stewardship
(1) As of September 30, 2016 on TTM basis

4
Key Considerations
Outstanding operating performance has resulted in 1.8x coverage on TTM basis(1)
Strong balance sheet, permanent leverage of 2.4x TTM Adjusted EBITDA(1)
Year over year quarterly distribution growth of 12%
Supply teams are experts in unique Northeast logistical challenges
Product and service innovations have generated incremental margins
Long history of safe, cost-effective operations and environmental stewardship
Materials Handling business is 100% fee-based, with typically multi-year contracts
More than 50% of Refined Product sales are made under contract with customers
Opportunity to enhance Natural Gas contract base margins by optimization activities
Strong track record of successful acquisitions
Recent acquisitions offer opportunity to leverage legacy skills and investments
Executing on organic growth projects at compelling effective multiples
Terminaling, Logistics
and Marketing
Expertise
Contract-Based
Income with Upside
Potential
Financial Strength
Visible Growth
Prospects
(1) As of September 30, 2016. See Appendix for Non-GAAP reconciliations

5
Investing to Drive
Growth
2010 to Present
Sprague’s History of Growth
• Acquired leading
transportation fuels supplier
in NYC metro area and
expanded into delivered
fuels business
• Invested in capabilities to
offer material handling
services in paper/forest
products industry
• First supplier to offer
biodiesel products in the
Northeast
• Additional natural gas
acquisitions propelled
down-market expansion to
smaller commercial
customers
• Purchase of Kildair terminal
on St. Lawrence river
terminal expands footprint
into Canada
• Transitioned product
offering to residual fuel
oils, modifying coal
terminals to handle
new liquids
• Maintained reputation
as leading industrial
energy supplier
through multi-source
Btu product offering
• Sprague family sold
business to Royal
Dutch Shell in 1970
• Axel Johnson Inc.
purchased Sprague in
1972
• Expanded into
distillate fuels and
serving wholesale
segment
• Offered customers
access to gasoline
• Entered natural gas
marketing business,
once again serving
industrial account base
with new Btu source
• Leveraged refined
product terminals for
new materials handling
business in coal,
gypsum, and road salt
• Expanded materials
handling business to
include liquids such as
asphalt
• Founded in Boston in
1870 by CH Sprague
• Major coal supplier into
the Northeast US,
helping to fuel
America’s industrial
revolution
• Fleet of steamship
vessels allowed
worldwide coal
procurement and
distribution network
• Coal supplier to US
Fleet in WWI and
WWII
Fueling America’s
Growth
1870 to 1950
Evolving to Meet
New Fuel Needs
1950 to 1985
Expanding the
Product Offering
1985 to 2000
New Geographies
and Capabilities
2000 to 2010
• Refined products
growth powered by
expanded third-party
terminal presence and
investments in Real-
Time® pricing platform
• Geographical footprint
expands with key
terminal purchase in
Bronx, solidifying
supply capability to
NYC region
• Natural gas
acquisitions allow
Sprague to serve
smaller volume
commercial accounts
across a wider footprint
• Initial Public Offering in
late 2013

6
Sprague Acquisition History
2001 2003 2005 2007 2009 2011
Mt. Vernon, NY
$1.1 mm
New Bedford, MA
$12.1 mm
Portland, ME
$5.8 mm
Sprague has invested more than $445 million in acquisition growth since 2000 primarily through
non-auction processes that leverage its network of relationships
Everett, MA
$0.7mm
RAD Energy
$23.6 mm
Searsport, ME
(expansion)
$0.5 mm
Houston Energy Services
$6.7 mm
Refined Products Natural Gas Materials Handling
Kildair
(expansion)
$4.7 mm
2013
Bridgeport, CT
$20.7 mm
Kildair (50%)
$71.9 mm
Kildair (50%)
$27.5 mm
Albany, NY
(expansion)
$3.4 mm
2015
Metromedia Energy
$22.0 mm
Bronx, NY and Castle Oil
$56.0 mm
Hess Commercial
Fuels
$0
Kildair
(dropdown)
$175 mm
Note: Amounts shown exclude consideration paid for working capital. Sprague signed long term operating leases for control of key refined products terminal positions in the
Providence, RI and New Haven, CT markets in April and July of 2014
Santa Buckley NG
$17.5 mm

7
Refined Products Business
Exploration / Production Refining Transportation
Storage
Commercial / Industrial
Example Customers
• Jobbers/Distributors
• Municipalities
• Manufacturers
• Industrial Users
• Transit Authorities
• Property Managers
Wholesale
Activities
Sprague purchases, transports, stores and markets distillates, unbranded gasoline, residual fuel oil
and asphalt to wholesalers, resellers and commercial customers. Of our total volume sold in 2015,
distillate sales accounted for 72%, gasoline accounted for 13% and residual fuel oil and asphalt
accounted for approximately 15%.
8
Natural Gas Business
• Power Generation
• Manufacturing
• Retail
• Education
• Government
• Commercial Real Estate
• Health Care
Exploration / Production Processing
Transportation
Storage
Local Distribution (Utility) Example Customers
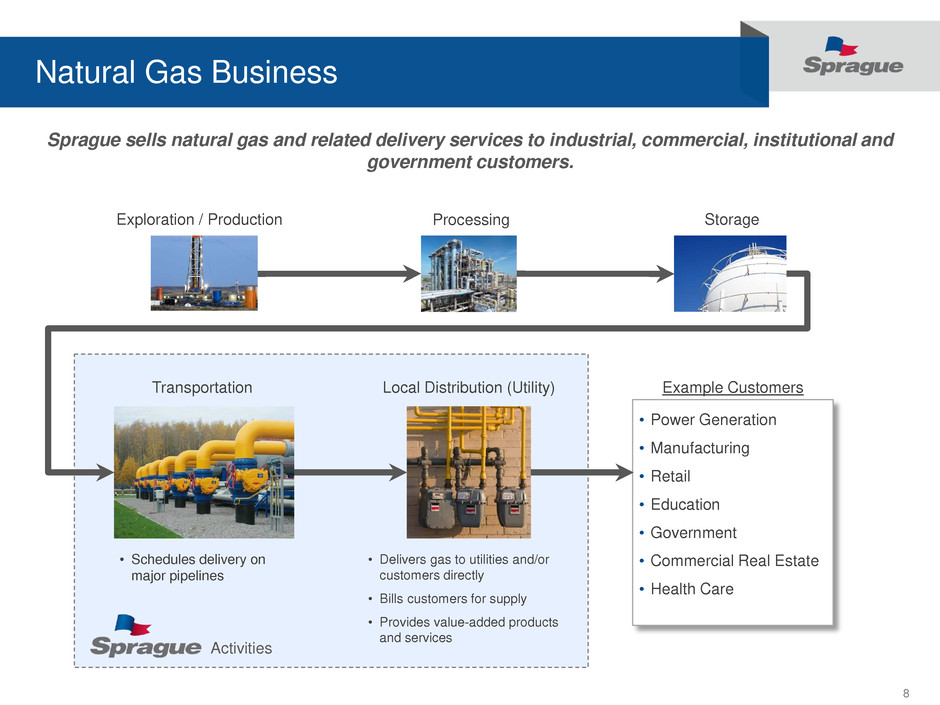
• Schedules delivery on
major pipelines
• Delivers gas to utilities and/or
customers directly
• Bills customers for supply
• Provides value-added products
and services
Activities
Sprague sells natural gas and related delivery services to industrial, commercial, institutional and
government customers.

9
Materials Handling Business
Offload
Wood Pulp
Offload
Windmill
Components
Store
Asphalt
Rail, Truck, Ship
Store
Newsprint
Source
New England,
Canada
Source
South America, Europe,
Asia, Canada
Customers
Domestic Paper
Mills
Transport
Ship
Transport
Export to
Final
Destination
Load
Crude Oil
Load
Gypsum
Transport
Activity Examples INBOUND
OUTBOUND
Sprague utilizes its waterfront terminal network to offload, store and prepare for delivery a wide variety
of liquid, bulk and break bulk materials on long-term, predominantly fee-based contracts.

10
Adjusted Gross Margin(1) for Year Ended 2015: $276 million
Refined Products Volume by
Product Segment: 2015
Materials Handled by Category: 2015
Refined Products
62%
Natural Gas
18%
Materials Handling
17%
Earnings Diversity
Other
3%
Liquid Bulk:
- Crude oil
- Refined products
- Asphalt
- Clay slurry
Dry Bulk:
- Salt
- Petroleum coke
- Gypsum
- Coal
Break Bulk:
- Wood pulp
- Paper
Heavy Lift:
- Windmill components
- Generators
(1) See Appendix for Non-GAAP reconciliations

11
$0.08
$0.06
$0.08
$0.09
$0.10
$0.00
$0.02
$0.04
$0.06
$0.08
$0.10
$0.12
2011 2012 2013 2014 2015
Refined Products Advantages
• One of the largest independent wholesale distributors of refined
products in the Northeast US and Canada
• Access to marine, rail and truck supply sources
• Multiple storage tanks and automated truck loading equipment,
blending and fuel additive injection systems capable of
producing specialized fuel and asphalt
• Long history of safe, cost-effective operations and
environmental stewardship
Asset Network
Marketing Strength
• Logistics and supply expertise keep terminals supplied in the
most adverse conditions, earning reputation for reliability
• Diverse product mix of heating oil, diesel fuel, unbranded
gasoline, residual fuel oil, asphalt, kerosene, jet fuel and
biofuels
• Broad customer portfolio of wholesalers, distributors, federal
and state agencies, municipalities, regional transit authorities,
industrial companies, real estate managers, educational
institutions and marine fuel consumers
• Sprague Real-Time® pricing platform generating high
percentage of contracted customer sales
• Customized fuel management services including onsite bulk
fuel supply construction and fleet card payment capabilities
• Convenient access to customer service personnel, sales
representatives and online account information
Refined Products Adjusted Unit Margin ($/gallon)(1)
Representative “Throughput Model” Margin (2)
Sprague’s large and
strategically located physical
system supports a marketing
business model built on supply
and logistics expertise,
coupled with product and
service innovations, which we
believe generates superior
returns on the asset base over
time as compared to a
traditional throughput model
(2) Source: Sprague
(1) See Appendix for Non-GAAP reconciliations

12
Refined Products Terminal Network
(2) Does not include ~2.0 million barrels of storage capacity (47 storage tanks) currently out of service and not necessary for current operations
Storage and Marketing Metrics (1)
Storage Tanks 207
Tank Capacity (2) 14.2 MMbbl
~ TTM Volume 32 million barrels
(1) As of September 30, 2016

13
Refined Products Growth
Castle Oil asset purchase completed December 8, 2014
• 907,000 barrel waterfront terminal asset in Bronx, NY established permanent Sprague position inside New York City
• Leveraged Sprague’s existing marketing presence, supply and logistics capabilities and back office systems
• Cash purchase plus minimal common unit issuance to seller, accretive to unitholders
Kildair “dropdown” completed December 9, 2014
• 3.3 million barrel terminal asset located on St. Lawrence Seaway expanded Sprague network into Canada
• Cash purchase plus minimal common unit issuance to GP seller, accretive to unitholders
Acquisition Growth – leveraging existing expertise and customer service systems
Organic Growth – expanding the range of products and services provided
Bronx terminal
• $3 million expansion capital investment to upgrade and automate rack system, increasing variety of products marketed
Kildair terminal
• $5.5 million expansion capital investment to convert 420,000 barrels of heavy oil tankage to light oil service
Rensselaer terminal
• $800,000 expansion capital investment to increase ability to blend biofuel into distillates and expand heating and
transportation product portfolio

14
$0.45
$0.54
$0.78
$1.02
$0.90
$0.00
$0.20
$0.40
$0.60
$0.80
$1.00
$1.20
2011 2012 2013 2014 2015
Natural Gas Advantages
• Sizeable market presence of approximately 15,000 commercial
and industrial service locations throughout the Northeast and
Mid-Atlantic states
• Diverse portfolio of industrial customers in the pulp and paper,
chemical, pharmaceutical and metal sectors. Commercial
customer examples include hospitals, universities,
municipalities, government agencies, apartment buildings and
retail stores of varying size
• Wide range of pricing options available to meet various
customer budget and payment needs, unlike utility providers
• Convenient access to customer service personnel, sales
representatives and online account information
• Dual-fuel capabilities (gas or oil) during periods of price
arbitrage or supply dislocations
• Electricity brokerage platform rounds out the customer offering
to include liquid fuel, natural gas and power supply
Marketing Strength
Supply and Scheduling Expertise
• All gas supply and scheduling to customer is coordinated by
Sprague employees with deep local market knowledge
• Portfolio of supply contracts, pipeline transportation capacity
leases, storage leases and other physical delivery services
over various terms on all major pipeline systems into Sprague’s
footprint provide guaranteed supply for customers
• Supply portfolio flexibility and diversity offers arbitrage
opportunities for margin expansion above base contract levels
Sprague believes a
marketing model built on
supply and logistics
expertise, coupled with
product and service
innovations, generate
superior returns on the
asset base over time as
compared to wholesale
supply services
Natural Gas Adjusted Unit Margin ($/MMBtu)(1)
Representative Wholesale Supply Services Margin (2)
(2) Source: Sprague
(1) See Appendix for Non-GAAP reconciliations
15
Natural Gas Service Area
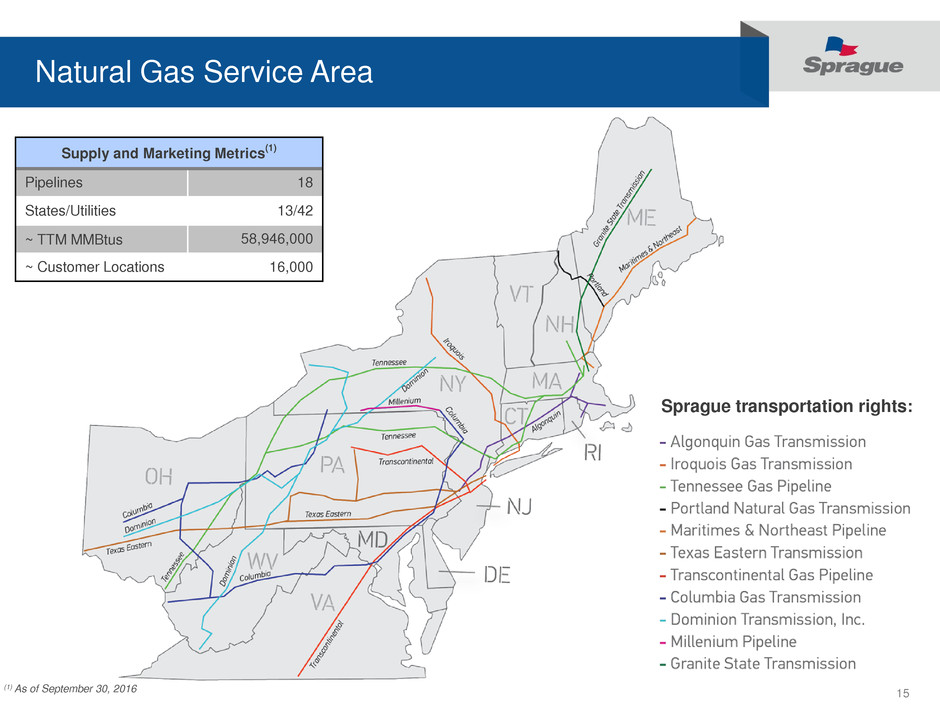
Sprague transportation rights:
(1) As of September 30, 2016
Supply and Marketing Metrics(1)
Pipelines 18
States/Utilities 13/42
~ TTM MMBtus 58,946,000
~ Customer Locations 16,000

16
Natural Gas Growth
Metromedia Energy asset purchase completed October 1, 2014
• 15 Bcf of annual natural gas supply to additional 10,000 commercial, industrial and municipal accounts
• Expansion of natural gas service area to Maryland, Virginia and the District of Columbia with increased density in
Boston/New York/Washington corridor
• Included power brokerage business serving more than 7,000 commercial and industrial customers
• Leveraged Sprague’s existing marketing presence, gas supply and logistics capabilities and back office systems. Larger
pool of account demand offered additional opportunities to optimize gas pathways to customer burner tips and earn
incremental margin
• Cash purchase, accretive to unitholders
Santa Buckley Energy natural gas asset purchase completed February 1, 2016 (see next slide for details)
Metromedia Energy and Santa Buckley Energy natural gas asset purchases
• Strengthened strategic focus on serving smaller volume commercial and industrial segment
• Expanded Sprague’s product portfolio to include assisting customers with electricity procurement
Acquisition Growth – leveraging existing expertise and customer service systems
Organic Growth – expanding the range of products and services provided

17
Santa Buckley Energy Natural Gas Transaction
Terms
• On February 1, 2016 Sprague finalized the purchase of certain natural gas business assets of Santa Buckley
Energy, Inc. located in Bridgeport, Connecticut
• $17.5 million cash purchase price excluding consideration for working capital assets and liabilities, funded with cash
on hand and credit facility borrowings
• Accretive to unitholders
Transaction overview
• Santa Buckley Energy’s natural gas business consists of supply agreements to approximately 3,500 commercial
and industrial customers across four states within Sprague’s current footprint (CT, RI, MA, NH)
• Acquired portfolio of business represents approximately 10 Bcf of annual natural gas demand
• Electricity brokerage offering included, adding to Sprague’s existing brokerage business
• Customers are primarily supplied through two New England pipeline systems familiar to Sprague (AGT & TGP)
• Capitalizes on Sprague’s gas supply and scheduling expertise, offering opportunities for improved economics and
margin uplift through optimization
• Historical average annual adjusted EBITDA run rate of $3.5 million
• Purchase financed through existing acquisition facility utilizing liquidity

18
Sprague Natural Gas Service Area including Santa Buckley
Key transaction considerations
• Purchase continues to build scale for Sprague’s commercial and industrial account base in
existing New England footprint
• Transaction leverages Sprague’s marketing, supply and back office investments
• All natural gas supply will now be coordinated through
Sprague, not outsourced to a 3rd party, allowing for
supply cost improvement
• Increased scale in electricity brokerage platform
• Natural gas book of business may include customers
with dual-fuel capabilities and offer a liquid fuel sales
opportunity as well
Acquired Portfolio Statistics
• 3,500 customers
• 10 Bcf of annual gas demand
• 16 LDC’s across four states
(CT, RI, MA, NH)

19
Materials Handling Advantages
Sprague’s materials
handling business has
historically produced
steady fee-based cash
flows backed by long term
contracts, leveraging
existing refined products
terminals and workforce
Materials Handling Adjusted Gross Margin (1)
($ in millions)
• Network of waterfront terminals from New York to New England
and Quebec, offering customers unparalleled import/export
access to the densely populated Northeast corridor, Great
Lakes and St. Lawrence Seaway
• Liquid storage capacity for crude oil, refined products, asphalt
and other industrial liquids. Outdoor laydown space (pad
storage) for bulk aggregates and large construction project
cargo. Indoor warehouse capacity for break bulk materials
• Intermodal access to terminals by ocean vessels, rail and truck.
Crude handling capability via direct access to CN railroad
Premier Asset Locations
Leveraged Workforce and Capabilities
• Ten terminals capable of handling both liquid petroleum
products in service to the refined products business as well as
providing third-party materials handling services
• Diverse set of services offered including ship handling, crane
operations, pile building, warehousing, scaling and potential
transportation to the final customer
• Long history of safe, cost-effective operations and
environmental stewardship
$28.4
$32.3
$28.4
$37.8
$45.6
$0
$5
$10
$15
$20
$25
$30
$35
$40
$45
$50
2011 2012 2013 2014 2015
(1) See Appendix for Non-GAAP reconciliations

20
Liquid Finger
Dock
Rail Transfer Pad
Nacelles
Road Salt
Pads
Clay Slurry
Rail connection to CP,
CMQ and Pan Am
Liquid
Finger
Dock
Dry Bulk Dock
Food Grade
Warehouses
Available for Development
Blades
Hopper
Coal /
Petcoke Third Party
Tanks
Third Party
Tanks
Storage for Sprague or Third-Party Use
Summary Specifications
Tank Shell Capacity 17 Tanks 1,140,000 Bbls
Dry Bulk Storage 90,000 ft
2 Covered
857,000 ft2 Bulk Pad
Total Acreage 157 Acres
Unloading
Blades
Terminal Example - Searsport, Maine

21
Materials Handling Business
Storage Metrics(1)
Storage Tanks 207
Tank Capacity(2) 14.2 MMbbl
25 Pads: 1,647,000 ft2
9 Warehouses: 305,000 ft2
(2) Does not include ~2.0 million barrels of storage capacity (47 storage tanks) currently out of service and not necessary for current operations
(1) As of September 30, 2016

22
Materials Handling Growth
Castle Oil asset purchase completed December 8, 2014
• Deepwater terminal asset in Bronx, NY provided direct access to New York City’s materials handling requirements
• Asset and workforce supports both refined products and materials handling businesses
• Cash purchase plus minimal common unit issuance to seller, accretive to unitholders
• Existing asphalt materials handling contract, space available for additional laydown space if needed
Kildair “dropdown” completed December 9, 2014
• St. Lawrence Seaway terminal expanded Sprague network into Canada
• Asset and workforce supports both refined products and materials handling businesses
• Cash purchase plus minimal common unit issuance to GP seller, accretive to unitholders
• $30 million expansion capital project to support long-term crude handling and storage contract for customer
River Road terminal
• $800,000 expansion capital project to upgrade dock capabilities in 2016 and grow service capabilities
• $4.4 million expansion capital project announced in Q3 2016 will convert two existing tanks and one out-of-service tank to
asphalt storage, supporting a new long term fee-for-service agreement
Acquisition Growth – leveraging existing expertise and customer service systems
Organic Growth – expanding the range of products and services provided

23
$0.36
$0.41
$0.46
$0.51
$0.56
1Q
2014
2Q
2014
3Q
2014
4Q
2014
1Q
2015
2Q
2015
3Q
2015
4Q
2015
1Q
2016
2Q
2016
3Q
2016
Sprague Resources LP (SRLP) Overview
Distribution Per Unit Investment Highlights as of November 7, 2016(1)
Ticker SRLP
Exchange NYSE
SRLP Price Per Unit $24.00
Total Units Outstanding 21.3 million
Market Capitalization $511 million
3Q 2016 Distribution Per Unit $0.5625
Annualized 3Q 2016 Distribution Per Unit $2.25
Yield 9.4%
• Adjusted EBITDA guidance range of $105 to $120 million(3)
• Maintenance capex $8 to $11 million; Cash interest expense $22 to $26 million
• Operating expense range of $65 to $70 million
• SG&A expense range of $85 to $90 million
• Expect to grow distributions by 1.5 cents/unit per quarter through 2018
Full Year 2016 Guidance as of November 7, 2016(2)
$ / Unit
$0.4275
$0.4425
$0.4575
$0.4725
$0.4875
$0.5025
$0.4125
$0.5175
(1) Source: MarketView, Sprague. See Appendix for Non-GAAP reconciliations
(2) Assumes no future acquisitions, normal weather and market conditions
(3) Sprague does not provide guidance on expected net income (loss) (the GAAP financial measure most directly comparable to adjusted EBITDA) due to the inherent difficulty and
impracticality of forecasting certain amounts required by GAAP such as unrealized gains and losses on derivative hedges
$0.5325
$0.5475
$0.5625
24
Financial Strengths
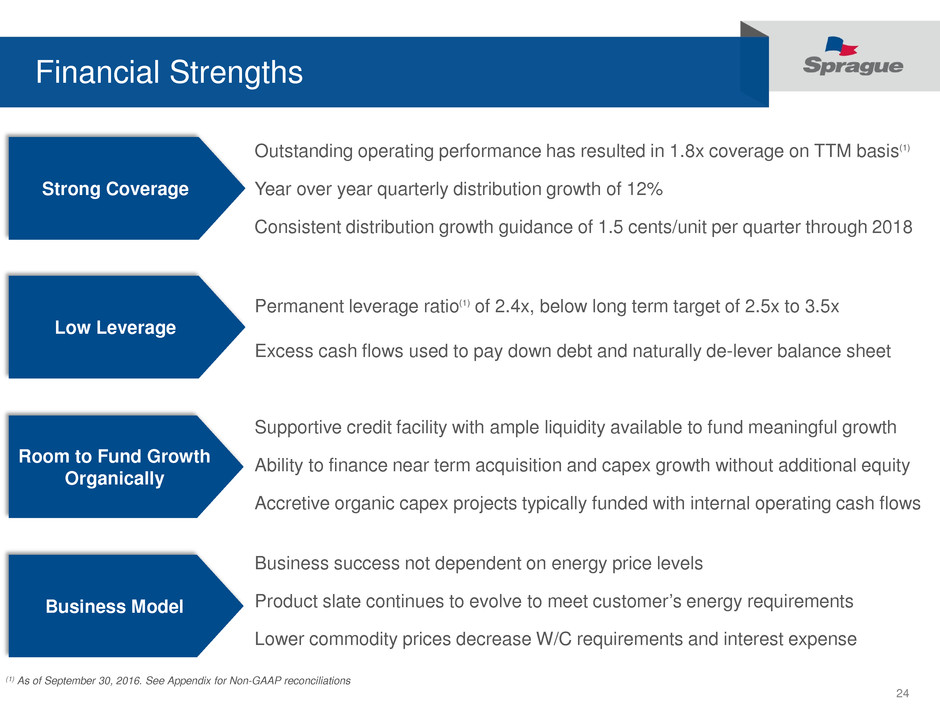
Outstanding operating performance has resulted in 1.8x coverage on TTM basis(1)
Year over year quarterly distribution growth of 12%
Consistent distribution growth guidance of 1.5 cents/unit per quarter through 2018
Permanent leverage ratio(1) of 2.4x, below long term target of 2.5x to 3.5x
Excess cash flows used to pay down debt and naturally de-lever balance sheet
Supportive credit facility with ample liquidity available to fund meaningful growth
Ability to finance near term acquisition and capex growth without additional equity
Accretive organic capex projects typically funded with internal operating cash flows
Business success not dependent on energy price levels
Product slate continues to evolve to meet customer’s energy requirements
Lower commodity prices decrease W/C requirements and interest expense
Low Leverage
Strong Coverage
Business Model
Room to Fund Growth
Organically
(1) As of September 30, 2016. See Appendix for Non-GAAP reconciliations
25
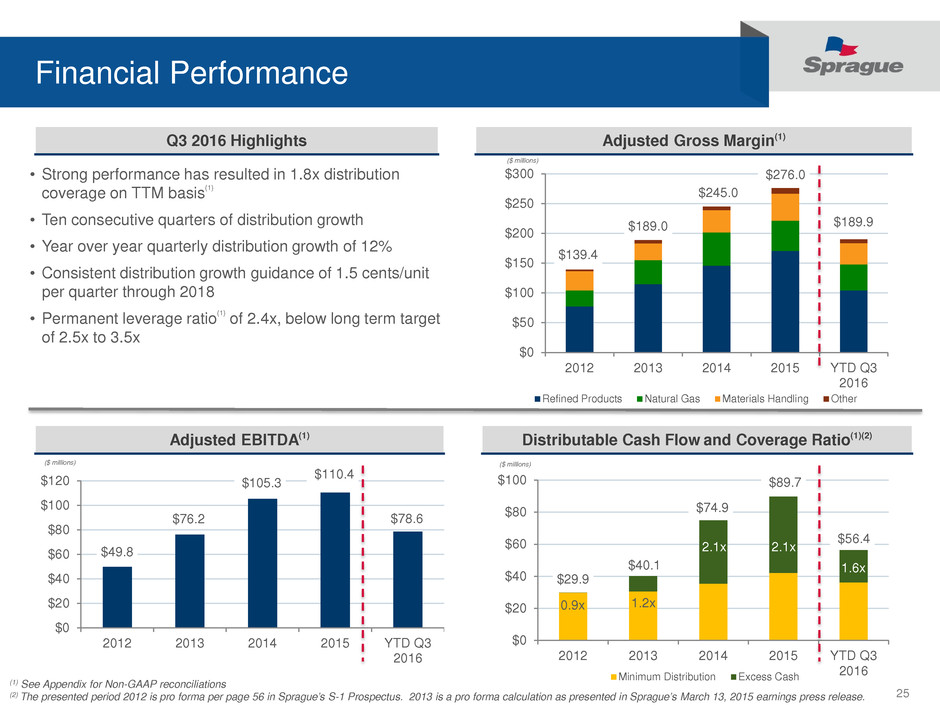
$29.9
$40.1
$74.9
$89.7
$56.4
$0
$20
$40
$60
$80
$100
2012 2013 2014 2015 YTD Q3
2016Minimum Distribution Excess Cash
$139.4
$189.0
$245.0
$276.0
$189.9
$0
$50
$100
$150
$200
$250
$300
2012 2013 2014 2015 YTD Q3
2016
Refined Products Natural Gas Materials Handling Other
$49.8
$76.2
$105.3
$110.4
$78.6
$0
$20
$40
$60
$80
$100
$120
2012 2013 2014 2015 YTD Q3
2016
Financial Performance
Adjusted EBITDA(1)
Q3 2016 Highlights Adjusted Gross Margin(1)
Distributable Cash Flow and Coverage Ratio(1)(2)
($ millions)
($ millions) ($ millions)
0.9x 1.2x
2.1x 2.1x
1.6x
(1) See Appendix for Non-GAAP reconciliations
(2) The presented period 2012 is pro forma per page 56 in Sprague’s S-1 Prospectus. 2013 is a pro forma calculation as presented in Sprague’s March 13, 2015 earnings press release.
• Strong performance has resulted in 1.8x distribution
coverage on TTM basis(1)
• Ten consecutive quarters of distribution growth
• Year over year quarterly distribution growth of 12%
• Consistent distribution growth guidance of 1.5 cents/unit
per quarter through 2018
• Permanent leverage ratio(1) of 2.4x, below long term target
of 2.5x to 3.5x

26
Sprague Condensed Consolidated Balance Sheet
As of September 30, 2016
(In thousands)
9/30/16 12/31/15
Assets
Current assets:
Cash and cash equivalents $ 3,449 $ 30,974
Accounts receivable, net 133,321 160,848
Inventories 266,728 241,320
Fair value of derivative assets 98,299 157,714
Other current assets 42,600 57,006
Total current assets 547,997 647,862
Property, plant, and equipment, net 250,713 250,909
Intangibles and other assets, net 39,602 38,273
Goodwill, net 70,550 63,288
Total assets $ 908,862 $ 1,000,332
9/30/16 12/31/15
Liabilities and unitholders’ equity
Current liabilities:
Accounts payable and accrued liabilities $ 105,878 $ 139,227
Fair value of derivative liabilities 58,533 37,178
Due to General Partner and affiliate 7,573 14,021
Current portion of working capital facilities 196,851 332,500
Current portion of capital leases and other debt 1,424 1,213
Total current liabilities 370,259 524,139
Working capital facilities – less current portion 104,561
Acquisition facility 262,400 283,400
Capital leases and other debt – less current portion 4,480 3,987
Other liabilities 30,830 31,321
Total liabilities 772,530 842,847
Unitholders’ equity 136,332 157,485
Total liabilities and unitholders’ equity $ 908,862 $ 1,000,332
(1) A full consolidated balance sheet can be found on page F-4 of Sprague’s most recently filed Annual Report on SEC Form 10-K, available in the “Investor Relations” section of our website
www.spragueenergy.com

27
$0
$200
$400
$600
$800
Q3 2015 Q4 2015 Q1 2016 Q2 2016 Q3 2016
Acquisition Line Working Capital Facility
(in millions) Debt Liquidity
Acquisition Facility $262 $288
Credit Facility, Liquidity and Permanent Leverage
• $1.12 billion Working Capital facilities (includes $120 million multicurrency Working Capital facility)
• $550 million Acquisition facility
• Accordions:
• Combined Working Capital facilities - $200 million
• Acquisition facility - $200 million
• Maximum size is $2.2 billion (including optional contango facility of $125 million)
• Significant capacity and liquidity to finance our ongoing business requirements and growth
• JPMorgan Chase is Administrative Agent (Syndicate of 24 Diverse Lenders)
(in millions) Debt Liquidity
Working Capital Facility $301 $127
Total Facility Size - $1.67 billion (Committed 5 years, expiring December 2019)
Debt and Liquidity(1) as of September 30, 2016
To
ta
l D
eb
t Permanent
Leverage
Ratio(1)
$554
$616
$527
(1) See Appendix for Non-GAAP reconciliations
$428
2.4x
$564

28
Appendix

29
Summary Unaudited Financial Data
Note: See Appendix for Non-GAAP reconciliations

30
Volume, Net Sales and Adjusted Gross Margin
Note: See Appendix for Non-GAAP reconciliations
31
Reconciliation of Non-GAAP Measures
Note: See Appendix for Non-GAAP reconciliations

Sprague Resources LP
Non-GAAP Measures
Overview
This Non-GAAP Measures Quarterly Supplement (the “Supplement”) provides information of interest to investors, analysts and other parties
including supplemental financial information and reconciliations and other information concerning Sprague’s use of non-GAAP financial
measures and is updated quarterly. The term “Sprague” refers to Sprague Resources LP.
Use of Non-GAAP Measures
From time to time, management may publicly disclose non-GAAP financial measures in the course of our earnings releases, financial
presentations, earnings conference calls, investor and analyst meetings and otherwise and are provided as additional information to investors,
analysts and other parties. Sprague believes that investors benefit from having access to the same financial measures that are used by its
management and that these measures are useful to investors because they aid in comparing its operating performance with that of other
companies with similar operations. However, Sprague’s calculations of non-GAAP measures may not be comparable to similarly titled
measures of other businesses because they may be defined differently by other companies.
These non-GAAP measures may not be indicative of the historical operating results nor are they intended to be predictive or projections of
future results and should be considered within the context of our complete audited and unaudited financial results for the given period, which
are available on the Investor Relations page of our website www.spragueenergy.com and in EDGAR public filings with the Securities and
Exchange Commission (the “SEC”).
Sprague’s non-GAAP measures should be viewed as supplemental to, and should not be considered as alternatives to, GAAP measures
including, but not limited to net earnings (loss), operating profit (loss), cash flow from operating, investing and financing activities, or any other
measure of financial performance or liquidity presented in accordance with GAAP.
Pursuant to the requirements of SEC Regulation G, when Sprague refers to a non-GAAP measure, we will also present in this document, in the
presentation itself or on a Form 8-K in connection with the presentation on the Investor Relations/Non-GAAP Measures page of our website,
www.spragueenergy.com, to the extent practicable, the most directly comparable financial measure calculated and presented in accordance with
GAAP, along with a reconciliation of the differences between the non-GAAP measure we reference and such comparable GAAP measure.
This Supplement provides information about the following non-GAAP measures: EBITDA, adjusted gross margin, adjusted EBITDA,
distributable cash flow, distribution coverage ratio, permanent leverage ratio, liquidity, maintenance capex, expansion capex as well as
additional information pertaining to GAAP guidance reconciliation.

Sprague Resources LP
Non-GAAP Measures
To supplement the financial information presented in accordance with United States generally accepted accounting principles (“GAAP”),
Sprague’s management uses certain non-GAAP financial measurements to evaluate its results of operations which include EBITDA, adjusted
EBITDA, adjusted gross margin and distributable cash flow.
EBITDA, adjusted EBIDTA, adjusted gross margin and distributable cash flow are not prepared in accordance with GAAP and should not be
considered as alternatives to net income (loss), or operating income or any other measure of financial performance presented in accordance with
GAAP and may not be comparable to similarly titled measures of other businesses because they may be defined differently by other companies.
EBITDA
Sprague defines EBITDA as net income (loss) before interest, income taxes, depreciation and amortization. EBITDA is used as a supplemental
financial measure by external users of Sprague's financial statements, such as investors, trade suppliers, research analysts and commercial banks
to assess:
• The financial performance of Sprague’s assets, operations and return on capital without regard to financing methods, capital structure or
historical cost basis;
• The ability of our assets to generate sufficient revenue, that when rendered to cash, will be available to pay interest on our indebtedness
and make distributions to our equity holders
• Repeatable operating performance that is not distorted by non-recurring items or market volatility; and
• The viability of acquisitions and capital expenditure projects.
Adjusted Gross Margin and Adjusted EBITDA
The Partnership trades, purchases, stores and sells energy commodities that experience market value fluctuations. To manage the Partnership’s
underlying performance, including its physical and derivative positions, management utilizes adjusted gross margin, which is a non-GAAP
financial measure. Adjusted gross margin is also used by external users of the Partnership’s consolidated financial statements to assess the
Partnership’s economic results of operations and its commodity market value reporting to lenders. In determining adjusted gross margin, the
Partnership adjusts its segment results for the impact of unrealized hedging gains and losses with regard to refined products and natural gas
inventory, prepaid forward contracts and natural gas transportation contracts, which are not marked to market for the purpose of recording
unrealized gains or losses in net income (loss). These adjustments align the unrealized hedging gains and losses to the period in which the
revenue from the sale of inventory, prepaid fixed forwards and the utilization of transportation contracts relating to those hedges is realized in
net income (loss). Adjusted gross margin has no impact on reported volumes or net sales. Adjusted gross margin and adjusted EBITDA are
used as supplemental financial measures by management to describe its operations and economic performance to investors, trade suppliers,
research analysts and commercial banks to assess:
• The economic results of its operations;
• The market value of its inventory and natural gas transportation contracts for financial reporting to lenders, as well as for borrowing
base purposes; and
• Repeatable operating performance that is not distorted by non-recurring items or market volatility.

Sprague Resources LP
Non-GAAP Measures
Distributable Cash Flow
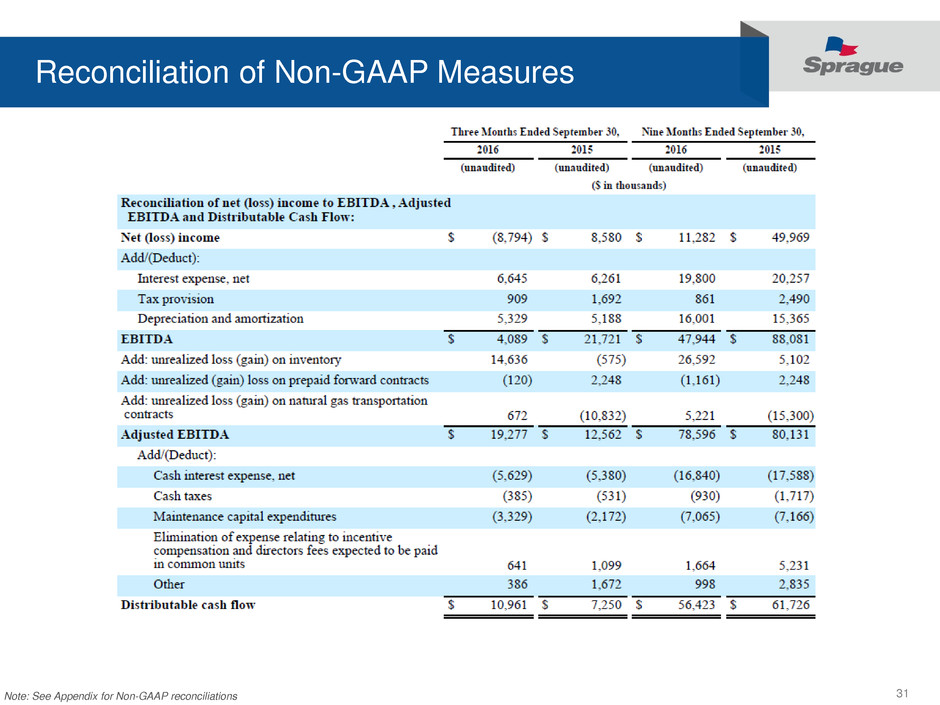
Sprague defines distributable cash flow as adjusted EBITDA less cash interest expense, cash taxes, and maintenance capital expenditures.
Distributable cash flow calculations also reflect the elimination of compensation expense expected to be settled with the issuance of Partnership
units, expenses related to business combinations and other adjustments. Distributable cash flow is a significant performance measure used by
Sprague and by external users of its financial statements, such as investors, commercial banks and research analysts, to compare the cash
generating performance of the Partnership in relation to the cash distributions expected to be paid to its unitholders. Distributable cash flow is
also an important financial measure for Sprague’s unitholders since it serves as an indicator of its success in providing a cash return on
investment. Additionally, distributable cash flow is utilized as a performance measure in certain of its compensation plans. Distributable cash
flow indicates to investors whether or not Sprague can generate performance that can sustain or support an increase in quarterly distribution
rates. Distributable cash flow is also a quantitative standard used throughout the investment community with respect to publicly-traded
partnerships because the value of a unit of such an entity is generally determined by the unit's yield, which in turn is based on the amount of
cash distributions the entity pays to a unitholder.
Distribution Coverage Ratio
Sprague also calculates the ratio of distributable cash flow to the total cash distribution declared for the period (the distribution coverage ratio)
as it provides important information relating to the relationship between Sprague's financial operating performance and its cash distribution
capability. Sprague defines the distribution coverage ratio as the ratio of distributable cash flow to the quarterly distribution payable on all
outstanding common and subordinated units and incentive distributions.
Permanent Leverage Ratio
Sprague uses the term "permanent leverage ratio" when referring to its Consolidated Total Leverage Ratio as contained in its Credit Agreement.
Sprague's permanent leverage ratio equates to the aggregate of its acquisition facility borrowings, capital lease obligations, debentures and other
debt divided by the consolidated trailing twelve-month adjusted EBITDA, as defined by the Credit Agreement. For computing compliance with
the Credit Agreement, Sprague makes modifications to adjusted EBIDTA to reflect the pro forma effect of acquisitions and adjusts for interest
income, non-cash expenses, gain(loss) on sale of assets and other extraordinary, unusual or non-recurring losses and charges. Management
believes the permanent leverage ratio is helpful to investors in assessing the Partnership's overall debt profile and is used by management to
evaluate its ability to finance capital expenditures and acquisitions.

Sprague Resources LP
Non-GAAP Measures
Liquidity
Sprague defines liquidity as the potential availability under its Credit Agreement (consisting of maximum credit commitments, less balances
outstanding) less adjustments associated with compliance with financial covenants and other provisions of the Credit Agreement that may limit
borrowings.
Maintenance Capital Expenditures
Sprague defines maintenance capital expenditures as capital expenditures made to replace assets, or to maintain the long-term operating
capacity of our assets or operating income. Examples of maintenance capital expenditures are expenditures required to maintain equipment
reliability, terminal integrity and safety and to address environmental laws and regulations. Costs for repairs and minor renewals to maintain
facilities in operating condition and that do not extend the useful life of existing assets will be treated as maintenance expenses as we incur
them.
Expansion Capital Expenditures
Expansion capital expenditures are capital expenditures made to increase the long-term operating capacity of our assets or our operating income
whether through construction or acquisition of additional assets. Examples of expansion capital expenditures include the acquisition of
equipment and the development or acquisition of additional storage capacity, to the extent such capital expenditures are expected to expand our
operating capacity or our operating income.
Guidance
Sprague does not provide guidance on expected net income (the GAAP financial measure most directly comparable to adjusted EBITDA) due
to the inherent difficulty and impracticality of forecasting certain amounts required by GAAP such as unrealized gains and losses on derivative
hedges.

Sprague Resources LP
Reconciliations of Non-GAAP Measures
$ in thousands
Three Months Ended
September 30, 2016
Three Months Ended
June 30, 2016
Three Months Ended
March 31, 2016
Three Months Ended
December 31, 2015
Three Months Ended
September 30, 2015
Three Months Ended
June 30, 2015
Three Months Ended
March 31, 2015
Net Income (Loss) to EBITDA, Adjusted EBITDA and Distributable Cash Flow
Net income (loss) $ (8,794) $ (9,745) $ 29,821 $ 28,379 $ 8,580 $ (2,550) $ 43,939
Add/(deduct):
Interest expense, net 6,645 6,299 6,856 6,654 6,261 6,342 7,654
Tax provision (benefit) 909 (573) 525 (674) 1,692 148 650
Depreciation and amortization 5,329 5,641 5,031 4,977 5,188 5,185 4,992
EBITDA $ 4,089 $ 1,622 $ 42,233 $ 39,336 $ 21,721 $ 9,125 $ 57,235
Add/(deduct):
Unrealized loss (gain) on inventory 14,636 8,652 3,304 (3,023) (575) 2,143 3,534
Unrealized loss (gain) on prepaid forward contracts (120) (560) (481) 380 2,248 — —
Unrealized loss (gain) on natural gas transportation contracts 672 4,205 344 (6,395) (10,832) (7,239) 2,771
Adjusted EBITDA $ 19,277 $ 13,919 $ 45,400 $ 30,298 $ 12,562 $ 4,029 $ 63,540
Add/(deduct):
Cash interest expense, net (5,629) (5,282) (5,929) (5,771) (5,380) (5,460) (6,748)
Cash taxes (385) 62 (607) 49 (531) 142 (1,327)
Maintenance capital expenditures (3,329) (2,107) (1,629) (1,689) (2,172) (3,233) (1,760)
Elimination of expense relating to incentive compensation and
directors fees expected to be paid in common units 641 787 236 3,206 1,099 63 4,068
Other 386 300 312 1,866 1,672 360 802
Distributable cash flow $ 10,961 $ 7,679 $ 37,783 $ 27,959 $ 7,250 $ (4,099) $ 58,575
Distributions declared for the period $ 12,477 $ 12,045 $ 11,619 $ 11,103 $ 10,699 $ 10,323 $ 9,959
Distribution coverage ratio 0.9x 0.6x 3.3x 2.5x 0.7x (0.4)x 5.9x
Trailing twelve month distribution coverage ratio 1.8x 1.8x 1.6x 2.1x 2.0x 2.1x 2.4x

Sprague Resources LP
Reconciliations of Non-GAAP Measures
$ in thousands
Three Months Ended
September 30, 2016
Three Months Ended
June 30, 2016
Three Months Ended
March 31, 2016
Three Months Ended
December 31, 2015
Three Months Ended
September 30, 2015
Three Months Ended
June 30, 2015
Three Months Ended
March 31, 2015
Cash Flows
Net cash provided by (used in) operating activities $ (126,073) $ 116,734 $ 116,434 $ (30,049) $ 7,651 $ 187,593 $ 122,418
Net cash provided by (used in) investing activities (4,570) (3,216) (32,568) (3,928) (4,003) (3,443) (3,191)
Net cash provided by (used in) financing activities 122,956 (110,623) (106,596) 50,042 2,165 (196,616) (101,556)
Other (36) 8 25 (66) (68) 87 (142)
Net change in cash and cash equivalents $ (7,723) $ 2,903 $ (22,705) $ 15,999 $ 5,745 $ (12,379) $ 17,529
Cash Flow from Operations to Distributable Cash Flow
Net cash provided by (used in) operating activities $ (126,073) $ 116,734 $ 116,434 $ (30,049) $ 7,651 $ 187,593 $ 122,418
Add/(deduct):
Changes in assets and liabilities 124,963 (119,577) (80,300) 66,884 10,022 (183,400) (68,975)
Unrealized loss (gain) on inventory 14,636 8,652 3,304 (3,023) (575) 2,143 3,534
Unrealized loss (gain) on prepaid forward contracts (120) (560) (481) 380 2,248 — —
Unrealized loss (gain) on natural gas transportation contracts 672 4,205 344 (6,395) (10,832) (7,239) 2,771
Maintenance capital expenditures (3,329) (2,107) (1,629) (1,689) (2,172) (3,233) (1,760)
Acquisition-related expenses 282 303 214 488 718 819 857
Other (70) 29 (103) 1,363 190 (782) (270)
Distributable cash flow 10,961 7,679 37,783 27,959 7,250 (4,099) 58,575
Capital Expenditures
Maintenance capital expenditures per distributable cash flow $ 3,329 $ 2,107 $ 1,629 $ 1,689 $ 2,172 $ 3,233 $ 1,760
Less: principal payments on maintenance capital leases 311 224 177 238 318 198 335
Maintenance capital expenditures 3,018 1,883 1,452 1,451 1,854 3,035 1,425
Expansion capital expenditures 1,568 1,345 2,170 2,404 2,246 382 2,102
Total capital expenditures $ 4,586 $ 3,228 $ 3,622 $ 3,855 $ 4,100 $ 3,417 $ 3,527

Sprague Resources LP
Reconciliations of Non-GAAP Measures
$ in thousands
Nine Months Ended
September 30, 2016
Year Ended
December 31, 2015
Year Ended
December 31, 2014
Net Income (Loss) to EBITDA, Adjusted EBITDA and Distributable Cash Flow
Net income (loss) $ 11,282 $ 78,348 $ 122,814
Add/(deduct):
Interest expense, net 19,800 26,911 29,082
Tax provision (benefit) 861 1,816 5,509
Depreciation and amortization 16,001 20,342 17,625
EBITDA $ 47,944 $ 127,417 $ 175,030
Add/(deduct):
Unrealized loss (gain) on inventory 26,592 2,079 (11,070)
Unrealized loss (gain) on prepaid forward contracts (1,161) 2,628 —
Unrealized loss (gain) on natural gas transportation contracts 5,221 (21,695) (58,694)
Adjusted EBITDA $ 78,596 $ 110,429 $ 105,266
Add/(deduct):
Cash interest expense, net (16,840) (23,359) (24,265)
Cash taxes (930) (1,668) (3,042)
Maintenance capital expenditures (7,065) (8,855) (8,290)
Elimination of expense relating to incentive compensation and
directors fees expected to be paid in common units 1,664 8,437 8,182
Other 998 4,701 (2,954)
Distributable cash flow $ 56,423 $ 89,685 $ 74,897
Distributions declared for the period $ 36,141 $ 42,084 $ 35,490
Distribution coverage ratio 1.6x 2.1x 2.1x
Sprague Resources LP
Reconciliations of Non-GAAP Measures
$ in thousands
Year Ended
December 31, 2013 1
Year Ended
December 31, 2012 2
Pro Forma Net Income (Loss) to Pro Forma EBITDA, Pro Forma Adjusted EBITDA and Pro Forma Distributable Cash Flow
Pro forma net income (loss) $ (20,771) $ (9,181)
Add/(deduct):
Interest expense, net 27,475 21,268
Tax provision (benefit) (1,975) (651)
Depreciation and amortization 16,515 9,900
Pro forma EBITDA $ 21,244 $ 21,336
Add/(deduct):
Unrealized loss (gain) on inventory 4,188 227
Unrealized loss (gain) on natural gas transportation contracts 55,745 17,650
Write-off of deferred offering costs — 8,931
Bio-fuel excise tax credits (5,021) 5,021
Pro forma adjusted EBITDA $ 76,156 $ 53,165
Add/(deduct):
Cash interest expense, net (24,431) (17,856)
Cash taxes (6,156) 651
Maintenance capital expenditures (7,680) (5,897)
Estimated incremental selling, general and administrative expense
of being a publicly traded partnership, net (1,716) (2,058)
Elimination of expense relating to incentive compensation and
directors fees expected to be paid in common units 1,975 1,881
Other 1,915 58
Pro forma distributable cash flow $ 40,063 $ 29,944
Pro forma cash distributions $ 33,238 $ 33,238
Pro forma distribution coverage ratio 1.2x 0.9x
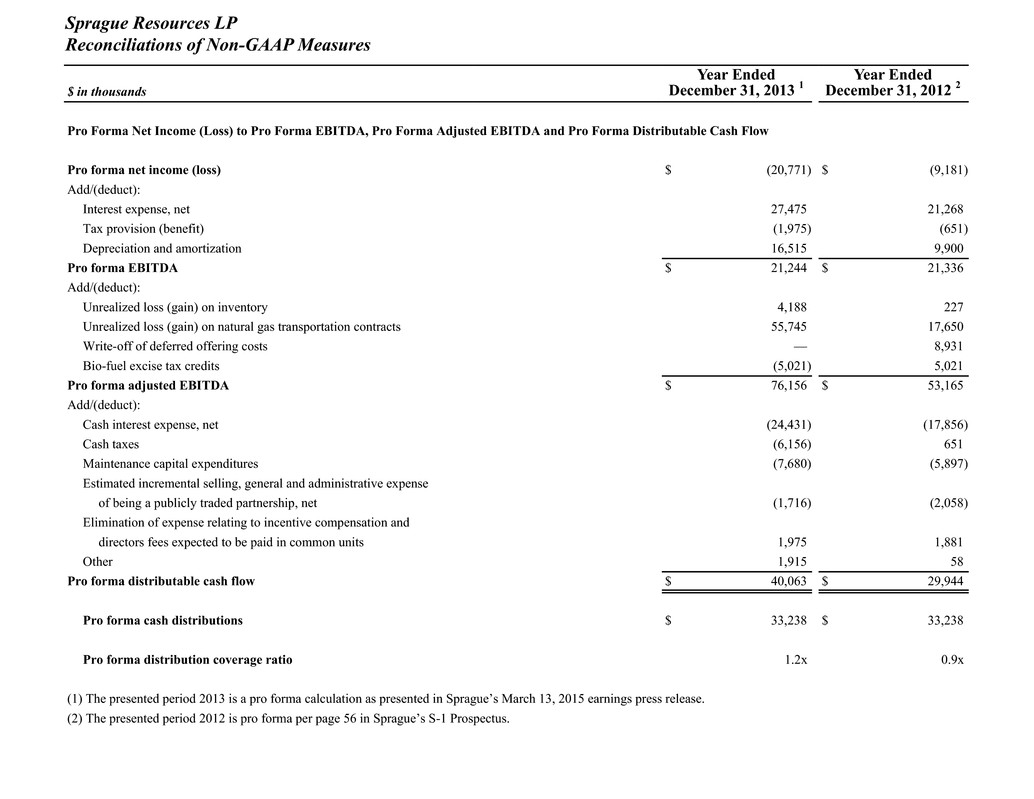
(1) The presented period 2013 is a pro forma calculation as presented in Sprague’s March 13, 2015 earnings press release.
(2) The presented period 2012 is pro forma per page 56 in Sprague’s S-1 Prospectus.

Sprague Resources LP
Reconciliations of Non-GAAP Measures
$ in thousands
As of
September 30, 2016
As of
June 30, 2016
As of
March 31, 2016
As of
December 31, 2015
Permanent Leverage Ratio
Acquisition facility $ 262,400 $ 264,400 $ 264,400 $ 283,400
Capital leases and other debt 5,904 6,159 4,981 5,200
Indebtedness for Credit Agreement Leverage Ratio $ 268,304 $ 270,559 $ 269,381 $ 288,600
Credit Agreement EBITDA (1)
Adjusted EBITDA $ 108,894 $ 102,179 $ 92,289 $ 110,429
Plus acquisition pro forma adjustments 2,560 7,864 13,702 —
Plus interest income 469 566 472 456
Plus non-cash expenses 41 699 981 1,589
Plus loss (minus gain) on sale of assets 330 311 311 (298)
Plus extraordinary, unusual or non-recurring losses and charges 876 1,045 1,253 1,544
Credit Agreement EBITDA $ 113,170 $ 112,664 $ 109,008 $ 113,720
Permanent Leverage Ratio 2.4x 2.4x 2.5x 2.5x
Liquidity - Working Capital Facility
Working capital borrowing base $ 446,733 $ 327,484 $ 395,474 $ 542,608
Working capital facility borrowings (301,412) (163,800) (262,570) (332,500)
Outstanding letters of credit (18,689) (9,802) (14,359) (23,628)
Liquidity - Working Capital Facility $ 126,632 $ 153,882 $ 118,545 $ 186,480
Liquidity - Acquisition Facility
Acquisition borrowing base $ 550,000 $ 550,000 $ 550,000 $ 400,000
Acquisition facility borrowings (262,400) (264,400) (264,400) (283,400)
Liquidity - Acquisition Facility $ 287,600 $ 285,600 $ 285,600 $ 116,600
(1) On a trailing twelve month basis
