Attached files
| file | filename |
|---|---|
| 8-K - 8-K - HERTZ GLOBAL HOLDINGS, INC | q32016earnings8-k.htm |
| EX-99.3 - EXHIBIT 99.3 - HERTZ GLOBAL HOLDINGS, INC | q32016exhibit993.htm |
| EX-99.1 - EXHIBIT 99.1 - HERTZ GLOBAL HOLDINGS, INC | pressreleaseq32016.htm |

1
3Q 2016 Earnings Call
November 8, 2016
8:00am ET

2
Safe Harbor Statement
Certain statements made within this presentation contain forward-looking statements, within the
meaning of the Private Securities Litigation Reform Act of 1995. Forward-looking statements are
not guarantees of performance and by their nature are subject to inherent uncertainties. Actual
results may differ materially. Any forward-looking information relayed in this presentation speaks
only as of November 7, 2016, and Hertz Global Holdings, Inc (the “Company”). The Company
undertakes no obligation to update that information to reflect changed circumstances.
Additional information concerning these statements is contained in the Company’s press release
regarding its Third Quarter 2016 results issued on November 7, 2016, and the Risk Factors and
Forward-Looking Statements sections of the Company’s Second Quarter 2016 Quarterly Report on
Form 10-Q filed on August 8, 2016 and Third Quarter 2016 Quarterly Report on Form 10-Q filed on
November 8, 2016. Copies of these filings are available from the SEC, the Hertz website or the
Company’s Investor Relations Department.
3Q
3
Non-GAAP Measures
THE FOLLOWING NON-GAAP* MEASURES WILL BE USED IN THE PRESENTATION:
Adjusted corporate EBITDA
Adjusted corporate EBITDA margin
Adjusted pre-tax income (loss)
Adjusted net income (loss)
Adjusted earnings (loss) per share
(Adjusted EPS)
Revenue per available car day (RACD)
Total RPD
Net depreciation per unit per month
Net non-vehicle debt
Net vehicle debt
Free cash flow
*Definitions and reconciliations of these non-GAAP measures are provided in the Company’s
third quarter 2016 press release and in the Company’s form 8-K filed on November 8, 2016.
3Q

4
Agenda
BUSINESS
OVERVIEW
John Tague
President & Chief Executive Officer
Hertz Global Holdings, Inc.
FINANCIAL RESULTS
OVERVIEW
Tom Kennedy
Chief Financial Officer
Hertz Global Holdings, Inc.
3Q

5
3Q/YTD:16 Consolidated Results
*Definitions and reconciliations of these non-GAAP measures are provided in the Company’s third quarter 2016 press release.
NM – Not Meaningful
3Q
GAAP
3Q:16
Results
3Q:15
Results
YoY
Change
3Q
YTD:16
Results
3Q
YTD:15
Results
YoY
Change
Revenue $2,542M $2,575M (1)% $6,794M $6,991M (3)%
Income (loss) from continuing operations
before income taxes
$108M $256M (58)% $(3)M $185M NM
Net Income (loss) from continuing operations $44M $217M (80)% $(36)M $152M NM
Diluted earnings (loss) per share from
continuing operations
$0.52 $2.38 (78)% $(0.42) $1.65 NM
Weighted Average Shares outstanding: Diluted 85M 91M 85M 92M
Non-GAAP*
Adjusted corporate EBITDA $329M $430M (23)% $541M $768M (30)%
Adjusted corporate EBITDA margin 13% 17% (370 bps) 8% 11% (300 bps)
Adjusted pre-tax income $212M $289M (27)% $159M $368M (57)%
Adjusted net income from continuing operations $134M $182M (26)% $100M $232M (57)%
Adjusted diluted EPS from continuing
operations
$1.58 $2.00 (21)% $1.18 $2.52 (53)%

6
3Q:16 YoY Adjusted Corporate EBITDA Bridge 3Q
1Vehicle contribution includes net depreciation rate, utilization and vehicle interest
• Cost savings not sufficient to fully offset revenue and vehicle contribution pressures
$430M
$329MAll Other
items
Full Potential Plan
Cost Savings
U.S. RAC
Vehicle
Contribution1
U.S. RAC
Revenue
Contribution
International RAC
Contribution
3Q:15 Actual 3Q:16 Actual
Annualization of 2015 Programs
IT Transformation/Integration
International fleet, DOE, SG&A
Personnel Productivity Savings
Fleet Efficiency Improvement
Off-Airport Footprint Rationalization
SG&A Optimization
Strategic Investments
Unique / 1x Items
Gross Collision
Storm Damages / Recall Activity
Delivery / Transportation
Reduction in China Auto Rental Equity Pickup

7
3Q 3Q YTD:16 Adjusted Corporate EBITDA Bridge
Consolidated Cost Savings
• FY:16E $350M full year savings
– 3Q:16 realized savings of ~$90M
– YTD 9/30/16 realized savings of
~$260M
• FY:15 realized savings of ~$230M
$768M
$541M
All Other
Items
Full Potential Plan
Cost Savings
U.S. RAC
Revenue
Contribution
U.S. RAC
Vehicle
Contribution1
International RAC
Contribution
3Q YTD:15 Actual
3Q YTD:16 Actual
• Cost savings offset by operation headwinds
1Vehicle contribution includes net depreciation rate, utilization and vehicle interest
Annualization of 2015 Programs
IT Transformation/Integration
International fleet, DOE, SG&A
Personnel Productivity Savings
Fleet Efficiency Improvement
Off-Airport Footprint Rationalization
SG&A Optimization
Strategic Investments
Gross Collisions
Storms Damage / Recall Activity
Reduction in China Auto Rental Equi y Pickup
8
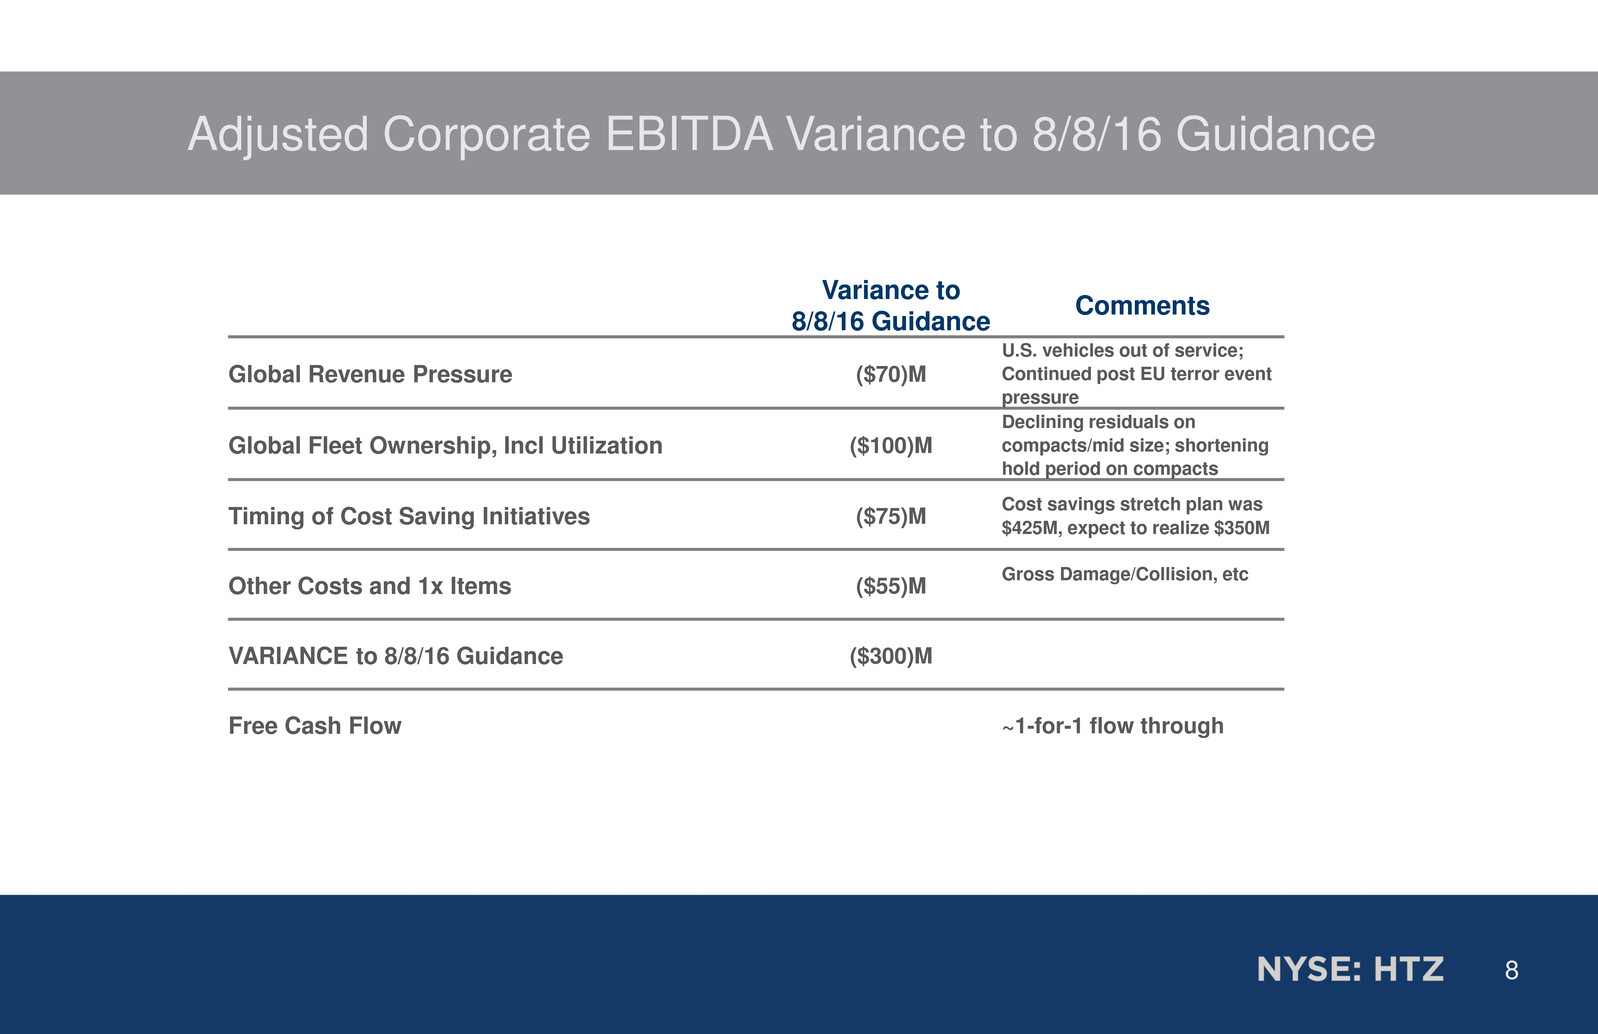
Adjusted Corporate EBITDA Variance to 8/8/16 Guidance
Variance to
8/8/16 Guidance
Comments
Global Revenue Pressure ($70)M
U.S. vehicles out of service;
Continued post EU terror event
pressure
Global Fleet Ownership, Incl Utilization ($100)M
Declining residuals on
compacts/mid size; shortening
hold period on compacts
Timing of Cost Saving Initiatives ($75)M
Cost savings stretch plan was
$425M, expect to realize $350M
Other Costs and 1x Items ($55)M
Gross Damage/Collision, etc
VARIANCE to 8/8/16 Guidance ($300)M
Free Cash Flow ~1-for-1 flow through

9
TOM KENNEDY
CHIEF FINANCIAL OFFICER
Hertz Global Holdings, Inc.
Quarterly Overview

10
3Q:16 U.S. RAC Revenue Performance
Revenue Days Rate
Vehicle Utilization (bps) Capacity RACD
-2% -2%
-8%
-2%
6%
2%
0% 1%
-8%
-10%
-5%
-3%
660 540 440
60 -2%
-5% -5%
2% 0%
-3%
0%
-4%
U.S. RAC (YOY quarterly results)
Revenue is defined as total revenue excluding ancillary retail car sales. Capacity is available cars days, see calculation in Q3:16 press release. Vehicle utilization is
calculated as transaction days divided by capacity. RACD calculated as Revenue divided by Capacity.
• Rate
• Q2:16 to Q3:16 YoY pricing improved 500bps
• RPD declined 1% YoY when adjusted for DTG
days counting methodology and non-rental related
declines such as fuel-related ancillary
• Volume
• Out-of-service vehicles due to recalls and weather
damage reduced utilization and capacity available
for rent
• Leisure volume flat, impacted by discontinuation
of Firefly brand in North America and YoY decline
in opaque channel use
• Business volume increased 3% on double-digit
increases in insurance replacement and
government offset by continued weakness in
corporate contracted volume
3Q:16 Performance Drivers
3Q
-5%
0%
-2%
260
-3%
1%

11
3Q
• Q3:16 last quarter of impact from DTG
transaction day counting methodology
• Expect ancillary fuel pricing pressure to
anniversary mid-Q1:17
• Customer mix shifted to lower yielding segments
due to corporate volume weakness
• Higher mix of longer-length rental volumes YoY,
OAP insurance replacement volume returns to
more normal demand levels
o Q3:16 insurance replacement volume +14%
YoY after 14% volume decline Q3:15 vs.
Q3:14
o Avg. length of insurance replacement rental
~15 days
• YoY impact of compact mix will anniversary by
1Q:17
3Q:16 U.S. RAC YoY Total RPD Bridge
3Q:16 Total RPD - Contribution to Negative YoY Variance (%)
Mix Impact:
higher rental
length, customer
mix, fleet mix
1.0%
1.0%
DTG Days
counting
Total RPD
decline
-2.9%
0.6%
1.0%
"Organic"
RPD
Growth
Fuel,
concessions
and other
non-rental
1.4% 1.5%
12
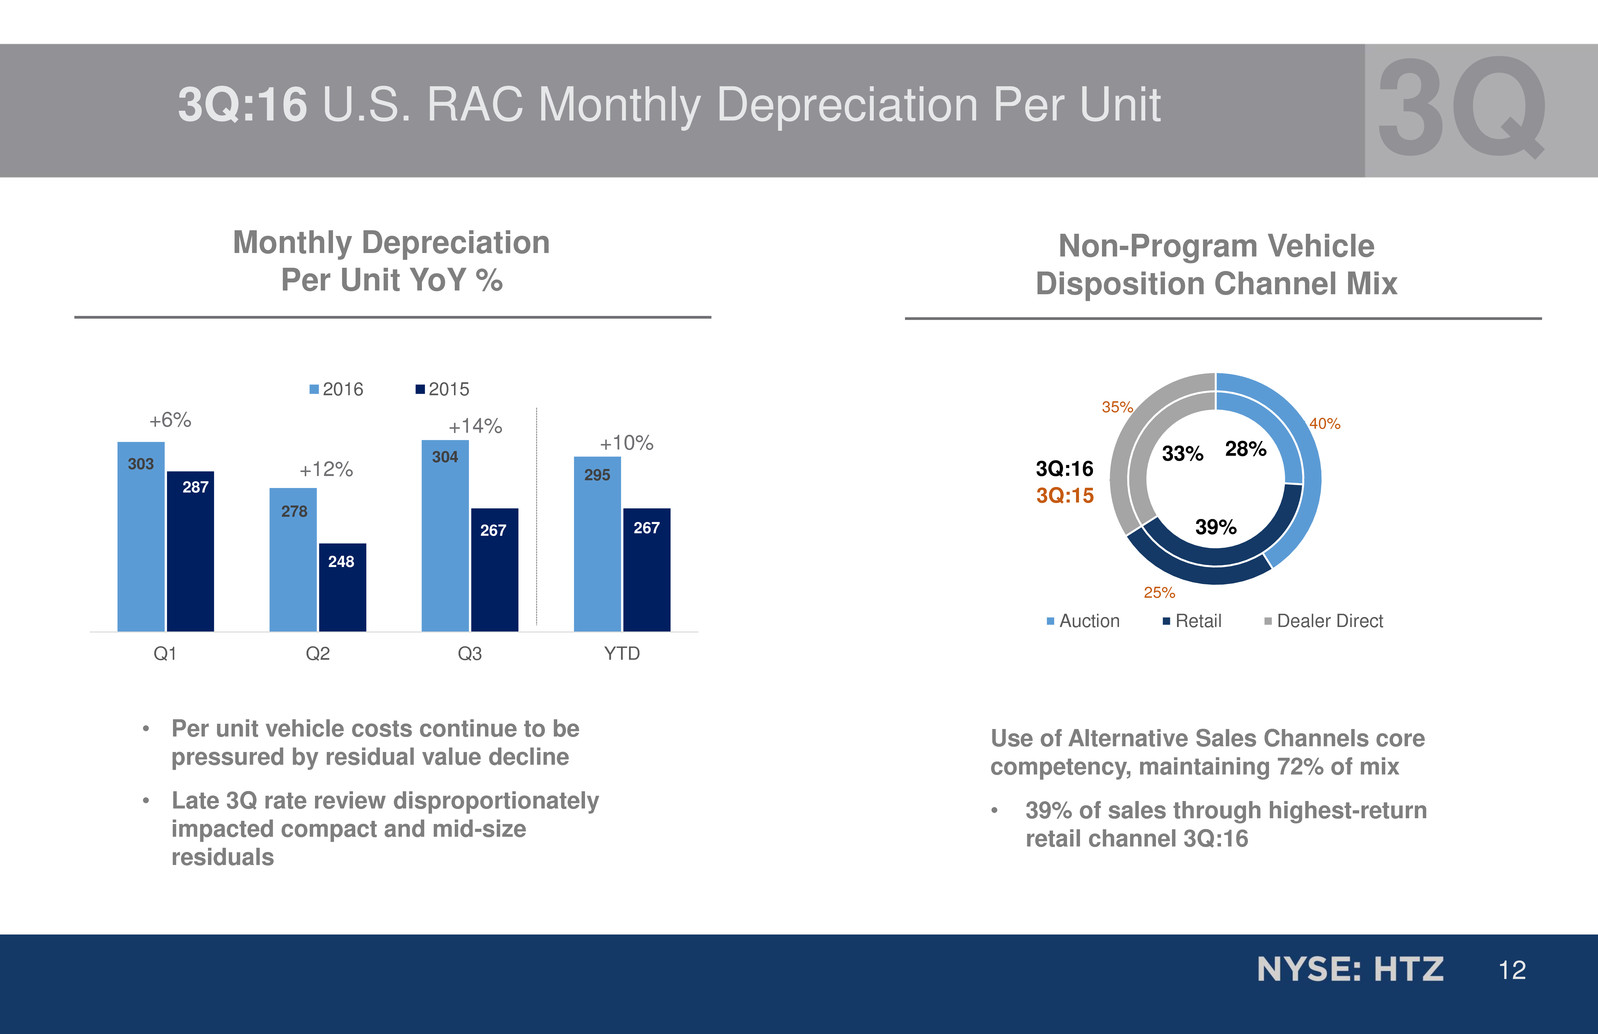
3Q:16 U.S. RAC Monthly Depreciation Per Unit 3Q
28%
39%
33%
40%
25%
35%
Auction Retail Dealer Direct
3Q:16
3Q:15
Use of Alternative Sales Channels core
competency, maintaining 72% of mix
• 39% of sales through highest-return
retail channel 3Q:16
Non-Program Vehicle
Disposition Channel Mix
Monthly Depreciation
Per Unit YoY %
• Per unit vehicle costs continue to be
pressured by residual value decline
• Late 3Q rate review disproportionately
impacted compact and mid-size
residuals
303
278
304
295
287
248
267 267
Q1 Q2 Q3 YTD
2016 2015 2015
+6%
+12%
+10%
+14%

13
3Q:16 International RAC 3Q
• 3Q:16 revenue increased 1% YoY, excluding FX
- Volume increased 2% despite greater than expected weakness in inbound long-haul business following recent terrorist attacks
in Europe
- Total RPD declined 1%, on a constant currency basis, due to impact of reduced pace of high-yielding inbound rentals
• Revenue per available car day decreased 2% YoY, on a constant currency basis
• Vehicle utilization remains unchanged YoY at 81%
• Net monthly depreciation per unit increased 1%, on a constant currency basis
• Adjusted corporate EBITDA declined $11M YoY

14
CASH FLOW / BALANCE SHEET
OVERVIEW
TOM KENNEDY
CHIEF FINANCIAL OFFICER
Hertz Global Holdings, Inc.

15
Liquidity and Debt Overview
9/30/16
Proforma for
6.75% Note
Redemption
Senior RCF
Availability
$1,100M $1,100M
Unrestricted Cash 1,430M 616M
Corporate Liquidity $2,530M $1,716M
• Executed ~$1.6 billion 3Q:16 financing transactions
– $800 million 5.50% Senior Note Issuance
– Proceeds used to refinance $800 million of 6.75% senior notes
maturing in 2019
– €225 million 4.125% European Vehicle Notes issuance
– Extension of $500 million Donlen (HFLF) VFN maturity date to
September, 2018.
• 4Q:16 planned refinancing activity focused on extending
three existing bank funded vehicle facilities
• Only $7M in non-vehicle debt maturities in 2017
• 5.2x net non-vehicle debt/LTM adj. corporate EBITDA;
Covenant leverage at 4.5x
Corporate Liquidity at September 30, 2016

16
1Reflects redemption of $800 million of the 6.75% Senior Notes due 2019 which occurred in October 2016. Excludes $27 million of Promissory Notes due
2028, and $11 million of other non-vehicle debt
2$600 million of letters of credit outstanding under the Senior RCF resulting in approximately $1.1 billion of available borrowing capacity.
$250
$450
$700
$500 $500
$800
$7
$7
$7
$7
$7 $7
$655
$1,700
2017 2018 2019 2020 2021 2022 2023 2024
Senior Notes Term Loan Undrawn Senior RCF
Non-Vehicle Debt Maturity Profile
• Pro Forma 9/30/16 Hertz Global Non-Vehicle Debt Maturity Stack12
($ in millions)

17
OUTLOOK

18
FY:16 Updated Financial Guidance
FY:16 Guidance
Adjusted Corporate EBITDA $575M - $625M
Non-vehicle capital expenditures, net $75M – $85M
Non-Vehicle cash interest expense $280M – $285M
Cash income taxes $60M – $65M
Free cash flow $250M – $300M
U.S. RAC net depreciation per unit per month $295 - $300
U.S. RAC fleet capacity growth (1.0)% to (1.5)%
U.S. RAC revenue growth (2.0)% to (3.0)%
Adjusted earnings per share1 $0.51-$0.88
1Assumes Tax rate 37%, shares outstanding 85M

19
Q&A
