Attached files
| file | filename |
|---|---|
| EX-99.1 - EXHIBIT 99.1 - Global Brokerage, Inc. | v452384_ex99-1.htm |
| 8-K - FORM 8-K - Global Brokerage, Inc. | v452384_8k.htm |
Exhibit 99.2
1 Third Quarter 2016 Financial and Operating Results October 2016 Customer Trading Metrics November 8, 2016
2 This presentation may contain "forward - looking statements" within the meaning of Section 27 A of the Securities Act of 1933 , Section 21 E of the Securities Exchange Act of 1934 and/or the Private Securities Litigation Reform Act of 1995 , which reflect FXCM's current views with respect to, among other things, its operations and financial performance in the future . These forward - looking statements are not historical facts and are based on current expectations, estimates and projections about FXCM's industry, management's beliefs and certain assumptions made by management, many of which, by their nature, are inherently uncertain and beyond our control . Accordingly, readers are cautioned that any such forward - looking statements are not guarantees of future performance and are subject to certain risks, uncertainties and assumptions that are difficult to predict including, without limitation, risks associated with the events that took place in the currency markets on January 15 , 2015 and their impact on FXCM's capital structure, risks associated with FXCM's ability to recover all or a portion of any capital losses, risks relating to the ability of FXCM to satisfy the terms and conditions of or make payments pursuant to the agreement with Leucadia, risks related to FXCM's dependence on FX market makers, market conditions, risks associated with the outcome of any potential litigation or regulatory inquiries to which FXCM may become subject, risks associated with potential reputational damage to FXCM resulting from the cybersecurity incident that was reported in a press release on October 1 , 2015 , and those other risks described under "Risk Factors" in FXCM Inc . 's Annual Report on Form 10 - K, FXCM Inc . ’s latest Quarterly Report on Form 10 - Q, and other reports or documents FXCM files with the SEC, from time to time, which are accessible on the SEC website at sec . gov . This information should also be read in conjunction with FXCM's Consolidated Financial Statements and the Notes thereto contained in FXCM's Annual Report on Form 10 - K, FXCM Inc . ’s latest Quarterly Report on Form 10 - Q and in other reports or documents the FXCM files with, or furnishes to, the SEC from time to time, which are accessible on the SEC website at sec . gov . FXCM undertakes no obligation to publicly update or review any forward - looking statement, whether as a result of new information, future developments or otherwise . Non - GAAP Financial Measures : This presentation presents certain non - GAAP financial measures . These measures should not be considered in isolation from, or as a substitute for, measures prepared in accordance with generally accepted accounting principles . See the appendix to this presentation for reconciliations of these non - GAAP financial measures to the most comparable measures calculated and presented in accordance with GAAP . Safe Harbor
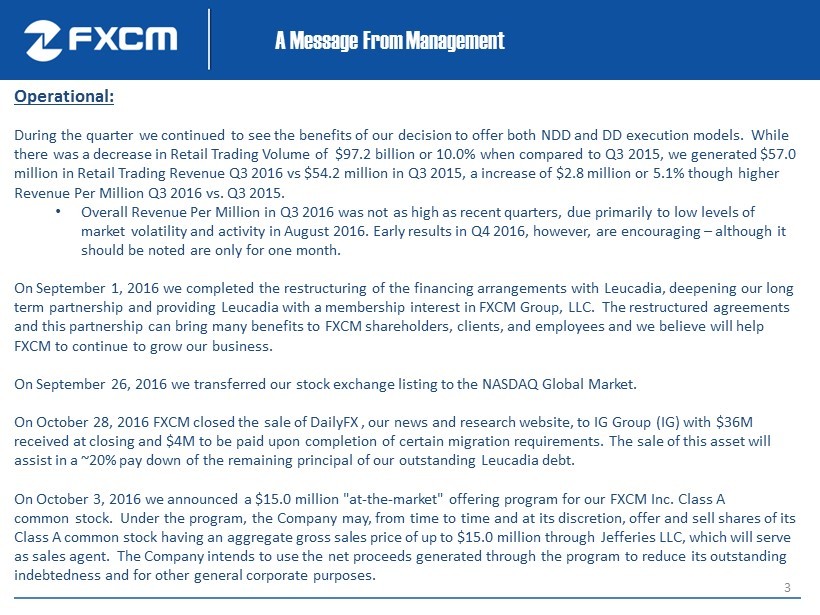
3 A Message From Management Operational: During the quarter we continued to see the benefits of our decision to offer both NDD and DD execution models. While there was a decrease in Retail Trading Volume of $97.2 billion or 10.0% when compared to Q3 2015, we generated $ 57.0 million in Retail Trading Revenue Q3 2016 vs $ 54.2 million in Q3 2015, a increase of $ 2.8 million or 5.1 % though higher Revenue Per Million Q3 2016 vs. Q3 2015. • Overall Revenue Per Million in Q3 2016 was not as high as recent quarters, due primarily to low levels of market volatility and activity in August 2016. Early results in Q4 2016, however, are encouraging – although it should be noted are only for one month. On September 1, 2016 we completed the restructuring of the financing arrangements with Leucadia, deepening our long term partnership and providing Leucadia with a membership interest in FXCM Group, LLC. The restructured agreements and this partnership can bring many benefits to FXCM shareholders, clients, and employees and we believe will help FXCM to continue to grow our business . On September 26, 2016 we transferred our stock exchange listing to the NASDAQ Global Market. On October 28, 2016 FXCM closed the sale of DailyFX , our news and research website, to IG Group ( IG) with $36M received at closing and $4M to be paid upon completion of certain migration requirements. The sale of this asset will assist in a ~20% pay down of the remaining principal of our outstanding Leucadia debt . On October 3, 2016 we announced a $ 15.0 million "at - the - market" offering program for our FXCM Inc. Class A common stock. Under the program, the Company may, from time to time and at its discretion, offer and sell shares of its Class A common stock having an aggregate gross sales price of up to $ 15.0 million through Jefferies LLC, which will serve as sales agent. The Company intends to use the net proceeds generated through the program to reduce its outstanding indebtedness and for other general corporate purposes.
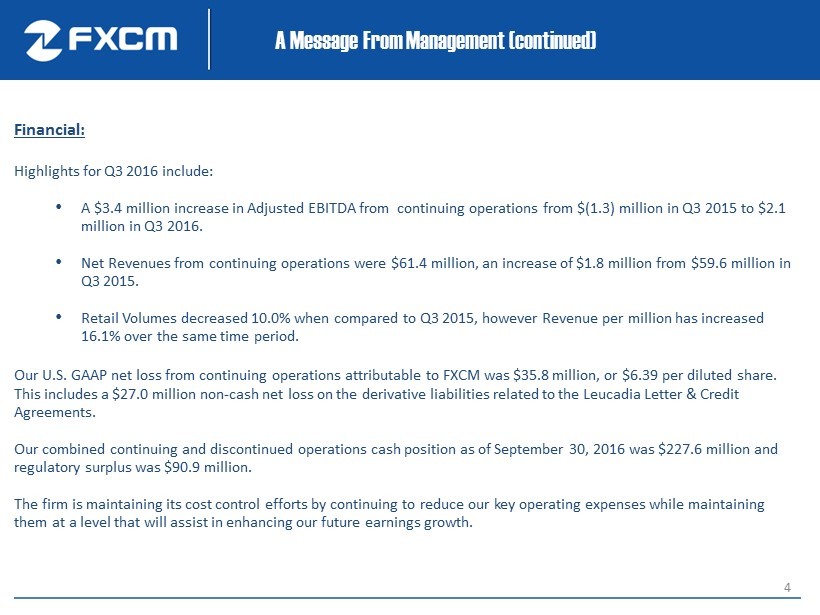
4 A Message From Management (continued) Financial: Highlights for Q3 2016 include: • A $3.4 million increase in Adjusted EBITDA from continuing operations from $(1.3) million in Q3 2015 to $2.1 million in Q3 2016. • Net Revenues from continuing operations were $61.4 million, an increase of $1.8 million from $59.6 million in Q3 2015 . • Retail Volumes decreased 10.0% when compared to Q3 2015, however Revenue per million has increased 16.1% over the same time period. Our U.S. GAAP net loss from continuing operations attributable to FXCM was $35.8 million, or $6.39 per diluted share. This includes a $27.0 million non - cash net loss on the derivative liabilities related to the Leucadia Letter & Credit Agreements. Our combined continuing and discontinued operations cash position as of September 30, 2016 was $227.6 million and regulatory surplus was $90.9 million. The firm is maintaining its cost control efforts by continuing to reduce our key operating expenses while maintaining them at a level that will assist in enhancing our future earnings growth.
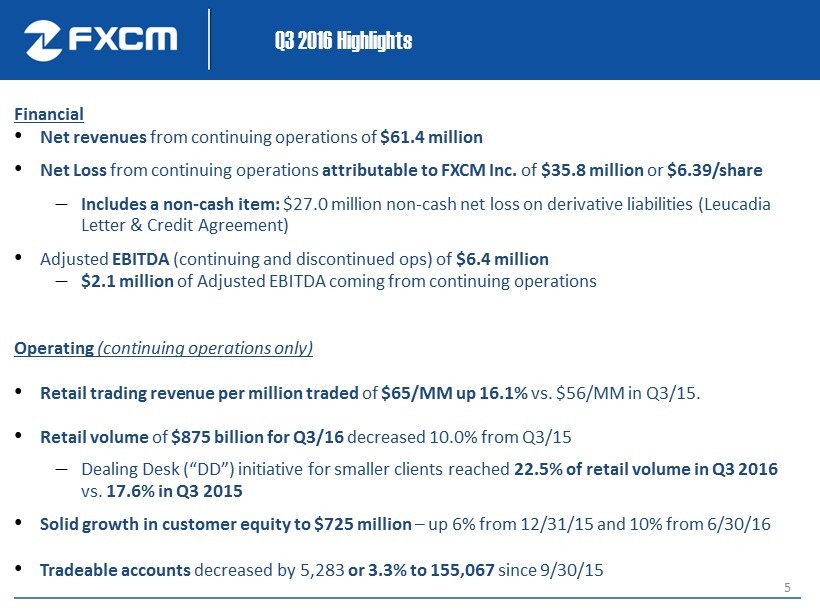
5 Q3 2016 Highlights Financial • Net revenues from continuing operations of $61.4 million • Net Loss from continuing operations attributable to FXCM Inc. of $35.8 million or $6.39/share Includes a non - cash item: $27.0 million non - cash net loss on derivative liabilities (Leucadia Letter & Credit Agreement) • Adjusted EBITDA (continuing and discontinued ops) of $6.4 million $2.1 million of Adjusted EBITDA coming from continuing operations Operating (continuing operations only) • Retail trading revenue per million traded of $65/MM up 16.1% vs. $56/MM in Q3/15. • Retail volume of $875 billion for Q3/16 decreased 10.0% from Q3/15 Dealing Desk (“DD”) initiative for smaller clients reached 22.5% of retail volume in Q3 2016 vs. 17.6% in Q3 2015 • Solid growth in customer equity to $725 million – up 6 % from 12/31/15 and 10% from 6/30/16 • Tradeable accounts decreased by 5,283 or 3.3% to 155,067 since 9/30/15
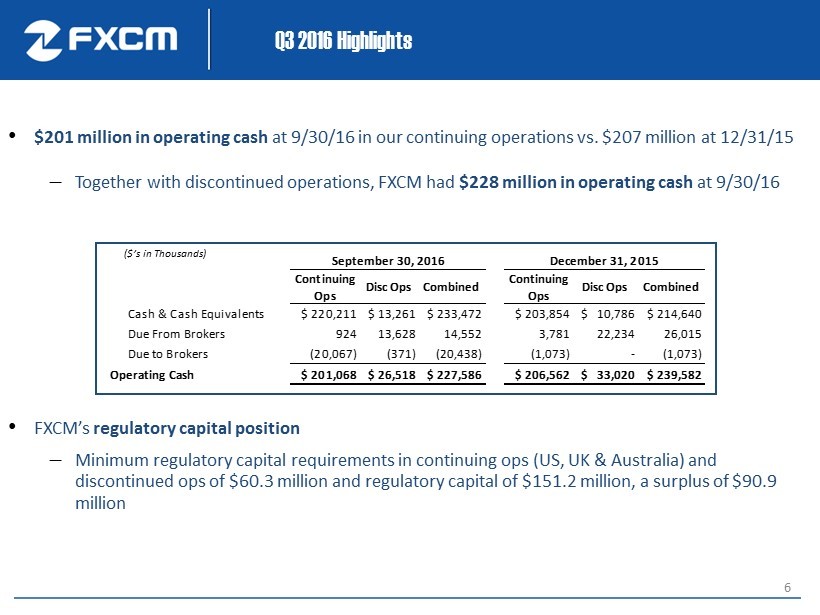
6 Q3 2016 Highlights • $201 million in operating cash at 9/30/16 in our continuing operations vs. $207 million at 12/31/15 Together with discontinued operations, FXCM had $228 million in operating cash at 9/30/16 • FXCM’s regulatory capital position Minimum regulatory capital requirements in continuing ops (US, UK & Australia) and discontinued ops of $ 60.3 million and regulatory capital of $ 151.2 million, a surplus of $ 90.9 million ($’s in Thousands) Continuing Ops Disc Ops Combined Continuing Ops Disc Ops Combined Cash & Cash Equivalents $ 220,211 $ 13,261 $ 233,472 $ 203,854 $ 10,786 $ 214,640 Due From Brokers 924 13,628 14,552 3,781 22,234 26,015 Due to Brokers (20,067) (371) (20,438) (1,073) - (1,073) Operating Cash $ 201,068 $ 26,518 $ 227,586 $ 206,562 $ 33,020 $ 239,582 September 30, 2016 December 31, 2015
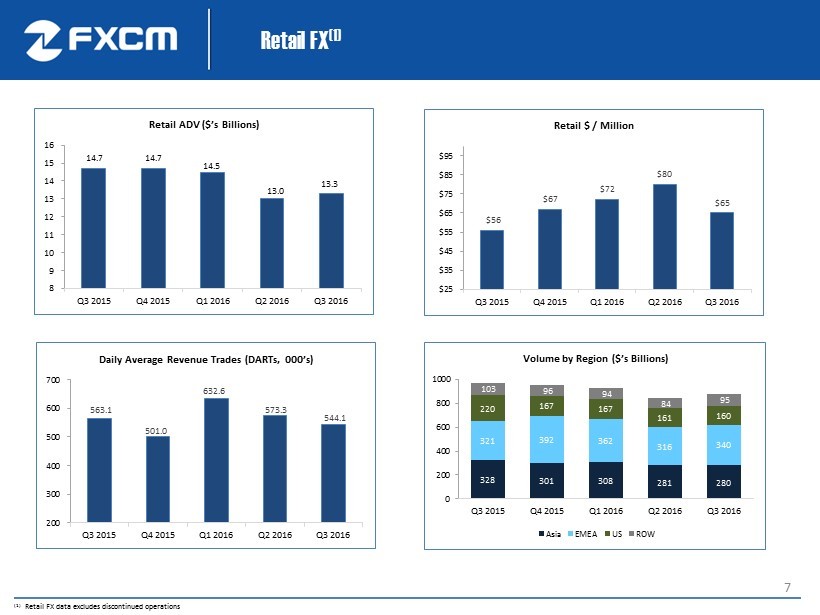
7 Retail FX (1) 14.7 14.7 14.5 13.0 13.3 8 9 10 11 12 13 14 15 16 Q3 2015 Q4 2015 Q1 2016 Q2 2016 Q3 2016 Retail ADV ($’s Billions) $56 $67 $72 $80 $65 $25 $35 $45 $55 $65 $75 $85 $95 Q3 2015 Q4 2015 Q1 2016 Q2 2016 Q3 2016 Retail $ / Million 563.1 501.0 632.6 573.3 544.1 200 300 400 500 600 700 Q3 2015 Q4 2015 Q1 2016 Q2 2016 Q3 2016 Daily Average Revenue Trades (DARTs, 000’s) 328 301 308 281 280 321 392 362 316 340 220 167 167 161 160 103 96 94 84 95 0 200 400 600 800 1000 Q3 2015 Q4 2015 Q1 2016 Q2 2016 Q3 2016 Volume by Region ($’s Billions) Asia EMEA US ROW (1) Retail FX data excludes discontinued operations
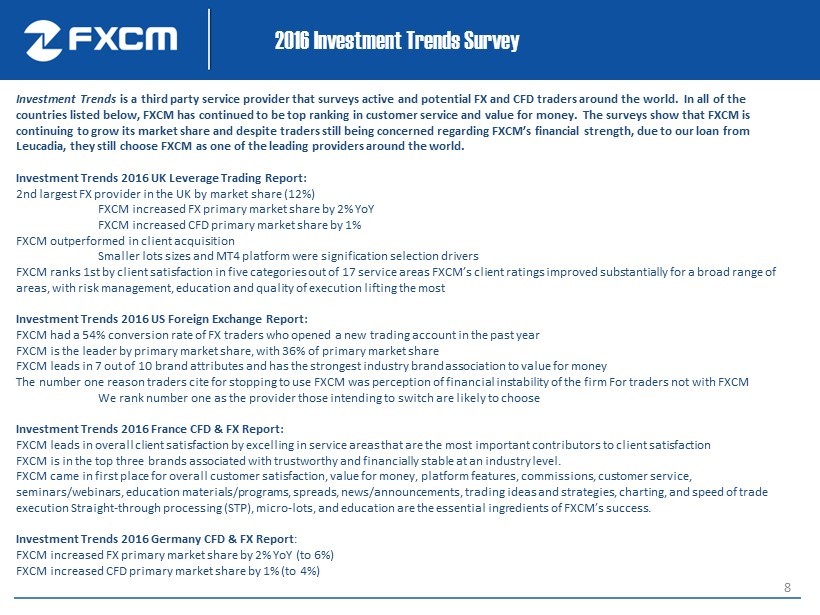
8 2016 Investment Trends Survey Investment Trends is a third party service provider that surveys active and potential FX and CFD traders around the world. In all of the countries listed below, FXCM has continued to be top ranking in customer service and value for money. The surveys show that FXC M is continuing to grow its market share and despite traders still being concerned regarding FXCM’s financial strength, due to our lo an from Leucadia, they still choose FXCM as one of the leading providers around the world. Investment Trends 2016 UK Leverage Trading Report: 2nd largest FX provider in the UK by market share (12%) FXCM increased FX primary market share by 2% YoY FXCM increased CFD primary market share by 1% FXCM outperformed in client acquisition Smaller lots sizes and MT4 platform were signification selection drivers FXCM ranks 1st by client satisfaction in five categories out of 17 service areas FXCM’s client ratings improved substantially for a b road range of areas, with risk management, education and quality of execution lifting the most Investment Trends 2016 US Foreign Exchange Report: FXCM had a 54% conversion rate of FX traders who opened a new trading account in the past year FXCM is the leader by primary market share, with 36% of primary market share FXCM leads in 7 out of 10 brand attributes and has the strongest industry brand association to value for money The number one reason traders cite for stopping to use FXCM was perception of financial instability of the firm For traders not w ith FXCM We rank number one as the provider those intending to switch are likely to choose Investment Trends 2016 France CFD & FX Report: FXCM leads in overall client satisfaction by excelling in service areas that are the most important contributors to client sa tis faction FXCM is in the top three brands associated with trustworthy and financially stable at an industry level. FXCM came in first place for overall customer satisfaction, value for money, platform features, commissions, customer service, seminars/webinars, education materials/programs, spreads, news/announcements, trading ideas and strategies, charting, and spe ed of trade execution Straight - through processing (STP), micro - lots, and education are the essential ingredients of FXCM’s success. Investment Trends 2016 Germany CFD & FX Report : FXCM increased FX primary market share by 2% YoY (to 6 %) FXCM increased CFD primary market share by 1% (to 4%)
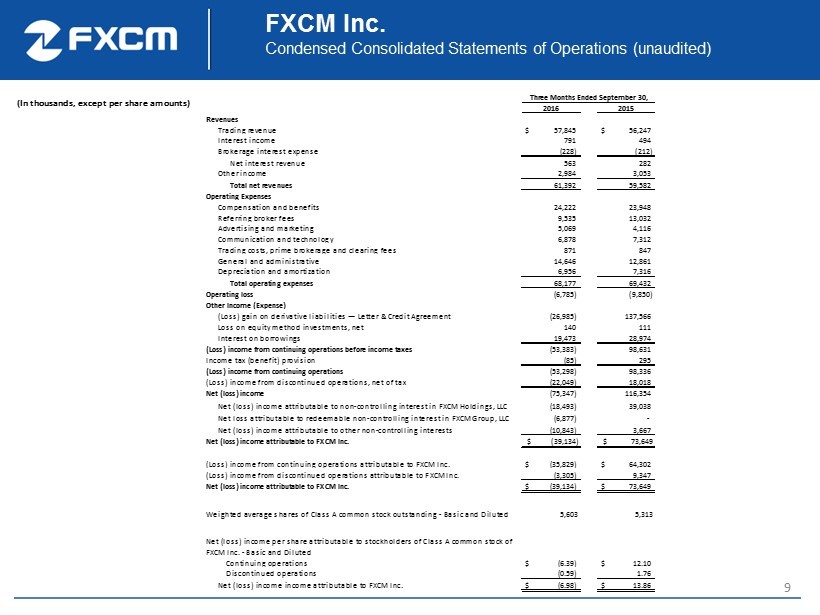
9 2016 2015 Revenues Trading revenue $ 57,845 $ 56,247 Interest income 791 494 Brokerage interest expense (228) (212) Net interest revenue 563 282 Other income 2,984 3,053 Total net revenues 61,392 59,582 Operating Expenses Compensation and benefits 24,222 23,948 Referring broker fees 9,535 13,032 Advertising and marketing 5,069 4,116 Communication and technology 6,878 7,312 Trading costs, prime brokerage and clearing fees 871 847 General and administrative 14,646 12,861 Depreciation and amortization 6,956 7,316 Total operating expenses 68,177 69,432 Operating loss (6,785) (9,850) Other Income (Expense) (Loss) gain on derivative liabilities — Letter & Credit Agreement (26,985) 137,566 Loss on equity method investments, net 140 111 Interest on borrowings 19,473 28,974 (Loss) income from continuing operations before income taxes (53,383) 98,631 Income tax (benefit) provision (85) 295 (Loss) income from continuing operations (53,298) 98,336 (Loss) income from discontinued operations, net of tax (22,049) 18,018 Net (loss) income (75,347) 116,354 Net (loss) income attributable to non-controlling interest in FXCM Holdings, LLC (18,493) 39,038 Net loss attributable to redeemable non-controlling interest in FXCM Group, LLC (6,877) - Net (loss) income attributable to other non-controlling interests (10,843) 3,667 Net (loss) income attributable to FXCM Inc. $ (39,134) $ 73,649 (Loss) income from continuing operations attributable to FXCM Inc. $ (35,829) $ 64,302 (Loss) income from discontinued operations attributable to FXCM Inc. (3,305) 9,347 Net (loss) income attributable to FXCM Inc. $ (39,134) $ 73,649 Weighted average shares of Class A common stock outstanding - Basic and Diluted 5,603 5,313 Net (loss) income per share attributable to stockholders of Class A common stock of FXCM Inc. - Basic and Diluted Continuing operations $ (6.39) $ 12.10 Discontinued operations (0.59) 1.76 Net (loss) income income attributable to FXCM Inc. $ (6.98) $ 13.86 Three Months Ended September 30, FXCM Inc. Condensed Consolidated Statements of Operations ( unaudited ) (In thousands, except per share amounts)
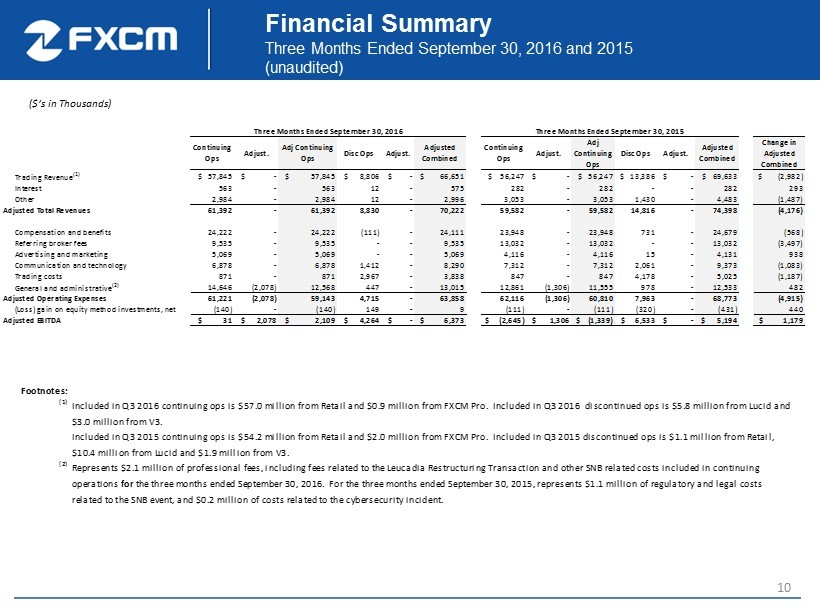
10 Financial Summary Three Months Ended September 30, 2016 and 2015 (unaudited ) ($’s in Thousands) Continuing Ops Adjust. Adj Continuing Ops Disc Ops Adjust. Adjusted Combined Continuing Ops Adjust. Adj Continuing Ops Disc Ops Adjust. Adjusted Combined Change in Adjusted Combined Trading Revenue (1) $ 57,845 $ - $ 57,845 $ 8,806 $ - $ 66,651 $ 56,247 $ - $ 56,247 $ 13,386 $ - $ 69,633 $ (2,982) Interest 563 - 563 12 - 575 282 - 282 - - 282 293 Other 2,984 - 2,984 12 - 2,996 3,053 - 3,053 1,430 - 4,483 (1,487) Adjusted Total Revenues 61,392 - 61,392 8,830 - 70,222 59,582 - 59,582 14,816 - 74,398 (4,176) Compensation and benefits 24,222 - 24,222 (111) - 24,111 23,948 - 23,948 731 - 24,679 (568) Referring broker fees 9,535 - 9,535 - - 9,535 13,032 - 13,032 - - 13,032 (3,497) Advertising and marketing 5,069 - 5,069 - - 5,069 4,116 - 4,116 15 - 4,131 938 Communication and technology 6,878 - 6,878 1,412 - 8,290 7,312 - 7,312 2,061 - 9,373 (1,083) Trading costs 871 - 871 2,967 - 3,838 847 - 847 4,178 - 5,025 (1,187) General and administrative (2) 14,646 (2,078) 12,568 447 - 13,015 12,861 (1,306) 11,555 978 - 12,533 482 Adjusted Operating Expenses 61,221 (2,078) 59,143 4,715 - 63,858 62,116 (1,306) 60,810 7,963 - 68,773 (4,915) (Loss) gain on equity method investments, net (140) - (140) 149 - 9 (111) - (111) (320) - (431) 440 Adjusted EBITDA $ 31 $ 2,078 $ 2,109 $ 4,264 $ - $ 6,373 $ (2,645) $ 1,306 $ (1,339) $ 6,533 $ - $ 5,194 $ 1,179 Three Months Ended September 30, 2016 Three Months Ended September 30, 2015 Footnotes: (1) Included in Q3 2016 continuing ops is $57.0 million from Retail and $0.9 million from FXCM Pro. Included in Q3 2016 discontinued ops is $5.8 million from Lucid and $3.0 million from V3. Included in Q3 2015 continuing ops is $54.2 million from Retail and $2.0 million from FXCM Pro. Included in Q3 2015 discontinued ops is $1.1 million from Retail, $10.4 million from Lucid and $1.9 million from V3. (2) Represents $2.1 million of professional fees, including fees related to the Leucadia Restructuring Transaction and other SNB related costs included in continuing operations for the three months ended September 30, 2016. For the three months ended September 30, 2015, represents $1.1 million of regulatory and legal costs related to the SNB event, and $0.2 million of costs related to the cybersecurity incident.
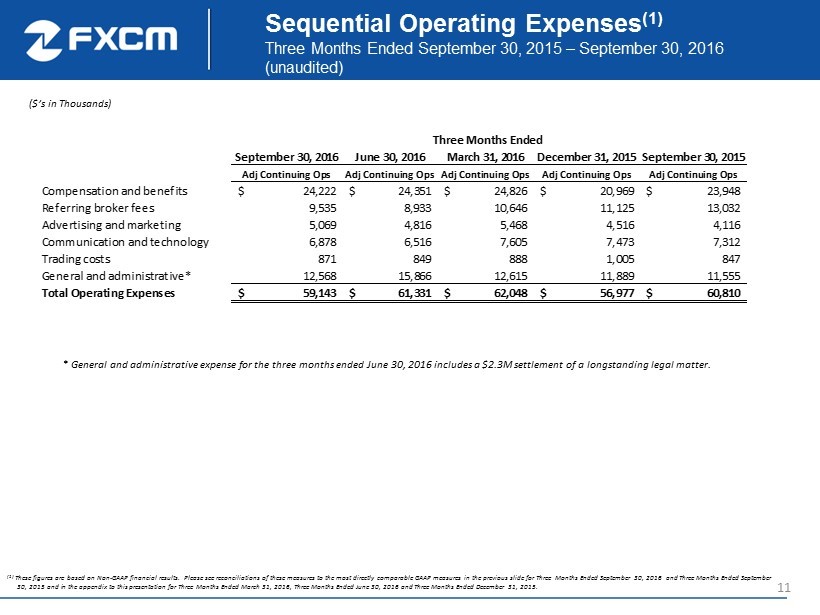
11 Sequential Operating Expenses (1) Three Months Ended September 30, 2015 – September 30, 2016 (unaudited) ($’s in Thousands) (1) These figures are based on Non - GAAP financial results. Please see reconciliations of these measures to the most directly compar able GAAP measures in the previous slide for Three Months Ended September 30, 2016 and Three Months Ended September 30, 2015 and in the appendix to this presentation for Three Months Ended March 31, 2016, Three Months Ended June 30, 2016 and Three Months Ended December 31, 2015. * General and administrative expense for the three months ended June 30, 2016 includes a $2.3M settlement of a longstanding leg al matter. September 30, 2016 June 30, 2016 March 31, 2016 December 31, 2015September 30, 2015 Adj Continuing Ops Adj Continuing Ops Adj Continuing Ops Adj Continuing Ops Adj Continuing Ops Compensation and benefits 24,222$ 24,351$ 24,826$ 20,969$ 23,948$ Referring broker fees 9,535 8,933 10,646 11,125 13,032 Advertising and marketing 5,069 4,816 5,468 4,516 4,116 Communication and technology 6,878 6,516 7,605 7,473 7,312 Trading costs 871 849 888 1,005 847 General and administrative* 12,568 15,866 12,615 11,889 11,555 Total Operating Expenses 59,143$ 61,331$ 62,048$ 56,977$ 60,810$ Three Months Ended
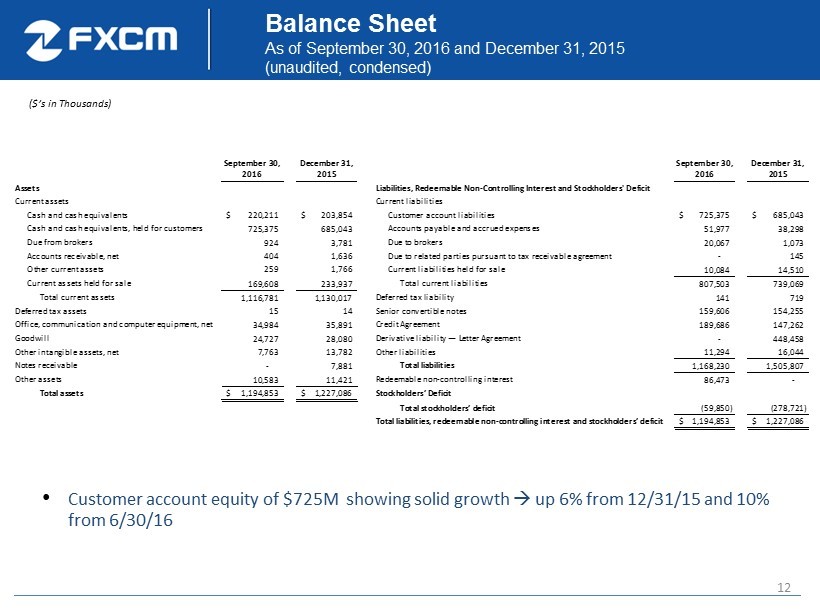
12 Balance Sheet As of September 30, 2016 and December 31, 2015 ( unaudited, condensed) ($’s in Thousands) September 30, 2016 December 31, 2015 September 30, 2016 December 31, 2015 Assets Liabilities, Redeemable Non-Controlling Interest and Stockholders' Deficit Current assets Current liabilities Cash and cash equivalents 220,211$ 203,854$ Customer account liabilities 725,375$ 685,043$ Cash and cash equivalents, held for customers 725,375 685,043 Accounts payable and accrued expenses 51,977 38,298 Due from brokers 924 3,781 Due to brokers 20,067 1,073 Accounts receivable, net 404 1,636 Due to related parties pursuant to tax receivable agreement - 145 Other current assets 259 1,766 Current liabilities held for sale 10,084 14,510 Current assets held for sale 169,608 233,937 Total current liabilities 807,503 739,069 Total current assets 1,116,781 1,130,017 Deferred tax liability 141 719 Deferred tax assets 15 14 Senior convertible notes 159,606 154,255 Office, communication and computer equipment, net 34,984 35,891 Credit Agreement 189,686 147,262 Goodwill 24,727 28,080 Derivative liability — Letter Agreement - 448,458 Other intangible assets, net 7,763 13,782 Other liabilities 11,294 16,044 Notes receivable - 7,881 Total liabilities 1,168,230 1,505,807 Other assets 10,583 11,421 Redeemable non-controlling interest 86,473 - Total assets 1,194,853$ 1,227,086$ Stockholders’ Deficit Total stockholders’ deficit (59,850) (278,721) Total liabilities, redeemable non-controlling interest and stockholders’ deficit 1,194,853$ 1,227,086$ Customer account equity of $725M showing solid growth up 6% from 12/31/15 and 10% from 6/30/16
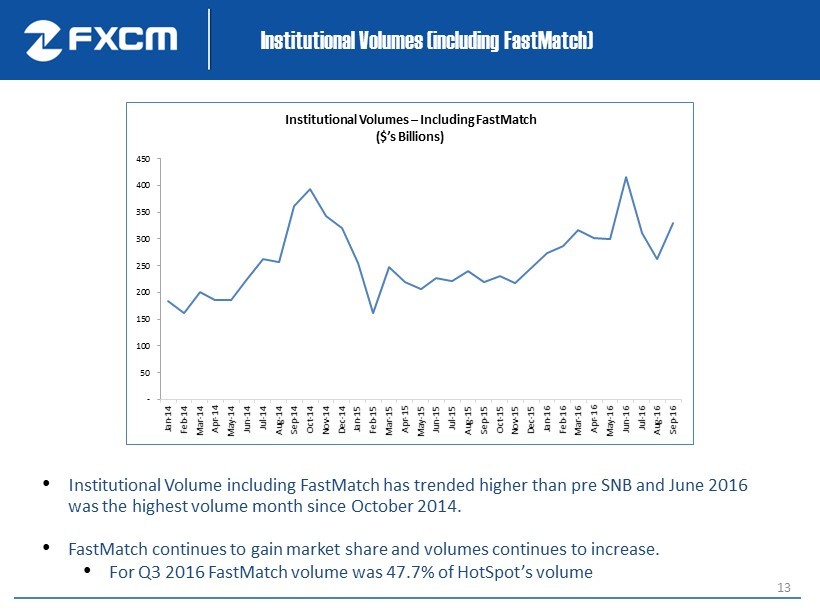
13 Institutional Volumes (including FastMatch ) - 50 100 150 200 250 300 350 400 450 Jan-14 Feb-14 Mar-14 Apr-14 May-14 Jun-14 Jul-14 Aug-14 Sep-14 Oct-14 Nov-14 Dec-14 Jan-15 Feb-15 Mar-15 Apr-15 May-15 Jun-15 Jul-15 Aug-15 Sep-15 Oct-15 Nov-15 Dec-15 Jan-16 Feb-16 Mar-16 Apr-16 May-16 Jun-16 Jul-16 Aug-16 Sep-16 Institutional Volumes – Including FastMatch ($’s Billions) • Institutional Volume including FastMatch has trended higher than pre SNB and June 2016 was the highest volume month since October 2014. • FastMatch continues to gain market share and volumes continues to increase. • For Q3 2016 FastMatch volume was 47.7% of HotSpot’s volume
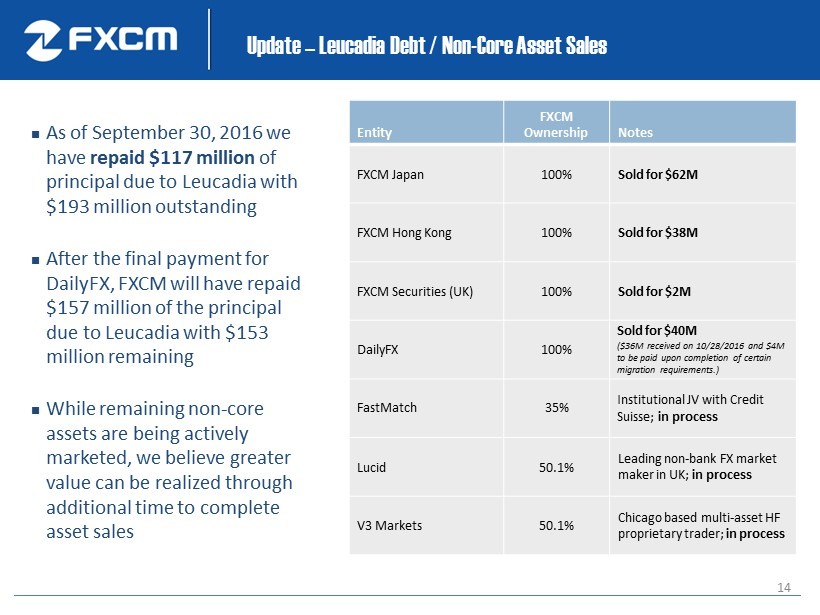
14 Update – Leucadia Debt / Non - Core Asset Sales As of September 30, 2016 we have repaid $117 million of principal due to Leucadia with $193 million outstanding After the final payment for DailyFX , FXCM will have repaid $157 million of the principal due to Leucadia with $153 million remaining While remaining non - core assets are being actively marketed, we believe greater value can be realized through additional time to complete asset sales Entity FXCM Ownership Notes FXCM Japan 100% Sold for $62M FXCM Hong Kong 100% Sold for $38M FXCM Securities (UK) 100% Sold for $2M DailyFX 100% Sold for $40M ($36M received on 10/28/2016 and $4M t o be paid upon completion of certain migration requirements.) FastMatch 35% Institutional JV with Credit Suisse; in process Lucid 50.1% Leading non - bank FX market maker in UK; in process V3 Markets 50.1% Chicago based multi - asset HF proprietary trader; in process
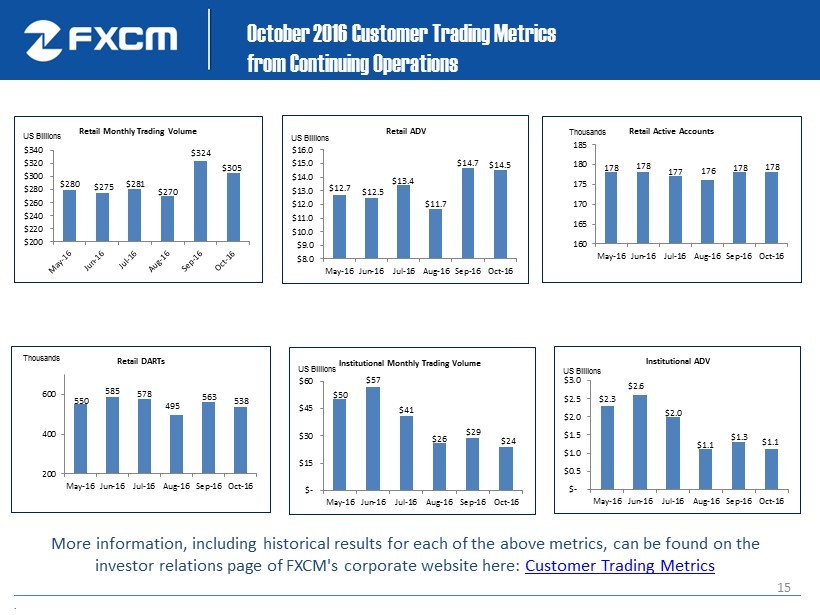
15 178 178 177 176 178 178 160 165 170 175 180 185 May-16 Jun-16 Jul-16 Aug-16 Sep-16 Oct-16 Retail Active Accounts $12.7 $12.5 $13.4 $11.7 $14.7 $14.5 $8.0 $9.0 $10.0 $11.0 $12.0 $13.0 $14.0 $15.0 $16.0 May-16 Jun-16 Jul-16 Aug-16 Sep-16 Oct-16 Retail ADV US Billions $50 $57 $41 $26 $29 $24 $- $15 $30 $45 $60 May-16 Jun-16 Jul-16 Aug-16 Sep-16 Oct-16 Institutional Monthly Trading Volume US Billions $2.3 $2.6 $2.0 $1.1 $1.3 $1.1 $- $0.5 $1.0 $1.5 $2.0 $2.5 $3.0 May-16 Jun-16 Jul-16 Aug-16 Sep-16 Oct-16 Institutional ADV US Billions October 2016 Customer Trading Metrics from Continuing Operations . Thousands 550 585 578 495 563 538 200 400 600 May-16 Jun-16 Jul-16 Aug-16 Sep-16 Oct-16 Retail DARTs Thousands More information, including historical results for each of the above metrics, can be found on the investor relations page of FXCM's corporate website here: Customer Trading Metrics $280 $275 $281 $270 $324 $305 $200 $220 $240 $260 $280 $300 $320 $340 Retail Monthly Trading Volume US Billions
16 Summary ● The restructured arrangement with Leucadia offers greater financial flexibility, provides additional marketing strength for FXCM going forward and deepens the partnership with Leucadia by providing Leucadia with a membership interest in FXCM Group, LLC . ● We continue to accelerate the growth of our business through a number of FX and CFD initiatives: Launched single share CFDs, an important market for a number of our customers. We soft launched a single share CFD offering with certain customers and recently expanded the offering to certain customers on our proprietary Trading Station platform. We are continuing a broader roll - out over the remainder of the year . ● We further expanded the dealing desk model for small retail FX customers who are less interested in an agency FX offering, which in turn has had a favorable effect on our revenue per million . ● We recently implemented a number of new features and tools to enhance our customers’ trading experience: Introduced historical Forex Spreads Data allowing clients to back test trading strategies Launched a new Forex Market Depth Indicator on the Trading Station platform providing insights to levels of liquidity and depth for frequently traded currency pairs Added features to the Trading Station platform for margin monitoring, simulations and search functionality Added enhancements to our API technology services for algorithmic and institutional traders

17 Appendix
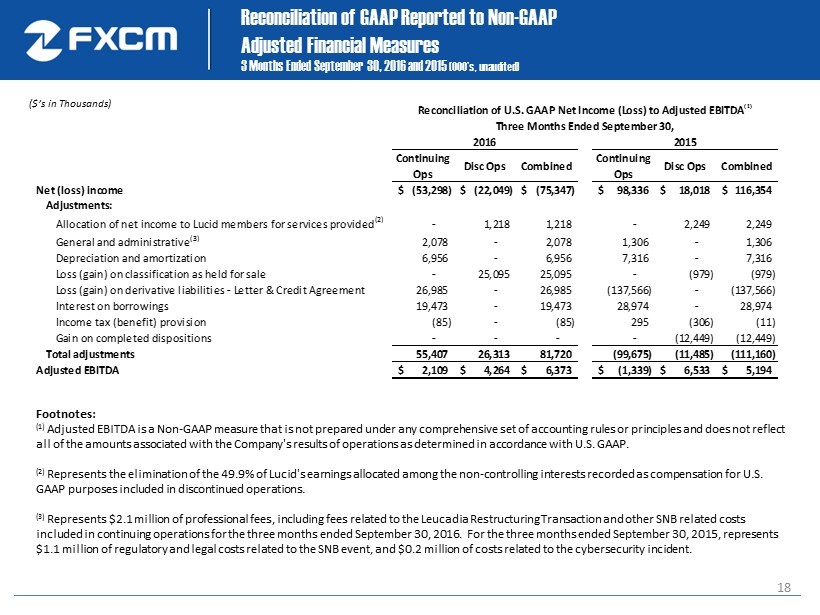
18 Reconciliation of GAAP Reported to Non - GAAP Adjusted Financial Measures 3 Months Ended September 30, 2016 and 2015 ( 000’s, unaudited) ($’s in Thousands) Footnotes: (1) Adjusted EBITDA is a Non - GAAP measure that is not prepared under any comprehensive set of accounting rules or principles and does not ref lect all of the amounts associated with the Company's results of operations as determined in accordance with U.S. GAAP . ( 2) Represents the elimination of the 49.9% of Lucid's earnings allocated among the non - controlling interests recorded as compensation for U.S. GAAP purposes included in discontinued operations . ( 3) Represents $ 2.1 million of professional fees, including fees related to the Leucadia Restructuring Transaction and other SNB related costs included in continuing operations for the three months ended September 30, 2016. For the three months ended September 30, 2015, represents $1.1 million of regulatory and legal costs related to the SNB event, and $0.2 million of costs related to the cybersecurity i nci dent. Continuing Ops Disc Ops Combined Continuing Ops Disc Ops Combined Net (loss) income (53,298)$ (22,049)$ (75,347)$ 98,336$ 18,018$ 116,354$ Adjustments: Allocation of net income to Lucid members for services provided (2) - 1,218 1,218 - 2,249 2,249 General and administrative (3) 2,078 - 2,078 1,306 - 1,306 Depreciation and amortization 6,956 - 6,956 7,316 - 7,316 Loss (gain) on classification as held for sale - 25,095 25,095 - (979) (979) Loss (gain) on derivative liabilities - Letter & Credit Agreement 26,985 - 26,985 (137,566) - (137,566) Interest on borrowings 19,473 - 19,473 28,974 - 28,974 Income tax (benefit) provision (85) - (85) 295 (306) (11) Gain on completed dispositions - - - - (12,449) (12,449) Total adjustments 55,407 26,313 81,720 (99,675) (11,485) (111,160) Adjusted EBITDA 2,109$ 4,264$ 6,373$ (1,339)$ 6,533$ 5,194$ Reconciliation of U.S. GAAP Net Income (Loss) to Adjusted EBITDA (1) Three Months Ended September 30, 2016 2015
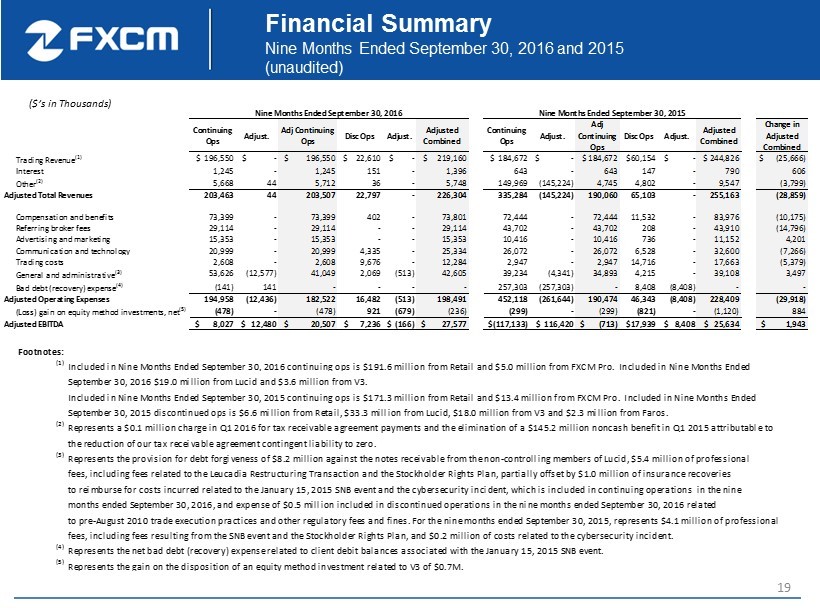
19 Financial Summary Nine Months Ended September 30, 2016 and 2015 (unaudited ) ($’s in Thousands) Continuing Ops Adjust. Adj Continuing Ops Disc Ops Adjust. Adjusted Combined Continuing Ops Adjust. Adj Continuing Ops Disc Ops Adjust. Adjusted Combined Change in Adjusted Combined Trading Revenue (1) $ 196,550 $ - $ 196,550 $ 22,610 $ - $ 219,160 $ 184,672 $ - $ 184,672 $60,154 $ - $ 244,826 $ (25,666) Interest 1,245 - 1,245 151 - 1,396 643 - 643 147 - 790 606 Other (2) 5,668 44 5,712 36 - 5,748 149,969 (145,224) 4,745 4,802 - 9,547 (3,799) Adjusted Total Revenues 203,463 44 203,507 22,797 - 226,304 335,284 (145,224) 190,060 65,103 - 255,163 (28,859) Compensation and benefits 73,399 - 73,399 402 - 73,801 72,444 - 72,444 11,532 - 83,976 (10,175) Referring broker fees 29,114 - 29,114 - - 29,114 43,702 - 43,702 208 - 43,910 (14,796) Advertising and marketing 15,353 - 15,353 - - 15,353 10,416 - 10,416 736 - 11,152 4,201 Communication and technology 20,999 - 20,999 4,335 - 25,334 26,072 - 26,072 6,528 - 32,600 (7,266) Trading costs 2,608 - 2,608 9,676 - 12,284 2,947 - 2,947 14,716 - 17,663 (5,379) General and administrative (3) 53,626 (12,577) 41,049 2,069 (513) 42,605 39,234 (4,341) 34,893 4,215 - 39,108 3,497 Bad debt (recovery) expense (4) (141) 141 - - - - 257,303 (257,303) - 8,408 (8,408) - - Adjusted Operating Expenses 194,958 (12,436) 182,522 16,482 (513) 198,491 452,118 (261,644) 190,474 46,343 (8,408) 228,409 (29,918) (Loss) gain on equity method investments, net (5) (478) - (478) 921 (679) (236) (299) - (299) (821) - (1,120) 884 Adjusted EBITDA $ 8,027 $ 12,480 $ 20,507 $ 7,236 $ (166) $ 27,577 $(117,133) $ 116,420 $ (713) $17,939 $ 8,408 $ 25,634 $ 1,943 Nine Months Ended September 30, 2016 Nine Months Ended September 30, 2015 Footnotes: (1) Included in Nine Months Ended September 30, 2016 continuing ops is $191.6 million from Retail and $5.0 million from FXCM Pro. Included in Nine Months Ended September 30, 2016 $19.0 million from Lucid and $3.6 million from V3. Included in Nine Months Ended September 30, 2015 continuing ops is $171.3 million from Retail and $13.4 million from FXCM Pro. Included in Nine Months Ended September 30, 2015 discontinued ops is $6.6 million from Retail, $33.3 million from Lucid, $18.0 million from V3 and $2.3 million from Faros. (2) Represents a $0.1 million charge in Q1 2016 for tax receivable agreement payments and the elimination of a $145.2 million noncash benefit in Q1 2015 attributable to the reduction of our tax receivable agreement contingent liability to zero. (3) Represents the provision for debt forgiveness of $8.2 million against the notes receivable from the non-controlling members of Lucid, $5.4 million of professional fees, including fees related to the Leucadia Restructuring Transaction and the Stockholder Rights Plan, partially offset by $1.0 million of insurance recoveries to reimburse for costs incurred related to the January 15, 2015 SNB event and the cybersecurity incident, which is included in continuing operations in the nine months ended September 30, 2016, and expense of $0.5 million included in discontinued operations in the nine months ended September 30, 2016 related to pre-August 2010 trade execution practices and other regulatory fees and fines. For the nine months ended September 30, 2015, represents $4.1 million of professional fees, including fees resulting from the SNB event and the Stockholder Rights Plan, and $0.2 million of costs related to the cybersecurity incident. (4) Represents the net bad debt (recovery) expense related to client debit balances associated with the January 15, 2015 SNB event. (5) Represents the gain on the disposition of an equity method investment related to V3 of $0.7M.
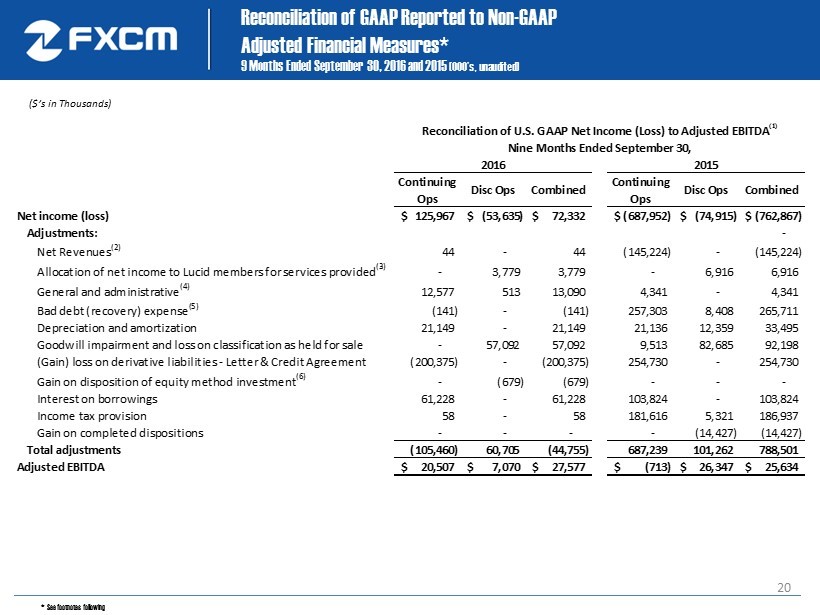
20 * See footnotes following Reconciliation of GAAP Reported to Non - GAAP Adjusted Financial Measures* 9 Months Ended September 30, 2016 and 2015 ( 000’s, unaudited) ($’s in Thousands) Continuing Ops Disc Ops Combined Continuing Ops Disc Ops Combined Net income (loss) 125,967$ (53,635)$ 72,332$ (687,952)$ (74,915)$ (762,867)$ Adjustments: - Net Revenues (2) 44 - 44 (145,224) - (145,224) Allocation of net income to Lucid members for services provided (3) - 3,779 3,779 - 6,916 6,916 General and administrative (4) 12,577 513 13,090 4,341 - 4,341 Bad debt (recovery) expense (5) (141) - (141) 257,303 8,408 265,711 Depreciation and amortization 21,149 - 21,149 21,136 12,359 33,495 Goodwill impairment and loss on classification as held for sale - 57,092 57,092 9,513 82,685 92,198 (Gain) loss on derivative liabilities - Letter & Credit Agreement (200,375) - (200,375) 254,730 - 254,730 Gain on disposition of equity method investment (6) - (679) (679) - - - Interest on borrowings 61,228 - 61,228 103,824 - 103,824 Income tax provision 58 - 58 181,616 5,321 186,937 Gain on completed dispositions - - - - (14,427) (14,427) Total adjustments (105,460) 60,705 (44,755) 687,239 101,262 788,501 Adjusted EBITDA 20,507$ 7,070$ 27,577$ (713)$ 26,347$ 25,634$ 2016 2015 Reconciliation of U.S. GAAP Net Income (Loss) to Adjusted EBITDA (1) Nine Months Ended September 30,
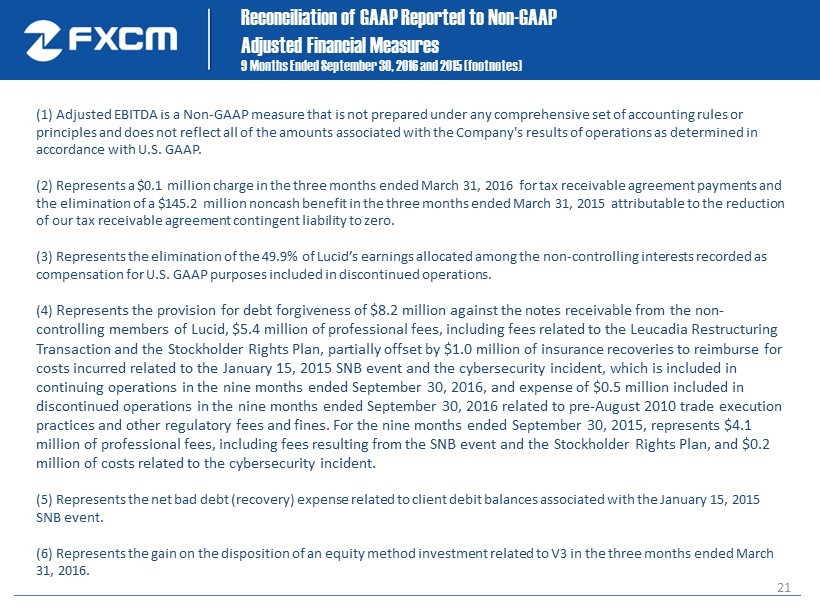
21 Reconciliation of GAAP Reported to Non - GAAP Adjusted Financial Measures 9 Months Ended September 30, 2016 and 2015 (footnotes ) ( 1) Adjusted EBITDA is a Non - GAAP measure that is not prepared under any comprehensive set of accounting rules or principles and does not reflect all of the amounts associated with the Company's results of operations as determined in accordance with U.S. GAAP. (2) Represents a $0.1 million charge in the three months ended March 31, 2016 for tax receivable agreement payments and the elimination of a $145.2 million noncash benefit in the three months ended March 31, 2015 attributable to the reduction of our tax receivable agreement contingent liability to zero. (3) Represents the elimination of the 49.9% of Lucid’s earnings allocated among the non - controlling interests recorded as compensation for U.S. GAAP purposes included in discontinued operations. (4) Represents the provision for debt forgiveness of $8.2 million against the notes receivable from the non - controlling members of Lucid, $5.4 million of professional fees, including fees related to the Leucadia Restructuring Transaction and the Stockholder Rights Plan, partially offset by $1.0 million of insurance recoveries to reimburse for costs incurred related to the January 15, 2015 SNB event and the cybersecurity incident, which is included in continuing operations in the nine months ended September 30, 2016, and expense of $0.5 million included in discontinued operations in the nine months ended September 30, 2016 related to pre - August 2010 trade execution practices and other regulatory fees and fines. For the nine months ended September 30, 2015, represents $4.1 million of professional fees, including fees resulting from the SNB event and the Stockholder Rights Plan, and $0.2 million of costs related to the cybersecurity incident. (5) Represents the net bad debt (recovery) expense related to client debit balances associated with the January 15, 2015 SNB event. (6) Represents the gain on the disposition of an equity method investment related to V3 in the three months ended March 31, 2016.
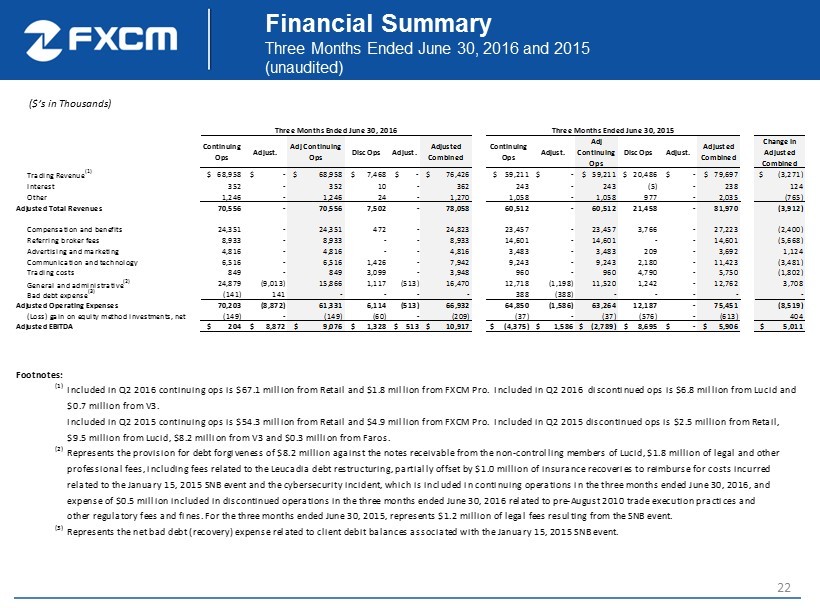
22 Financial Summary Three Months Ended June 30, 2016 and 2015 (unaudited ) ($’s in Thousands) Continuing Ops Adjust. Adj Continuing Ops Disc Ops Adjust. Adjusted Combined Continuing Ops Adjust. Adj Continuing Ops Disc Ops Adjust. Adjusted Combined Change in Adjusted Combined Trading Revenue (1) $ 68,958 $ - $ 68,958 $ 7,468 $ - $ 76,426 $ 59,211 $ - $ 59,211 $ 20,486 $ - $ 79,697 $ (3,271) Interest 352 - 352 10 - 362 243 - 243 (5) - 238 124 Other 1,246 - 1,246 24 - 1,270 1,058 - 1,058 977 - 2,035 (765) Adjusted Total Revenues 70,556 - 70,556 7,502 - 78,058 60,512 - 60,512 21,458 - 81,970 (3,912) Compensation and benefits 24,351 - 24,351 472 - 24,823 23,457 - 23,457 3,766 - 27,223 (2,400) Referring broker fees 8,933 - 8,933 - - 8,933 14,601 - 14,601 - - 14,601 (5,668) Advertising and marketing 4,816 - 4,816 - - 4,816 3,483 - 3,483 209 - 3,692 1,124 Communication and technology 6,516 - 6,516 1,426 - 7,942 9,243 - 9,243 2,180 - 11,423 (3,481) Trading costs 849 - 849 3,099 - 3,948 960 - 960 4,790 - 5,750 (1,802) General and administrative (2) 24,879 (9,013) 15,866 1,117 (513) 16,470 12,718 (1,198) 11,520 1,242 - 12,762 3,708 Bad debt expense (3) (141) 141 - - - - 388 (388) - - - - - Adjusted Operating Expenses 70,203 (8,872) 61,331 6,114 (513) 66,932 64,850 (1,586) 63,264 12,187 - 75,451 (8,519) (Loss) gain on equity method investments, net (149) - (149) (60) - (209) (37) - (37) (576) - (613) 404 Adjusted EBITDA $ 204 $ 8,872 $ 9,076 $ 1,328 $ 513 $ 10,917 $ (4,375) $ 1,586 $ (2,789) $ 8,695 $ - $ 5,906 $ 5,011 Three Months Ended June 30, 2016 Three Months Ended June 30, 2015 Footnotes: (1) Included in Q2 2016 continuing ops is $67.1 million from Retail and $1.8 million from FXCM Pro. Included in Q2 2016 discontinued ops is $6.8 million from Lucid and $0.7 million from V3. Included in Q2 2015 continuing ops is $54.3 million from Retail and $4.9 million from FXCM Pro. Included in Q2 2015 discontinued ops is $2.5 million from Retail, $9.5 million from Lucid, $8.2 million from V3 and $0.3 million from Faros. (2) Represents the provision for debt forgiveness of $8.2 million against the notes receivable from the non-controlling members of Lucid, $1.8 million of legal and other professional fees, including fees related to the Leucadia debt restructuring, partially offset by $1.0 million of insurance recoveries to reimburse for costs incurred related to the January 15, 2015 SNB event and the cybersecurity incident, which is included in continuing operations in the three months ended June 30, 2016, and expense of $0.5 million included in discontinued operations in the three months ended June 30, 2016 related to pre-August 2010 trade execution practices and other regulatory fees and fines. For the three months ended June 30, 2015, represents $1.2 million of legal fees resulting from the SNB event. (3) Represents the net bad debt (recovery) expense related to client debit balances associated with the January 15, 2015 SNB event.
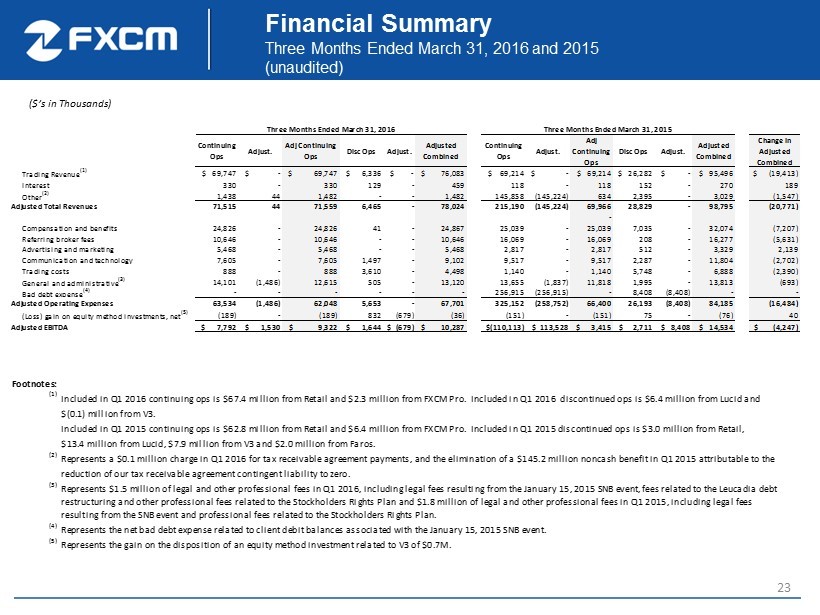
23 Financial Summary Three Months Ended March 31, 2016 and 2015 (unaudited ) ($’s in Thousands) Continuing Ops Adjust. Adj Continuing Ops Disc Ops Adjust. Adjusted Combined Continuing Ops Adjust. Adj Continuing Ops Disc Ops Adjust. Adjusted Combined Change in Adjusted Combined Trading Revenue (1) $ 69,747 $ - $ 69,747 $ 6,336 $ - $ 76,083 $ 69,214 $ - $ 69,214 $ 26,282 $ - $ 95,496 $ (19,413) Interest 330 - 330 129 - 459 118 - 118 152 - 270 189 Other (2) 1,438 44 1,482 - - 1,482 145,858 (145,224) 634 2,395 - 3,029 (1,547) Adjusted Total Revenues 71,515 44 71,559 6,465 - 78,024 215,190 (145,224) 69,966 28,829 - 98,795 (20,771) - Compensation and benefits 24,826 - 24,826 41 - 24,867 25,039 - 25,039 7,035 - 32,074 (7,207) Referring broker fees 10,646 - 10,646 - - 10,646 16,069 - 16,069 208 - 16,277 (5,631) Advertising and marketing 5,468 - 5,468 - - 5,468 2,817 - 2,817 512 - 3,329 2,139 Communication and technology 7,605 - 7,605 1,497 - 9,102 9,517 - 9,517 2,287 - 11,804 (2,702) Trading costs 888 - 888 3,610 - 4,498 1,140 - 1,140 5,748 - 6,888 (2,390) General and administrative (3) 14,101 (1,486) 12,615 505 - 13,120 13,655 (1,837) 11,818 1,995 - 13,813 (693) Bad debt expense (4) - - - - - - 256,915 (256,915) - 8,408 (8,408) - - Adjusted Operating Expenses 63,534 (1,486) 62,048 5,653 - 67,701 325,152 (258,752) 66,400 26,193 (8,408) 84,185 (16,484) (Loss) gain on equity method investments, net (5) (189) - (189) 832 (679) (36) (151) - (151) 75 - (76) 40 Adjusted EBITDA $ 7,792 $ 1,530 $ 9,322 $ 1,644 $ (679) $ 10,287 $(110,113) $ 113,528 $ 3,415 $ 2,711 $ 8,408 $ 14,534 $ (4,247) Three Months Ended March 31, 2016 Three Months Ended March 31, 2015 Footnotes: (1) Included in Q1 2016 continuing ops is $67.4 million from Retail and $2.3 million from FXCM Pro. Included in Q1 2016 discontinued ops is $6.4 million from Lucid and $(0.1) million from V3. Included in Q1 2015 continuing ops is $62.8 million from Retail and $6.4 million from FXCM Pro. Included in Q1 2015 discontinued ops is $3.0 million from Retail, $13.4 million from Lucid, $7.9 million from V3 and $2.0 million from Faros. (2) Represents a $0.1 million charge in Q1 2016 for tax receivable agreement payments, and the elimination of a $145.2 million noncash benefit in Q1 2015 attributable to the reduction of our tax receivable agreement contingent liability to zero. (3) Represents $1.5 million of legal and other professional fees in Q1 2016, including legal fees resulting from the January 15, 2015 SNB event, fees related to the Leucadia debt restructuring and other professional fees related to the Stockholders Rights Plan and $1.8 million of legal and other professional fees in Q1 2015, including legal fees resulting from the SNB event and professional fees related to the Stockholders Rights Plan. (4) Represents the net bad debt expense related to client debit balances associated with the January 15, 2015 SNB event. (5) Represents the gain on the disposition of an equity method investment related to V3 of $0.7M.
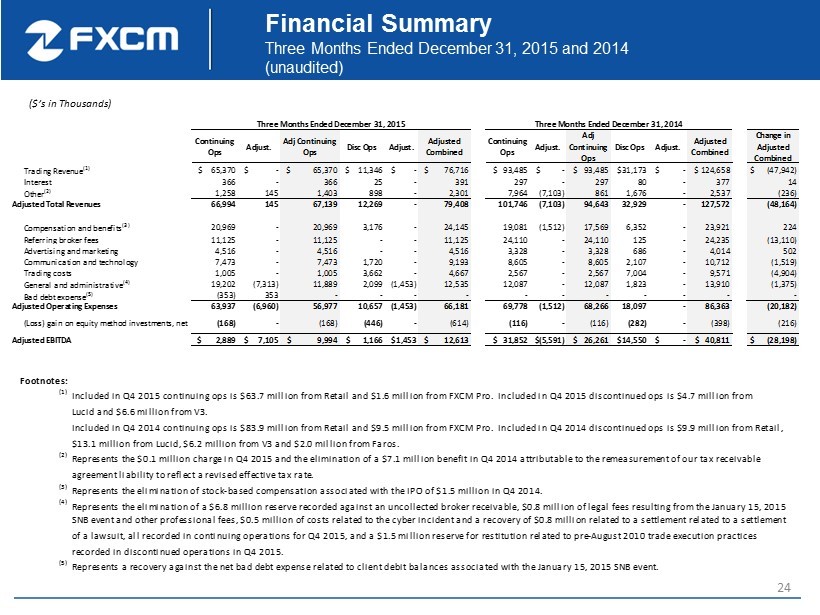
24 Financial Summary Three Months Ended December 31, 2015 and 2014 (unaudited ) ($’s in Thousands) Continuing Ops Adjust. Adj Continuing Ops Disc Ops Adjust. Adjusted Combined Continuing Ops Adjust. Adj Continuing Ops Disc Ops Adjust. Adjusted Combined Change in Adjusted Combined Trading Revenue (1) $ 65,370 $ - $ 65,370 $ 11,346 $ - $ 76,716 $ 93,485 $ - $ 93,485 $31,173 $ - $ 124,658 $ (47,942) Interest 366 - 366 25 - 391 297 - 297 80 - 377 14 Other (2) 1,258 145 1,403 898 - 2,301 7,964 (7,103) 861 1,676 - 2,537 (236) Adjusted Total Revenues 66,994 145 67,139 12,269 - 79,408 101,746 (7,103) 94,643 32,929 - 127,572 (48,164) Compensation and benefits (3) 20,969 - 20,969 3,176 - 24,145 19,081 (1,512) 17,569 6,352 - 23,921 224 Referring broker fees 11,125 - 11,125 - - 11,125 24,110 - 24,110 125 - 24,235 (13,110) Advertising and marketing 4,516 - 4,516 - - 4,516 3,328 - 3,328 686 - 4,014 502 Communication and technology 7,473 - 7,473 1,720 - 9,193 8,605 - 8,605 2,107 - 10,712 (1,519) Trading costs 1,005 - 1,005 3,662 - 4,667 2,567 - 2,567 7,004 - 9,571 (4,904) General and administrative (4) 19,202 (7,313) 11,889 2,099 (1,453) 12,535 12,087 - 12,087 1,823 - 13,910 (1,375) Bad debt expense (5) (353) 353 - - - - - - - - - - - Adjusted Operating Expenses 63,937 (6,960) 56,977 10,657 (1,453) 66,181 69,778 (1,512) 68,266 18,097 - 86,363 (20,182) (Loss) gain on equity method investments, net (168) - (168) (446) - (614) (116) - (116) (282) - (398) (216) Adjusted EBITDA $ 2,889 $ 7,105 $ 9,994 $ 1,166 $1,453 $ 12,613 $ 31,852 $(5,591) $ 26,261 $14,550 $ - $ 40,811 $ (28,198) Three Months Ended December 31, 2015 Three Months Ended December 31, 2014 Footnotes: (1) Included in Q4 2015 continuing ops is $63.7 million from Retail and $1.6 million from FXCM Pro. Included in Q4 2015 discontinued ops is $4.7 million from Lucid and $6.6 million from V3. Included in Q4 2014 continuing ops is $83.9 million from Retail and $9.5 million from FXCM Pro. Included in Q4 2014 discontinued ops is $9.9 million from Retail, $13.1 million from Lucid, $6.2 million from V3 and $2.0 million from Faros. (2) Represents the $0.1 million charge in Q4 2015 and the elimination of a $7.1 million benefit in Q4 2014 attributable to the remeasurement of our tax receivable agreement liability to reflect a revised effective tax rate. (3) Represents the elimination of stock-based compensation associated with the IPO of $1.5 million in Q4 2014. (4) Represents the elimination of a $6.8 million reserve recorded against an uncollected broker receivable, $0.8 million of legal fees resulting from the January 15, 2015 SNB event and other professional fees, $0.5 million of costs related to the cyber incident and a recovery of $0.8 million related to a settlement related to a settlement of a lawsuit, all recorded in continuing operations for Q4 2015, and a $1.5 million reserve for restitution related to pre-August 2010 trade execution practices recorded in discontinued operations in Q4 2015. (5) Represents a recovery against the net bad debt expense related to client debit balances associated with the January 15, 2015 SNB event.