Attached files
| file | filename |
|---|---|
| EX-99.1 - EXHIBIT 99.1 - Advanced Emissions Solutions, Inc. | a991pressrelease11916.htm |
| 8-K - 8-K - Advanced Emissions Solutions, Inc. | a2016q38k.htm |
EVENT TITLE
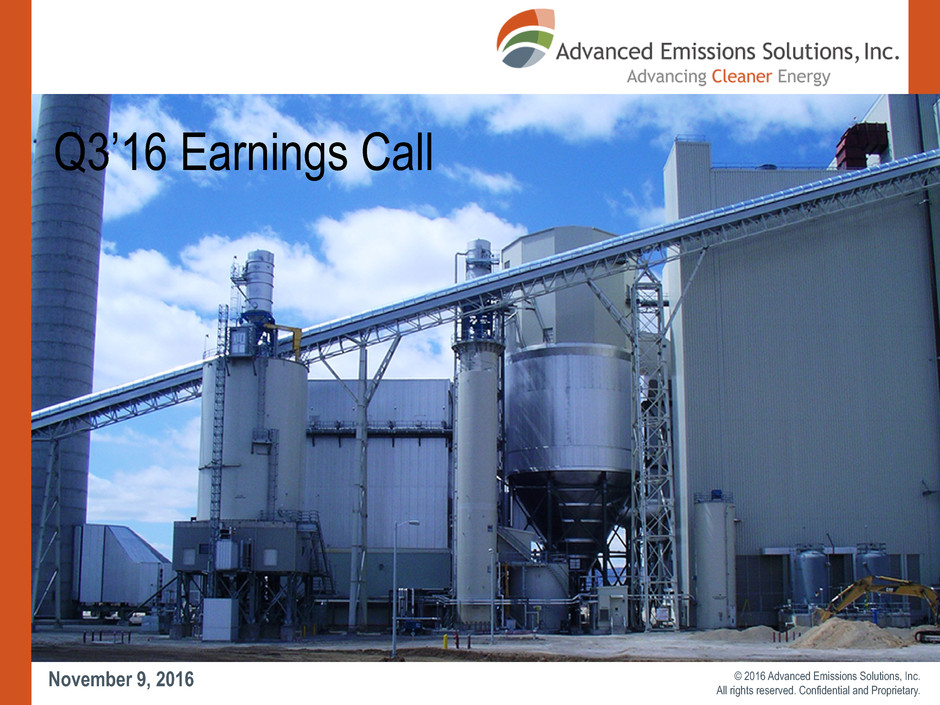
Q3’16 Earnings Call
© 2016 Advanced Emissions Solutions, Inc.
All rights reserved. Confidential and Proprietary.November 9, 2016
© 2016 Advanced Emissions Solutions, Inc. All rights reserved. Confidential and Proprietary.
Safe Harbor
This presentation includes forward-looking statements within the meaning of Section 21E of the Securities Exchange Act of 1934, which provides a "safe harbor" for such statements in certain
circumstances. The forward-looking statements include statements or expectations regarding future growth, strategic review of alternatives for our Emissions Control (“EC”) business, amount and timing of
production of Refined Coal (“RC”), Tinuum Group, LLC and Tinuum Services, LLC cash flow and ability to make distributions and Tinuum Group’s ability to lease or sell remaining RC facilities; future
revenues, expenses, cash flow, liquidity, and other financial and accounting measures; our ability to commercialize EC products and intellectual property; timing and outcome of our restructuring and cost
containment efforts; evaluation of strategic alternatives for our EC business and timing for a final decision; returning value to stockholders; expectation regarding settlement of litigation and associated
costs; and related matters. These statements are based on current expectations, estimates, projections, beliefs and assumptions of our management. Such statements involve significant risks and
uncertainties. Actual events or results could differ materially from those discussed in the forward-looking statements as a result of various factors, including but not limited to, changes and timing in laws,
regulations, IRS interpretations or guidance, accounting rules and any pending court decisions, legal challenges to or repeal of them; changes in prices, economic conditions and market demand; the
ability of the RC facilities to produce coal that qualifies for tax credits; the timing, terms and changes in contracts for RC facilities, or failure to lease or sell RC facilities; impact of competition; availability,
cost of and demand for alternative tax credit vehicles and other technologies; technical, start-up and operational difficulties; availability of raw materials; loss of key personnel; the value of our products,
technologies and intellectual property to customers and strategic investors; intellectual property infringement claims from third parties; the outcome of pending litigation; seasonality and other factors
discussed in greater detail in our filings with the SEC. You are cautioned not to place undue reliance on such statements and to consult our SEC filings for additional risks and uncertainties that may apply
to our business and the ownership of our securities. Our forward-looking statements are presented as of the date made, and we disclaim any duty to update such statements unless required by law to do
so.
-2-
© 2016 Advanced Emissions Solutions, Inc. All rights reserved. Confidential and Proprietary. -3-
Third Quarter & Recent Highlights
▪ Remain committed to previously announced strategic goals
▪ Distributions from the Refined Coal (“RC”) business in-line with expectations, increased
substantially
▪ Completed the lease of a RC facility in late August, which replaced a previously
announced investor cancellation
▪ Future expected aggregate rent payments from RC facilities increased to $648 million
through 2021
▪ Emissions Control (“EC”) business continued execution on equipment contracts and
commercialization of M-ProveTM Coal Additives, while minimizing costs associated with business
▪ Reduced general and administrative operating costs and drove higher positive operating
income during the period
▪ Increased cash balance by $5.4 million since June 30, 2016
▪ Review of strategic alternatives for EC business remains on track
© 2016 Advanced Emissions Solutions, Inc. All rights reserved. Confidential and Proprietary.
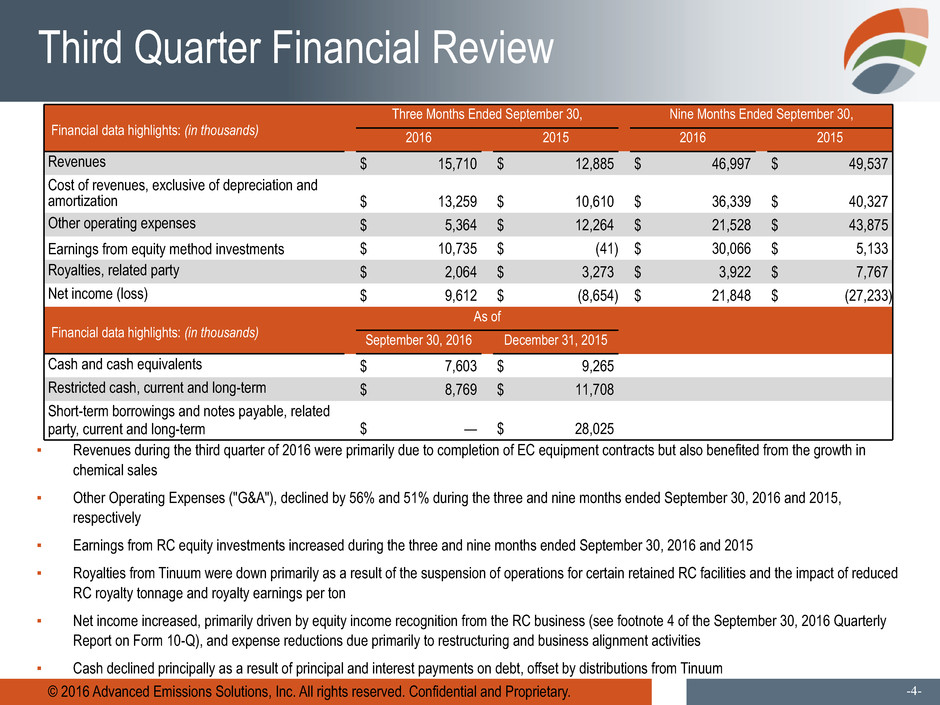
Financial data highlights: (in thousands)
Three Months Ended September 30, Nine Months Ended September 30,
2016 2015 2016 2015
Revenues $ 15,710 $ 12,885 $ 46,997 $ 49,537
Cost of revenues, exclusive of depreciation and
amortization $ 13,259 $ 10,610 $ 36,339 $ 40,327
Other operating expenses $ 5,364 $ 12,264 $ 21,528 $ 43,875
Earnings from equity method investments $ 10,735 $ (41) $ 30,066 $ 5,133
Royalties, related party $ 2,064 $ 3,273 $ 3,922 $ 7,767
Net income (loss) $ 9,612 $ (8,654) $ 21,848 $ (27,233)
Financial data highlights: (in thousands)
As of
September 30, 2016 December 31, 2015
Cash and cash equivalents $ 7,603 $ 9,265
Restricted cash, current and long-term $ 8,769 $ 11,708
Short-term borrowings and notes payable, related
party, current and long-term $ — $ 28,025
-4-
Third Quarter Financial Review
▪ Revenues during the third quarter of 2016 were primarily due to completion of EC equipment contracts but also benefited from the growth in
chemical sales
▪ Other Operating Expenses ("G&A"), declined by 56% and 51% during the three and nine months ended September 30, 2016 and 2015,
respectively
▪ Earnings from RC equity investments increased during the three and nine months ended September 30, 2016 and 2015
▪ Royalties from Tinuum were down primarily as a result of the suspension of operations for certain retained RC facilities and the impact of reduced
RC royalty tonnage and royalty earnings per ton
▪ Net income increased, primarily driven by equity income recognition from the RC business (see footnote 4 of the September 30, 2016 Quarterly
Report on Form 10-Q), and expense reductions due primarily to restructuring and business alignment activities
▪ Cash declined principally as a result of principal and interest payments on debt, offset by distributions from Tinuum
© 2016 Advanced Emissions Solutions, Inc. All rights reserved. Confidential and Proprietary. -5-
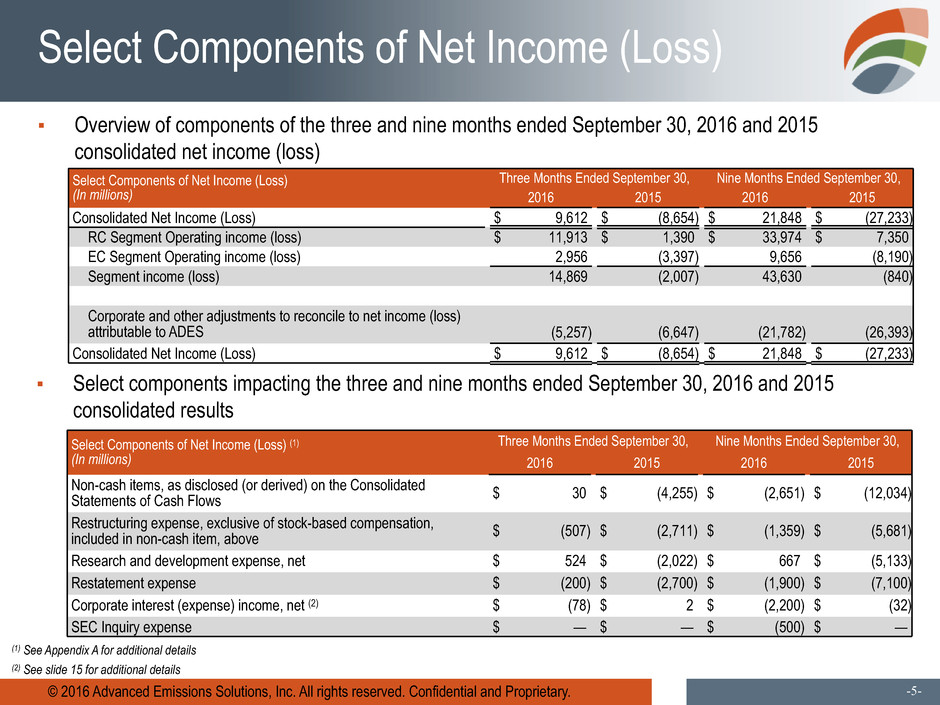
Select Components of Net Income (Loss)
Select Components of Net Income (Loss)
(In millions)
Three Months Ended September 30, Nine Months Ended September 30,
2016 2015 2016 2015
Consolidated Net Income (Loss) $ 9,612 $ (8,654) $ 21,848 $ (27,233)
RC Segment Operating income (loss) $ 11,913 $ 1,390 $ 33,974 $ 7,350
EC Segment Operating income (loss) 2,956 (3,397) 9,656 (8,190)
Segment income (loss) 14,869 (2,007) 43,630 (840)
Corporate and other adjustments to reconcile to net income (loss)
attributable to ADES (5,257) (6,647) (21,782) (26,393)
Consolidated Net Income (Loss) $ 9,612 $ (8,654) $ 21,848 $ (27,233)
▪ Overview of components of the three and nine months ended September 30, 2016 and 2015
consolidated net income (loss)
Select Components of Net Income (Loss) (1)
(In millions)
Three Months Ended September 30, Nine Months Ended September 30,
2016 2015 2016 2015
Non-cash items, as disclosed (or derived) on the Consolidated
Statements of Cash Flows $ 30 $ (4,255) $ (2,651) $ (12,034)
Restructuring expense, exclusive of stock-based compensation,
included in non-cash item, above $ (507) $ (2,711) $ (1,359) $ (5,681)
Research and development expense, net $ 524 $ (2,022) $ 667 $ (5,133)
Restatement expense $ (200) $ (2,700) $ (1,900) $ (7,100)
Corporate interest (expense) income, net (2) $ (78) $ 2 $ (2,200) $ (32)
SEC Inquiry expense $ — $ — $ (500) $ —
▪ Select components impacting the three and nine months ended September 30, 2016 and 2015
consolidated results
(1) See Appendix A for additional details
(2) See slide 15 for additional details
Refined Coal
© 2016 Advanced Emissions Solutions, Inc. All rights reserved. Confidential and Proprietary. -7-
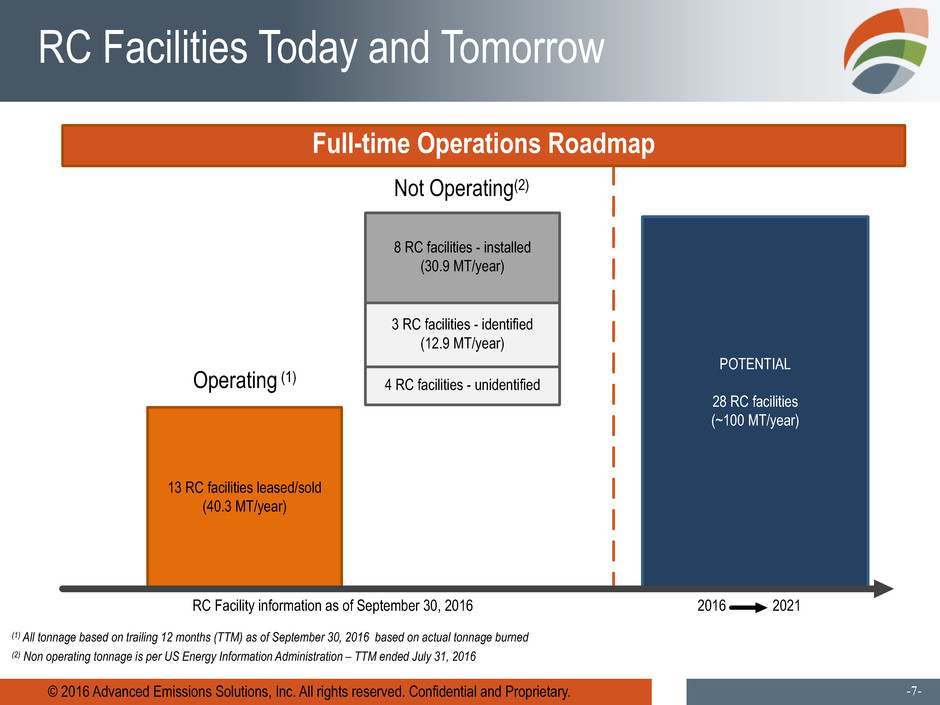
RC Facilities Today and Tomorrow
POTENTIAL
28 RC facilities
(~100 MT/year)
8 RC facilities - installed
(30.9 MT/year)
2016 2021RC Facility information as of September 30, 2016
13 RC facilities leased/sold
(40.3 MT/year)
Operating (1)
Not Operating(2)
3 RC facilities - identified
(12.9 MT/year)
Full-time Operations Roadmap
(1) All tonnage based on trailing 12 months (TTM) as of September 30, 2016 based on actual tonnage burned
(2) Non operating tonnage is per US Energy Information Administration – TTM ended July 31, 2016
4 RC facilities - unidentified
© 2016 Advanced Emissions Solutions, Inc. All rights reserved. Confidential and Proprietary. -8-
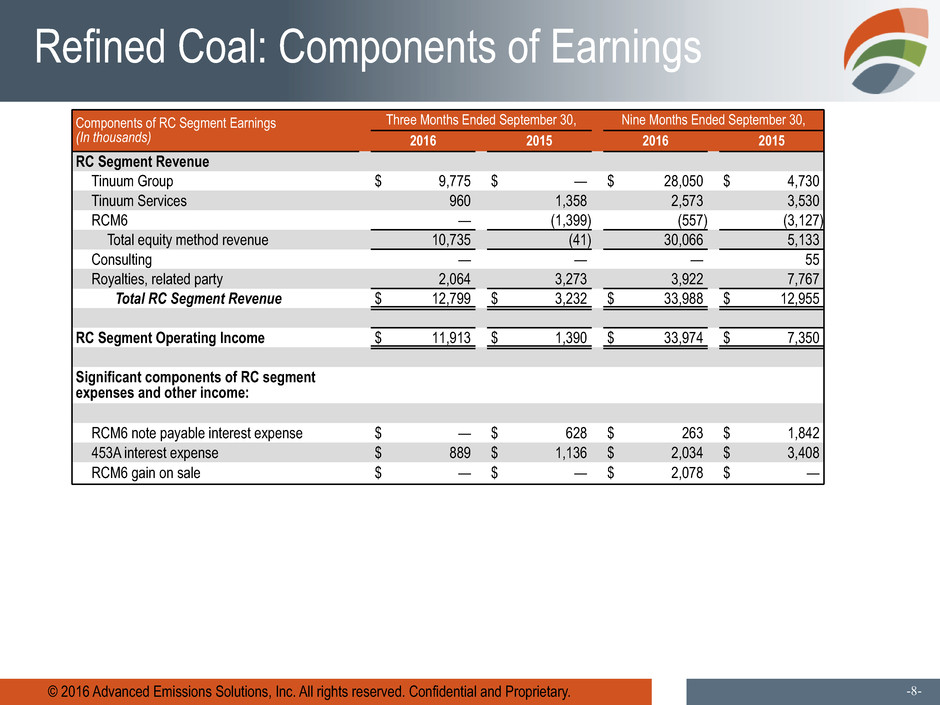
Refined Coal: Components of Earnings
Components of RC Segment Earnings
(In thousands)
Three Months Ended September 30, Nine Months Ended September 30,
2016 2015 2016 2015
RC Segment Revenue
Tinuum Group $ 9,775 $ — $ 28,050 $ 4,730
Tinuum Services 960 1,358 2,573 3,530
RCM6 — (1,399) (557) (3,127)
Total equity method revenue 10,735 (41) 30,066 5,133
Consulting — — — 55
Royalties, related party 2,064 3,273 3,922 7,767
Total RC Segment Revenue $ 12,799 $ 3,232 $ 33,988 $ 12,955
RC Segment Operating Income $ 11,913 $ 1,390 $ 33,974 $ 7,350
Significant components of RC segment
expenses and other income:
RCM6 note payable interest expense $ — $ 628 $ 263 $ 1,842
453A interest expense $ 889 $ 1,136 $ 2,034 $ 3,408
RCM6 gain on sale $ — $ — $ 2,078 $ —

© 2016 Advanced Emissions Solutions, Inc. All rights reserved. Confidential and Proprietary. -9-
Operating Tons: Invested vs. Retained
Note: Numbers within bar graph and the "Count" row within the tables represent the number of facilities per category as of the end of each quarter presented.
(1) Tonnage information is based upon RC production for the three and nine months ended September 30, 2016 (in thousands)
16
14
12
10
8
6
4
2
0
To
nn
ag
e(
MM
)
Q1 2014 Q2 2014 Q3 2014 Q4 2014 Q1 2015 Q2 2015 Q3 2015 Q4 2015 Q1 2016 Q2 2016 Q3 2016
Three Months
Ended
September 30,
2016
Invested Retained QTD - Total
Nine Months
Ended
September 30,
2016
Invested Retained YTD - Total
Tonnage (1) 13,260 32 13,292 Tonnage (1) 31,560 875 32,435
Count (#) 13 — 13 Count (#) 13 — 13
3
3
9 9
10
12 11
12
12
12 13 13
4
6
5 7 5
5
5
0
13
© 2016 Advanced Emissions Solutions, Inc. All rights reserved. Confidential and Proprietary. -10-
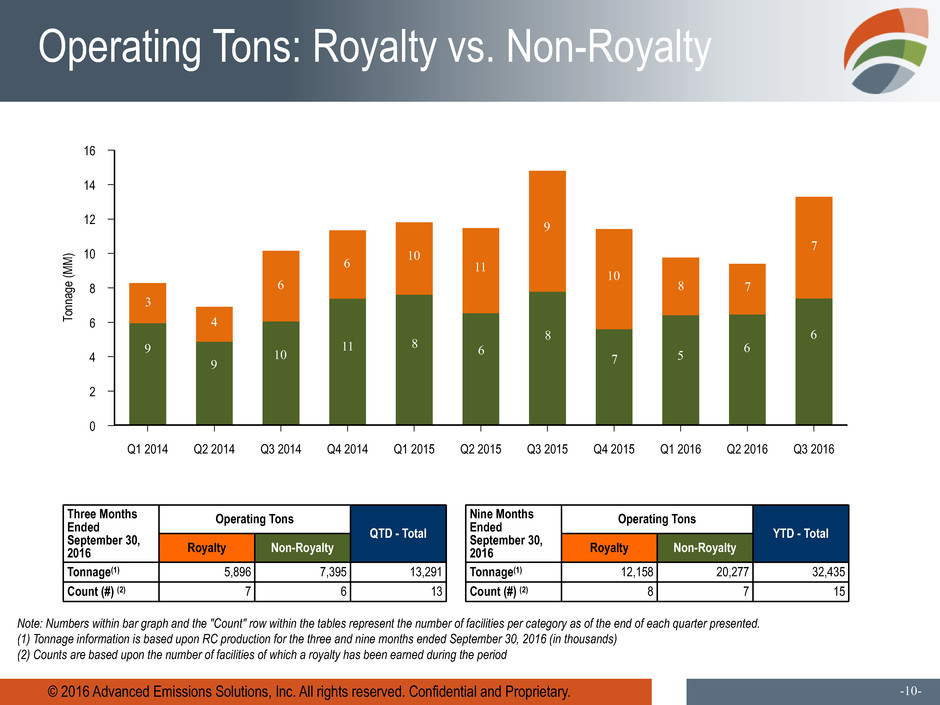
Operating Tons: Royalty vs. Non-Royalty
Note: Numbers within bar graph and the "Count" row within the tables represent the number of facilities per category as of the end of each quarter presented.
(1) Tonnage information is based upon RC production for the three and nine months ended September 30, 2016 (in thousands)
(2) Counts are based upon the number of facilities of which a royalty has been earned during the period
16
14
12
10
8
6
4
2
0
To
nn
ag
e(
MM
)
Q1 2014 Q2 2014 Q3 2014 Q4 2014 Q1 2015 Q2 2015 Q3 2015 Q4 2015 Q1 2016 Q2 2016 Q3 2016
Three Months
Ended
September 30,
2016
Operating Tons
QTD - Total
Nine Months
Ended
September 30,
2016
Operating Tons
YTD - Total
Royalty Non-Royalty Royalty Non-Royalty
Tonnage(1) 5,896 7,395 13,291 Tonnage(1) 12,158 20,277 32,435
Count (#) (2) 7 6 13 Count (#) (2) 8 7 15
3
9
9
10 11
8 6
8
7 5
6
4
6
6 10 11
9
10
8
7
7
6
© 2016 Advanced Emissions Solutions, Inc. All rights reserved. Confidential and Proprietary. -11-
Future Rent Payments – Tinuum Group
Invested Facilities
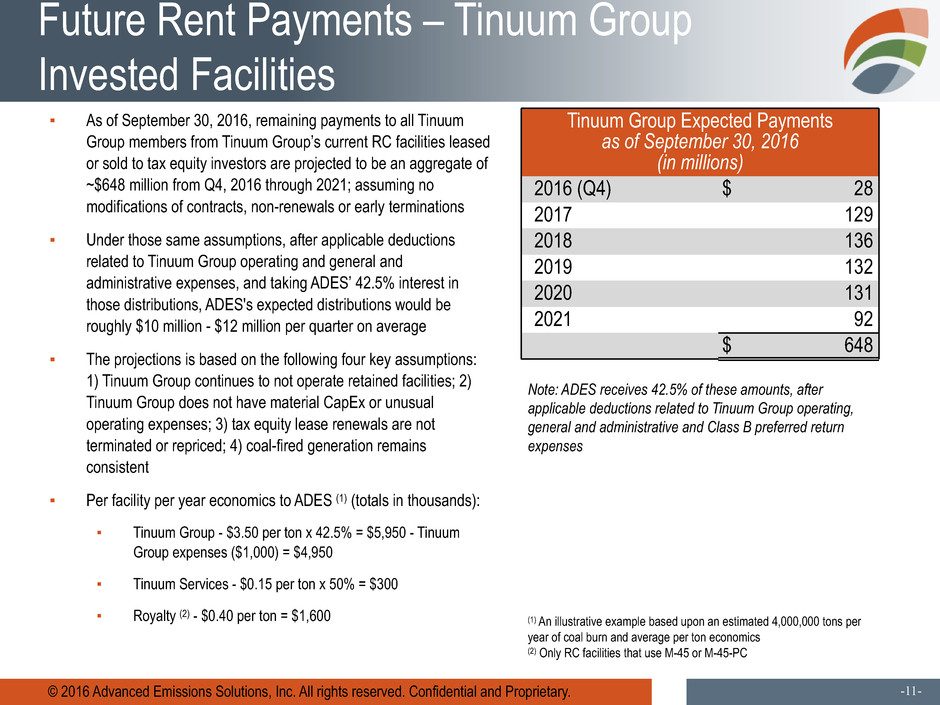
▪ As of September 30, 2016, remaining payments to all Tinuum
Group members from Tinuum Group’s current RC facilities leased
or sold to tax equity investors are projected to be an aggregate of
~$648 million from Q4, 2016 through 2021; assuming no
modifications of contracts, non-renewals or early terminations
▪ Under those same assumptions, after applicable deductions
related to Tinuum Group operating and general and
administrative expenses, and taking ADES’ 42.5% interest in
those distributions, ADES's expected distributions would be
roughly $10 million - $12 million per quarter on average
▪ The projections is based on the following four key assumptions:
1) Tinuum Group continues to not operate retained facilities; 2)
Tinuum Group does not have material CapEx or unusual
operating expenses; 3) tax equity lease renewals are not
terminated or repriced; 4) coal-fired generation remains
consistent
▪ Per facility per year economics to ADES (1) (totals in thousands):
▪ Tinuum Group - $3.50 per ton x 42.5% = $5,950 - Tinuum
Group expenses ($1,000) = $4,950
▪ Tinuum Services - $0.15 per ton x 50% = $300
▪ Royalty (2) - $0.40 per ton = $1,600
Tinuum Group Expected Payments
as of September 30, 2016
(in millions)
2016 (Q4) $ 28
2017 129
2018 136
2019 132
2020 131
2021 92
$ 648
Note: ADES receives 42.5% of these amounts, after
applicable deductions related to Tinuum Group operating,
general and administrative and Class B preferred return
expenses
(1) An illustrative example based upon an estimated 4,000,000 tons per
year of coal burn and average per ton economics
(2) Only RC facilities that use M-45 or M-45-PC
© 2016 Advanced Emissions Solutions, Inc. All rights reserved. Confidential and Proprietary. -12-
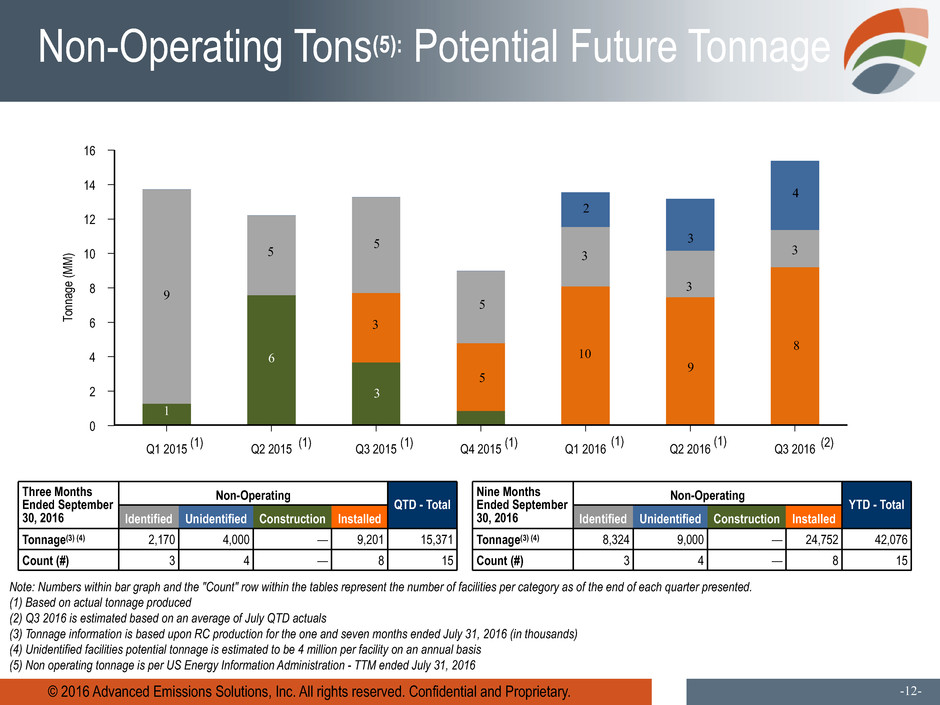
Non-Operating Tons(5): Potential Future Tonnage
Note: Numbers within bar graph and the "Count" row within the tables represent the number of facilities per category as of the end of each quarter presented.
(1) Based on actual tonnage produced
(2) Q3 2016 is estimated based on an average of July QTD actuals
(3) Tonnage information is based upon RC production for the one and seven months ended July 31, 2016 (in thousands)
(4) Unidentified facilities potential tonnage is estimated to be 4 million per facility on an annual basis
(5) Non operating tonnage is per US Energy Information Administration - TTM ended July 31, 2016
16
14
12
10
8
6
4
2
0
To
nn
ag
e(
MM
)
Q1 2015 Q2 2015 Q3 2015 Q4 2015 Q1 2016 Q2 2016 Q3 2016
Three Months
Ended September
30, 2016
Non-Operating QTD - Total
Identified Unidentified Construction Installed
Tonnage(3) (4) 2,170 4,000 — 9,201 15,371
Count (#) 3 4 — 8 15
9
1
6
5 5
3
3
5
5
1
9
3
10
3
(1)(1)(1) (1)(1) (2)
Nine Months
Ended September
30, 2016
Non-Operating YTD - Total
Identified Unidentified Construction Installed
Tonnage(3) (4) 8,324 9,000 — 24,752 42,076
Count (#) 3 4 — 8 15
3
2
4
3
8
(1)
Emissions Control
© 2016 Advanced Emissions Solutions, Inc. All rights reserved. Confidential and Proprietary. -14-
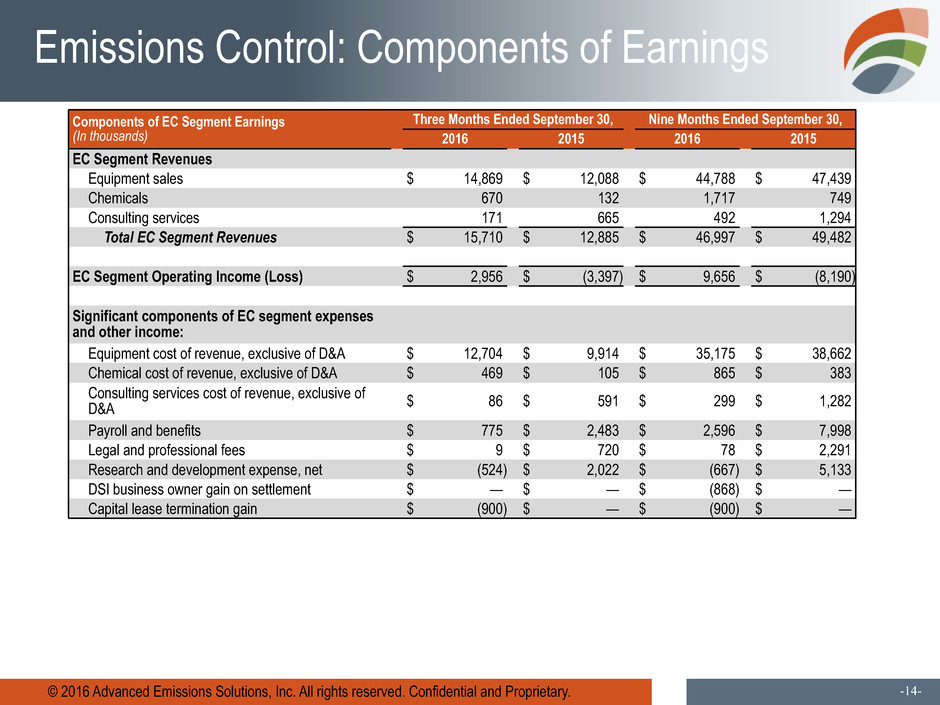
Emissions Control: Components of Earnings
Components of EC Segment Earnings
(In thousands)
Three Months Ended September 30, Nine Months Ended September 30,
2016 2015 2016 2015
EC Segment Revenues
Equipment sales $ 14,869 $ 12,088 $ 44,788 $ 47,439
Chemicals 670 132 1,717 749
Consulting services 171 665 492 1,294
Total EC Segment Revenues $ 15,710 $ 12,885 $ 46,997 $ 49,482
EC Segment Operating Income (Loss) $ 2,956 $ (3,397) $ 9,656 $ (8,190)
Significant components of EC segment expenses
and other income:
Equipment cost of revenue, exclusive of D&A $ 12,704 $ 9,914 $ 35,175 $ 38,662
Chemical cost of revenue, exclusive of D&A $ 469 $ 105 $ 865 $ 383
Consulting services cost of revenue, exclusive of
D&A $ 86 $ 591 $ 299 $ 1,282
Payroll and benefits $ 775 $ 2,483 $ 2,596 $ 7,998
Legal and professional fees $ 9 $ 720 $ 78 $ 2,291
Research and development expense, net $ (524) $ 2,022 $ (667) $ 5,133
DSI business owner gain on settlement $ — $ — $ (868) $ —
Capital lease termination gain $ (900) $ — $ (900) $ —
© 2016 Advanced Emissions Solutions, Inc. All rights reserved. Confidential and Proprietary. -15-
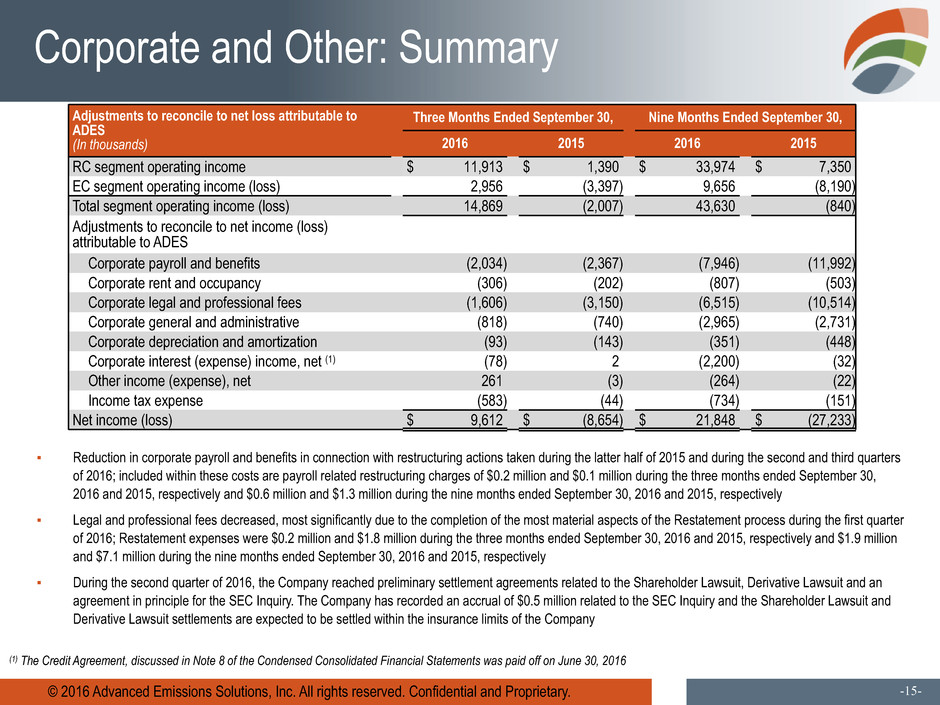
Corporate and Other: Summary
Adjustments to reconcile to net loss attributable to
ADES
(In thousands)
Three Months Ended September 30, Nine Months Ended September 30,
2016 2015 2016 2015
RC segment operating income $ 11,913 $ 1,390 $ 33,974 $ 7,350
EC segment operating income (loss) 2,956 (3,397) 9,656 (8,190)
Total segment operating income (loss) 14,869 (2,007) 43,630 (840)
Adjustments to reconcile to net income (loss)
attributable to ADES
Corporate payroll and benefits (2,034) (2,367) (7,946) (11,992)
Corporate rent and occupancy (306) (202) (807) (503)
Corporate legal and professional fees (1,606) (3,150) (6,515) (10,514)
Corporate general and administrative (818) (740) (2,965) (2,731)
Corporate depreciation and amortization (93) (143) (351) (448)
Corporate interest (expense) income, net (1) (78) 2 (2,200) (32)
Other income (expense), net 261 (3) (264) (22)
Income tax expense (583) (44) (734) (151)
Net income (loss) $ 9,612 $ (8,654) $ 21,848 $ (27,233)
▪ Reduction in corporate payroll and benefits in connection with restructuring actions taken during the latter half of 2015 and during the second and third quarters
of 2016; included within these costs are payroll related restructuring charges of $0.2 million and $0.1 million during the three months ended September 30,
2016 and 2015, respectively and $0.6 million and $1.3 million during the nine months ended September 30, 2016 and 2015, respectively
▪ Legal and professional fees decreased, most significantly due to the completion of the most material aspects of the Restatement process during the first quarter
of 2016; Restatement expenses were $0.2 million and $1.8 million during the three months ended September 30, 2016 and 2015, respectively and $1.9 million
and $7.1 million during the nine months ended September 30, 2016 and 2015, respectively
▪ During the second quarter of 2016, the Company reached preliminary settlement agreements related to the Shareholder Lawsuit, Derivative Lawsuit and an
agreement in principle for the SEC Inquiry. The Company has recorded an accrual of $0.5 million related to the SEC Inquiry and the Shareholder Lawsuit and
Derivative Lawsuit settlements are expected to be settled within the insurance limits of the Company
(1) The Credit Agreement, discussed in Note 8 of the Condensed Consolidated Financial Statements was paid off on June 30, 2016
© 2016 Advanced Emissions Solutions, Inc. All rights reserved. Confidential and Proprietary. -16-
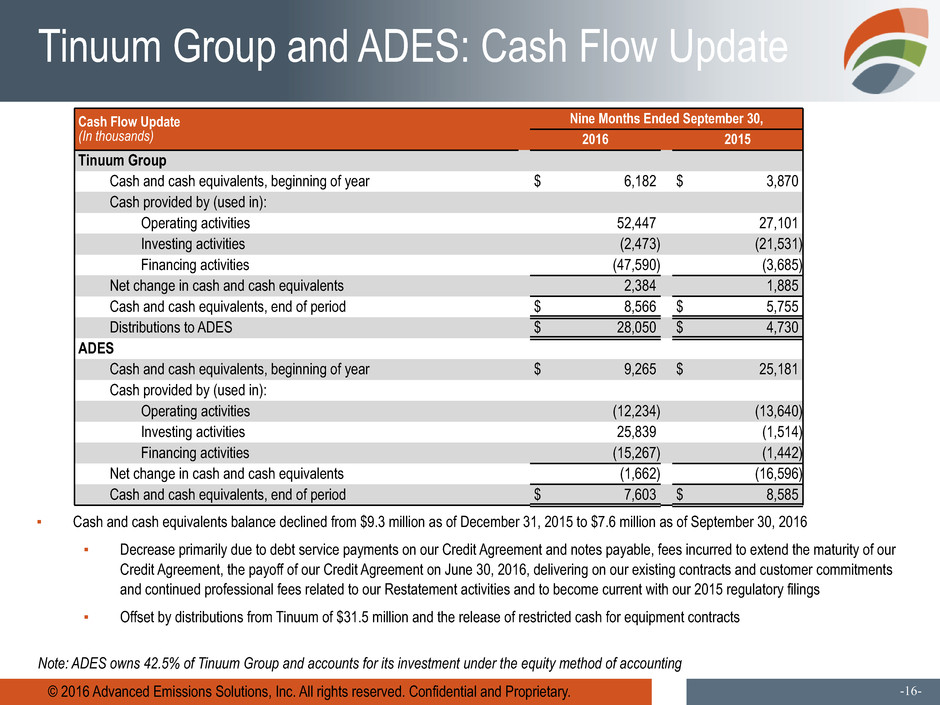
Tinuum Group and ADES: Cash Flow Update
Cash Flow Update
(In thousands)
Nine Months Ended September 30,
2016 2015
Tinuum Group
Cash and cash equivalents, beginning of year $ 6,182 $ 3,870
Cash provided by (used in):
Operating activities 52,447 27,101
Investing activities (2,473) (21,531)
Financing activities (47,590) (3,685)
Net change in cash and cash equivalents 2,384 1,885
Cash and cash equivalents, end of period $ 8,566 $ 5,755
Distributions to ADES $ 28,050 $ 4,730
ADES
Cash and cash equivalents, beginning of year $ 9,265 $ 25,181
Cash provided by (used in):
Operating activities (12,234) (13,640)
Investing activities 25,839 (1,514)
Financing activities (15,267) (1,442)
Net change in cash and cash equivalents (1,662) (16,596)
Cash and cash equivalents, end of period $ 7,603 $ 8,585
▪ Cash and cash equivalents balance declined from $9.3 million as of December 31, 2015 to $7.6 million as of September 30, 2016
▪ Decrease primarily due to debt service payments on our Credit Agreement and notes payable, fees incurred to extend the maturity of our
Credit Agreement, the payoff of our Credit Agreement on June 30, 2016, delivering on our existing contracts and customer commitments
and continued professional fees related to our Restatement activities and to become current with our 2015 regulatory filings
▪ Offset by distributions from Tinuum of $31.5 million and the release of restricted cash for equipment contracts
Note: ADES owns 42.5% of Tinuum Group and accounts for its investment under the equity method of accounting

© 2016 Advanced Emissions Solutions, Inc. All rights reserved. Confidential and Proprietary. -17-
2016 Strategic Priorities
▪ We have made noticeable progress against many of the strategic priorities that we outlined on the
2015 10-K conference call
▪ Looking ahead, we continue to focus on obtaining new tax equity investors while further enhancing
the profile of the business through execution on cost reduction initiatives
Appendix
© 2016 Advanced Emissions Solutions, Inc. All rights reserved. Confidential and Proprietary. -19-
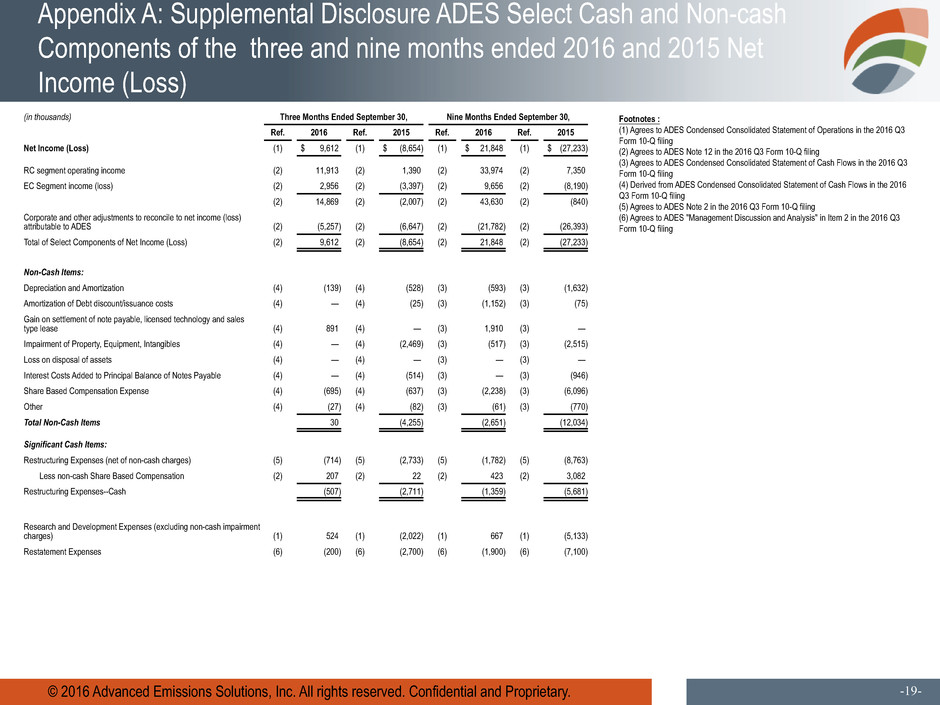
Appendix A: Supplemental Disclosure ADES Select Cash and Non-cash
Components of the three and nine months ended 2016 and 2015 Net
Income (Loss)
(in thousands) Three Months Ended September 30, Nine Months Ended September 30,
Ref. 2016 Ref. 2015 Ref. 2016 Ref. 2015
Net Income (Loss) (1) $ 9,612 (1) $ (8,654) (1) $ 21,848 (1) $ (27,233)
RC segment operating income (2) 11,913 (2) 1,390 (2) 33,974 (2) 7,350
EC Segment income (loss) (2) 2,956 (2) (3,397) (2) 9,656 (2) (8,190)
(2) 14,869 (2) (2,007) (2) 43,630 (2) (840)
Corporate and other adjustments to reconcile to net income (loss)
attributable to ADES (2) (5,257) (2) (6,647) (2) (21,782) (2) (26,393)
Total of Select Components of Net Income (Loss) (2) 9,612 (2) (8,654) (2) 21,848 (2) (27,233)
Non-Cash Items:
Depreciation and Amortization (4) (139) (4) (528) (3) (593) (3) (1,632)
Amortization of Debt discount/issuance costs (4) — (4) (25) (3) (1,152) (3) (75)
Gain on settlement of note payable, licensed technology and sales
type lease (4) 891 (4) — (3) 1,910 (3) —
Impairment of Property, Equipment, Intangibles (4) — (4) (2,469) (3) (517) (3) (2,515)
Loss on disposal of assets (4) — (4) — (3) — (3) —
Interest Costs Added to Principal Balance of Notes Payable (4) — (4) (514) (3) — (3) (946)
Share Based Compensation Expense (4) (695) (4) (637) (3) (2,238) (3) (6,096)
Other (4) (27) (4) (82) (3) (61) (3) (770)
Total Non-Cash Items 30 (4,255) (2,651) (12,034)
Significant Cash Items:
Restructuring Expenses (net of non-cash charges) (5) (714) (5) (2,733) (5) (1,782) (5) (8,763)
Less non-cash Share Based Compensation (2) 207 (2) 22 (2) 423 (2) 3,082
Restructuring Expenses--Cash (507) (2,711) (1,359) (5,681)
Research and Development Expenses (excluding non-cash impairment
charges) (1) 524 (1) (2,022) (1) 667 (1) (5,133)
Restatement Expenses (6) (200) (6) (2,700) (6) (1,900) (6) (7,100)
Footnotes :
(1) Agrees to ADES Condensed Consolidated Statement of Operations in the 2016 Q3
Form 10-Q filing
(2) Agrees to ADES Note 12 in the 2016 Q3 Form 10-Q filing
(3) Agrees to ADES Condensed Consolidated Statement of Cash Flows in the 2016 Q3
Form 10-Q filing
(4) Derived from ADES Condensed Consolidated Statement of Cash Flows in the 2016
Q3 Form 10-Q filing
(5) Agrees to ADES Note 2 in the 2016 Q3 Form 10-Q filing
(6) Agrees to ADES "Management Discussion and Analysis" in Item 2 in the 2016 Q3
Form 10-Q filing
© 2016 Advanced Emissions Solutions, Inc. All rights reserved. Confidential and Proprietary. -20-
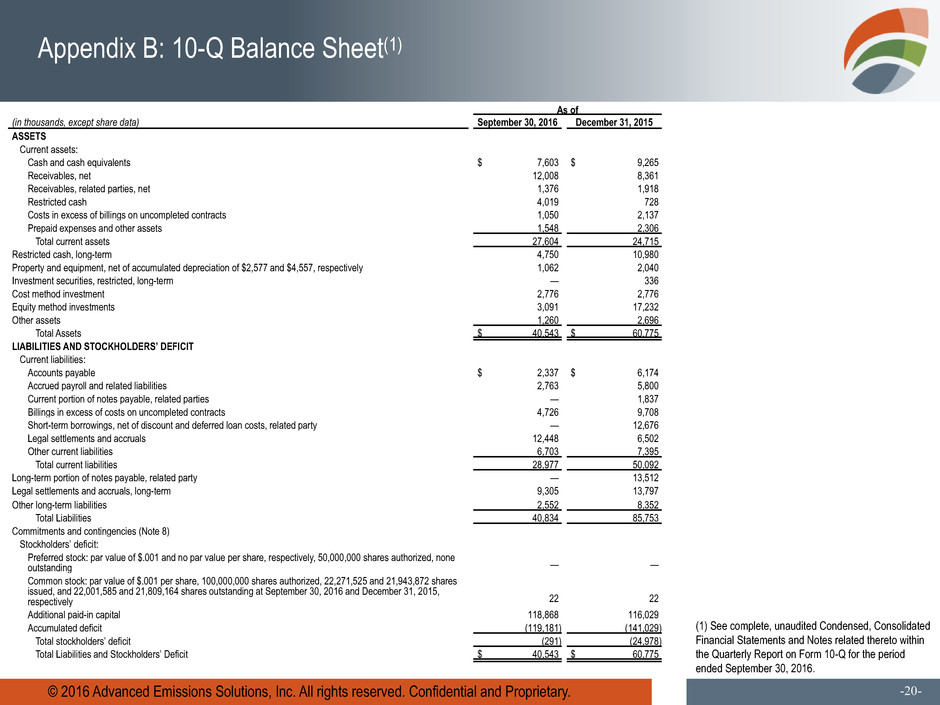
Appendix B: 10-Q Balance Sheet(1)
(1) See complete, unaudited Condensed, Consolidated
Financial Statements and Notes related thereto within
the Quarterly Report on Form 10-Q for the period
ended September 30, 2016.
As of
(in thousands, except share data) September 30, 2016 December 31, 2015
ASSETS
Current assets:
Cash and cash equivalents $ 7,603 $ 9,265
Receivables, net 12,008 8,361
Receivables, related parties, net 1,376 1,918
Restricted cash 4,019 728
Costs in excess of billings on uncompleted contracts 1,050 2,137
Prepaid expenses and other assets 1,548 2,306
Total current assets 27,604 24,715
Restricted cash, long-term 4,750 10,980
Property and equipment, net of accumulated depreciation of $2,577 and $4,557, respectively 1,062 2,040
Investment securities, restricted, long-term — 336
Cost method investment 2,776 2,776
Equity method investments 3,091 17,232
Other assets 1,260 2,696
Total Assets $ 40,543 $ 60,775
LIABILITIES AND STOCKHOLDERS’ DEFICIT
Current liabilities:
Accounts payable $ 2,337 $ 6,174
Accrued payroll and related liabilities 2,763 5,800
Current portion of notes payable, related parties — 1,837
Billings in excess of costs on uncompleted contracts 4,726 9,708
Short-term borrowings, net of discount and deferred loan costs, related party — 12,676
Legal settlements and accruals 12,448 6,502
Other current liabilities 6,703 7,395
Total current liabilities 28,977 50,092
Long-term portion of notes payable, related party — 13,512
Legal settlements and accruals, long-term 9,305 13,797
Other long-term liabilities 2,552 8,352
Total Liabilities 40,834 85,753
Commitments and contingencies (Note 8)
Stockholders’ deficit:
Preferred stock: par value of $.001 and no par value per share, respectively, 50,000,000 shares authorized, none
outstanding — —
Common stock: par value of $.001 per share, 100,000,000 shares authorized, 22,271,525 and 21,943,872 shares
issued, and 22,001,585 and 21,809,164 shares outstanding at September 30, 2016 and December 31, 2015,
respectively 22 22
Additional paid-in capital 118,868 116,029
Accumulated deficit (119,181) (141,029)
Total stockholders’ deficit (291) (24,978)
Total Liabilities and Stockholders’ Deficit $ 40,543 $ 60,775

© 2016 Advanced Emissions Solutions, Inc. All rights reserved. Confidential and Proprietary. -21-
Appendix C: 10-Q Income Statement(1)
(1) See complete, unaudited
Condensed, Consolidated Financial
Statements and Notes related
thereto within the Quarterly Report
on Form 10-Q for the period ended
September 30, 2016.
Three Months Ended September 30, Nine Months Ended September 30,
(in thousands, except per share data and percentages) 2016 2015 2016 2015
Revenues:
Equipment sales 14,869 12,088 44,788 47,439
Chemicals 670 132 1,717 749
Consulting services and other 171 665 492 1,349
Total revenues 15,710 12,885 46,997 49,537
Operating expenses:
Equipment sales cost of revenue, exclusive of depreciation and amortization 12,704 9,914 35,175 38,662
Chemicals cost of revenue, exclusive of depreciation and amortization 469 105 865 383
Consulting services cost of revenue, exclusive of depreciation and amortization 86 591 299 1,282
Payroll and benefits 2,809 4,445 10,567 19,102
Rent and occupancy 508 596 1,534 1,828
Legal and professional fees 1,615 3,424 6,581 11,545
General and administrative 818 1,249 2,920 4,635
Research and development, net (524) 2,022 (667) 5,133
Depreciation and amortization 138 528 593 1,632
Total operating expenses 18,623 22,874 57,867 84,202
Operating loss (2,913) (9,989) (10,870) (34,665)
Other income (expense):
Earnings (loss) from equity method investments 10,735 (41) 30,066 5,133
Royalties, related party 2,064 3,273 3,922 7,767
Interest income 149 2 267 20
Interest expense (969) (1,778) (4,496) (5,347)
Gain on sale of equity method investment — — 2,078 —
Gain on settlement of note payable and licensed technology — — 869 —
Other 1,129 (77) 746 10
Total other income 13,108 1,379 33,452 7,583
Income (loss) before income tax expense 10,195 (8,610) 22,582 (27,082)
Income tax expense 583 44 734 151
Net income (loss) 9,612 (8,654) 21,848 (27,233)
Earnings (loss) per common share (Note 1):
Basic 0.44 (0.40) 0.99 (1.24)
Diluted 0.43 (0.40) 0.97 (1.24)
Weighted-average number of common shares outstanding:
Basic 21,740 21,687 21,926 21,757
Diluted 22,098 21,687 22,209 21,757

© 2016 Advanced Emissions Solutions, Inc. All rights reserved. Confidential and Proprietary. -22-
Appendix D: 10-Q Cash Flow(1)
(1) See complete, unaudited Condensed, Consolidated
Financial Statements and Notes related thereto within
the Quarterly Report on Form 10-Q for the period
ended September 30, 2016.
Nine Months Ended September 30,
(in thousands) 2016 2015
Cash flows from operating activities
Net income (loss) $ 21,848 $ (27,233)
Adjustments to reconcile net income (loss) to net cash used in operating activities:
Depreciation and amortization 593 1,632
Amortization of debt issuance costs 1,152 75
Impairment of property, equipment, inventory and intangibles 517 2,515
Interest costs added to principal balance of notes payable — 946
Share-based compensation expense 2,238 6,096
Earnings from equity method investments (30,066) (5,133)
Gain on sale of equity method investment (2,078) —
Gain on settlement of note payable, licensed technology, and sales-type lease (1,910) —
Other non-cash items, net 61 770
Changes in operating assets and liabilities, net of effects of acquired businesses:
Receivables (3,677) 7,579
Related party receivables 541 (752)
Prepaid expenses and other assets 831 (1,134)
Costs incurred on uncompleted contracts 28,575 4,719
Restricted cash 3,488 1,690
Other long-term assets 961 144
Accounts payable (3,837) 1,414
Accrued payroll and related liabilities (2,245) 1,161
Other current liabilities (2,094) 1,624
Billings on uncompleted contracts (32,469) (7,256)
Advance deposit, related party (1,306) (2,586)
Other long-term liabilities (1,661) 98
Legal settlements and accruals 1,454 (2,528)
Distributions from equity method investees, return on investment 6,850 2,519
Net cash used in operating activities (12,234) (13,640)
© 2016 Advanced Emissions Solutions, Inc. All rights reserved. Confidential and Proprietary. -23-
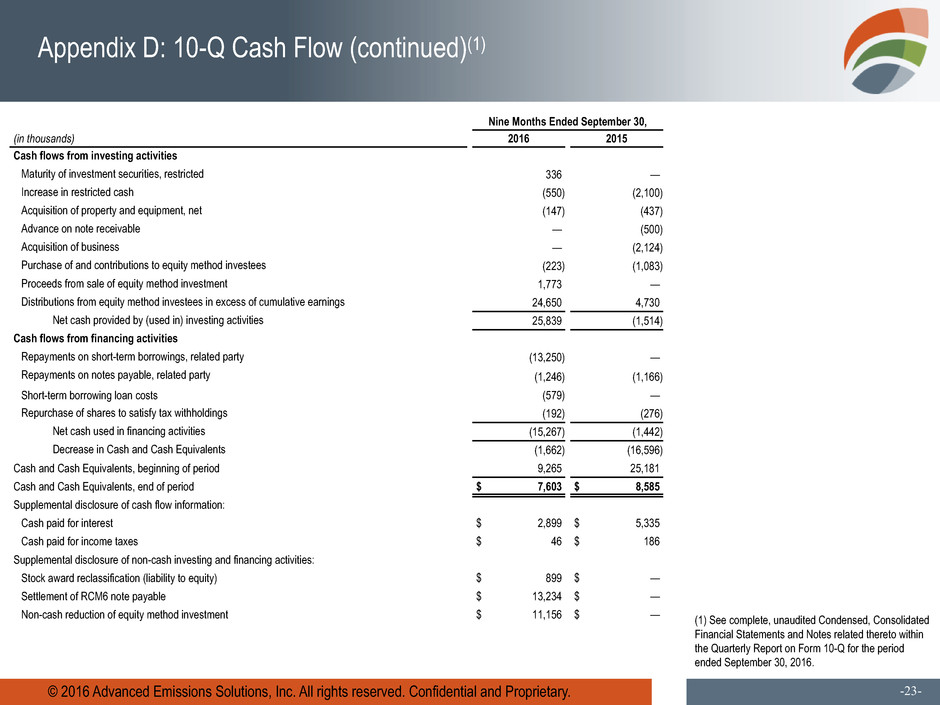
Appendix D: 10-Q Cash Flow (continued)(1)
(1) See complete, unaudited Condensed, Consolidated
Financial Statements and Notes related thereto within
the Quarterly Report on Form 10-Q for the period
ended September 30, 2016.
Nine Months Ended September 30,
(in thousands) 2016 2015
Cash flows from investing activities
Maturity of investment securities, restricted 336 —
Increase in restricted cash (550) (2,100)
Acquisition of property and equipment, net (147) (437)
Advance on note receivable — (500)
Acquisition of business — (2,124)
Purchase of and contributions to equity method investees (223) (1,083)
Proceeds from sale of equity method investment 1,773 —
Distributions from equity method investees in excess of cumulative earnings 24,650 4,730
Net cash provided by (used in) investing activities 25,839 (1,514)
Cash flows from financing activities
Repayments on short-term borrowings, related party (13,250) —
Repayments on notes payable, related party (1,246) (1,166)
Short-term borrowing loan costs (579) —
Repurchase of shares to satisfy tax withholdings (192) (276)
Net cash used in financing activities (15,267) (1,442)
Decrease in Cash and Cash Equivalents (1,662) (16,596)
Cash and Cash Equivalents, beginning of period 9,265 25,181
Cash and Cash Equivalents, end of period $ 7,603 $ 8,585
Supplemental disclosure of cash flow information:
Cash paid for interest $ 2,899 $ 5,335
Cash paid for income taxes $ 46 $ 186
Supplemental disclosure of non-cash investing and financing activities:
Stock award reclassification (liability to equity) $ 899 $ —
Settlement of RCM6 note payable $ 13,234 $ —
Non-cash reduction of equity method investment $ 11,156 $ —
