Attached files
| file | filename |
|---|---|
| EX-99.3 - EXHIBIT 99.3 - AMERICAN PUBLIC EDUCATION INC | v452351_ex99-3.htm |
| EX-99.1 - EXHIBIT 99.1 - AMERICAN PUBLIC EDUCATION INC | v452351_ex99-1.htm |
| 8-K - 8-K - AMERICAN PUBLIC EDUCATION INC | v452351_8k.htm |
Exhibit 99.2

November 7, 2016 Recent Results and Developments Third Quarter 2016
Statements made in this presentation regarding American Public Education, Inc . or its subsidiaries, that are not historical facts are forward - looking statements based on current expectations, assumptions, estimates and projections about American Public Education and the industry . These forward - looking statements are subject to risks and uncertainties that could cause actual future events or results to differ materially from such statements . Forward - looking statements can be identified by words such as “anticipate", “believe”, “seek”, “could”, “estimate”, “expect”, “intend”, “may”, “plan”, “should”, “will” and “would” . These forward - looking statements include, without limitation, statements regarding expected growth, expected registrations and enrollments, expected revenues, expected earnings, brand and enrollment management, program development and business development initiatives . Actual results could differ materially from those expressed or implied by these forward - looking statements as a result of various factors, including the various risks described in the “ Risk Factors ” section and elsewhere in the American Public Education ’ s Annual Report on Form 10 - K for the year ended December 31 , 2015 , Quarterly Report on Form 10 - Q for the three months ended September 30 , 2016 and in the American Public Education’s other filings with the SEC . American Public Education undertakes no obligation to update publicly any forward - looking statements for any reason, unless required by law, even if new information becomes available or other events occur in the future . 2 Advancing the Learning Experience | Exploring New Opportunities SAFE HARBOR STATEMENT American Public Education, Inc.
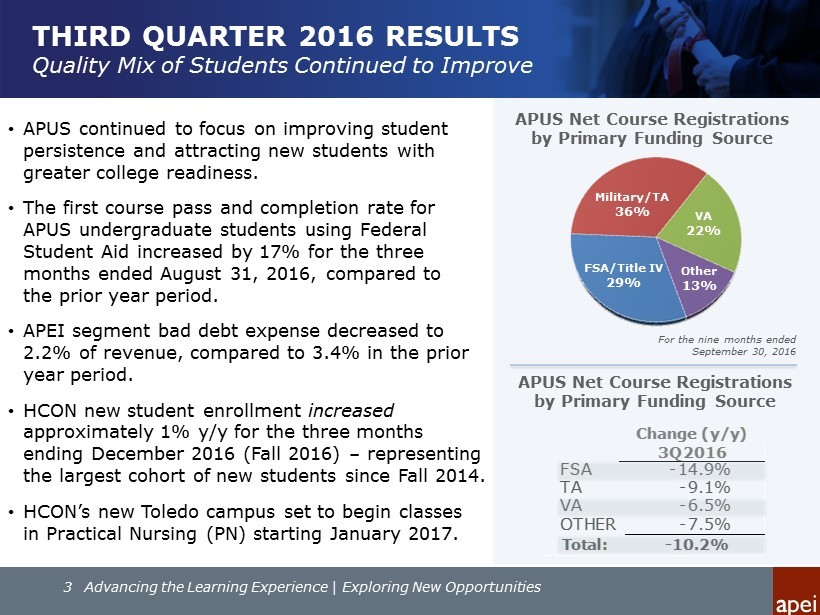
THIRD QUARTER 2016 RESULTS Quality Mix of Students Continued to Improve • APUS continued to focus on improving student persistence and attracting new students with greater college readiness. • The first course pass and completion rate for APUS undergraduate students using Federal Student Aid increased by 17% for the three months ended August 31, 2016, compared to the prior year period. • APEI segment bad debt expense decreased to 2.2% of revenue, compared to 3.4% in the prior year period. • HCON new student enrollment increased approximately 1% y/y for the three months ending December 2016 (Fall 2016) – representing the largest cohort of new students since Fall 2014. • HCON’s new Toledo campus set to begin classes in Practical Nursing (PN) starting January 2017 . For the nine months ended September 30, 2016 APUS Net Course Registrations by Primary Funding Source Other 13% FSA/Title IV 29% Military/TA 36% VA 22% 3 Advancing the Learning Experience | Exploring New Opportunities FSA -14.9% TA -9.1% VA -6.5% OTHER -7.5% Total: -10.2% Change (y/y) 3Q2016 APUS Net Course Registrations by Primary Funding Source
4 Advancing the Learning Experience | Exploring New Opportunities Increase Student Persistence Strengthening Brand Position & Enrollment Management: • Increase promotion of existing tuition grants. • Further improve the effectiveness of our enrollment lifecycle. • Announcing the appointment of Robert E. Gay as Chief Operations Officer to advance enrollment management and marketing initiatives. Expanding Programs in Alignment with Workforce Demand: • Launched seven degree and certificate programs in business analytics, technical management and accounting. • Recently announced the hiring of Dr. Vernon C. Smith as Provost to focus on learning outcomes and product development. Increasing Focus on Workforce Development: • APUS Momentum – seeking approval for competency - based degree programs. • Center for Applied Learning – training programs aligned with needs of public safety professionals and their employers. • Developed several new strategic relationships, including with Holland America Group and the US Postal Service (USPS). APUS: STABILIZING STUDENT ENROLLMENT Through Outreach, Product Offerings & Process Improvement
FINANCIAL RESULTS SUMMARY Third Quarter 2016 Advancing the Learning Experience | Exploring New Opportunities 5 • Consolidated revenue decreased 3.3% to $73.8 million, compared to $76.3 million in the same period of 2015. • Costs and Expenses: • Instructional costs and services increased slightly as a percentage of revenue to 38.4%, compared to 38.2% in the prior year period. • Selling and promotional expenses decreased as a percentage of revenue to 17.8%, compared to 18.4% in the prior year period. • General and administrative expenses as a percentage of revenue increased slightly to 23.2% compared to 23.1% in the prior year period. • GAAP net income decreased to $0.3 million, or $0.02 per diluted share, compared to $6.8 million, or $0.41 per diluted share, in the prior year period. • Adjusted net income (a non - GAAP measure) for the third quarter of 2016 was $5.7 million, or $ 0.35 per diluted share. See “GAAP to Adjusted Net Income Reconciliation ” in the appendix of this presentation and the tables in the earnings release for additional detail. • Cash and cash equivalents increased to $137.7 million, compared to $105.7 million at December 31, 2015.
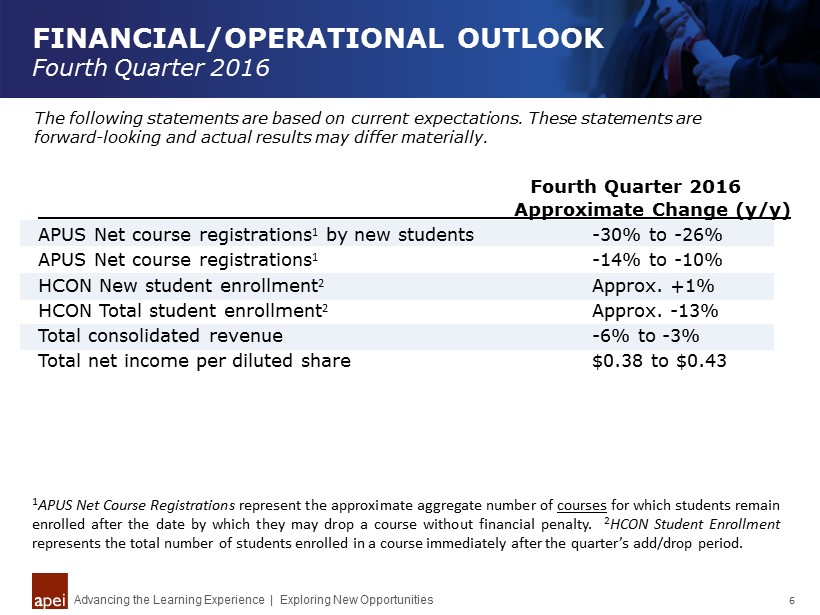
FINANCIAL/OPERATIONAL OUTLOOK Fourth Quarter 2016 Advancing the Learning Experience | Exploring New Opportunities 6 The following statements are based on current expectations. These statements are forward - looking and actual results may differ materially. Approximate Change (y/y) APUS Net course registrations 1 by new students - 30% to - 26% APUS Net course registrations 1 - 14% to - 10% HCON New student enrollment 2 Approx. +1% HCON Total student enrollment 2 Approx. - 11% Total consolidated revenue - 6% to - 3% Total net income per diluted share $0.38 to $0.43 Fourth Quarter 2016 1 APUS Net Course Registrations represent the approximate aggregate number of courses for which students remain enrolled after the date by which they may drop a course without financial penalty . 2 HCON Student Enrollment represents the total number of students enrolled in a course immediately after the quarter’s add/drop period .

Second Quarter 2016 Financial Results Conference Call November 7, 2016

APPENDIX GAAP to Adjusted Net Income Reconciliation 8 GAAP to Adjusted Net Income Reconciliation: Net income: $ 326 $ 0.02 $ 6,757 $ 0.41 Add adjustments: Loss on disposal of student course registration software development 3,978 0.25 — — Impairment of goodwill 4,735 0.29 — — Tax effect of non-GAAP adjustments (3,318) (0.20) — — Adjusted net income: $ 5,721 $ 0.35 $ 6,757 $ 0.41 Weighted average number of diluted common shares outstanding: 2015 16,233 The following table sets forth the reconciliation of the Company’s reported GAAP net income to the calculation of adjusted net income for the three and nine months ended September 31, 2016 and 2015: (In thousands, except per share data) 2016 $ Per Share Three Months Ended September 30, (Unaudited) $ Per Share 16,662 $ 17,262 $ 1.07 $ 22,623 $ 1.33 3,978 0.25 — — 4,735 0.29 — — (3,318) (0.21) — — $ 22,657 $ 1.40 $ 22,623 $ 1.33 2016 2015 Per Share (unaudited) Nine Months Ended September 30, $ 16,175 $ Per Share 16,974