Attached files
| file | filename |
|---|---|
| 8-K - 8-K - US BANCORP \DE\ | d249198d8k.htm |
 BancAnalysts Association
of Boston Conference November 4, 2016 Terry Dolan, Vice Chairman and CFO Bill Parker Vice Chairman and CRO Exhibit 99.1 |
 U.S.
BANCORP | 2
Forward looking statements and
additional information The following information appears in accordance with the Private Securities Litigation Reform Act of 1995:
Today’s presentation contains forward looking statements about U.S. Bancorp.
Statements that are not historical or current facts, including statements
about beliefs and expectations, are forward-looking statements and are based on the information available to, and assumptions and estimates made by, management as of the date hereof. These forward-looking statements cover, among other things, anticipated future
revenue and expenses and the future plans and prospects of U.S.
Bancorp. Forward-looking statements involve inherent risks and uncertainties, and important factors could cause actual results to differ materially from those anticipated. A reversal or slowing of the current economic
recovery or another severe contraction could adversely affect U.S.
Bancorp’s revenues and the values of its assets and liabilities. Global financial markets could experience a recurrence of significant turbulence, which could reduce the availability of funding to certain financial institutions and
lead to a tightening of credit, a reduction of business activity, and
increased market volatility. Stress in the commercial real estate markets, as well as a downturn in the residential real estate markets, could cause credit losses and deterioration in asset values. In addition, U.S. Bancorp’s business and financial performance is likely to be negatively impacted by recently enacted and future legislation and regulation. U.S.
Bancorp’s results could
also be adversely affected by deterioration in general business and economic conditions (which could result, in part, from the United Kingdom’s withdrawal from the European Union); changes in interest rates; deterioration in the credit quality of its loan portfolios
or in the value of the
collateral securing those loans; deterioration in the value of securities held in its investment securities portfolio; legal and regulatory developments; litigation; increased competition from both banks and non-banks; changes in customer behavior and preferences; breaches in data
security;
effects of mergers and acquisitions and related integration; effects of critical accounting policies and judgments; and management’s ability to effectively manage credit risk, market risk, operational risk, compliance risk, strategic risk, interest rate risk, liquidity risk and
reputational risk.
For discussion of these and other risks that may cause actual results to differ from
expectations, refer to U.S. Bancorp’s Annual Report on Form 10-K for the year ended December 31, 2015, on file with the Securities and Exchange Commission, including the sections entitled
“Risk Factors” and “Corporate Risk Profile” contained
in Exhibit 13, and all subsequent filings with the Securities and Exchange Commission under Sections 13(a), 13(c), 14 or 15(d) of the Securities Exchange Act of 1934, including the Quarterly Report on Form 10-Q for the quarter ended
September 30, 2016. However, factors other than these also could
adversely affect U.S. Bancorp’s results, and the reader should not consider these factors to be a complete set of all potential risks or uncertainties. Forward-looking statements speak only as of the date
hereof, and U.S. Bancorp undertakes no obligation to update them in light
of new information or future events. This
presentation include non-GAAP financial measures to describe U.S. Bancorp’s performance. The calculations of these measures are provided in the Appendix. These disclosures should not be viewed as a substitute for operating results determined in accordance with GAAP,
nor are they necessarily comparable to non-GAAP performance measures
that may be presented by other companies. |
 U.S.
Bancorp NYSE Traded
USB Founded 1863 Market Value $76B Market value as of October 28, 2016 Branches 3,114 ATMs 4,875 Customers 18.6M Assets $454B Deposits $335B Loans $271B U.S. BANCORP | 3 |
 Optimal
Business Mix 3Q16 YTD taxable-equivalent basis
Business line revenue percentages exclude Treasury and Corporate Support, see slide 35
for reconciliation •
Balanced mix of fee revenue and
balance sheet businesses
• High return/capital efficient businesses (Payments, Wealth Management) • Consistent, predictable, repeatable revenue sources Revenue Mix by Business Line Payment Services 31% Consumer and Small Business Banking 40% Wealth Mgmt and Securities Services 12% Wholesale Banking and Commercial Real Estate 17% U.S. BANCORP | 4 |
 U.S.
Bancorp Revenue Mix
Peer Bank Average Revenue Mix Optimal Revenue Mix Trading, Brokerage, Investment Banking, Equity Investments 3% Full year 2015, taxable-equivalent basis; Business line revenue percentages exclude Treasury and Corporate Support Trading, Brokerage, Investment Banking, Equity Investments 13% U.S. BANCORP | 5 Interest Income 55% Payments Fee Revenue 16% Fiduciary Activities 5% Service Charges 6% Mortgage Fees 5% Other Fee Income 10% Interest Income 55% Payments Fee Revenue 5% Fiduciary Activities 4% Service Charges 8% Mortgage Fees 4% Other Fee Income 11% |
 U.S.
BANCORP | 6
Consumer and Small Business Banking
Scale in Key Businesses
An Integrated Component of our Business
Consumer and Small Business Banking Wealth Management and Securities Services Private Client Group partnership to bring whole bank to Wealth Management customers Payments Branches offer access to credit card and merchant services Wholesale Banking Community model delivers Wholesale Banking Key Themes Sources: SNL, Small Business Administration, Inside Mortgage Finance, Mortgage Bankers Association, Experian AutoCount, JD Power
Rank • Branch Network (25-state footprint) #4 • In-store/Onsite Branch Network #1 • SBA Lender #3 • Bank Mortgage Originator #4 • Bank New Automobile Financing #5 • Branch Satisfaction #5 • Differentiated delivery model: onsite branches, metro branches, community banking and virtual
• Moving beyond demographics to segmentation • Right-sizing the branch network provides expense and revenue opportunity • Our Omnichannel strategy delivered through NextGen banking • Relationship banking is enabled by data U.S. BANCORP | 6 |
 Wholesale
Banking Competitive Advantages
An Integrated Component of our Business
Wholesale Banking Consumer and Small Business Banking Wholesale Banking Treasury Management products offered to Community Banking clients; consumer banking services offered to employees of Wholesale Banking clients Payments Corporate payments solutions offered to all Wholesale Banking clients Wealth Management and Securities Services Corporate trust, escrow and custody services offered to Wholesale Banking clients Key Themes • Strong financial performance with optimal size • Best-in-class debt ratings make us the counterparty of choice • Diverse mix of revenue • Effective partnerships across U.S. Bank • Superior debt ratings enable pricing power and “favored” counterparty status
• Strong balance sheet provides capacity to uptier relationships to lead position • Disciplined risk culture provides stability demanded by customers • Change in competitive landscape – e.g., retrenching by global banks – provides uptier opportunity • Diverse product set and horizontal strategy across lines enable customer penetration
Wealth Management services
offered to senior executives of
Wholesale Banking clients
U.S. BANCORP | 7 |
 Wealth
Management and Securities Services Competitive Advantages
An Integrated Component of our Business
Wealth Management and Securities Services Consumer and Small Business Banking Introduction of Wealth Management services to Consumer and Small Business Banking customers Payments Offers credit cards, corporate payments and merchant services solutions to Wealth Management clients Wholesale Banking Introduction of Securities Services to larger corporate lending customers Key Themes • Scale and product breadth • Trusted brand • Talent management and investment • Client experience and segmentation • Partnership opportunities • European presence Wealth Management • Team-based approach brings the whole bank to affluent customers • Extending auto-investing to reach clients • Growing introductions through data analytics Securities Services • Investments in technology, people and processes position us for growth • Significant growth potential in European markets Provider of Wealth Management services to executives and business owners U.S. BANCORP | 8 |
 Payment
Services Competitive Advantages
An Integrated Component of our Business
Payment Services Consumer and Small Business Banking Offers credit, debit and prepaid cards through retail distribution channels Wealth Management and Securities Services Offers Private Client credit and debit cards Wholesale Banking Offers commercial cards and purchasing and payment processing solutions for large corporate and government entities Key Themes • Unique singular international processing platform • Integrated Payments provider • Proven acquisition track record • Largest distribution network • Flexible partnership model • Proven geographic expansion capabilities • Focus on profitable growth • Building on strengths of existing partners and capabilities to widen our footprint
• Extending our competitive advantage by cultivating distribution networks • Focus on digital to leverage acquisition, usage and servicing opportunities • Proven international expansion model Offers Small Business credit and debit cards and payment solutions for small businesses U.S. BANCORP | 9 |
 What We
Have Achieved A growing balance sheet
Average Loans Year-over-Year Growth ($bn) Commercial CRE Credit Card Other Retail Covered USB Peer Median 17% growth 10% growth Peers include: BAC, BBT, FITB, JPM, KEY, PNC, RF, STI, and WFC; excluding significant acquisitions
2013 Average Loans $227 billion 3Q16 Average Loans $270 billion $227.5 $241.7 $250.5 $269.6 2013 2014 2015 3Q16 5.6% 6.3% 3.6% 7.6%
Res Mtg and Home Equity
U.S. BANCORP | 10 34% 16% 27% 8% 13% 2% 30% 17% 28% 7% 14% 4% |
 What We
Have Achieved A growing balance sheet
Average Deposits Year-over-Year Growth ($bn) Noninterest bearing Checking and Savings Time USB Peer Median 25% growth 13% growth Peers include: BAC, BBT, FITB, JPM, KEY, PNC, RF, STI, and WFC; excluding significant acquisitions
2013 Average Deposits $250 billion 3Q16 Average Deposits $319 billion $250.5 $266.6 $287.2 $318.5 2013 2014 2015 3Q16 6.3% 6.5% 7.7% 10.0%
U.S. BANCORP
| 11 26% 64% 10% 28% 54% 18% |
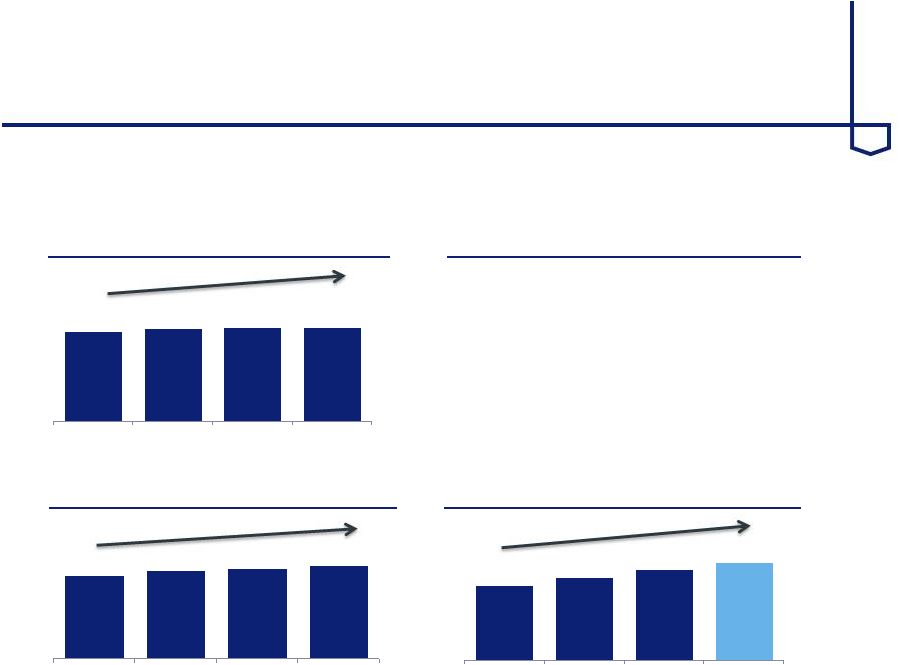 What We
Have Achieved Earnings and book value growth
Net Income ($bn) $5.6 $5.8 $5.9 $5.9 2012 2013 2014 2015 1.4% CAGR • Challenging environment since 2013 • Regulatory changes • Elevated compliance costs • Reliable capital generation Earnings Per Share (diluted) $2.84 $3.00 $3.08 $3.16 2012 2013 2014 2015 3.6% CAGR Tangible Book Value Per Share $14.41 $15.96 $17.44 $18.85 2013 2014 2015 3Q16 10.3% CAGR Observations Taxable equivalent basis U.S. BANCORP | 12 |
 What We
Have Achieved 15.8%
14.7% 14.0% 13.4% 2013 2014 2015 3Q16YTD ROE Trend Industry-leading profitability • Capital efficient business mix • Disciplined capital deployment • Efficient platform Changing regulatory environment • Regulatory capital requirements • Compliance costs • Liquidity requirements ROTCE vs Peers - 1Q13 to 3Q16 Average 1.50% 1.37% 1.24% 1.22% 1.06% 0.93% 0.93% 0.93% 0.90% 0.56% USB Peer 9 Peer 6 Peer 3 Peer 2 Peer 5 Peer 8 Peer 7 Peer 4 Peer 1 20.1% 16.5% 13.9% 13.5% 13.0% 12.5% 11.1% 10.0% 9.5% 7.4% USB Peer 9 Peer 2 Peer 3 Peer 6 Peer 4 Peer 8 Peer 7 Peer 5 Peer 1 ROE vs Peers - 1Q13 to 3Q16 Average 14.5% 12.9% 11.1% 9.8% 9.6% 8.6% 8.2% 7.7% 6.8% 4.7% USB Peer 9 Peer 3 Peer 6 Peer 4 Peer 2 Peer 5 Peer 8 Peer 7 Peer 1 ROA vs Peers - 1Q13 to 3Q16 Average Peers include: BAC, BBT, FITB, JPM, KEY, PNC, RF, STI, and WFC ROE = Return on Average Common Equity; ROA = Return on Average Assets; ROTCE = Return on Tangible Common Equity
ROTCE calculated using ending balances
Industry-leading returns
U.S. BANCORP | 13 |
 Performance and Positioning
Efficiency as a competitive advantage
Efficient platform • Single processing platforms • Full consolidation of acquisitions • Operating scale in all significant businesses • Business line monthly review process • Capital expenditures/investment process • Sustainable process solutions • Technology investments • Digitization of products and services • Ongoing efficiency efforts • Financial discipline Source of competitive advantage Future drivers of success Driver of higher returns 53.5% 58.0% 59.5% 61.0% 62.3% 64.6% 65.9% 66.0% 68.7% 76.3% USB Peer 1 Peer 2 Peer 3 Peer 4 Peer 5 Peer 6 Peer 7 Peer 8 Peer 9 Efficiency Ratio 1Q13 to 3Q16 Average U.S. BANCORP | 14 |
 Performance and Positioning
Funding as a competitive advantage
Holding Company Rating Outlook Rating Outlook Rating Outlook Rating Outlook USB A1 s A+ s AA s AA s WFC A2 s A on AA- on AA s BBT A2 s A- s A+ s A (high) s JPM A3 s A- s A+ s A (high) op PNC A3 s A- s A+ s A (high) s BAC Baa1 s BBB+ s A s A (low) op FITB Baa1 s BBB+ s A on A (low) s STI Baa1 s BBB+ s A- s A (low) s KEY Baa1 s BBB+ on A- on BBB (high) s RF Baa3 wp BBB s BBB op BBB op Moody's S&P Fitch DBRS Best-in-Class Debt Ratings • Lower cost of funding • Pricing advantage • Flight-to-quality • Customer confidence Competitive Advantages 5-year Bank Debt Spread to U.S. Treasuries (bps) 60 72.5 75 82.5 82.5 90 95 95 100 107.5 USB Peer 1 Peer 2 Peer 3 Peer 4 Peer 5 Peer 6 Peer 7 Peer 8 Peer 9 All data as of October 31, 2016 U.S. BANCORP | 15 |
 Performance and Positioning
Asset sensitivity and liquidity
• Asset sensitivity • Reliable source of core deposits • Diversified sources of liquidity • Excess cash and liquid assets • Wholesale funding sources • Off-balance sheet capacity • Strong LCR $133 $167 $170 $181 2013 2014 2015 Jul-16 Sensitivity Well-balanced position Total Available Liquidity ($bn) U.S. BANCORP | 16 1.07 % 1.38 % 1.78 % 2.15 % 1.53 % 1.68 % 2.69 % 2.91 % 0.00% 1.00% 2.00% 3.00% 4.00% 2013 2014 2015 2Q16 Up 50 bps Immediate Up 200 bps Gradual |
 Performance and Positioning
Capital flexibility 4.5% 9.3% 2.5% 1.5% Common Equity Tier 1 Basel III Target 3Q16 Reported Internal Buffer Minimum Capital Requirement 8.5% Competitive advantages • Diversified business mix • Lower risk profile • PPNR sustainability Capital levels align with • Risk profile • Capital generation • Returns to shareholders Fully Phased-In CET1 Ratio Capital Conservation Buffer U.S. BANCORP | 17 |
 Bank-wide Culture of Innovation
We work across business lines to imagine and develop solutions
that solve today’s challenges and open tomorrow’s markets
Defend and extend current core business Build momentum and emerging new businesses Create options for future businesses HORIZON 1 HORIZON 2 HORIZON 3 • Support emerging technology adoption for current core businesses • Identify changes in consumer and business trends • Seed long-term opportunities U.S. BANCORP | 18 |
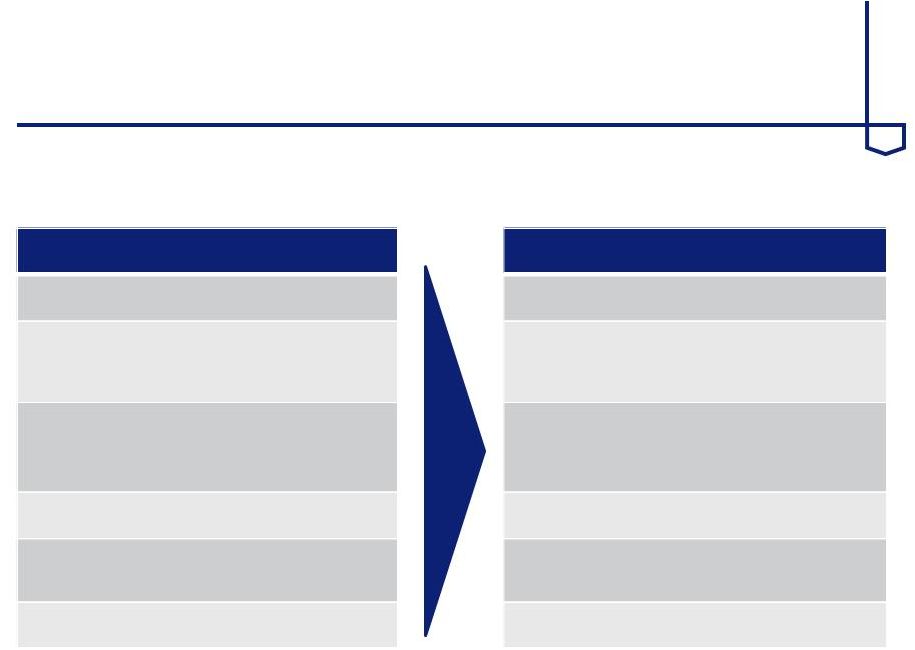 Summarizing Our Foundational Efforts
Our unified customer experience efforts impact how we work,
think and mobilize around the customer at U.S. Bancorp
FROM TO Product-focused Several approaches to segment and target customers Fragmented initiatives, focused with business lines (e.g. customer communications) Sales-focused experience Financial transaction excellence Functional features Customer-centric Bank-wide segmentation model Company-wide, integrated initiatives and investments End-to-end customer focus Engaging and personal interactions Emotional connections U.S. BANCORP | 19 |
 20 U.S. BANCORP | Next Generation Banking aspiration: Define and deliver a brandable,
differentiated consumer
experience that delivers personalization and
strengthens relationships through all touch points
• Efforts are channel-agnostic and focus initially on consumer banking (retail, small business and wealth), with intent to expand • We will assess efficacy (e.g., branch format, website content, app functions) and scope (e.g., branch footprint) of each and every channel • Define our ideal, as well as what we do not
want to be, ensuring we build a scalable,
efficient model Our Next Generation Banking Initiative |
 Bank-wide Culture of Innovation
Expanding core expertise from Payments to the rest of the bank
Wealth Management Future Advisor
We are launching a technology-driven
investing and advising solution using
phone, chat and email support
Real time P2P We were the first bank in the United States to launch U.S. BANCORP | 21 |
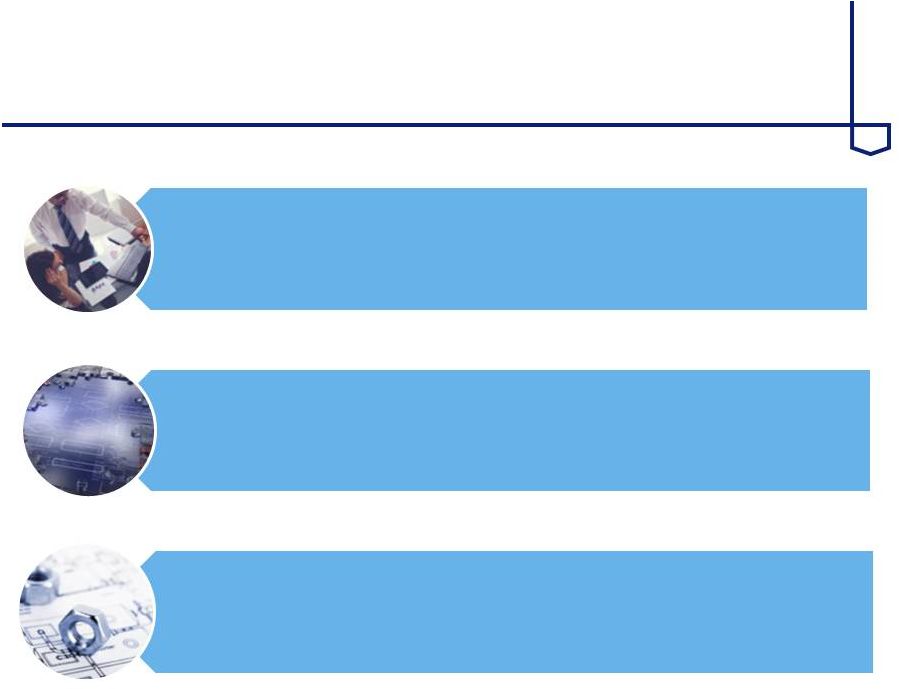 22 U.S. BANCORP | Risk Management at U.S. Bancorp Risk and governance starts at the top Investments in people, processes and technology Infrastructure largely in place and reflected in our run rates The Risk Management Committee of the Board of Directors approves and oversees the risk management framework and risk appetite statement Implemented a collaborative “Three Lines of Defense” system of checks and balances; experienced risk management team, including integrated risk officers in each business line Continue to enhance “Know Your Customer” and anti-money laundering program to address consent order |
 U.S.
BANCORP | 23
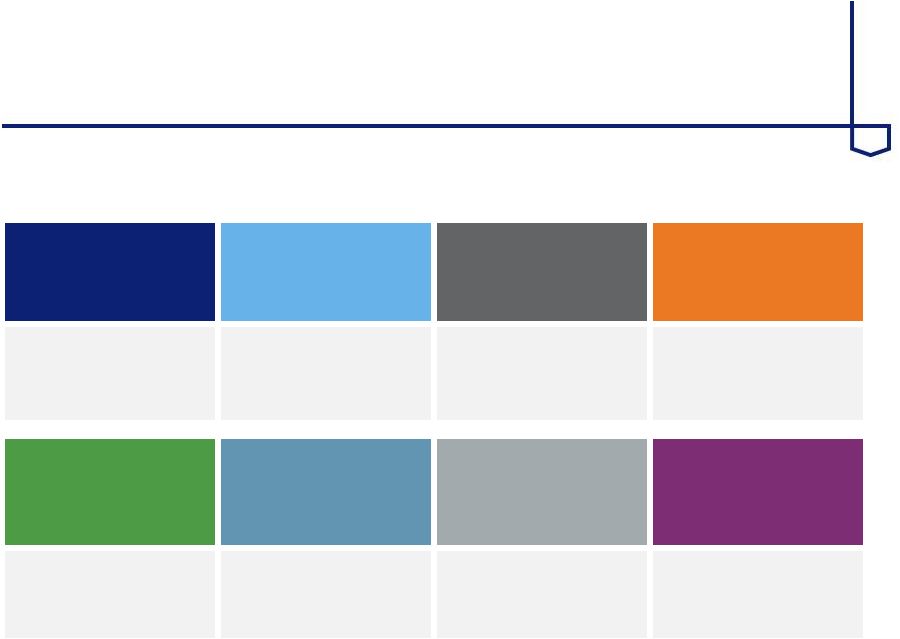
Consumer Compliance Significant investments were made to meet exacting “zero defect” standards for consumer compliance Residential Mortgage Default Management Flood Disaster Protection Compliance Fair and Responsible Banking Military Lending Act and Service Members’ Civil Relief Act People • Leadership, technical expertise and engagement are keys to success Process • Quality must be engineered and measured from start to finish Systems • Automation is critical to support scalability and quality |
 Operational Risk Management
We established an effective program for operational risk
Third party risk management Cybersecurity and information technology New and modified products and services Innovation activities Monitoring and verification activities throughout all phases of the lifecycle Independent risk management coverage; second line of defense over critical operations Comprehensive independent risk assessments Customized independent risk evaluations Payment systems Business continuity and crisis management programs Complaint management Ethics oversight End-to-end coverage by independent risk management Preparedness at all levels of the organization Timely response to customer and regulator concerns Ensuring we do the right thing U.S. BANCORP | 24 |
 Strong
Credit Culture Consistent and disciplined underwriting performs better
than the industry during times of stress
Sources: SNL, Federal Financial Institutions Examination Council (FFIEC) Consolidated
Reports of Condition and Income Peer banks: BAC, BBT, FITB, JPM, KEY, PNC,
RF, STI and WFC U.S. BANCORP
| 25 0.0% 0.5% 1.0% 1.5% 2.0% 2.5% 3.0% 3.5% 4.0% 2002 2004 2006 2008 2010 2012 2014 2016 Year Net Charge-Off Ratios Recession Indicator NCO Rate for Top 100 Banks NCO Rate for U.S. Bank USB Normalized Estimate 0.95% to 1.00% |
 U.S.
BANCORP | 26
Mix shift to newer (better) vintages at
25 bps Improved credit quality through portfolio acquisition Through-the-Cycle Normalized Charge-offs Elimination of subprime auto program Mix shift due to growth in small business cards * Includes Commercial and Commercial Real Estate U.S. Bancorp Normalized (95-100 bps) Updated through-the-cycle analysis Investor Day 2Q13 Loan Portfolio Normalized NCO% Commercial 0.45% Commercial Real Estate 0.50% Small Business* 1.75% Residential Mortgages 0.60% Credit Cards 5.00% Other Retail 1.00% Total 1.00% Investor Day 2Q16 Loan Portfolio Normalized NCO% Commercial 0.40% Commercial Real Estate 0.60% Small Business* 2.00% Residential Mortgages 0.45% Credit Cards 4.65% Other Retail 0.95% Total 0.95% |
 U.S.
BANCORP | 27
Risk Management Financial Crisis-Related Settlement Outlays Since 2010 Strong risk management produces prudent long-term growth with low volatility and consistent, predictable, repeatable results Peer banks: BAC, BBT, FITB, JPM, KEY, PNC, RF, STI and WFC Net Charge-off Volatility Since 2003 Data from published analysis by SNL Financial, The Wall Street Journal, and other external sources, and includes banks’ settlements with
GSEs from 2010 through January 2016; the national mortgage settlements;
settlements and fines imposed by the Fed and OCC in connection with the independent foreclosure review; settlements with shareholders and investors over acquisitions, transactions and offering disclosures; settlements on
derivatives, RMBS, and other securities matters; and mortgage fair
lending settlements with the U.S. government. -1%
0% 1% 2% 3% 4% 5% 6% 7% 8% USB Peer 1 Peer 2 Peer 3 Peer 4 Peer 5 Peer 6 Peer 7 Peer 8 Peer 9 80.1 40.7 17.4 11.5 8.0 7.1 1.3 0.5 0 20 40 60 80 100 Peer 1 Peer 2 Peer 3 Peer 4 Peer 5 Peer 6 Peer 7 USB Minimum/Median/Maximum NCO%
2Q16 NCO% |
 28 U.S. BANCORP | We Built Our Brand From the Inside Out We invest our hearts and minds to power human potential. Brand Drives Growth Brand Drives Loyalty |
 Recognized and Awarded • AA Long-term Debt Rating (highest-rated bank globally) – Fitch Ratings, October 2016 • Top 10 World’s Most Admired Companies – Fortune, February 2016 – Quality of management – Value as long-term investment – Soundness of financial position – Wise use of corporate assets • Most Trusted Companies for Retail Banking – Ponemon Institute, October 2016 (10 years at #1) • Best Big Bank
– MONEY, October 2016 • Corporate Equality Index (perfect score) – Human Rights Campaign Foundation, 2016 • Top Military Friendly Employer – G.I. Jobs, 2016 U.S. Bank has ranked number one on the Ponemon list since 2006, and is the only bank to rank in the top five since the privacy trust study was
first conducted in 2004.
U.S. BANCORP | 29 |
 30 U.S. BANK CONFIDENTIAL | 2016 Investor Day recap Highlights • Strategic overview • Financial management • Risk management • Innovation and the customer experience • Business line overviews Our commitment to serving our customers drives growth. Key takeaways • We engage in disciplined strategic planning to generate growth in each of our diversified businesses. • We remain well-positioned to deliver consistent, predictable, repeatable financial results. • We prudently manage risks, strengthening our reputation as a trusted financial partner. • We invest in technology and innovation to drive profitability and to be more efficient and effective for our customers. • We get better every day and leverage our strengths to seamlessly deliver the whole bank to our customers. |
 U.S.
BANCORP | 31
3Q16 Earnings Summary • Net income of $1.5 billion; $0.84 per diluted common share • Average loans grew 1.1% vs. 2Q16 • Average deposits grew 3.6% vs. 2Q16 and 10.0% vs. 3Q15 • Net interest income grew 1.6%* vs. 2Q16 and 4.3%* vs. 3Q15 – Average earning assets increased 2.2% vs. 2Q16 • Noninterest income increased 5.1% vs. 3Q15 – Mortgage banking revenue rose 31.9% vs. 2Q16 • Nonperforming assets and net charge-offs decreased slightly on a linked quarter basis • Returned 79% of earnings to shareholders through dividends and share buybacks * Taxable equivalent basis; increase of 1.7% and 4.5%, respectively, as reported on a GAAP basis; see slide 34 for reconciliation
|
 4Q16
Outlook (Linked quarter)
• Average loan growth in the range of 1.0% to 1.5% linked quarter – Mortgage loan growth expected to slow in line with industrywide tapering of refinancing activity and due to seasonality – Expect rebound in commercial loan growth – Expect strength in consumer loans to continue • Net interest margin expected decline a couple of basis points. – Net interest income will increase, principally driven by growth in earning assets
• Expenses expected to grow 2.5% – Primarily driven by seasonally higher expenses including tax credit amortization
costs related to our community development business
• Expect credit quality to remain relatively stable – Provision to increase in line with loan growth U.S. BANCORP | 32 |
 Appendix |
 Non-GAAP Financial Measures
* Preliminary data. Subject to change prior to filings with applicable regulatory
agencies. (1) Includes goodwill related to certain investments in
unconsolidated financial institutions per prescribed regulatory requirements.
(2) Includes net losses on cash flow hedges included in accumulated other comprehensive
income (loss) and other adjustments. (3) Includes higher
risk-weighting for unfunded loan commitments, investment securities, residential mortgages, mortgage servicing rights and other adjustments. (4) Primarily reflects higher risk-weighting for mortgage servicing rights. (5) Utilizes a tax rate of 35 percent for those assets and liabilities whose income or expense is not included for federal income tax
purposes. September 30,
June 30, March 31, December 31, September 30, (Dollars in Millions, Unaudited) 2016 2016 2016 2015 2015 Total equity $48,399 $48,029 $47,393 $46,817 $45,767 Preferred stock (5,501) (5,501) (5,501) (5,501) (4,756) Noncontrolling interests (640) (639) (638) (686) (692) Goodwill (net of deferred tax liability) (1) (8,239) (8,246) (8,270) (8,295) (8,324) Intangible assets, other than mortgage servicing rights (756) (796) (820) (838) (779) Tangible common equity (a) 33,263 32,847 32,164 31,497 31,216 Tangible common equity (as calculated above) 33,263 32,847 32,164 31,497 31,216 Adjustments (2) 97 133 99 67 118 Common equity tier 1 capital estimated for the Basel III fully 33,360 implemented standardized and advanced approaches (b) 32,980 32,263 31,564 31,334 Total assets 454,134 438,463 428,638 421,853 415,943 Goodwill (net of deferred tax liability) (1) (8,239) (8,246) (8,270) (8,295) (8,324) Intangible assets, other than mortgage servicing rights (756) (796) (820) (838) (779) Tangible assets (c) 445,139 429,421 419,548 412,720 406,840 Risk-weighted assets, determined in accordance with prescribed transitional standardized approach regulatory requirements (d) 356,733 * 351,462 346,227 341,360 336,227 Adjustments (3) 3,165 * 3,079 3,485 3,892 3,532 Risk-weighted assets estimated for the Basel III fully implemented
standardized approach (e)
359,898 * 354,541 349,712 345,252 339,759 Risk-weighted assets, determined in accordance with prescribed transitional advanced approaches regulatory requirements 272,832 * 271,495 267,309 261,668 248,048 Adjustments (4) 3,372 * 3,283 3,707 4,099 3,723 Risk-weighted assets estimated for the Basel III fully implemented
advanced approaches (f)
276,204 * 274,778 271,016 265,767 251,771 Ratios* Tangible common equity to tangible assets (a)/(c) 7.5 %
7.6 % 7.7 % 7.6 % 7.7 % Tangible common equity to risk-weighted assets (a)/(d) 9.3 9.3 9.3 9.2 9.3 Common equity tier 1 capital to risk-weighted assets estimated for the
Basel III fully implemented standardized approach (b)/(e)
9.3 9.3 9.2 9.1 9.2 Common equity tier 1 capital to risk-weighted assets estimated for the Basel III fully implemented advanced approaches (b)/(f) 12.1 12.0 11.9 11.9 12.4 September 30, June 30, September 30, September 30, September 30, 2016 2016 2015 2016 2015 Net interest income $2,893 $2,845 $2,768 $8,573 $8,182 Taxable-equivalent adjustment (5) 50 51 53 154 161 Net interest income, on a taxable-equivalent basis $2,943 $2,896 $2,821 $8,727 $8,343 Three Months Ended Nine Months Ended U.S. BANCORP | 34 |
 Non-GAAP Financial Measures
$ in millions Revenue Line of Business Financial Performance 3Q16 YTD Wholesale Banking and Commercial Real Estate 2,314 $
Consumer and Small Business Banking
5,432 Wealth Management and Securities Services 1,557 Payment Services 4,229 Treasury and Corporate Support 2,341 Consolidated Company 15,873 Less Treasury and Corporate Support 2,341 Consolidated Company excluding Treasury and Corporate Support 13,532 $ Percent of Total Wholesale Banking and Commercial Real Estate 14% Consumer and Small Business Banking 34% Wealth Management and Securities Services 10% Payment Services 27% Treasury and Corporate Support 15% Total 100% Percent of Total excluding Treasury and Corporate Support Wholesale Banking and Commercial Real Estate 17% Consumer and Small Business Banking 40% Wealth Management and Securities Services 12% Payment Services 31% Total 100% U.S. BANCORP | 35 |