Attached files
| file | filename |
|---|---|
| EX-32 - SECTION 1350 CERTIFICATIONS - RADIAN GROUP INC | rdn-ex32_20160930.htm |
| EX-31 - RULE 13A-14(A) CERTIFICATIONS - RADIAN GROUP INC | rdn-ex31_20160930.htm |
| EX-12 - RATIO OF EARNINGS TO FIXED CHARGES AND TO COMBINED FIXED CHARGES - RADIAN GROUP INC | rdn-ex12_20160930.htm |
| EX-10.2 - RADIAN GROUP INC. RESTRICTIVE COVENANTS AGREEMENT - RADIAN GROUP INC | rdn-ex102_20160930.htm |
| EX-10.1 - EXECUTIVE SEVERANCE AGREEMENT - RADIAN GROUP INC | rdn-ex101_20160930.htm |
UNITED STATES
SECURITIES AND EXCHANGE COMMISSION
Washington, D.C. 20549
_____________________________
FORM 10-Q
_____________________________
(Mark One)
x | QUARTERLY REPORT PURSUANT TO SECTION 13 OR 15(d) OF THE SECURITIES EXCHANGE ACT OF 1934 |
For the quarterly period ended September 30, 2016
OR
o | TRANSITION REPORT PURSUANT TO SECTION 13 OR 15(d) OF THE SECURITIES EXCHANGE ACT OF 1934 |
For the transition period from to
Commission File Number 1-11356
_______________________________

Radian Group Inc.
(Exact name of registrant as specified in its charter)
_______________________________
Delaware | 23-2691170 | |
(State or other jurisdiction of incorporation or organization) | (I.R.S. Employer Identification No.) | |
1601 Market Street, Philadelphia, PA | 19103 | |
(Address of principal executive offices) | (Zip Code) | |
(215) 231-1000
(Registrant’s telephone number, including area code)
_____________________________________________
Indicate by check mark whether the registrant (1) has filed all reports required to be filed by Section 13 or 15(d) of the Securities Exchange Act of 1934 during the preceding 12 months (or for such shorter period that the registrant was required to file such reports), and (2) has been subject to such filing requirements for the past 90 days. Yes x No o
Indicate by check mark whether the registrant has submitted electronically and posted on its corporate Web site, if any, every Interactive Data File required to be submitted and posted pursuant to Rule 405 of Regulation S-T (§232.405 of this chapter) during the preceding 12 months (or for such shorter period that the registrant was required to submit and post such files). Yes x No o
Indicate by check mark whether the registrant is a large accelerated filer, an accelerated filer, a non-accelerated filer, or a smaller reporting company. See the definitions of “large accelerated filer,” “accelerated filer” and “smaller reporting company” in Rule 12b-2 of the Exchange Act.
Large accelerated filer x | Accelerated filer o | Non-accelerated filer o | Smaller reporting company o | |||
(Do not check if a smaller reporting company) | ||||||
Indicate by check mark whether the registrant is a shell company (as defined in Rule 12b-2 of the Exchange Act). Yes o No x
APPLICABLE ONLY TO CORPORATE ISSUERS:
Indicate the number of shares outstanding of each of the issuer’s classes of common stock, as of the latest practicable date: 214,427,037 shares of common stock, $0.001 par value per share, outstanding on November 2, 2016.
TABLE OF CONTENTS | ||
Page Number | ||
Item 1. | ||
Item 2. | ||
Item 3. | ||
Item 4. | ||
Item 1. | ||
Item 1A. | ||
Item 2. | ||
Item 6. | ||
2
GLOSSARY OF ABBREVIATIONS AND ACRONYMS
The following list defines various abbreviations and acronyms used throughout this report, including the Condensed Consolidated Financial Statements, the Notes to Unaudited Condensed Consolidated Financial Statements and Management’s Discussion and Analysis of Financial Condition and Results of Operations.
Term | Definition |
2014 Master Policy | Radian Guaranty’s Master Policy that became effective October 1, 2014 |
2015 Form 10-K | Annual Report on Form 10-K for the year ended December 31, 2015 |
ABS | Asset-backed securities |
Alt-A | Alternative-A loan where the documentation is generally limited as compared to fully documented loans (considered a non-prime loan grade) |
AOCI | Accumulated other comprehensive income (loss) |
Appeals | Internal Revenue Service Office of Appeals |
Assured | Assured Guaranty Corp., a subsidiary of Assured Guaranty Ltd. |
Available Assets | As defined in the PMIERs, these assets primarily include the liquid assets of a mortgage insurer and its affiliated reinsurers, and exclude premiums received but not yet earned |
BofA Settlement Agreement | The Confidential Settlement Agreement and Release dated September 16, 2014, by and among Radian Guaranty and Countrywide Home Loans, Inc. and Bank of America, N.A., as a successor to BofA Home Loan Servicing f/k/a Countrywide Home Loan Servicing LP, entered into in order to resolve various actual and potential claims or disputes as to mortgage insurance coverage on certain Subject Loans |
Claim Curtailment | Our legal right, under certain conditions, to reduce the amount of a claim, including due to servicer negligence |
Claim Denial | Our legal right, under certain conditions, to deny a claim |
Claim Severity | The total claim amount paid divided by the original coverage amount |
Clayton | Clayton Holdings LLC, a Delaware domiciled indirect non-insurance subsidiary of Radian Group |
CMBS | Commercial mortgage-backed securities |
Convertible Senior Notes due 2017 | Our 3.000% convertible unsecured senior notes due November 2017 ($450 million original principal amount) |
Convertible Senior Notes due 2019 | Our 2.250% convertible unsecured senior notes due March 2019 ($400 million original principal amount) |
Cures | Loans that were in default as of the beginning of a period and are no longer in default because payments were received and the loan is no longer past due |
Default to Claim Rate | Rate at which defaulted loans result in a claim |
Deficiency Amount | The assessed tax liabilities, penalties and interest associated with a formal notice of deficiency letter from the IRS |
Exchange Act | Securities Exchange Act of 1934, as amended |
Fannie Mae | Federal National Mortgage Association |
FASB | Financial Accounting Standards Board |
FHA | Federal Housing Administration |
FICO | Fair Isaac Corporation |
Foreclosure Stage Default | The Stage of Default indicating that the foreclosure sale has been scheduled or held |
Freddie Mac | Federal Home Loan Mortgage Corporation |
Freddie Mac Agreement | The Master Transaction Agreement between Radian Guaranty and Freddie Mac entered into in August 2013 |
Future Legacy Loans | With respect to the BofA Settlement Agreement, Legacy Loans where a claim decision has been or will be communicated by Radian Guaranty after February 13, 2013 |
GAAP | Accounting principles generally accepted in the United States of America |
3
Term | Definition |
Green River Capital | Green River Capital LLC, a wholly-owned subsidiary of Clayton |
GSEs | Government-Sponsored Enterprises (Fannie Mae and Freddie Mac) |
HARP | Home Affordable Refinance Program |
IBNR | Losses incurred but not reported |
IIF | Insurance in force |
Initial QSR Transaction | Initial quota share reinsurance agreement entered into with a third-party reinsurance provider in the second quarter of 2012 |
Insureds | Insured parties with respect to the BofA Settlement Agreement, consisting of Countrywide Home Loans, Inc. and Bank of America, N.A., as a successor to BofA Home Loan Servicing f/k/a Countrywide Home Loans Servicing LP |
IRS | Internal Revenue Service |
LAE | Loss adjustment expense, which includes the cost of investigating and adjusting losses and paying claims |
Legacy Loans | With respect to the BofA Settlement Agreement, loans that were originated or acquired by an Insured and were insured by Radian Guaranty prior to January 1, 2009, excluding such loans that were refinanced under HARP 2 (the Federal Housing Finance Agency’s extension of and enhancements to the HARP program) |
Legacy Portfolio | Mortgage insurance written during the poor underwriting years of 2005 through 2008, together with business written prior to 2005 |
Loss Mitigation Activity/Activities | Activities such as Rescissions, Claim Denials, Claim Curtailments and cancellations |
LTV | Loan-to-value ratio which is calculated as the percentage of the original loan amount to the original value of the property |
Master Policies | The Prior Master Policy and the 2014 Master Policy, collectively |
Minimum Required Assets | A risk-based minimum required asset amount, as defined in the PMIERs, calculated based on net RIF (RIF, net of credits permitted for reinsurance) and a variety of measures designed to evaluate credit quality |
Model Act | Mortgage Guaranty Insurers Model Act |
Monthly and Other | Insurance policies where premiums are paid on a monthly or other installment basis, excluding Single Premium Policies |
Monthly Premium Policy/Policies | Insurance policies where premiums are paid on a monthly installment basis |
Mortgage Insurance | Radian’s Mortgage Insurance business segment, which provides credit-related insurance coverage, principally through private mortgage insurance, to mortgage lending institutions |
MPP Requirement | Certain states’ statutory or regulatory risk-based capital requirement that the mortgage insurer must maintain a minimum policyholder position, which is calculated based on both risk and surplus levels |
NAIC | National Association of Insurance Commissioners |
NIW | New insurance written |
NOL | Net operating loss, calculated on a tax basis |
Notices of Deficiency | Formal letters from the IRS informing the taxpayer of an IRS determination of tax deficiency and appeal rights |
OCI | Other comprehensive income (loss) |
Persistency Rate | The percentage of insurance in force that remains on our books over a period of time |
PMIERs | Private Mortgage Insurer Eligibility Requirements effective on December 31, 2015, issued by the GSEs under oversight of the Federal Housing Finance Agency to set forth requirements an approved insurer must meet and maintain to provide mortgage guaranty insurance on loans acquired by the GSEs |
4
Term | Definition |
PMIERs Financial Requirements | Financial requirements of the PMIERs |
Prior Master Policy | Radian Guaranty’s master insurance policy in effect prior to the effective date of its 2014 Master Policy |
QSR | Quota share reinsurance |
QSR Transactions | The Initial QSR Transaction and Second QSR Transaction, collectively |
Radian | Radian Group Inc. together with its consolidated subsidiaries |
Radian Asset Assurance | Radian Asset Assurance Inc., a New York domiciled insurance company that was formerly a subsidiary of Radian Guaranty |
Radian Asset Assurance Stock Purchase Agreement | The Stock Purchase Agreement dated December 22, 2014, between Radian Guaranty and Assured, to sell 100% of the issued and outstanding shares of Radian Asset Assurance, Radian’s financial guaranty insurance subsidiary, to Assured |
Radian Group | Radian Group Inc., the registrant |
Radian Guaranty | Radian Guaranty Inc., a Pennsylvania domiciled insurance subsidiary of Radian Group |
RBC States | Risk-based capital states, which are those states that currently impose a statutory or regulatory risk-based capital requirement |
Red Bell | Red Bell Real Estate, LLC, a wholly-owned subsidiary of Clayton |
Reinstatements | Reversals of previous Rescissions, Claim Denials and Claim Curtailments |
REMIC | Real Estate Mortgage Investment Conduit |
REO | Real estate owned |
Rescission | Our legal right, under certain conditions, to unilaterally rescind coverage on our mortgage insurance policies if we determine that a loan did not qualify for insurance |
RIF | Risk in force is equal to the underlying loan unpaid principal balance multiplied by the insurance coverage percentage |
Risk-to-capital | Under certain state regulations, a minimum ratio of statutory capital calculated relative to the level of RIF, net of both RIF ceded under reinsurance and RIF related to defaulted loans |
RMBS | Residential mortgage-backed securities |
S&P | Standard & Poor’s Financial Services LLC |
SAPP | Statutory accounting principles and practices include those required or permitted, if applicable, by the insurance departments of the respective states of domicile of our insurance subsidiaries |
SEC | United States Securities and Exchange Commission |
Second QSR Transaction | Second quota share reinsurance transaction entered into with a third-party reinsurance provider in the fourth quarter of 2012 |
Second-lien | Second-lien mortgage loan |
Senior Notes due 2017 | Our 9.000% unsecured senior notes due June 2017 ($195.5 million principal amount) |
Senior Notes due 2019 | Our 5.500% unsecured senior notes due June 2019 ($300 million principal amount) |
Senior Notes due 2020 | Our 5.250% unsecured senior notes due June 2020 ($350 million principal amount) |
Senior Notes due 2021 | Our 7.000% unsecured senior notes due March 2021 ($350 million principal amount) |
Services | Radian’s Mortgage and Real Estate Services business segment, which provides mortgage- and real estate-related products and services to the mortgage finance market |
Servicing Only Loans | With respect to the BofA Settlement Agreement, loans other than Legacy Loans that were or are serviced by the Insureds and were 90 days or more past due as of July 31, 2014, or if servicing has been transferred to a servicer other than the Insureds, 90 days or more past due as of the transfer date |
5
Term | Definition |
SFR | Single family rental |
Single Premium Policy/Policies | Insurance policies where premiums are paid in a single payment and includes policies written on an individual basis (as each loan is originated) and on an aggregated basis (in which each individual loan in a group of loans is insured in a single transaction, typically after the loans have been originated) |
Single Premium QSR Transaction | Quota share reinsurance agreement covering Single Premium Policies that was entered into with a panel of six third-party reinsurance providers in the first quarter of 2016, effective January 1, 2016 |
Stage of Default | The stage a loan is in relative to the foreclosure process, based on whether a foreclosure sale has been scheduled or held |
Statutory RBC Requirement | Risk-based capital requirement imposed by the RBC States, requiring a minimum surplus level and, in certain states, a minimum ratio of statutory capital relative to the level of risk |
Subject Loans | Loans covered under the BofA Settlement Agreement, comprising Legacy Loans and Servicing Only Loans |
Surplus Note | An intercompany 0.000% surplus note due December 31, 2025 ($325 million principal amount), issued by Radian Guaranty to Radian Group in December 2015 and repaid by Radian Guaranty on June 30, 2016 |
Time in Default | The time period from the point a loan reaches default status (based on the month the default occurred) to the current reporting date |
TRID | Truth in Lending Act - Real Estate Settlement Procedures Act of 1974 (“RESPA”) Integrated Disclosure |
U.S. | The United States of America |
U.S. Treasury | United States Department of the Treasury |
VA | U.S. Department of Veterans Affairs |
ValuAmerica | ValuAmerica, Inc., a wholly-owned subsidiary of Clayton |
VIE | Variable interest entity is a legal entity subject to the variable interest entity subsections of the accounting standard regarding consolidation, and generally includes a corporation, trust or partnership in which, by design, equity investors do not have a controlling financial interest or do not have sufficient equity at risk to finance activities without additional subordinated financial support |
6
Cautionary Note Regarding Forward Looking Statements—Safe Harbor Provisions
All statements in this report that address events, developments or results that we expect or anticipate may occur in the future are “forward-looking statements” within the meaning of Section 27A of the Securities Act of 1933, Section 21E of the Exchange Act and the U.S. Private Securities Litigation Reform Act of 1995. In most cases, forward-looking statements may be identified by words such as “anticipate,” “may,” “will,” “could,” “should,” “would,” “expect,” “intend,” “plan,” “goal,” “contemplate,” “believe,” “estimate,” “predict,” “project,” “potential,” “continue,” “seek,” “strategy,” “future,” “likely” or the negative or other variations on these words and other similar expressions. These statements, which may include, without limitation, projections regarding our future performance and financial condition, are made on the basis of management’s current views and assumptions with respect to future events. Any forward-looking statement is not a guarantee of future performance and actual results could differ materially from those contained in the forward-looking statement. These statements speak only as of the date they were made, and we undertake no obligation to update or revise any forward-looking statements, whether as a result of new information, future events or otherwise. We operate in a changing environment. New risks emerge from time to time and it is not possible for us to predict all risks that may affect us. The forward-looking statements, as well as our prospects as a whole, are subject to risks and uncertainties that could cause actual results to differ materially from those set forth in the forward-looking statements. These risks and uncertainties include, without limitation:
• | changes in general economic and political conditions, including in particular but without limitation, unemployment rates, interest rates and changes in housing and mortgage credit markets, that impact the size of the insurable market and the credit performance of our insured portfolio; |
• | changes in the way customers, investors, regulators or legislators perceive the performance and financial strength of private mortgage insurers; |
• | Radian Guaranty’s ability to remain eligible under the PMIERs and other applicable requirements imposed by the Federal Housing Finance Agency and by the GSEs to insure loans purchased by the GSEs; |
• | our ability to successfully execute and implement our capital plans and to maintain sufficient holding company liquidity to meet our short- and long-term liquidity needs; |
• | our ability to successfully execute and implement our business plans and strategies, including in particular but without limitation, plans and strategies that require GSE and/or regulatory approvals; |
• | our ability to maintain an adequate level of capital in our insurance subsidiaries to satisfy existing and future state regulatory requirements; |
• | changes in the charters or business practices of, or rules or regulations imposed by or applicable to the GSEs, including the GSEs’ interpretation and application of the PMIERs to Radian Guaranty; |
• | changes in the current housing finance system in the U.S., including in particular but without limitation, the role of the FHA, the GSEs and private mortgage insurers in this system; |
• | any disruption in the servicing of mortgages covered by our insurance policies, as well as poor servicer performance; |
• | a significant decrease in the Persistency Rates of our Monthly Premium Policies; |
• | competition in our mortgage insurance business, including in particular but without limitation, price competition and competition from the FHA, VA and other forms of credit enhancement; |
• | the effect of the Dodd-Frank Wall Street Reform and Consumer Protection Act on the financial services industry in general, and on our businesses in particular; |
• | the adoption of new laws and regulations, or changes in existing laws and regulations, or the way they are interpreted; |
• | the outcome of legal and regulatory actions, reviews, audits, inquiries and investigations that could result in adverse judgments, settlements, fines, injunctions, restitutions or other relief that could require significant expenditures or have other effects on our business; |
• | the amount and timing of potential payments or adjustments associated with federal or other tax examinations, including deficiencies assessed by the IRS resulting from its examination of our 2000 through 2007 tax years, which we are currently contesting; |
7
• | the possibility that we may fail to estimate accurately the likelihood, magnitude and timing of losses in connection with establishing loss reserves for our mortgage insurance business; |
• | volatility in our results of operations caused by changes in the fair value of our assets and liabilities, including a significant portion of our investment portfolio; |
• | changes in GAAP or SAPP rules and guidance, or their interpretation; |
• | legal and other limitations on dividends and other amounts we may receive from our subsidiaries; and |
• | the possibility that we may need to impair the carrying value of goodwill established in connection with our acquisition of Clayton. |
For more information regarding these risks and uncertainties as well as certain additional risks that we face, you should refer to the Risk Factors detailed in Item 1A of our 2015 Form 10-K, and in our subsequent quarterly and other reports filed from time to time with the SEC. We caution you not to place undue reliance on these forward-looking statements, which are current only as of the date on which we issued this report. We do not intend to, and we disclaim any duty or obligation to, update or revise any forward-looking statements to reflect new information or future events or for any other reason.
8
PART I—FINANCIAL INFORMATION
Item 1. Financial Statements (Unaudited)
Radian Group Inc.
CONDENSED CONSOLIDATED BALANCE SHEETS (UNAUDITED)
($ in thousands, except per-share amounts) | September 30, 2016 | December 31, 2015 | |||||
Assets | |||||||
Investments (Note 5) | |||||||
Fixed-maturities available for sale—at fair value (amortized cost $2,655,791 and $1,893,356) | $ | 2,757,508 | $ | 1,865,461 | |||
Equity securities available for sale—at fair value (cost $1,330 and $75,538) | 1,330 | 75,430 | |||||
Trading securities—at fair value | 969,657 | 1,279,137 | |||||
Short-term investments—at fair value | 835,960 | 1,076,944 | |||||
Other invested assets | 1,293 | 1,714 | |||||
Total investments | 4,565,748 | 4,298,686 | |||||
Cash | 46,356 | 46,898 | |||||
Restricted cash | 10,312 | 13,000 | |||||
Accounts and notes receivable | 94,692 | 61,734 | |||||
Deferred income taxes, net (Note 9) | 401,442 | 577,945 | |||||
Goodwill and other intangible assets, net (Note 6) | 279,400 | 289,417 | |||||
Prepaid reinsurance premium | 229,754 | 40,491 | |||||
Other assets (Note 8) | 422,123 | 313,929 | |||||
Total assets | $ | 6,049,827 | $ | 5,642,100 | |||
Liabilities and Stockholders’ Equity | |||||||
Unearned premiums | $ | 680,973 | $ | 680,300 | |||
Reserve for losses and loss adjustment expense (“LAE”) (Note 10) | 821,934 | 976,399 | |||||
Long-term debt (Note 11) | 1,067,666 | 1,219,454 | |||||
Reinsurance funds withheld (Note 1) | 177,147 | — | |||||
Other liabilities | 413,401 | 269,016 | |||||
Total liabilities | 3,161,121 | 3,145,169 | |||||
Commitments and contingencies (Note 12) | |||||||
Stockholders’ equity | |||||||
Common stock: par value $.001 per share; 485,000,000 shares authorized at September 30, 2016 and December 31, 2015; 231,967,395 and 224,432,465 shares issued at September 30, 2016 and December 31, 2015, respectively; 214,405,103 and 206,871,768 shares outstanding at September 30, 2016 and December 31, 2015, respectively | 232 | 224 | |||||
Treasury stock, at cost: 17,562,292 and 17,560,697 shares at September 30, 2016 and December 31, 2015, respectively | (893,197 | ) | (893,176 | ) | |||
Additional paid-in capital | 2,778,860 | 2,716,618 | |||||
Retained earnings | 937,338 | 691,742 | |||||
Accumulated other comprehensive income (loss) (“AOCI”) (Note 14) | 65,473 | (18,477 | ) | ||||
Total stockholders’ equity | 2,888,706 | 2,496,931 | |||||
Total liabilities and stockholders’ equity | $ | 6,049,827 | $ | 5,642,100 | |||
See Notes to Unaudited Condensed Consolidated Financial Statements.
9
Radian Group Inc.
CONDENSED CONSOLIDATED STATEMENTS OF OPERATIONS (UNAUDITED)
Three Months Ended September 30, | Nine Months Ended September 30, | ||||||||||||||
(In thousands, except per-share amounts) | 2016 | 2015 | 2016 | 2015 | |||||||||||
Revenues: | |||||||||||||||
Net premiums earned—insurance | $ | 238,149 | $ | 227,433 | $ | 688,184 | $ | 689,465 | |||||||
Services revenue | 43,096 | 42,189 | 112,990 | 116,322 | |||||||||||
Net investment income | 28,430 | 22,091 | 84,470 | 58,704 | |||||||||||
Net gains (losses) on investments and other financial instruments | 7,711 | 3,868 | 69,524 | 49,095 | |||||||||||
Other income | 3,497 | 1,711 | 8,835 | 4,785 | |||||||||||
Total revenues | 320,883 | 297,292 | 964,003 | 918,371 | |||||||||||
Expenses: | |||||||||||||||
Provision for losses | 55,785 | 64,192 | 148,501 | 141,780 | |||||||||||
Policy acquisition costs | 6,119 | 2,880 | 17,901 | 17,593 | |||||||||||
Direct cost of services | 26,704 | 24,949 | 73,311 | 67,722 | |||||||||||
Other operating expenses | 64,862 | 65,082 | 189,531 | 186,587 | |||||||||||
Interest expense | 19,783 | 21,220 | 63,863 | 70,106 | |||||||||||
Loss on induced conversion and debt extinguishment (Note 11) | 17,397 | 11 | 75,075 | 91,887 | |||||||||||
Amortization and impairment of intangible assets | 3,292 | 3,273 | 9,931 | 9,577 | |||||||||||
Total expenses | 193,942 | 181,607 | 578,113 | 585,252 | |||||||||||
Pretax income from continuing operations | 126,941 | 115,685 | 385,890 | 333,119 | |||||||||||
Income tax provision | 44,138 | 45,594 | 138,726 | 126,108 | |||||||||||
Net income from continuing operations | 82,803 | 70,091 | 247,164 | 207,011 | |||||||||||
Income (loss) from discontinued operations, net of tax | — | — | — | 5,385 | |||||||||||
Net income | $ | 82,803 | $ | 70,091 | $ | 247,164 | $ | 212,396 | |||||||
Net income per share: | |||||||||||||||
Basic: | |||||||||||||||
Net income from continuing operations | $ | 0.39 | $ | 0.34 | $ | 1.17 | $ | 1.05 | |||||||
Income (loss) from discontinued operations, net of tax | — | — | — | 0.03 | |||||||||||
Net income | $ | 0.39 | $ | 0.34 | $ | 1.17 | $ | 1.08 | |||||||
Diluted: | |||||||||||||||
Net income from continuing operations | $ | 0.37 | $ | 0.29 | $ | 1.09 | $ | 0.88 | |||||||
Income (loss) from discontinued operations, net of tax | — | — | — | 0.02 | |||||||||||
Net income | $ | 0.37 | $ | 0.29 | $ | 1.09 | $ | 0.90 | |||||||
Weighted-average number of common shares outstanding—basic | 214,387 | 207,938 | 210,858 | 197,562 | |||||||||||
Weighted-average number of common and common equivalent shares outstanding—diluted | 225,968 | 250,795 | 230,672 | 246,993 | |||||||||||
Dividends per share | $ | 0.0025 | $ | 0.0025 | $ | 0.0075 | $ | 0.0075 | |||||||
See Notes to Unaudited Condensed Consolidated Financial Statements.
10
Radian Group Inc.
CONDENSED CONSOLIDATED STATEMENTS OF COMPREHENSIVE INCOME (LOSS) (UNAUDITED)
Three Months Ended September 30, | Nine Months Ended September 30, | ||||||||||||||
(In thousands) | 2016 | 2015 | 2016 | 2015 | |||||||||||
Net income | $ | 82,803 | $ | 70,091 | $ | 247,164 | $ | 212,396 | |||||||
Other comprehensive income (loss), net of tax (Note 14): | |||||||||||||||
Unrealized gains (losses) on investments: | |||||||||||||||
Unrealized holding gains (losses) arising during the period | 6,943 | 4,012 | 86,614 | (11,154 | ) | ||||||||||
Less: Reclassification adjustment for net gains (losses) included in net income | 3,695 | (223 | ) | 2,296 | 44,408 | ||||||||||
Net unrealized gains (losses) on investments | 3,248 | 4,235 | 84,318 | (55,562 | ) | ||||||||||
Net foreign currency translation adjustments | (36 | ) | (120 | ) | (346 | ) | (88 | ) | |||||||
Activity related to investments recorded as assets held for sale | — | — | — | (3,254 | ) | ||||||||||
Net actuarial gains (losses) | 156 | — | (22 | ) | — | ||||||||||
Other comprehensive income (loss), net of tax | 3,368 | 4,115 | 83,950 | (58,904 | ) | ||||||||||
Comprehensive income | $ | 86,171 | $ | 74,206 | $ | 331,114 | $ | 153,492 | |||||||
See Notes to Unaudited Condensed Consolidated Financial Statements.
11
Radian Group Inc.
CONDENSED CONSOLIDATED STATEMENTS OF CHANGES IN COMMON STOCKHOLDERS’ EQUITY (UNAUDITED)
Nine Months Ended September 30, | |||||||
(In thousands) | 2016 | 2015 | |||||
Common Stock | |||||||
Balance, beginning of period | $ | 224 | $ | 209 | |||
Impact of extinguishment of Convertible Senior Notes due 2017 and 2019 (Note 11) | 17 | 28 | |||||
Issuance of common stock under incentive and benefit plans | — | 1 | |||||
Termination of capped calls (Note 11) | — | (3 | ) | ||||
Shares repurchased under share repurchase program (Note 13) | (9 | ) | (11 | ) | |||
Balance, end of period | 232 | 224 | |||||
Treasury Stock | |||||||
Balance, beginning of period | (893,176 | ) | (892,961 | ) | |||
Repurchases of common stock under incentive plans | (21 | ) | (215 | ) | |||
Balance, end of period | (893,197 | ) | (893,176 | ) | |||
Additional Paid-in Capital | |||||||
Balance, beginning of period | 2,716,618 | 2,531,513 | |||||
Issuance of common stock under incentive and benefit plans | 1,711 | 2,394 | |||||
Stock-based compensation | 17,632 | 13,214 | |||||
Impact of extinguishment of Convertible Senior Notes due 2017 and 2019 (Note 11) | 143,078 | 349,191 | |||||
Termination of capped calls (Note 11) | — | 11,976 | |||||
Change in equity component of currently redeemable convertible senior notes | — | 11,911 | |||||
Shares repurchased under share repurchase program (Note 13) | (100,179 | ) | (201,989 | ) | |||
Balance, end of period | 2,778,860 | 2,718,210 | |||||
Retained Earnings | |||||||
Balance, beginning of period | 691,742 | 406,814 | |||||
Net income | 247,164 | 212,396 | |||||
Dividends declared | (1,568 | ) | (1,479 | ) | |||
Balance, end of period | 937,338 | 617,731 | |||||
Accumulated Other Comprehensive Income (Loss) (“AOCI”) | |||||||
Balance, beginning of period | (18,477 | ) | 51,485 | ||||
Net foreign currency translation adjustment, net of tax | (346 | ) | (88 | ) | |||
Net unrealized gains (losses) on investments, net of tax | 84,318 | (58,816 | ) | ||||
Net actuarial gains (losses) | (22 | ) | — | ||||
Balance, end of period | 65,473 | (7,419 | ) | ||||
Total Stockholders’ Equity | $ | 2,888,706 | $ | 2,435,570 | |||
See Notes to Unaudited Condensed Consolidated Financial Statements.
12
Radian Group Inc. | |||||||
CONDENSED CONSOLIDATED STATEMENTS OF CASH FLOWS (UNAUDITED) | |||||||
(In thousands) | Nine Months Ended September 30, | ||||||
2016 | 2015 | ||||||
Cash flows from operating activities: | |||||||
Net cash provided by (used in) operating activities, continuing operations | $ | 290,137 | $ | (5,993 | ) | ||
Net cash provided by (used in) operating activities, discontinued operations | — | (1,759 | ) | ||||
Net cash provided by (used in) operating activities | 290,137 | (7,752 | ) | ||||
Cash flows from investing activities: | |||||||
Proceeds from sales of: | |||||||
Fixed-maturity investments available for sale | 537,679 | 16,208 | |||||
Equity securities available for sale | 74,868 | 145,550 | |||||
Trading securities | 178,227 | 13,566 | |||||
Proceeds from redemptions of: | |||||||
Fixed-maturity investments available for sale | 220,126 | 64,747 | |||||
Trading securities | 106,589 | 169,991 | |||||
Purchases of: | |||||||
Fixed-maturity investments available for sale | (1,419,431 | ) | (1,006,985 | ) | |||
Equity securities available for sale | (830 | ) | (500 | ) | |||
Sales, redemptions and (purchases) of: | |||||||
Short-term investments, net | 241,579 | (160,874 | ) | ||||
Other assets and other invested assets, net | 2,390 | 13,596 | |||||
Proceeds from the sale of investment in affiliate, net of cash transferred | — | 784,866 | |||||
Purchases of property and equipment, net | (28,252 | ) | (19,264 | ) | |||
Acquisitions, net of cash acquired | — | (6,449 | ) | ||||
Net cash provided by (used in) investing activities, continuing operations | (87,055 | ) | 14,452 | ||||
Net cash provided by (used in) investing activities, discontinued operations | — | 4,999 | |||||
Net cash provided by (used in) investing activities | (87,055 | ) | 19,451 | ||||
Cash flows from financing activities: | |||||||
Dividends paid | (1,568 | ) | (1,479 | ) | |||
Issuance of long-term debt, net | 343,417 | 343,479 | |||||
Purchases and redemptions of long-term debt | (445,069 | ) | (128,486 | ) | |||
Proceeds from termination of capped calls | — | 11,973 | |||||
Issuance of common stock | 343 | — | |||||
Purchase of common shares | (100,188 | ) | (202,000 | ) | |||
Excess tax benefits from stock-based awards | 115 | 3,000 | |||||
Repayment of other borrowings | (292 | ) | — | ||||
Net cash provided by (used in) financing activities, continuing operations | (203,242 | ) | 26,487 | ||||
Net cash provided by (used in) financing activities, discontinued operations | — | — | |||||
Net cash provided by (used in) financing activities | (203,242 | ) | 26,487 | ||||
Effect of exchange rate changes on cash | (382 | ) | (42 | ) | |||
Increase (decrease) in cash | (542 | ) | 38,144 | ||||
Cash, beginning of period | 46,898 | 30,465 | |||||
Less: Increase (decrease) in cash of business held for sale | — | (421 | ) | ||||
Cash, end of period | $ | 46,356 | $ | 69,030 | |||
See Notes to Unaudited Condensed Consolidated Financial Statements.
13
Radian Group Inc.
Notes to Unaudited Condensed Consolidated Financial Statements
1. Condensed Consolidated Financial Statements—Business Overview and Significant Accounting Policies
Business Overview
We provide mortgage insurance and products and services to the real estate and mortgage finance industries through our two business segments—Mortgage Insurance and Services.
Mortgage Insurance
Our Mortgage Insurance segment provides credit-related insurance coverage, principally through private mortgage insurance, to mortgage lending institutions nationwide. Private mortgage insurance helps protect mortgage lenders by mitigating default-related losses on residential mortgage loans made to home buyers who generally make downpayments of less than 20% of the purchase price for their homes. Private mortgage insurance also facilitates the sale of these low-downpayment mortgage loans in the secondary mortgage market, most of which are sold to the GSEs.
Our Mortgage Insurance segment currently offers primary mortgage insurance coverage on residential first-lien mortgage loans, which comprised 97.8% of our $47.3 billion total direct RIF at September 30, 2016. At September 30, 2016, pool insurance represented 2.1% of our total direct RIF. We provide our mortgage insurance products mainly through our wholly-owned subsidiary, Radian Guaranty.
The GSEs and state insurance regulators impose capital and financial requirements on our insurance subsidiaries. These include Risk-to-capital, other risk-based capital measures and surplus requirements, as well as the PMIERs Financial Requirements discussed below. Failure to comply with these capital and financial requirements may limit the amount of insurance that our insurance subsidiaries may write. The GSEs and our state insurance regulators also possess significant discretion with respect to our insurance subsidiaries. See Note 16 for additional regulatory information.
Private mortgage insurers, including Radian Guaranty, are required to comply with the PMIERs to remain eligible insurers of loans purchased by the GSEs. At September 30, 2016, Radian Guaranty was in compliance with the PMIERs.
The PMIERs Financial Requirements, among other things, require that a mortgage insurer’s Available Assets meet or exceed its Minimum Required Assets. The GSEs may amend the PMIERs at any time, and they have broad discretion to interpret the requirements, which could impact the calculation of our Available Assets and/or Minimum Required Assets. The PMIERs specifically provide that the factors that are applied to calculate and determine a mortgage insurer’s Minimum Required Assets will be updated every two years following a minimum of 180 days’ notice (with the next review scheduled to take place in 2017), or more frequently, as determined by the GSEs, to reflect changes in macroeconomic conditions or loan performance. We have entered into reinsurance transactions as part of our capital and risk management activities, including to manage Radian Guaranty’s position under the PMIERs Financial Requirements, and the credit that we receive under the PMIERs Financial Requirements for these transactions is subject to the periodic review of the GSEs. In addition, it is our understanding that while a more comprehensive review of the PMIERs Financial Requirements is expected to take place in 2017, the GSEs currently are considering interim guidance for the industry that would negatively impact the amount of credit that we receive for our Single Premium QSR Transaction but also would give credit to certain liquid investments that are readily available to pay claims that previously were not permitted to be included in our Available Assets. As a result, we do not expect that this potential interim guidance, if and when issued, will impact Radian Guaranty’s compliance with the PMIERs.
Under the PMIERs, Radian Guaranty’s Available Assets and Minimum Required Assets are determined on an aggregate basis, taking into account the assets and insured risk of Radian Guaranty and its affiliated reinsurers. Therefore, developments that impact the assets and insured risk of Radian Guaranty’s affiliated reinsurers individually also will impact the aggregate Available Assets and Minimum Required Assets, and importantly, Radian Guaranty’s compliance with the PMIERs Financial Requirements. As a result, references to Radian Guaranty’s Available Assets and Minimum Required Assets take into consideration both Radian Guaranty and its affiliated reinsurers.
14
Radian Group Inc.
Notes to Unaudited Condensed Consolidated Financial Statements — (Continued)
Services
Our Services segment provides outsourced services, information-based analytics and specialty consulting for buyers and sellers of, and investors in, mortgage- and real estate-related loans and securities as well as other ABS. These services and solutions are provided primarily through Clayton and its subsidiaries, including Green River Capital, Red Bell and ValuAmerica. The primary lines of business in our Services segment include:
• | loan review and due diligence; |
• | surveillance, including RMBS surveillance, loan servicer oversight, loan-level servicing compliance reviews and operational reviews of mortgage servicers and originators; |
• | real estate valuation and component services that provide outsourcing and technology solutions for the SFR and residential real estate markets; as well as outsourced solutions for appraisal, title and closing services; |
• | REO management services; and |
• | services for the United Kingdom and European mortgage markets through our EuroRisk operations. |
2016 Developments
Capital Management
During the first nine months of 2016, we completed a series of transactions to strengthen our financial position. The combination of these actions had the impact of decreasing diluted shares, improving Radian Group’s debt maturity profile and improving Radian Guaranty’s position under the PMIERs Financial Requirements. This series of capital management transactions consists of:
• | the issuance of $350 million aggregate principal amount of Senior Notes due 2021; |
• | the purchases of aggregate principal amounts of $30.1 million and $322.0 million, respectively, of our outstanding Convertible Senior Notes due 2017 and 2019; |
• | the termination of the portion of the capped call transactions related to the purchased Convertible Senior Notes due 2017; |
• | the completion of the share repurchase program announced in January 2016, by purchasing an aggregate of 9.4 million shares of Radian Group common stock for $100.2 million, including commissions; |
• | the execution of the Single Premium QSR Transaction, which had the effect of increasing the amount by which Radian Guaranty’s Available Assets exceed its Minimum Required Assets under the PMIERs Financial Requirements; and |
• | the early redemption of the remaining $195.5 million aggregate principal amount of our Senior Notes due 2017. |
The purchases of Convertible Senior Notes due 2017 and 2019 and the early redemption of the Senior Notes due 2017 resulted in a pretax charge of $75.1 million during the first nine months of 2016, recorded as a loss on induced conversion and debt extinguishment.
On June 29, 2016, Radian Group’s board of directors authorized a new share repurchase program of up to $125 million of Radian Group common stock. As of September 30, 2016, the full purchase authority remained available under this share repurchase program, which expires on June 30, 2017. See Notes 7, 11 and 13 for additional information.
Significant Accounting Policies
Basis of Presentation
Our condensed consolidated financial statements include the accounts of Radian Group Inc. and its subsidiaries. We refer to Radian Group Inc. together with its consolidated subsidiaries as “Radian,” the “Company,” “we,” “us” or “our,” unless the context requires otherwise. We generally refer to Radian Group Inc. alone, without its consolidated subsidiaries, as “Radian Group.” Unless otherwise defined in this report, certain terms and acronyms used throughout this report are defined in the Glossary of Abbreviations and Acronyms included as part of this report.
15
Radian Group Inc.
Notes to Unaudited Condensed Consolidated Financial Statements — (Continued)
Our condensed consolidated financial statements are prepared in accordance with GAAP and include the accounts of all wholly-owned subsidiaries. All intercompany accounts and transactions, and intercompany profits and losses, have been eliminated. We have condensed or omitted certain information and footnote disclosures normally included in consolidated financial statements prepared in accordance with GAAP pursuant to the instructions set forth in Article 10 of Regulation S-X of the SEC.
The financial information presented for interim periods is unaudited; however, such information reflects all adjustments that are, in the opinion of management, necessary for the fair statement of the financial position, results of operations, comprehensive income and cash flows for the interim periods presented. Such adjustments are of a normal recurring nature. The year-end condensed balance sheet data was derived from our audited financial statements, but does not include all disclosures required by GAAP. These interim financial statements should be read in conjunction with the audited financial statements and notes thereto included in our 2015 Form 10-K. The results of operations for interim periods are not necessarily indicative of results to be expected for the full year or for any other period. Certain prior period amounts have been reclassified to conform to current period presentation.
As previously disclosed in our 2015 Form 10-K, for the nine months ended September 30, 2015, certain cash flows were incorrectly classified in the Company’s Condensed Consolidated Statements of Cash Flows. The Company has determined that these misclassifications are not material to the financial statements of any period. These amounts (shown below in thousands) have been corrected herein. These adjustments affected certain line items within cash flows from investing activities, but had no net impact to net cash provided by (used in) investing activities. For the nine months ended September 30, 2015, these adjustments to the affected line items within the Consolidated Statements of Cash Flows consist of the following: (i) proceeds from sales of fixed-maturity investments available for sale reported as $96,684 has been adjusted to $16,208; and (ii) purchases of fixed-maturity investments available for sale reported as $1,087,461 has been adjusted to $1,006,985.
Use of Estimates
The preparation of financial statements in conformity with GAAP requires us to make estimates and assumptions that affect the reported amounts of assets and liabilities and disclosure of our contingent assets and liabilities at the dates of the financial statements, as well as the reported amounts of revenues and expenses during the reporting periods. While the amounts included in our condensed consolidated financial statements include our best estimates and assumptions, actual results may vary materially.
Other Significant Accounting Policies
2016 Purchases of Convertible Debt Prior to Maturity. We accounted for the 2016 purchases of a portion of our outstanding convertible debt in exchange for cash and shares of Radian Group common stock as induced conversions of convertible debt in accordance with the accounting standard regarding derecognition of debt with conversion and other options, and the accounting standard regarding debt modifications and extinguishments. The accounting standards require the recognition through earnings of an inducement charge equal to the fair value of the consideration delivered in excess of the consideration issuable under the original conversion terms. The remaining consideration delivered and transaction costs incurred are required to be allocated between the extinguishment of the liability component and the reacquisition of the equity component. As a result, we recognized a loss on induced conversion and debt extinguishment equal to: (i) the inducement charges; (ii) the differences between the fair value and the carrying value of the liability component of the purchased debt; (iii) transaction costs allocated to the debt components; and (iv) unamortized debt issuance costs related to the purchased debt.
Reinsurance. In accordance with the terms of the Single Premium QSR Transaction, rather than making a cash payment or transferring investments for ceded premiums written, Radian Guaranty holds the related amounts to collateralize the reinsurers’ obligations and has established a corresponding funds withheld liability. Any loss recoveries and any potential profit commission to Radian Guaranty will be realized from this account. This liability also includes an interest credit on funds withheld, which is recorded as ceded premiums at a rate specified in the agreement and, depending on experience under the contract, may be paid to either Radian Guaranty or the reinsurers. As described in Note 2 of our 2015 Form 10-K, ceded premiums written are recorded on the balance sheet as prepaid reinsurance premiums and amortized to ceded premiums earned in a manner consistent with the recognition of income on direct premiums. See Note 7 for further discussion of our reinsurance transactions.
See Note 2 in our 2015 Form 10-K for information regarding other significant accounting policies.
16
Radian Group Inc.
Notes to Unaudited Condensed Consolidated Financial Statements — (Continued)
Recent Accounting Pronouncements
Accounting Standards Adopted During 2016. In April 2015, the FASB issued an update to the accounting standard for the accounting of internal-use software. The update provides guidance to customers about whether a cloud computing arrangement includes a software license. If a cloud computing arrangement includes a software license, then the customer should account for the software license element of the arrangement consistent with its treatment of the acquisition of other software licenses. If a cloud computing arrangement does not include a software license, the customer should account for the arrangement as a service contract. The provisions of this update are effective for interim and annual periods beginning after December 15, 2015. The implementation of this update did not have a material impact to our financial position, results of operations or cash flows.
Accounting Standards Not Yet Adopted. In May 2014, the FASB issued an update to the accounting standard regarding revenue recognition. This update is intended to provide a consistent approach in recognizing revenue. In accordance with the new standard, recognition of revenue occurs when a customer obtains control of promised goods or services, in an amount that reflects the consideration to which the entity expects to be entitled in exchange for those goods or services. In addition, the new standard requires that reporting companies disclose the nature, amount, timing, and uncertainty of revenue and cash flows arising from contracts with customers. This update is not expected to change revenue recognition principles related to investments and our insurance products, which represents a significant portion of total revenues. This update is primarily applicable to revenues from our Services segment. In July 2015, the FASB delayed the effective date for this updated standard for public companies to interim and annual periods beginning after December 15, 2017, and in March, April and May 2016, issued clarifying updates. We are currently evaluating the impact to our financial statements and future disclosures as a result of these updates, if any.
In May 2015, the FASB issued an update to the accounting standard for the accounting of short-duration insurance contracts by insurance entities. The amendments in this update require insurance entities to disclose certain information about the liability for unpaid claims and claim adjustment expenses. The additional information required is focused on improving disclosures regarding insurance liabilities, including the timing, nature and uncertainty of future cash flows related to insurance liabilities and the effect of those cash flows on the statement of comprehensive income. The disclosures required by this update are effective for public companies for annual periods beginning after December 15, 2015, and interim periods within annual periods beginning after December 15, 2016; early adoption is permitted. We are currently evaluating the additional disclosures required in our financial statements as a result of this update.
In January 2016, the FASB issued an update to the standard for the accounting of financial instruments. Among other things, the update requires: (i) equity investments to be measured at fair value with changes in fair value recognized in net income; (ii) the use of an exit price (i.e., the price that would be received to sell the asset) when measuring the fair value of financial instruments for disclosure purposes; (iii) separate presentation of financial assets and financial liabilities by measurement category and form of financial asset; and (iv) separate presentation in other comprehensive income of the portion of the total change in the fair value of a liability resulting from a change in the instrument-specific credit risk when the organization has elected to measure the liability at fair value in accordance with the fair value option for financial instruments. The update also eliminates the requirement to disclose the methods and significant assumptions used to estimate the fair value that is required to be disclosed for financial instruments measured at amortized cost on the balance sheet. This update is effective for public companies for fiscal years beginning after December 15, 2017, including interim periods within those fiscal years. Early adoption is not permitted, with the exception of the “own credit” provision. We are currently evaluating the impact to our financial statements and future disclosures as a result of this update.
17
Radian Group Inc.
Notes to Unaudited Condensed Consolidated Financial Statements — (Continued)
In February 2016, the FASB issued an update that replaces the existing accounting and disclosure requirements for leases of property, plant and equipment. The update requires lessees to recognize, as of the lease commencement date, assets and liabilities for all such leases with lease terms of more than 12 months, which is a change from the current GAAP requirement to recognize only capital leases on the balance sheet. Pursuant to the new standard, the liability initially recognized for the lease obligation is equal to the present value of the lease payments not yet made, discounted over the lease term at the implicit interest rate of the lease, if available, or otherwise at the lessee’s incremental borrowing rate. The lessee is also required to recognize an asset for its right to use the underlying asset for the lease term, based on the liability subject to certain adjustments, such as for initial direct costs. Leases are required to be classified as either operating or finance, with expense on operating leases recorded as a single lease cost on a straight-line basis. For finance leases, interest expense on the lease liability is required to be recognized separately from the straight-line amortization of the right-of-use asset. Quantitative disclosures are required for certain items, including the cost of leases, the weighted-average remaining lease term, the weighted-average discount rate and a maturity analysis of lease liabilities. Additional qualitative disclosures are also required regarding the nature of the leases, such as basis, terms and conditions of: (i) variable interest payments; (ii) extension and termination options; and (iii) residual value guarantees. This update is effective for public companies for fiscal years beginning after December 15, 2018, including interim periods within those fiscal years. Early adoption is permitted. The new standard must be adopted by applying the new guidance as of the beginning of the earliest comparative period presented, using a modified retrospective transition approach with certain optional practical expedients. We are currently evaluating the impact to our financial statements and future disclosures as a result of this update.
In March 2016, the FASB issued an update seeking to reduce complexity in the accounting standards for share-based payment transactions, including: (i) accounting for income taxes; (ii) classification of excess tax benefits on the statement of cash flows; (iii) forfeitures; (iv) minimum statutory tax withholding requirements; (v) classification of employee taxes paid on the statement of cash flows when an employer withholds shares for tax withholding purposes; (vi) the practical expedient for estimating the expected term; and (vii) intrinsic value. Among other things, the update requires: (i) all excess tax benefits and tax deficiencies to be recognized as income tax expense or benefit in the income statement as they occur; (ii) recognition of excess tax benefits, regardless of whether the benefits reduce taxes payable in the current period; and (iii) excess tax benefits to be classified along with other cash flows as an operating activity, rather than separated from other income tax cash flows as a financing activity. For companies with significant share-based compensation, these changes may result in more volatile effective tax rates and net earnings, and result in additional dilution in earnings per share calculations. This update is effective for public companies for fiscal years beginning after December 15, 2016, including interim periods within those fiscal years. Early adoption is permitted in any annual or interim period; however, an entity electing early adoption must adopt all amendments in the same period. We are currently evaluating the impact to our financial statements, earnings per share and future disclosures as a result of this update.
In June 2016, the FASB issued an update to the accounting standard regarding the measurement of credit losses on financial instruments. This update requires that financial assets measured at amortized cost basis be presented at the net (of allowance for credit losses) amount expected to be collected. Credit losses relating to available-for-sale debt securities are to be recorded through an allowance for credit losses, rather than a write-down of the asset, with the amount of the allowance limited to the amount by which fair value is less than amortized cost. This update is effective for public companies for fiscal years beginning after December 15, 2019, including interim periods within those fiscal years. Early adoption is permitted as of the fiscal years beginning after December 15, 2018, including interim periods within those fiscal years. We are currently evaluating the impact to our financial statements and future disclosures as a result of this update.
18
Radian Group Inc.
Notes to Unaudited Condensed Consolidated Financial Statements — (Continued)
In August 2016, the FASB issued an update to the accounting standard regarding the statement of cash flows. This update reduces differences in practice over the presentation and classification of certain cash receipts and cash payments. The revision provides guidance related to eight specific identified cash flow issues. The guidance will be applied on a retrospective basis beginning with the earliest period presented. This update is effective for public companies for fiscal years beginning after December 15, 2017, including interim periods within those fiscal years. Early adoption is permitted, including adoption in an interim period. We are currently evaluating the impact to our financial statements as a result of this update.
In October 2016, the FASB issued an update to the accounting standard regarding the accounting for income taxes. This update is intended to reduce complexity in accounting for the income tax consequences from intra-entity transfers of assets other than inventory. This update requires an entity to recognize the income tax consequences of an intra-entity transfer of an asset other than inventory when the transfer occurs. This update will be applied on a modified retrospective basis through a cumulative-effect adjustment directly to retained earnings as of the beginning of the period of adoption. This update is effective for public companies for fiscal years beginning after December 15, 2017, including interim periods within those fiscal years. Early adoption is permitted, including adoption in the first interim period of the adoption year. We are currently evaluating the impact to our financial statements as a result of this update.
2. Net Income Per Share
Basic net income per share is computed by dividing net income by the weighted average number of common shares outstanding, while diluted net income per share is computed by dividing net income attributable to common shareholders by the sum of the weighted average number of common shares outstanding and all dilutive potential common shares outstanding. Dilutive potential common shares relate to our stock-based compensation arrangements and our outstanding convertible senior notes. For all calculations, the determination of whether potential common shares are dilutive or anti-dilutive is based on net income from continuing operations.
19
Radian Group Inc.
Notes to Unaudited Condensed Consolidated Financial Statements — (Continued)
The calculation of the basic and diluted net income per share was as follows:
Three Months Ended September 30, | Nine Months Ended September 30, | ||||||||||||||
(In thousands, except per-share amounts) | 2016 | 2015 | 2016 | 2015 | |||||||||||
Net income from continuing operations: | |||||||||||||||
Net income from continuing operations - basic | $ | 82,803 | $ | 70,091 | $ | 247,164 | $ | 207,011 | |||||||
Adjustment for dilutive Convertible Senior Notes due 2019, net of tax (1) | 848 | 3,714 | 5,151 | 11,094 | |||||||||||
Net income from continuing operations - diluted | $ | 83,651 | $ | 73,805 | $ | 252,315 | $ | 218,105 | |||||||
Net income: | |||||||||||||||
Net income from continuing operations - basic | $ | 82,803 | $ | 70,091 | $ | 247,164 | $ | 207,011 | |||||||
Income (loss) from discontinued operations, net of tax | — | — | — | 5,385 | |||||||||||
Net income - basic | 82,803 | 70,091 | 247,164 | 212,396 | |||||||||||
Adjustment for dilutive Convertible Senior Notes due 2019, net of tax (1) | 848 | 3,714 | 5,151 | 11,094 | |||||||||||
Net income - diluted | $ | 83,651 | $ | 73,805 | $ | 252,315 | $ | 223,490 | |||||||
Average common shares outstanding - basic | 214,387 | 207,938 | 210,858 | 197,562 | |||||||||||
Dilutive effect of Convertible Senior Notes due 2017 (2) | 178 | 1,798 | 71 | 8,620 | |||||||||||
Dilutive effect of Convertible Senior Notes due 2019 | 8,274 | 37,736 | 16,897 | 37,736 | |||||||||||
Dilutive effect of stock-based compensation arrangements (2) | 3,129 | 3,323 | 2,846 | 3,075 | |||||||||||
Adjusted average common shares outstanding - diluted | 225,968 | 250,795 | 230,672 | 246,993 | |||||||||||
Net income per share: | |||||||||||||||
Basic: | |||||||||||||||
Net income from continuing operations | $ | 0.39 | $ | 0.34 | $ | 1.17 | $ | 1.05 | |||||||
Income (loss) from discontinued operations, net of tax | — | — | — | 0.03 | |||||||||||
Net income | $ | 0.39 | $ | 0.34 | $ | 1.17 | $ | 1.08 | |||||||
Diluted: | |||||||||||||||
Net income from continuing operations | $ | 0.37 | $ | 0.29 | $ | 1.09 | $ | 0.88 | |||||||
Income (loss) from discontinued operations, net of tax | — | — | — | 0.02 | |||||||||||
Net income | $ | 0.37 | $ | 0.29 | $ | 1.09 | $ | 0.90 | |||||||
______________________
(1) | As applicable, includes coupon interest, amortization of discount and fees, and other changes in income or loss that would result from the assumed conversion. |
(2) | The following number of shares of our common stock equivalents issued under our stock-based compensation arrangements and convertible debt were not included in the calculation of diluted net income per share because they were anti-dilutive: |
Three Months Ended September 30, | Nine Months Ended September 30, | ||||||||||
(in thousands) | 2016 | 2015 | 2016 | 2015 | |||||||
Shares of common stock equivalents | 1,045 | 469 | 1,045 | 730 | |||||||
Shares of Convertible Senior Notes due 2017 | — | — | 1,902 | — | |||||||
3. Segment Reporting
We have two strategic business units that we manage separately—Mortgage Insurance and Services. Adjusted pretax operating income (loss) for each segment represents segment results on a standalone basis; therefore, inter-segment eliminations and reclassifications required for consolidated GAAP presentation have not been reflected.
20
Radian Group Inc.
Notes to Unaudited Condensed Consolidated Financial Statements — (Continued)
We allocate to our Mortgage Insurance segment: (i) corporate expenses based on an allocated percentage of time spent on the Mortgage Insurance segment; (ii) all interest expense except for interest expense related to the Senior Notes due 2019 that were issued to fund our purchase of Clayton; and (iii) all corporate cash and investments.
We allocate to our Services segment: (i) corporate expenses based on an allocated percentage of time spent on the Services segment; and (ii) as noted above, all interest expense related to the Senior Notes due 2019. No corporate cash or investments are allocated to the Services segment. Inter-segment activities are recorded at market rates for segment reporting and eliminated in consolidation.
Adjusted Pretax Operating Income (Loss)
Our senior management, including our Chief Executive Officer (our chief operating decision maker), uses adjusted pretax operating income (loss) as our primary measure to evaluate the fundamental financial performance of each of Radian’s business segments and to allocate resources to the segments. Adjusted pretax operating income (loss) is defined as pretax income (loss) from continuing operations excluding the effects of net gains (losses) on investments and other financial instruments, loss on induced conversion and debt extinguishment, acquisition-related expenses, amortization and impairment of intangible assets, and net impairment losses recognized in earnings.
Although adjusted pretax operating income (loss) excludes certain items that have occurred in the past and are expected to occur in the future, the excluded items represent those that are: (1) not viewed as part of the operating performance of our primary activities; or (2) not expected to result in an economic impact equal to the amount reflected in pretax income (loss) from continuing operations. These adjustments, along with the reasons for their treatment, are described below.
(1) | Net gains (losses) on investments and other financial instruments. The recognition of realized investment gains or losses can vary significantly across periods as the activity is highly discretionary based on the timing of individual securities sales due to such factors as market opportunities, our tax and capital profile and overall market cycles. Unrealized investment gains and losses arise primarily from changes in the market value of our investments that are classified as trading. These valuation adjustments may not necessarily result in economic gains or losses. |
Trends in the profitability of our fundamental operating activities can be more clearly identified without the fluctuations of these realized and unrealized gains or losses. We do not view them to be indicative of our fundamental operating activities. Therefore, these items are excluded from our calculation of adjusted pretax operating income (loss). However, we include the change in expected economic loss or recovery associated with our consolidated VIEs, if any, in the calculation of adjusted pretax operating income (loss).
(2) | Loss on induced conversion and debt extinguishment. Gains or losses on early extinguishment of debt and losses incurred to purchase our convertible debt prior to maturity are discretionary activities that are undertaken in order to take advantage of market opportunities to strengthen our financial and capital positions; therefore, we do not view these activities as part of our operating performance. Such transactions do not reflect expected future operations and do not provide meaningful insight regarding our current or past operating trends. Therefore, these items are excluded from our calculation of adjusted pretax operating income (loss). |
(3) | Acquisition-related expenses. Acquisition-related expenses represent the costs incurred to effect an acquisition of a business (i.e., a business combination). Because we pursue acquisitions on a strategic and selective basis and not in the ordinary course of our business, we do not view acquisition-related expenses as a consequence of a primary business activity. Therefore, we do not consider these expenses to be part of our operating performance and they are excluded from our calculation of adjusted pretax operating income (loss). |
(4) | Amortization and impairment of intangible assets. Amortization of intangible assets represents the periodic expense required to amortize the cost of intangible assets over their estimated useful lives. Intangible assets with an indefinite useful life are also periodically reviewed for potential impairment, and impairment adjustments are made whenever appropriate. These charges are not viewed as part of the operating performance of our primary activities and therefore are excluded from our calculation of adjusted pretax operating income (loss). |
(5) | Net impairment losses recognized in earnings. The recognition of net impairment losses on investments can vary significantly in both size and timing, depending on market credit cycles. We do not view these impairment losses to be indicative of our fundamental operating activities. Therefore, whenever these losses occur, we exclude them from our calculation of adjusted pretax operating income (loss). |
21
Radian Group Inc.
Notes to Unaudited Condensed Consolidated Financial Statements — (Continued)
Summarized operating results for our segments as of and for the periods indicated, are as follows:
Three Months Ended September 30, | Nine Months Ended September 30, | ||||||||||||||
(In thousands) | 2016 | 2015 | 2016 | 2015 | |||||||||||
Mortgage Insurance | |||||||||||||||
Net premiums written—insurance (1) | $ | 240,999 | $ | 242,168 | $ | 499,662 | $ | 735,158 | |||||||
Decrease (increase) in unearned premiums | (2,850 | ) | (14,735 | ) | 188,522 | (45,693 | ) | ||||||||
Net premiums earned—insurance | 238,149 | 227,433 | 688,184 | 689,465 | |||||||||||
Net investment income | 28,430 | 22,091 | 84,470 | 58,704 | |||||||||||
Other income | 3,511 | 1,711 | 8,850 | 4,785 | |||||||||||
Total (2) | 270,090 | 251,235 | 781,504 | 752,954 | |||||||||||
Provision for losses | 56,151 | 64,128 | 149,500 | 141,616 | |||||||||||
Policy acquisition costs | 6,119 | 2,880 | 17,901 | 17,593 | |||||||||||
Other operating expenses before corporate allocations | 38,081 | 36,632 | 108,036 | 112,535 | |||||||||||
Total (3) | 100,351 | 103,640 | 275,437 | 271,744 | |||||||||||
Adjusted pretax operating income before corporate allocations | 169,739 | 147,595 | 506,067 | 481,210 | |||||||||||
Allocation of corporate operating expenses | 11,911 | 14,893 | 35,526 | 37,167 | |||||||||||
Allocation of interest expense | 15,360 | 16,797 | 50,596 | 56,820 | |||||||||||
Adjusted pretax operating income | $ | 142,468 | $ | 115,905 | $ | 419,945 | $ | 387,223 | |||||||
______________________
(1) | Net of ceded premiums written under the QSR Transactions and the Single Premium QSR Transaction. See Note 7 for additional information. |
(2) | Excludes net gains on investments and other financial instruments of $7.7 million and $69.5 million, respectively, for the three and nine months ended September 30, 2016, and $3.9 million and $49.1 million, respectively, for the three and nine months ended September 30, 2015, not included in adjusted pretax operating income. |
(3) | Includes inter-segment expenses as follows: |
Three Months Ended September 30, | Nine Months Ended September 30, | ||||||||||||||
(In thousands) | 2016 | 2015 | 2016 | 2015 | |||||||||||
Inter-segment expenses | $ | 718 | $ | 925 | $ | 2,023 | $ | 2,919 | |||||||
22
Radian Group Inc.
Notes to Unaudited Condensed Consolidated Financial Statements — (Continued)
Three Months Ended September 30, | Nine Months Ended September 30, | ||||||||||||||
(In thousands) | 2016 | 2015 | 2016 | 2015 | |||||||||||
Services | |||||||||||||||
Services revenue (1) | $ | 43,800 | $ | 43,114 | $ | 114,998 | $ | 119,241 | |||||||
Direct cost of services | 26,911 | 25,870 | 74,188 | 70,624 | |||||||||||
Other operating expenses before corporate allocations | 12,740 | 11,533 | 39,160 | 31,912 | |||||||||||
Total | 39,651 | 37,403 | 113,348 | 102,536 | |||||||||||
Adjusted pretax operating income before corporate allocations | 4,149 | 5,711 | 1,650 | 16,705 | |||||||||||
Allocation of corporate operating expenses | 2,265 | 1,567 | 6,795 | 3,855 | |||||||||||
Allocation of interest expense | 4,423 | 4,423 | 13,267 | 13,286 | |||||||||||
Adjusted pretax operating income (loss) | $ | (2,539 | ) | $ | (279 | ) | $ | (18,412 | ) | $ | (436 | ) | |||
______________________
(1) | Includes inter-segment revenues as follows: |
Three Months Ended September 30, | Nine Months Ended September 30, | ||||||||||||||
(In thousands) | 2016 | 2015 | 2016 | 2015 | |||||||||||
Inter-segment revenues | $ | 718 | $ | 925 | $ | 2,023 | $ | 2,919 | |||||||
Selected balance sheet information for our segments as of the periods indicated, is as follows:
At September 30, 2016 | |||||||||||
(In thousands) | Mortgage Insurance | Services | Total | ||||||||
Total assets | $ | 5,686,726 | $ | 363,101 | $ | 6,049,827 | |||||
At December 31, 2015 | |||||||||||
(In thousands) | Mortgage Insurance | Services | Total | ||||||||
Total assets | $ | 5,281,597 | $ | 360,503 | $ | 5,642,100 | |||||
23
Radian Group Inc.
Notes to Unaudited Condensed Consolidated Financial Statements — (Continued)
The reconciliation of adjusted pretax operating income to consolidated pretax income from continuing operations is as follows:
Three Months Ended September 30, | Nine Months Ended September 30, | ||||||||||||||
(In thousands) | 2016 | 2015 | 2016 | 2015 | |||||||||||
Adjusted pretax operating income (loss): | |||||||||||||||
Mortgage Insurance (1) | $ | 142,468 | $ | 115,905 | $ | 419,945 | $ | 387,223 | |||||||
Services (1) | (2,539 | ) | (279 | ) | (18,412 | ) | (436 | ) | |||||||
Total adjusted pretax operating income | 139,929 | 115,626 | 401,533 | 386,787 | |||||||||||
Net gains (losses) on investments and other financial instruments | 7,711 | 3,868 | 69,524 | 49,095 | |||||||||||
Loss on induced conversion and debt extinguishment | (17,397 | ) | (11 | ) | (75,075 | ) | (91,887 | ) | |||||||
Acquisition-related (expenses) benefits (2) | (10 | ) | (525 | ) | (161 | ) | (1,299 | ) | |||||||
Amortization and impairment of intangible assets | (3,292 | ) | (3,273 | ) | (9,931 | ) | (9,577 | ) | |||||||
Consolidated pretax income from continuing operations | $ | 126,941 | $ | 115,685 | $ | 385,890 | $ | 333,119 | |||||||
______________________
(1) | Includes inter-segment expenses and revenues as listed in the notes to the preceding tables. |
(2) | Acquisition-related (expenses) benefits represent expenses incurred to effect the acquisition of a business, net of adjustments to accruals previously recorded for acquisition expenses. |
On a consolidated basis, “adjusted pretax operating income (loss)” is a measure not determined in accordance with GAAP. Total adjusted pretax operating income (loss) is not a measure of total profitability, and therefore should not be viewed as a substitute for GAAP pretax income (loss) from continuing operations. Our definition of adjusted pretax operating income (loss) may not be comparable to similarly-named measures reported by other companies.
4. Fair Value of Financial Instruments
Available for sale securities, trading securities and certain other assets are recorded at fair value. All changes in the fair value of trading securities and certain other assets are included in our condensed consolidated statements of operations. All changes in the fair value of available for sale securities are recorded in AOCI. There were no significant changes to our fair value methodologies during the nine months ended September 30, 2016.
In accordance with GAAP, we established a three-level valuation hierarchy for disclosure of fair value measurements based on the transparency of inputs to the valuation of an asset or liability as of the measurement date. The hierarchy gives the highest priority to unadjusted quoted prices in active markets for identical assets or liabilities (Level I measurements) and the lowest priority to unobservable inputs (Level III measurements). The level in the fair value hierarchy within which the fair value measurement falls is determined based on the lowest level input that is significant to the measurement in its entirety. The three levels of the fair value hierarchy are defined below:
Level I | — Unadjusted quoted prices for identical assets or liabilities in active markets that are accessible at the measurement date for identical, unrestricted assets or liabilities; |
Level II | — Prices or valuations based on observable inputs other than quoted prices in active markets for identical assets and liabilities; and |
Level III | — Prices or valuations that require inputs that are both significant to the fair value measurement and unobservable. Level III inputs are used to measure fair value only to the extent that observable inputs are not available. |
The level of market activity used to determine the fair value hierarchy is based on the availability of observable inputs market participants would use to price an asset or a liability, including market value price observations. We provide a qualitative description of the valuation techniques and inputs used for Level II recurring and non-recurring fair value measurements in our audited annual financial statements as of December 31, 2015. For a complete understanding of the valuation techniques and inputs used as of September 30, 2016, these unaudited condensed consolidated financial statements should be read in conjunction with the audited annual financial statements and notes thereto included in our 2015 Form 10-K.
24
Radian Group Inc.
Notes to Unaudited Condensed Consolidated Financial Statements — (Continued)
The following is a list of assets that are measured at fair value by hierarchy level as of September 30, 2016:
(In thousands) | Level I | Level II | Level III | Total | |||||||||||
Assets at Fair Value | |||||||||||||||
Investment Portfolio: | |||||||||||||||
U.S. government and agency securities | $ | 152,805 | $ | — | $ | — | $ | 152,805 | |||||||
State and municipal obligations | — | 384,609 | — | 384,609 | |||||||||||
Money market instruments | 587,628 | — | — | 587,628 | |||||||||||
Corporate bonds and notes | — | 1,909,060 | — | 1,909,060 | |||||||||||
RMBS | — | 433,474 | — | 433,474 | |||||||||||
CMBS | — | 556,250 | — | 556,250 | |||||||||||
Other ABS | — | 450,853 | — | 450,853 | |||||||||||
Foreign government and agency securities | — | 41,627 | — | 41,627 | |||||||||||
Equity securities | — | 830 | 500 | 1,330 | |||||||||||
Other investments (1) | — | 46,319 | 500 | 46,819 | |||||||||||
Total Investments at Fair Value (2) | 740,433 | 3,823,022 | 1,000 | 4,564,455 | |||||||||||
Total Assets at Fair Value | $ | 740,433 | $ | 3,823,022 | $ | 1,000 | $ | 4,564,455 | |||||||
______________________
(1) | Comprising short-term certificates of deposit and commercial paper, included within Level II, and private convertible notes, included within Level III. |
(2) | Does not include certain other invested assets ($1.3 million), primarily invested in limited partnerships, accounted for as cost-method investments and not measured at fair value. |
At September 30, 2016, total Level III assets of $1.0 million accounted for less than 0.1% of total assets measured at fair value. Within other investments is a Level III investment which was purchased during the three months ended June 30, 2016, and there were no related gains or losses recorded during the quarter. Within equity securities is a Level III investment which was purchased during the three months ended June 30, 2015, and there were no related gains or losses recorded during the quarter. There were no Level III liabilities at September 30, 2016.
The following is a list of assets that are measured at fair value by hierarchy level as of December 31, 2015:
(In thousands) | Level I | Level II | Level III | Total | |||||||||||
Assets at Fair Value | |||||||||||||||
Investment Portfolio: | |||||||||||||||
U.S. government and agency securities | $ | 670,328 | $ | 8,000 | $ | — | $ | 678,328 | |||||||
State and municipal obligations | — | 341,845 | — | 341,845 | |||||||||||
Money market instruments | 443,272 | — | — | 443,272 | |||||||||||
Corporate bonds and notes | — | 1,383,186 | — | 1,383,186 | |||||||||||
RMBS | — | 297,097 | — | 297,097 | |||||||||||
CMBS | — | 544,588 | — | 544,588 | |||||||||||
Other ABS | — | 371,625 | — | 371,625 | |||||||||||
Foreign government and agency securities | — | 37,576 | — | 37,576 | |||||||||||
Equity securities | 74,930 | 25,016 | 500 | 100,446 | |||||||||||
Other investments (1) | — | 99,009 | — | 99,009 | |||||||||||
Total Investments at Fair Value (2) | 1,188,530 | 3,107,942 | 500 | 4,296,972 | |||||||||||
Total Assets at Fair Value | $ | 1,188,530 | $ | 3,107,942 | $ | 500 | $ | 4,296,972 | |||||||
______________________
(1) | Comprising short-term certificates of deposit and commercial paper. |
(2) | Does not include certain other invested assets ($1.7 million), primarily invested in limited partnerships, accounted for as cost-method investments and not measured at fair value. |
25
Radian Group Inc.
Notes to Unaudited Condensed Consolidated Financial Statements — (Continued)
At December 31, 2015, total Level III assets of $0.5 million accounted for less than 0.1% of total assets measured at fair value. This investment was purchased during the three months ended June 30, 2015, and there were no related gains or losses recorded during the year ended December 31, 2015. There were no Level III liabilities at December 31, 2015.
There were no transfers between Level I and Level II for the three and nine months ended September 30, 2016 and 2015. There were also no transfers involving Level III assets or liabilities for the three and nine months ended September 30, 2016 and 2015.
Other Fair Value Disclosure
The carrying value and estimated fair value of other selected assets and liabilities not carried at fair value on our condensed consolidated balance sheets were as follows as of the dates indicated:
September 30, 2016 | December 31, 2015 | ||||||||||||||
(In thousands) | Carrying Amount | Estimated Fair Value | Carrying Amount | Estimated Fair Value | |||||||||||
Assets: | |||||||||||||||
Other invested assets | $ | 1,293 | $ | 3,692 | $ | 1,714 | $ | 4,901 | |||||||
Liabilities: | |||||||||||||||
Long-term debt | 1,067,666 | 1,195,740 | 1,219,454 | 1,414,875 | |||||||||||
5. Investments
Available for Sale Securities
Our available for sale securities within our investment portfolio consisted of the following as of the dates indicated:
September 30, 2016 | |||||||||||||||
(In thousands) | Amortized Cost | Fair Value | Gross Unrealized Gains | Gross Unrealized Losses | |||||||||||
Fixed-maturities available for sale: | |||||||||||||||
U.S. government and agency securities | $ | 42,213 | $ | 45,035 | $ | 2,846 | $ | 24 | |||||||
State and municipal obligations | 68,520 | 75,320 | 6,800 | — | |||||||||||
Corporate bonds and notes | 1,249,233 | 1,315,525 | 66,683 | 391 | |||||||||||
RMBS | 384,867 | 391,701 | 7,054 | 220 | |||||||||||
CMBS | 446,102 | 462,750 | 17,090 | 442 | |||||||||||
Other ABS | 435,695 | 437,026 | 2,335 | 1,004 | |||||||||||
Foreign government and agency securities | 27,161 | 28,151 | 1,041 | 51 | |||||||||||
Other investments | 2,000 | 2,000 | — | — | |||||||||||
Total fixed-maturities available for sale | 2,655,791 | 2,757,508 | 103,849 | 2,132 | |||||||||||
Equity securities available for sale (1) | 1,330 | 1,330 | — | — | |||||||||||
Total debt and equity securities | $ | 2,657,121 | $ | 2,758,838 | $ | 103,849 | $ | 2,132 | |||||||
______________________
(1) | Comprised primarily of investments in Federal Home Loan Bank stock required in connection with the memberships of Radian Guaranty and Radian Reinsurance in the Federal Home Loan Bank of Pittsburgh. |
26
Radian Group Inc.
Notes to Unaudited Condensed Consolidated Financial Statements — (Continued)
December 31, 2015 | |||||||||||||||
(In thousands) | Amortized Cost | Fair Value | Gross Unrealized Gains | Gross Unrealized Losses | |||||||||||
Fixed-maturities available for sale: | |||||||||||||||
U.S. government and agency securities | $ | 13,773 | $ | 13,752 | $ | — | $ | 21 | |||||||
State and municipal obligations | 36,920 | 37,900 | 1,100 | 120 | |||||||||||
Corporate bonds and notes | 815,024 | 802,193 | 4,460 | 17,291 | |||||||||||
RMBS | 226,744 | 224,905 | 625 | 2,464 | |||||||||||
CMBS | 415,780 | 406,910 | 69 | 8,939 | |||||||||||
Other ABS | 359,452 | 355,494 | 16 | 3,974 | |||||||||||
Foreign government and agency securities | 25,663 | 24,307 | 27 | 1,383 | |||||||||||
Total fixed-maturities available for sale | 1,893,356 | 1,865,461 | 6,297 | 34,192 | |||||||||||
Equity securities available for sale (1) | 75,538 | 75,430 | — | 108 | |||||||||||
Total debt and equity securities | $ | 1,968,894 | $ | 1,940,891 | $ | 6,297 | $ | 34,300 | |||||||
______________________
(1) | Comprised primarily of a multi-sector exchange-traded fund. |
Gross Unrealized Losses and Fair Value of Available for Sale Securities
The following tables show the gross unrealized losses and fair value of our securities deemed “available for sale” aggregated by investment category and length of time that individual securities have been in a continuous unrealized loss position, as of the dates indicated:
September 30, 2016: ($ in thousands) Description of Securities | Less Than 12 Months | 12 Months or Greater | Total | ||||||||||||||||||||||||||||||
# of securities | Fair Value | Unrealized Losses | # of securities | Fair Value | Unrealized Losses | # of securities | Fair Value | Unrealized Losses | |||||||||||||||||||||||||
U.S. government and agency securities | 4 | $ | 3,536 | $ | 24 | — | $ | — | $ | — | 4 | $ | 3,536 | $ | 24 | ||||||||||||||||||
Corporate bonds and notes | 14 | 29,166 | 115 | 6 | 18,271 | 276 | 20 | 47,437 | 391 | ||||||||||||||||||||||||
RMBS | 9 | 92,845 | 220 | — | — | — | 9 | 92,845 | 220 | ||||||||||||||||||||||||
CMBS | 19 | 54,676 | 442 | — | — | — | 19 | 54,676 | 442 | ||||||||||||||||||||||||
Other ABS | 28 | 60,953 | 147 | 30 | 79,609 | 857 | 58 | 140,562 | 1,004 | ||||||||||||||||||||||||
Foreign government and agency securities | 1 | 254 | — | 3 | 3,601 | 51 | 4 | 3,855 | 51 | ||||||||||||||||||||||||
Total | 75 | $ | 241,430 | $ | 948 | 39 | $ | 101,481 | $ | 1,184 | 114 | $ | 342,911 | $ | 2,132 | ||||||||||||||||||
27
Radian Group Inc.
Notes to Unaudited Condensed Consolidated Financial Statements — (Continued)
December 31, 2015: ($ in thousands) Description of Securities | Less Than 12 Months | 12 Months or Greater | Total | ||||||||||||||||||||||||||||||
# of securities | Fair Value | Unrealized Losses | # of securities | Fair Value | Unrealized Losses | # of securities | Fair Value | Unrealized Losses | |||||||||||||||||||||||||
U.S. government and agency securities | 1 | $ | 5,752 | $ | 21 | — | $ | — | $ | — | 1 | $ | 5,752 | $ | 21 | ||||||||||||||||||
State and municipal obligations | 2 | 11,674 | 120 | — | — | — | 2 | 11,674 | 120 | ||||||||||||||||||||||||
Corporate bonds and notes | 117 | 510,807 | 16,773 | 6 | 8,700 | 518 | 123 | 519,507 | 17,291 | ||||||||||||||||||||||||
RMBS | 12 | 168,415 | 2,464 | — | — | — | 12 | 168,415 | 2,464 | ||||||||||||||||||||||||
CMBS | 58 | 387,268 | 8,939 | — | — | — | 58 | 387,268 | 8,939 | ||||||||||||||||||||||||
Other ABS | 96 | 284,998 | 2,559 | 14 | 43,225 | 1,415 | 110 | 328,223 | 3,974 | ||||||||||||||||||||||||
Foreign government and agency securities | 18 | 18,733 | 1,095 | 3 | 2,278 | 288 | 21 | 21,011 | 1,383 | ||||||||||||||||||||||||
Equity securities | 1 | 74,930 | 108 | — | — | — | 1 | 74,930 | 108 | ||||||||||||||||||||||||
Total | 305 | $ | 1,462,577 | $ | 32,079 | 23 | $ | 54,203 | $ | 2,221 | 328 | $ | 1,516,780 | $ | 34,300 | ||||||||||||||||||
During the first nine months of 2016 and 2015, we did not recognize in earnings any impairment losses related to credit deterioration.
Although we held securities in an unrealized loss position as of September 30, 2016, we did not consider them to be other-than-temporarily impaired as of such date. For all investment categories, the unrealized losses of 12 months or greater duration as of September 30, 2016, were generally caused by interest rate or credit spread movements since the purchase date. As of September 30, 2016, we estimated that the present value of cash flows expected to be collected from these securities would be sufficient to recover the amortized cost basis of these securities. As of September 30, 2016, we did not have the intent to sell any debt securities in an unrealized loss position, and we determined that it is more likely than not that we will not be required to sell the securities before recovery of their cost basis, which may be at maturity; therefore, we did not consider these investments to be other-than-temporarily impaired at September 30, 2016.
Trading Securities
The trading securities within our investment portfolio, which are recorded at fair value, consisted of the following as of the dates indicated:
(In thousands) | September 30, 2016 | December 31, 2015 | |||||
Trading securities: | |||||||
U.S. government and agency securities | $ | 33,781 | $ | 129,913 | |||
State and municipal obligations | 273,564 | 303,946 | |||||
Corporate bonds and notes | 504,335 | 580,993 | |||||
RMBS | 41,773 | 72,192 | |||||
CMBS | 91,981 | 137,678 | |||||
Other ABS | 10,747 | 16,131 | |||||
Foreign government and agency securities | 13,476 | 13,268 | |||||
Equity securities | — | 25,016 | |||||
Total | $ | 969,657 | $ | 1,279,137 | |||
28
Radian Group Inc.
Notes to Unaudited Condensed Consolidated Financial Statements — (Continued)
For trading securities held at September 30, 2016 and December 31, 2015, we had net unrealized gains of $53.7 million during the nine months ended September 30, 2016 and net unrealized losses of $25.2 million during the year ended December 31, 2015 associated with those securities.
For the nine months ended September 30, 2016, we did not transfer any securities from the available for sale or trading categories.
Net Gains (Losses) on Investments and Other Financial Instruments
Net realized and unrealized gains (losses) on investments and other financial instruments consisted of:
Three Months Ended September 30, | Nine Months Ended September 30, | |||||||||||||||
(In thousands) | 2016 | 2015 | 2016 | 2015 | ||||||||||||
Net realized gains (losses): | ||||||||||||||||
Fixed-maturities available for sale | $ | 5,685 | $ | (343 | ) | $ | 3,703 | $ | (402 | ) | ||||||
Equity securities available for sale | — | — | (170 | ) | 68,723 | |||||||||||
Trading securities | 1,524 | (1 | ) | (295 | ) | (12,860 | ) | |||||||||
Short-term investments | 38 | (27 | ) | (1 | ) | (23 | ) | |||||||||
Other invested assets | 631 | 2,794 | 631 | 2,794 | ||||||||||||
Other gains (losses) | 15 | — | 33 | 106 | ||||||||||||
Net realized gains (losses) on investments | 7,893 | 2,423 | 3,901 | 58,338 | (1) | |||||||||||
Unrealized gains (losses) on trading securities | (47 | ) | 1,810 | 62,862 | (9,127 | ) | ||||||||||
Total net gains (losses) on investments | 7,846 | 4,233 | 66,763 | 49,211 | ||||||||||||
Net gains (losses) on other financial instruments | (135 | ) | (365 | ) | 2,761 | (116 | ) | |||||||||
Net gains (losses) on investments and other financial instruments | $ | 7,711 | $ | 3,868 | $ | 69,524 | $ | 49,095 | ||||||||
______________________
(1) | During the second quarter of 2015, we sold equity securities in our portfolio and reinvested the proceeds in assets that qualify as PMIERs-compliant Available Assets, recognizing pretax gains of $68.7 million. |
Contractual Maturities
The contractual maturities of fixed-maturity investments were as follows:
September 30, 2016 | |||||||
Available for Sale | |||||||
(In thousands) | Amortized Cost | Fair Value | |||||
Due in one year or less (1) | $ | 32,821 | $ | 32,764 | |||
Due after one year through five years (1) | 267,312 | 274,014 | |||||
Due after five years through ten years (1) | 701,735 | 732,458 | |||||
Due after ten years (1) | 387,259 | 426,795 | |||||
RMBS (2) | 384,867 | 391,701 | |||||
CMBS (2) | 446,102 | 462,750 | |||||
Other ABS (2) | 435,695 | 437,026 | |||||
Total | $ | 2,655,791 | $ | 2,757,508 | |||
______________________
(1) | Actual maturities may differ as a result of calls before scheduled maturity. |
(2) | RMBS, CMBS and Other ABS are shown separately, as they are not due at a single maturity date. |
29
Radian Group Inc.
Notes to Unaudited Condensed Consolidated Financial Statements — (Continued)
Other
At September 30, 2016 and December 31, 2015, Radian Guaranty had $75.8 million and $74.7 million, respectively, in a collateral account pursuant to the Freddie Mac Agreement. This collateral account, which contains investments primarily invested in and classified as part of our trading securities, is pledged to cover Loss Mitigation Activity on the loans subject to the Freddie Mac Agreement. Subject to certain conditions in the Freddie Mac Agreement, amounts in the collateral account may be released to Radian Guaranty over time to the extent that Loss Mitigation Activity becomes final in accordance with the terms of that agreement. See Note 10 for additional information.
6. Goodwill and Other Intangible Assets, Net
All of our goodwill and other intangible assets relate to our Services segment, as a result of our acquisition of Clayton in 2014 and its subsequent acquisitions of Red Bell and ValuAmerica in 2015. The following table shows the changes in the carrying amount of goodwill as of and for the year-to-date periods ended September 30, 2016 and December 31, 2015:
(In thousands) | Goodwill | Accumulated Impairment Losses | Net | ||||||||
Balance at December 31, 2014 | $ | 194,027 | $ | (2,095 | ) | $ | 191,932 | ||||
Goodwill acquired | 3,238 | — | 3,238 | ||||||||
Impairment losses | — | — | — | ||||||||
Balance at December 31, 2015 | 197,265 | (2,095 | ) | 195,170 | |||||||
Goodwill acquired | — | — | — | ||||||||
Impairment losses | — | — | — | ||||||||
Balance at September 30, 2016 | $ | 197,265 | $ | (2,095 | ) | $ | 195,170 | ||||
During the first quarter of 2015, Clayton expanded its service offerings by acquiring Red Bell, a real estate brokerage company that provides products and services that include automated valuation models; broker price opinions used by investors, lenders and loan servicers; and advanced technology solutions for: (i) monitoring loan portfolio performance; (ii) tracking non-performing loans; (iii) managing REO assets; and (iv) valuing and selling residential real estate through a secure platform. The transaction was treated as a purchase for accounting purposes, with the excess of the acquisition price over the estimated fair value of the net assets acquired resulting in goodwill of $2.4 million. In addition, in October 2015, Clayton acquired ValuAmerica, a national title agency and appraisal management company with a technology platform that helps mortgage lenders and their vendors streamline and manage their supply chains and operational workflow. The transaction was treated as a purchase for accounting purposes, with the excess of the acquisition price over the estimated fair value of the net assets acquired resulting in goodwill of $0.8 million. Neither of these acquisitions met the criteria to be considered a material business combination.
Goodwill is an asset representing the estimated future economic benefits arising from the assets we have acquired that were not individually identified and separately recognized, and includes the value of the discounted expected future cash flows, the workforce, expected synergies with our other affiliates and other unidentifiable intangible assets. Goodwill is deemed to have an indefinite useful life and is subject to review for impairment annually, or more frequently, whenever circumstances indicate potential impairment. Events that could result in an interim assessment of goodwill impairment and/or a potential impairment loss include, but are not limited to: (i) significant under-performance relative to historical or projected future operating results; (ii) significant changes in the strategy for the Services segment; (iii) significant negative industry or economic trends; and (iv) a decline in market capitalization below book value attributable to the Services segment. Management regularly updates certain assumptions related to our projections, including potential revenues from new initiatives and business strategies, and to the extent these items have a significant negative impact on the reporting unit’s projections we may perform additional analysis to determine whether an impairment charge is needed.
30
Radian Group Inc.
Notes to Unaudited Condensed Consolidated Financial Statements — (Continued)
The evaluation of the estimated fair value of our Services segment in comparison to the recorded value of goodwill and other intangibles is performed primarily using an income approach and requires the use of significant estimates and assumptions that are highly subjective in nature, such as attrition rates, discount rates, future expected cash flows and market conditions. The most significant assumptions relate to the valuation of goodwill and customer relationships. In particular, future expected cash flows for the Services segment include: estimated transaction volumes that are not currently contracted; volume projections associated with non-agency RMBS securitizations for which current market conditions are not favorable; and projected revenues from new business initiatives that do not have an established customer base. Our estimates are based upon assumptions believed to be reasonable, but which are inherently uncertain and unpredictable. If the projected revenues are not as favorable as those currently being used in our annual goodwill impairment assessment, or if revenues related to new initiatives and business strategies are not realized, it could result in an impairment charge which could have a material adverse effect on our results of operations for the period in which the impairment occurs.
We performed a qualitative assessment for the quarter ended September 30, 2016, and considered factors such as: (i) the decline in revenues and gross margins during 2016 (as compared to the forecasted amounts for the same period); (ii) the improvement in revenue and gross margins during the second and third quarters of 2016 (as compared to the first quarter of 2016); (iii) new senior management of the segment; and (iv) new business initiatives. Our third quarter 2016 qualitative evaluation of impairment included future revenue projections that were lower than those included in our annual impairment analysis conducted in the fourth quarter of 2015. However, based on our third quarter 2016 analysis, we concluded that it is not “more likely than not” that the fair value of the Services reporting unit is less than its carrying amount as of September 30, 2016. We monitor the performance of the Services segment each quarter, including through our annual impairment assessment planned for the fourth quarter of 2016.
The following is a summary of the gross and net carrying amounts and accumulated amortization of our other intangible assets as of the periods indicated:
As of September 30, 2016 | |||||||||||
(In thousands) | Gross Carrying Amount | Accumulated Amortization | Net Carrying Amount | ||||||||
Client relationships | $ | 83,359 | $ | (17,543 | ) | $ | 65,816 | ||||
Technology | 15,100 | (4,856 | ) | 10,244 | |||||||
Trade name and trademarks | 8,340 | (1,905 | ) | 6,435 | |||||||
Client backlog | 6,680 | (4,972 | ) | 1,708 | |||||||
Non-competition agreements | 185 | (158 | ) | 27 | |||||||
Total | $ | 113,664 | $ | (29,434 | ) | $ | 84,230 | ||||
As of December 31, 2015 | |||||||||||
(In thousands) | Gross Carrying Amount | Accumulated Amortization | Net Carrying Amount | ||||||||
Client relationships | $ | 83,471 | $ | (11,038 | ) | $ | 72,433 | ||||
Technology | 15,100 | (2,949 | ) | 12,151 | |||||||
Trade name and trademarks | 8,340 | (1,243 | ) | 7,097 | |||||||
Client backlog | 6,680 | (4,184 | ) | 2,496 | |||||||
Non-competition agreements | 185 | (115 | ) | 70 | |||||||
Total | $ | 113,776 | $ | (19,529 | ) | $ | 94,247 | ||||
31
Radian Group Inc.
Notes to Unaudited Condensed Consolidated Financial Statements — (Continued)
The estimated aggregate amortization expense for the remainder of 2016 and thereafter is as follows (in thousands):
2016 | $ | 3,287 | |
2017 | 12,621 | ||
2018 | 12,027 | ||
2019 | 10,768 | ||
2020 | 9,159 | ||
2021 | 7,353 | ||
Thereafter | 29,015 | ||
Generally, for tax purposes, substantially all of our goodwill and other intangible assets are deductible and will be amortized over a period of 15 years.
7. Reinsurance
The effect of reinsurance on net premiums written and earned is as follows:
Three Months Ended September 30, | Nine Months Ended September 30, | ||||||||||||||
(In thousands) | 2016 | 2015 | 2016 | 2015 | |||||||||||
Net premiums written-insurance: | |||||||||||||||
Direct | $ | 261,456 | $ | 253,262 | $ | 748,110 | $ | 766,708 | |||||||
Assumed | — | 7 | — | 62 | |||||||||||
Ceded (1) | (20,457 | ) | (11,101 | ) | (248,448 | ) | (31,612 | ) | |||||||
Net premiums written-insurance | $ | 240,999 | $ | 242,168 | $ | 499,662 | $ | 735,158 | |||||||
Net premiums earned-insurance: | |||||||||||||||
Direct | $ | 258,074 | $ | 242,260 | $ | 747,342 | $ | 734,221 | |||||||
Assumed | 9 | 10 | 27 | 33 | |||||||||||
Ceded (1) | (19,934 | ) | (14,837 | ) | (59,185 | ) | (44,789 | ) | |||||||
Net premiums earned-insurance | $ | 238,149 | $ | 227,433 | $ | 688,184 | $ | 689,465 | |||||||
______________________
(1) | Net of profit commission. |
In 2012, Radian Guaranty entered into two separate QSR Transactions with a third-party reinsurance provider. Radian Guaranty has ceded the maximum amount permitted under the QSR Transactions; therefore, Radian Guaranty is no longer ceding NIW under these transactions. Effective January 1, 2016, the ceding commission was reduced from 35% to 30% for a portion of the remaining reinsurance ceded under the Second QSR Transaction. Ceded losses to date under the QSR Transactions have been immaterial. See Note 8 of Notes to Consolidated Financial Statements in our 2015 Form 10-K for more information.
In the first quarter of 2016, in order to proactively manage the risk and return profile of Radian Guaranty’s insured portfolio and continue managing its position under the PMIERs Financial Requirements in a cost-effective manner, Radian Guaranty entered into the Single Premium QSR Transaction with a panel of third-party reinsurers.
Under the Single Premium QSR Transaction, effective January 1, 2016, Radian Guaranty began ceding the following Single Premium IIF and NIW, subject to certain conditions:
• | 20% of its existing performing Single Premium Policies written between January 1, 2012 and March 31, 2013; |
• | 35% of its existing performing Single Premium Policies written between April 1, 2013 and December 31, 2015; and |
• | 35% of its Single Premium NIW from January 1, 2016 to December 31, 2017, subject to a limitation on ceded premiums written equal to $195 million for policies issued between January 1, 2016 and December 31, 2017. |
32
Radian Group Inc.
Notes to Unaudited Condensed Consolidated Financial Statements — (Continued)
Radian Guaranty will receive a 25% ceding commission for premiums ceded pursuant to this transaction. Radian Guaranty will also receive a profit commission, provided that the loss ratio on the loans covered under the agreement generally remains below 55%. Losses on the ceded risk reduce Radian Guaranty’s profit commission on a dollar-for-dollar basis. Ceded losses to date under the Single Premium QSR Transaction have been immaterial.
Notwithstanding the limitation on ceded premiums written on the Single Premium QSR Transaction, the parties may mutually agree to increase the amount of ceded risk on December 31, 2017. Radian Guaranty is entitled to discontinue ceding new policies under the agreement at the end of any calendar quarter. The agreement is scheduled to terminate on December 31, 2027; however, Radian Guaranty has the option, based on certain conditions and subject to a termination fee, to terminate the agreement as of January 1, 2020, or at the end of any calendar quarter thereafter, which would result in Radian Guaranty reassuming the related RIF in exchange for a net payment from the reinsurer calculated in accordance with the terms of the agreement.
The following tables show the amounts related to the QSR Transactions and the Single Premium QSR Transaction for the periods indicated:
QSR Transactions | |||||||||||||||
Three Months Ended September 30, | Nine Months Ended September 30, | ||||||||||||||
(In thousands) | 2016 | 2015 | 2016 | 2015 | |||||||||||
Ceded premiums written (1) | $ | 6,730 | $ | 8,466 | $ | 22,048 | $ | 23,279 | |||||||
Ceded premiums earned (1) | 10,597 | 12,203 | 33,094 | 36,452 | |||||||||||
Ceding commissions written | 1,922 | 2,743 | 6,291 | 8,890 | |||||||||||
Ceding commissions earned (2) | 3,974 | 2,463 | 12,199 | 10,987 | |||||||||||
Single Premium QSR Transaction | |||||||
Three Months Ended September 30, | Nine Months Ended September 30, | ||||||
(In thousands) | 2016 | 2016 | |||||
Ceded premiums written (1) | $ | 13,004 | $ | 222,085 | |||
Ceded premiums earned (1) | 8,608 | 21,748 | |||||
Ceding commissions written | 5,482 | 61,258 | |||||
Ceding commissions earned (2) | 4,382 | 11,173 | |||||
______________________
(1) | Net of profit commission. |
(2) | Includes amounts reported in policy acquisition costs and other operating expenses. |
RIF ceded under the QSR Transactions was $1.7 billion and $2.3 billion as of September 30, 2016 and 2015, respectively. RIF ceded under the Single Premium QSR Transaction was $3.6 billion as of September 30, 2016.
33
Radian Group Inc.
Notes to Unaudited Condensed Consolidated Financial Statements — (Continued)
8. Other Assets
The following table shows the components of other assets as of the dates indicated:
(In thousands) | September 30, 2016 | December 31, 2015 | |||||
Deposit with the IRS (Note 9) | $ | 88,557 | $ | 88,557 | |||
Corporate-owned life insurance | 85,645 | 82,543 | |||||
Receivable for securities sold | 78,914 | — | |||||
Property and equipment (1) | 67,478 | 46,802 | |||||
Accrued investment income | 27,599 | 25,620 | |||||
Deferred policy acquisition costs | 13,064 | 14,267 | |||||
Reinsurance recoverables | 6,755 | 11,044 | |||||
Other | 54,111 | 45,096 | |||||
Total other assets | $ | 422,123 | $ | 313,929 | |||
______________________
(1) | Property and equipment, at cost less accumulated depreciation of $114.4 million and $106.9 million at September 30, 2016 and December 31, 2015, respectively. |
9. Income Taxes
As required under the accounting standard regarding accounting for income taxes, our deferred tax assets (“DTAs”) and deferred tax liabilities (“DTLs”) are recognized under the balance sheet method, which recognizes the future tax effect of temporary differences between the amounts recorded in our condensed consolidated financial statements and the tax bases of these amounts. DTAs and DTLs are measured using the enacted tax rates expected to apply to taxable income in the periods in which the DTA or DTL is expected to be realized or settled.
Our provision for income taxes for interim financial periods is based on an estimate of our annual effective tax rate for continuing operations for the full year. When estimating our full year 2016 and 2015 annual effective tax rates, we accounted for the tax effects of gains and losses on our investments, return-to-provision adjustments, prior year items relating to the accounting for uncertainty in income taxes and certain other adjustments, as discrete items at the federal applicable tax rate.
For federal income tax purposes, as of September 30, 2016, we had approximately $821.6 million of NOL carryforwards and no foreign tax credit carryforward. To the extent not utilized, the NOL carryforwards will expire during tax years 2030 through 2032.
We are required to establish a valuation allowance against our DTAs when it is more likely than not that all or some portion of our DTAs will not be realized. At each balance sheet date, we assess our need for a valuation allowance. Our assessment is based on all available evidence, both positive and negative. This requires management to exercise judgment and make assumptions regarding whether our DTAs will be realized in future periods. In making this assessment as of September 30, 2016, we determined that certain state and local NOLs, relating to non-insurance entities within our consolidated group, may not be realized during their applicable carryforward period. Therefore, we have recorded a valuation allowance of $41.0 million, primarily relating to the DTAs associated with these state and local NOLs as of September 30, 2016.
Our 2016 redemption of Senior Notes due 2017 and purchases of Convertible Senior Notes due 2017 and 2019 resulted in a pretax charge of $75.1 million. This included $41.8 million of market premium related to the Convertible Senior Note purchases, of which $28.5 million was non-deductible for tax purposes and impacted our annualized effective tax rate. Overall, for the nine months ended September 30, 2016, we recorded an income tax benefit of $15.3 million related to the redemption and these purchases.
34
Radian Group Inc.
Notes to Unaudited Condensed Consolidated Financial Statements — (Continued)
We are contesting adjustments resulting from the examination by the IRS of our 2000 through 2007 consolidated federal income tax returns. The IRS opposes the recognition of certain tax losses and deductions that were generated through our investment in a portfolio of non-economic REMIC residual interests and has proposed denying the associated tax benefits of these items. We appealed these proposed adjustments to Appeals and made “qualified deposits” with the U.S. Treasury of $85 million in June 2008 relating to the 2000 through 2004 tax years and $4 million in May 2010 relating to the 2005 through 2007 tax years, in order to avoid the accrual of incremental above-market-rate interest with respect to the proposed adjustments.
We attempted to reach a compromised settlement with Appeals, but in September 2014 we received Notices of Deficiency covering the 2000 through 2007 tax years that assert unpaid taxes and penalties of approximately $157 million. The Deficiency Amount has not been reduced to reflect our NOL carryback ability. As of September 30, 2016, there also would be interest of approximately $133 million related to these matters. Depending on the outcome, additional state income taxes, penalties and interest (estimated in the aggregate to be approximately $34 million as of September 30, 2016) also may become due when a final resolution is reached. The Notices of Deficiency also reflected additional amounts due of approximately $105 million, which are primarily associated with the disallowance of the previously filed carryback of our 2008 NOL to the 2006 and 2007 tax years. We currently believe that the disallowance of our 2008 NOL carryback is a precautionary position by the IRS and that we will ultimately maintain the benefit of this NOL carryback claim.
On December 3, 2014, we petitioned the U.S. Tax Court to litigate the Deficiency Amount. On September 1, 2015, we received a notice that the case had been scheduled for trial. However, the parties have jointly filed, and the U.S. Tax Court has approved, motions for continuance in this matter to postpone the trial date. Also, in February 2016, the U.S. Tax Court approved a joint motion to consolidate for trial, briefing and opinion our case with a similar case involving MGIC Investment Corporation. The litigation could take several years to resolve and may result in substantial legal expenses. We can provide no assurance regarding the outcome of any such litigation or whether a compromised settlement with the IRS will ultimately be reached. We believe that an adequate provision for income taxes has been made for the potential liabilities that may result from this matter. However, if the ultimate resolution of this matter produces a result that differs materially from our current expectations, there could be a material impact on our effective tax rate, results of operations and cash flows.
35
Radian Group Inc.
Notes to Unaudited Condensed Consolidated Financial Statements — (Continued)
10. Losses and Loss Adjustment Expense
The following table shows our reserve for Mortgage Insurance losses and LAE by category at the end of each period indicated:
(In thousands) | September 30, 2016 | December 31, 2015 | |||||
Reserves for losses by category: | |||||||
Prime | $ | 409,438 | $ | 480,481 | |||
Alt-A | 166,349 | 203,706 | |||||
A minus and below | 106,678 | 129,352 | |||||
IBNR and other (1) | 73,057 | 83,066 | |||||
LAE | 21,255 | 26,108 | |||||
Reinsurance recoverable (2) | 6,448 | 8,286 | |||||
Total primary reserves | 783,225 | 930,999 | |||||
Pool | 36,065 | 42,084 | |||||
IBNR and other | 823 | 1,118 | |||||
LAE | 1,112 | 1,335 | |||||
Reinsurance recoverable (2) | 36 | — | |||||
Total pool reserves | 38,036 | 44,537 | |||||
Total First-lien reserves | 821,261 | 975,536 | |||||
Second-lien and other (3) | 673 | 863 | |||||
Total reserve for losses | $ | 821,934 | $ | 976,399 | |||
______________________
(1) | Primarily related to expected payments under the Freddie Mac Agreement. |
(2) | Represents ceded losses on captive transactions, the QSR Transactions and the Single Premium QSR Transaction. |
(3) | Does not include our Second-lien premium deficiency reserve that is included in other liabilities. |
36
Radian Group Inc.
Notes to Unaudited Condensed Consolidated Financial Statements — (Continued)
The following table presents information relating to our reserve for losses, including our IBNR reserve and LAE but excluding our Second-lien premium deficiency reserve, for the periods indicated:
Nine Months Ended September 30, | |||||||
(In thousands) | 2016 | 2015 | |||||
Balance at beginning of period | $ | 976,399 | $ | 1,560,032 | |||
Less: Reinsurance recoverables (1) | 8,286 | 26,665 | |||||
Balance at beginning of period, net of reinsurance recoverables | 968,113 | 1,533,367 | |||||
Add: Losses and LAE incurred in respect of default notices reported and unreported in: | |||||||
Current year (2) | 152,320 | 184,490 | |||||
Prior years | (3,906 | ) | (42,158 | ) | |||
Total incurred | 148,414 | 142,332 | |||||
Deduct: Paid claims and LAE related to: | |||||||
Current year (2) | 2,725 | 3,417 | |||||
Prior years | 298,352 | 584,783 | |||||
Total paid | 301,077 | 588,200 | |||||
Balance at end of period, net of reinsurance recoverables | 815,450 | 1,087,499 | |||||
Add: Reinsurance recoverables (1) | 6,484 | 11,071 | |||||
Balance at end of period | $ | 821,934 | $ | 1,098,570 | |||
______________________
(1) | Related to ceded losses recoverable, if any, on captive reinsurance transactions, the QSR Transactions and the Single Premium QSR Transaction. See Note 7 for additional information. |
(2) | Related to underlying defaulted loans with a most recent default notice dated in the year indicated. For example, if a loan had defaulted in a prior year, but then subsequently cured and later re-defaulted in the current year, that default would be considered a current year default. |
2016 Activity
Our loss reserves at September 30, 2016 declined as compared to December 31, 2015, primarily as a result of the amount of paid claims continuing to outpace losses incurred related to new default notices reported in the current year. Reserves established for new default notices were the primary driver of our total incurred loss for the nine months ended September 30, 2016, and they were impacted primarily by the number of new primary default notices received in the period and our related gross Default to Claim Rate assumption applied to those new defaults, which was approximately 12% as of September 30, 2016. The impact to incurred losses from reserve development on default notices reported in prior years was not significant during the first nine months of 2016.
Total claims paid decreased for the nine months ended September 30, 2016, compared to the same period in 2015, primarily due to the elevated claim payments associated with the BofA Settlement Agreement (discussed below) in 2015.
2015 Activity
During the first nine months of 2015, reserves established for new default notices were the primary driver of our total incurred loss, and they were impacted primarily by the number of new primary default notices received in the period and our related gross Default to Claim Rate assumption applied to those new defaults, which was approximately 14% as of September 30, 2015. In addition, we experienced favorable reserve development on prior year defaults due primarily to a reduction in certain Default to Claim Rate assumptions based on observed trends.
Claims paid for the nine months ended September 30, 2015 include $236.6 million related to the implementation of the BofA Settlement Agreement beginning in February 2015.
37
Radian Group Inc.
Notes to Unaudited Condensed Consolidated Financial Statements — (Continued)
Default to Claim Rate
Our aggregate weighted average Default to Claim Rate assumption for our primary loans (net of Claim Denials and Rescissions) used in estimating our primary reserve for losses was 45% (41% excluding pending claims) at September 30, 2016, and 46% (42% excluding pending claims) at December 31, 2015. During the nine months ended September 30, 2016, our gross Default to Claim Rate assumption for new primary defaults was modestly reduced from approximately 13% as of December 31, 2015, to approximately 12%. As of September 30, 2016, our gross Default to Claim Rates on our primary portfolio ranged from approximately 12% for new defaults, up to approximately 65% for defaults not in foreclosure stage, and 81% for Foreclosure Stage Defaults. Our estimate of expected Rescissions and Claim Denials (net of expected Reinstatements) embedded in our Default to Claim Rate is generally based on our experience in the most recent nine months. Consideration is also given for differences in characteristics between those previously rescinded policies and denied claims and the loans remaining in our defaulted inventory, as well as the estimated impact of the BofA Settlement Agreement (discussed below) on the volume of future Rescissions and Claim Denials.
Loss Mitigation
Rescissions and Claim Denials continue to reduce our paid losses and have resulted in a reduction in our loss reserve, although our estimates of future Rescissions and Claim Denials have generally been declining. As our Legacy Portfolio has become a smaller percentage of our overall insured portfolio, we have undertaken a reduced amount of Loss Mitigation Activity with respect to the claims we receive, and we expect this trend to continue. Our estimate of net future Rescissions and Claim Denials reduced our loss reserve as of September 30, 2016 and December 31, 2015 by approximately $59 million and $69 million, respectively. The amount of estimated Rescissions and Claim Denials incorporated into our reserve analysis at any point in time is affected by a number of factors, including our estimated rate of Rescissions and Claim Denials on future claims, the volume and attributes of our defaulted insured loans, our estimated Default to Claim Rate and our estimated Claim Severity, among other assumptions. Our assumptions also reflect the estimated future impact of the BofA Settlement Agreement, as further discussed below.
Our reported Rescission and Claim Denial activity in any given period is subject to challenge by our lender and servicer customers. We expect that a portion of previous Rescissions will be reinstated and previous Claim Denials will be resubmitted with the required documentation and ultimately paid; therefore, we have incorporated this expectation into our IBNR reserve estimate. Our IBNR reserve estimate of $16.8 million and $26.6 million at September 30, 2016 and December 31, 2015, respectively, includes reserves for this expected activity.
BofA Settlement Agreement
On September 16, 2014, Radian Guaranty entered into the BofA Settlement Agreement in order to resolve various actual and potential claims or disputes related to the parties’ respective rights and duties as to mortgage insurance coverage on certain Subject Loans. Implementation of the BofA Settlement Agreement commenced on February 1, 2015 for Subject Loans held in portfolio by the Insureds or purchased by the GSEs as of that date and implementation was completed by December 31, 2015. In addition, except for certain limited circumstances, Radian Guaranty also agreed that with respect to Future Legacy Loans it will not assert any origination error or servicing defect as a basis for a decision not to pay a claim, nor will it effect a Claim Curtailment of such claims. See Note 10 of Notes to Consolidated Financial Statements in our 2015 Form 10-K for additional information about the BofA Settlement Agreement.
Freddie Mac Agreement
At September 30, 2016 and December 31, 2015, Radian Guaranty had $75.8 million and $74.7 million, respectively, in a collateral account pursuant to the Freddie Mac Agreement. Subject to certain conditions in the Freddie Mac Agreement, amounts in the collateral account may be released to Radian Guaranty over time to the extent that Loss Mitigation Activity becomes final in accordance with the terms of that agreement. In accordance with these provisions, Radian Guaranty withdrew $11.7 million from this account in October 2016 related to Loss Mitigation Activity that had become final as of August 31, 2016. Following this withdrawal, if, as of August 29, 2017, the amount of additional Loss Mitigation Activity that has become final in accordance with the Freddie Mac Agreement is less than $64 million, then any shortfall will be paid to Freddie Mac from the funds remaining in the collateral account, subject to certain adjustments designed to allow for any Loss Mitigation Activity that has not become final or any claims evaluation that has not been completed as of that date. As of September 30, 2016, we have $57 million, recorded in reserve for losses, that we expect to be paid to Freddie Mac from the funds expected to be remaining in the collateral account as of the August 29, 2017 measurement date.
38
Radian Group Inc.
Notes to Unaudited Condensed Consolidated Financial Statements — (Continued)
11. Long-Term Debt
The carrying value of our long-term debt at September 30, 2016 and December 31, 2015 was as follows:
(In thousands) | September 30, 2016 | December 31, 2015 | ||||||
9.000% | Senior Notes due 2017 | $ | — | $ | 192,261 | |||
3.000% | Convertible Senior Notes due 2017 | 20,600 | 46,115 | |||||
2.250% | Convertible Senior Notes due 2019 | 61,374 | 341,214 | |||||
5.500% | Senior Notes due 2019 | 296,611 | 295,751 | |||||
5.250% | Senior Notes due 2020 | 345,003 | 344,113 | |||||
7.000% | Senior Notes due 2021 | 344,078 | — | |||||
Total long-term debt | $ | 1,067,666 | $ | 1,219,454 | ||||
Senior Notes due 2017
On August 12, 2016, we redeemed the remaining $195.5 million aggregate principal amount of our Senior Notes due 2017 for the price established in accordance with the indenture governing the notes. We paid $211.3 million in cash (including accrued interest through the redemption date) to holders of the notes at redemption and recorded a loss on debt extinguishment of $15.0 million.
Senior Notes due 2021
In March 2016, we issued $350 million aggregate principal amount of Senior Notes due 2021 and received net proceeds of $343.4 million. These notes mature on March 15, 2021 and bear interest at a rate of 7.000% per annum, payable semi-annually on March 15 and September 15 of each year, commencing on September 15, 2016. We have the option to redeem these notes, in whole or in part, at any time or from time to time prior to maturity at a redemption price equal to the greater of: (i) 100% of the aggregate principal amount of the notes to be redeemed; and (ii) the make-whole amount, which is the sum of the present value of the remaining scheduled payments of principal and interest in respect of the notes, discounted at the applicable treasury rate plus 50 basis points, plus, in each case, accrued and unpaid interest thereon to, but excluding, the redemption date.
The Senior Notes due 2021 have covenants customary for securities of this nature, including covenants related to the payments of the notes, reports, compliance certificates and modification of the covenants. Additionally, the indenture governing the Senior Notes due 2021 includes covenants restricting us from encumbering the capital stock of a designated subsidiary (as defined in the indenture for the notes) or disposing of any capital stock of any designated subsidiary unless we either dispose of all of the stock or we retain more than 80% of the stock.
Convertible Senior Notes due 2017 and 2019
During the first nine months of 2016, we entered into privately negotiated agreements to purchase, for cash or a combination of cash and shares of Radian Group common stock, aggregate principal amounts of $30.1 million and $322.0 million, respectively, of our outstanding Convertible Senior Notes due 2017 and 2019. We funded the purchases with $235.0 million in cash (plus accrued and unpaid interest due on the purchased notes) and by issuing to certain of the sellers 17.0 million shares of Radian Group common stock. These purchases of Convertible Senior Notes due 2017 and 2019 resulted in a pretax charge in the first nine months of 2016 of $60.1 million. This charge represents:
• | the $41.8 million market premium representing the consideration paid to the sellers of the Convertible Senior Notes due 2017 and 2019 in excess of the conversion value of the purchased notes; |
• | the $17.2 million difference between the fair value and the carrying value, net of unamortized issuance costs, of the liability component of the purchased notes; and |
• | the $1.1 million impact of related transaction costs. |
39
Radian Group Inc.
Notes to Unaudited Condensed Consolidated Financial Statements — (Continued)
In connection with our March 2016 purchases of Convertible Senior Notes due 2017, we terminated a corresponding portion of the capped call transactions we had entered into in 2010 related to the initial issuance of the Convertible Senior Notes due 2017. As a result of this termination, we received consideration of 0.2 million shares of Radian Group common stock, which was valued at $2.6 million based on a stock price on the closing date of $11.86. In accordance with the accounting standards regarding equity and contracts in an entity’s own equity, the total consideration received was recorded as an increase to additional paid-in capital. The shares of Radian Group common stock received were retired, resulting in a decrease in shares issued and outstanding and a corresponding increase in unissued shares.
Upon the original issuance of the Convertible Senior Notes due 2017 and 2019, in accordance with accounting standards related to convertible debt instruments that may be settled in cash upon conversion, the Company recorded a pretax equity component, net of the capped call transaction (with respect to the Convertible Senior Notes due 2017) and related issuance costs (with respect to the Convertible Senior Notes due 2017 and 2019). The pretax equity component is not subject to remeasurement, and therefore remains unchanged unless a reduction of outstanding principal occurs. As a result of our purchases during the first nine months of 2016, the remaining pretax equity component associated with the Convertible Senior Notes due 2017 and 2019 decreased from $11.3 million and $75.1 million, respectively, at December 31, 2015 to $5.0 million and $13.1 million, respectively, at September 30, 2016.
During the three-month period ended September 30, 2016, our closing stock price did not exceed the thresholds required for the holders of our Convertible Senior Notes due 2017 or our Convertible Senior Notes due 2019 to be able to exercise their conversion rights during the three-month period ending December 31, 2016. In any period when holders of the Convertible Senior Notes due 2017 are eligible to exercise their conversion option, the equity component related to these instruments would be classified as mezzanine (temporary) equity rather than permanent equity, because we are required to settle the aggregate principal amount of the notes in cash. This equity component is the difference between (1) the amount of cash deliverable upon conversion (i.e., par value of debt) and (2) the carrying value of the debt.
Issuance and transaction costs incurred at the time of the original issuance of the convertible notes were allocated to the liability and equity components in proportion to the allocation of proceeds and are accounted for as debt issuance costs and equity issuance costs, respectively. The convertible notes are reflected on our condensed consolidated balance sheets as follows:
Convertible Senior Notes due 2017 | Convertible Senior Notes due 2019 | ||||||||||||||
(In thousands) | September 30, 2016 | December 31, 2015 | September 30, 2016 | December 31, 2015 | |||||||||||
Liability component: | |||||||||||||||
Principal | $ | 22,233 | $ | 52,370 | $ | 68,024 | $ | 389,992 | |||||||
Debt discount, net (1) | (1,551 | ) | (5,941 | ) | (6,041 | ) | (44,313 | ) | |||||||
Debt issuance costs (1) | (82 | ) | (314 | ) | (609 | ) | (4,465 | ) | |||||||
Net carrying amount | $ | 20,600 | $ | 46,115 | $ | 61,374 | $ | 341,214 | |||||||
______________________
(1) | Included within long-term debt and is being amortized over the life of the convertible notes. |
40
Radian Group Inc.
Notes to Unaudited Condensed Consolidated Financial Statements — (Continued)
The following tables set forth total interest expense recognized related to the convertible notes for the periods indicated:
Convertible Senior Notes due 2017 | |||||||||||||||
Three Months Ended September 30, | Nine Months Ended September 30, | ||||||||||||||
($ in thousands) | 2016 | 2015 | 2016 | 2015 | |||||||||||
Contractual interest expense | $ | 166 | $ | 456 | $ | 705 | $ | 6,953 | |||||||
Amortization of debt issuance costs | 17 | 43 | 71 | 659 | |||||||||||
Amortization of debt discount | 322 | 808 | 1,344 | 11,910 | |||||||||||
Total interest expense | $ | 505 | $ | 1,307 | $ | 2,120 | $ | 19,522 | |||||||
Convertible Senior Notes due 2019 | |||||||||||||||
Three Months Ended September 30, | Nine Months Ended September 30, | ||||||||||||||
($ in thousands) | 2016 | 2015 | 2016 | 2015 | |||||||||||
Contractual interest expense | $ | 493 | $ | 2,250 | $ | 3,043 | $ | 6,750 | |||||||
Amortization of debt issuance costs | 74 | 317 | 447 | 975 | |||||||||||
Amortization of debt discount | 737 | 3,146 | 4,434 | 9,342 | |||||||||||
Total interest expense | $ | 1,304 | $ | 5,713 | $ | 7,924 | $ | 17,067 | |||||||
12. Commitments and Contingencies
Legal Proceedings
See Note 17 of Notes to Consolidated Financial Statements in our 2015 Form 10-K for information regarding our accounting policies for contingencies.
We are routinely involved in a number of legal actions, reviews and audits, as well as inquiries and investigations by various regulatory entities involving compliance with laws or other regulations, the outcome of which are uncertain. We are contesting the allegations in each matter and management believes, based on current knowledge and after consultation with counsel, that the outcome of such matters will not have a material adverse effect on our consolidated financial condition. However, the outcome of litigation and other legal and regulatory matters is inherently uncertain, and it is possible that one or more of the matters currently pending or threatened could have an unanticipated adverse effect on our liquidity, financial condition or results of operations for any particular period.
As described in Note 9, on September 4, 2014, we received formal Notices of Deficiency from the IRS related to certain losses and deductions resulting from our investment in a portfolio of non-economic REMIC residual interests. We believe that an adequate provision for income taxes has been made for the potential liabilities that may result from this matter, which is now the subject of litigation as more fully described in Note 9. However, if the ultimate resolution of this matter produces a result that differs materially from our current expectations, there could be a material impact on our effective tax rate, results of operations and cash flows.
Our Master Policies establish the timeline within which any suit or action arising from any right of an insured under the policy generally must be commenced. From time to time we face challenges from certain lender and servicer customers regarding these activities and practices. We are currently in discussions regarding our Loss Mitigation Activities and claim payment practices, which if not resolved, could result in arbitration or judicial proceedings. We are not able to estimate the reasonably possible loss or range of loss, if any, that could result from these discussions because they remain in preliminary stages. Although we believe that our Loss Mitigation Activities and claims paying practices are in compliance with our policies, if we are not successful in defending our actions we may need to reassume the risk on, and increase loss reserves for, those policies or pay additional claims. See Note 10 for further information.
Further, there are loans in our total defaulted portfolio (in particular, our older defaulted portfolio) for which actions or proceedings (such as foreclosure) may not have been commenced within the outermost deadline in our Prior Master Policy. We are evaluating these loans regarding this potential violation and our corresponding rights under the Prior Master Policy. While we can provide no assurance regarding the ultimate resolution of these issues, it is possible that arbitration or legal proceedings could result.
41
Radian Group Inc.
Notes to Unaudited Condensed Consolidated Financial Statements — (Continued)
Other
Securities regulations became effective in 2005 that impose enhanced disclosure requirements on issuers of ABS (including mortgage-backed securities). To allow our customers to comply with these regulations at that time, we typically were required, depending on the amount of credit enhancement we were providing, to provide: (1) audited financial statements for the insurance subsidiary participating in the transaction; or (2) a full and unconditional holding company-level guarantee for our insurance subsidiaries’ obligations in such transactions. Radian Group has guaranteed two structured transactions for Radian Guaranty involving approximately $114.5 million of remaining credit exposure as of September 30, 2016.
13. Capital Stock
In the first quarter of 2016, we announced and completed a share repurchase program. Pursuant to this program, we purchased an aggregate of 9.4 million shares of Radian Group common stock for $100.2 million, at a weighted average price per share of $10.62, including commissions. No further purchase authority remains under this share repurchase program.
As partial consideration for our March 2016 purchases of a portion of our Convertible Senior Notes due 2017 and 2019, we issued to the sellers 17.0 million shares of Radian Group common stock. In addition, in connection with our termination of the related capped call transactions, we received consideration of 0.2 million shares of Radian Group common stock. See Note 11 for additional information regarding these transactions.
All shares of Radian Group common stock that we received from the above transactions were retired, resulting in a decrease in shares issued and outstanding and a corresponding increase in unissued shares.
On June 29, 2016, Radian Group’s board of directors authorized a new share repurchase program of up to $125 million of Radian Group common stock. In order to implement the program, we adopted a trading plan under Rule 10b5-1 of the Exchange Act during the third quarter of 2016. As of September 30, 2016, no shares had been purchased and therefore the full purchase authority of up to $125 million remained available under this program, which expires on June 30, 2017.
We may also from time to time purchase shares on the open market to meet option exercise obligations and to fund 401(k) matches and purchases under our Employee Stock Purchase Plan.
42
Radian Group Inc.
Notes to Unaudited Condensed Consolidated Financial Statements — (Continued)
14. Accumulated Other Comprehensive Income (Loss)
The following table shows the rollforward of AOCI as of the periods indicated:
______________________
Three Months Ended September 30, 2016 | Nine Months Ended September 30, 2016 | |||||||||||||||||||||||
(In thousands) | Before Tax | Tax Effect | Net of Tax | Before Tax | Tax Effect | Net of Tax | ||||||||||||||||||
Balance at beginning of period | $ | 95,548 | $ | 33,443 | $ | 62,105 | $ | (28,425 | ) | $ | (9,948 | ) | $ | (18,477 | ) | |||||||||
OCI: | ||||||||||||||||||||||||
Unrealized gains (losses) on investments: | ||||||||||||||||||||||||
Unrealized holding gains (losses) arising during the period | 10,682 | 3,739 | 6,943 | 133,253 | 46,639 | 86,614 | ||||||||||||||||||
Less: Reclassification adjustment for net gains (losses) included in net income (1) | 5,685 | 1,990 | 3,695 | 3,533 | 1,237 | 2,296 | ||||||||||||||||||
Net unrealized gains (losses) on investments | 4,997 | 1,749 | 3,248 | 129,720 | 45,402 | 84,318 | ||||||||||||||||||
Net foreign currency translation adjustments | (47 | ) | (11 | ) | (36 | ) | (523 | ) | (177 | ) | (346 | ) | ||||||||||||
Net actuarial gains (losses) | 240 | 84 | 156 | (34 | ) | (12 | ) | (22 | ) | |||||||||||||||
OCI | 5,190 | 1,822 | 3,368 | 129,163 | 45,213 | 83,950 | ||||||||||||||||||
Balance at end of period | $ | 100,738 | $ | 35,265 | $ | 65,473 | $ | 100,738 | $ | 35,265 | $ | 65,473 | ||||||||||||
Three Months Ended September 30, 2015 | Nine Months Ended September 30, 2015 | |||||||||||||||||||||||
(In thousands) | Before Tax | Tax Effect | Net of Tax | Before Tax | Tax Effect | Net of Tax | ||||||||||||||||||
Balance at beginning of period | $ | (17,744 | ) | $ | (6,210 | ) | $ | (11,534 | ) | $ | 79,208 | $ | 27,723 | $ | 51,485 | |||||||||
OCI: | ||||||||||||||||||||||||
Unrealized gains (losses) on investments: | ||||||||||||||||||||||||
Unrealized holding gains (losses) arising during the period | 6,172 | 2,160 | 4,012 | (17,160 | ) | (6,006 | ) | (11,154 | ) | |||||||||||||||
Less: Reclassification adjustment for net gains (losses) included in net income (1) | (343 | ) | (120 | ) | (223 | ) | 68,320 | 23,912 | 44,408 | |||||||||||||||
Net unrealized gains (losses) on investments | 6,515 | 2,280 | 4,235 | (85,480 | ) | (29,918 | ) | (55,562 | ) | |||||||||||||||
Net foreign currency translation adjustments | (184 | ) | (64 | ) | (120 | ) | (135 | ) | (47 | ) | (88 | ) | ||||||||||||
Activity related to investments recorded as assets held for sale (2) | — | — | — | (5,006 | ) | (1,752 | ) | (3,254 | ) | |||||||||||||||
OCI | 6,331 | 2,216 | 4,115 | (90,621 | ) | (31,717 | ) | (58,904 | ) | |||||||||||||||
Balance at end of period | $ | (11,413 | ) | $ | (3,994 | ) | $ | (7,419 | ) | $ | (11,413 | ) | $ | (3,994 | ) | $ | (7,419 | ) | ||||||
(1) | Included in net gains (losses) on investments and other financial instruments on our unaudited condensed consolidated statements of operations. During the second quarter of 2015, we sold equity securities in our portfolio and reinvested the proceeds in assets that qualify as PMIERs-compliant Available Assets, recognizing pretax gains of $68.7 million. |
(2) | Represents the unrealized holding gains (losses) arising during the period on investments recorded as assets held for sale, net of reclassification adjustments for net gains (losses) included in income (loss) from discontinued operations, net of tax. |
43
Radian Group Inc.
Notes to Unaudited Condensed Consolidated Financial Statements — (Continued)
15. Discontinued Operations
On April 1, 2015, Radian Guaranty completed the sale of 100% of the issued and outstanding shares of Radian Asset Assurance for a purchase price of approximately $810 million, pursuant to the Radian Asset Assurance Stock Purchase Agreement.
Prior to this, we had determined that Radian Asset Assurance met the criteria for held for sale and discontinued operations accounting at December 31, 2014. As a result, we recognized a pretax impairment charge of $467.5 million for the year ended December 31, 2014 and an additional pretax impairment charge of $14.3 million for the six months ended June 30, 2015. We recorded net income on discontinued operations of $5.4 million related to this sale in the first six months of 2015, consisting primarily of the recognition of investment gains previously deferred and recorded in AOCI and recognized as a result of the completion of the sale of Radian Asset Assurance to Assured on April 1, 2015, and adjustments to estimated transaction costs and taxes. The operating results of Radian Asset Assurance have been classified as discontinued operations for all periods presented in our condensed consolidated statements of operations. No general corporate overhead or interest expense was allocated to discontinued operations.
The table below summarizes the components of income from discontinued operations, net of tax, for the period indicated. There was no activity for discontinued operations in the three and nine months ended September 30, 2016 or in the three months ended September 30, 2015.
Nine Months Ended September 30, 2015 | |||
(In thousands) | |||
Net premiums earned | $ | 1,007 | |
Net investment income | 9,153 | ||
Net gains (losses) on investments and other financial instruments | 21,486 | ||
Change in fair value of derivative instruments | 2,625 | ||
Total revenues | 34,271 | ||
Provision for losses | 502 | ||
Policy acquisition costs | (191 | ) | |
Other operating expenses | 4,107 | ||
Total expenses | 4,418 | ||
Equity in net income (loss) of affiliates | (13 | ) | |
Income (loss) from operations of businesses held for sale | 29,840 | ||
Income (loss) on sale | (14,280 | ) | |
Income tax provision (benefit) | 10,175 | ||
Income (loss) from discontinued operations, net of tax | $ | 5,385 | |
16. Statutory Information
We prepare our statutory financial statements in accordance with the accounting practices required or permitted, if applicable, by the insurance departments of the respective states of domicile of our insurance subsidiaries. Required SAPP are established by a variety of publications of the NAIC as well as state laws, regulations and general administrative rules. In addition, insurance departments have the right to permit other specific practices that may deviate from prescribed practices. As of September 30, 2016, we did not have any prescribed or permitted statutory accounting practices that resulted in reported statutory surplus or risk-based capital being significantly different from what would have been reported if NAIC SAPP had been followed.
44
Radian Group Inc.
Notes to Unaudited Condensed Consolidated Financial Statements — (Continued)
The state insurance regulations include various capital requirements and dividend restrictions based on our insurance subsidiaries’ statutory financial position and results of operations, as described below. Failure to maintain adequate levels of capital could lead to intervention by the various insurance regulatory authorities, which could materially and adversely affect our business, business prospects and financial condition. As of September 30, 2016, the amount of restricted net assets held by our consolidated insurance subsidiaries (which represents our equity investment in those insurance subsidiaries) totaled $3.0 billion of our consolidated net assets.
Under state insurance regulations, Radian Guaranty is required to maintain minimum surplus levels and, in certain states, a minimum Risk-to-capital ratio. The sixteen RBC States currently impose a Statutory RBC Requirement. The most common Statutory RBC Requirement is that a mortgage insurer’s Risk-to-capital may not exceed 25 to 1. In certain of the RBC States, a mortgage insurer must satisfy an MPP Requirement. The statutory capital requirements for the non-RBC States are de minimis (ranging from $1 million to $5 million); however, the insurance laws of these states generally grant broad supervisory powers to state agencies or officials to enforce rules or exercise discretion affecting almost every significant aspect of the insurance business, including the power to revoke or restrict an insurance company’s ability to write new business. Unless an RBC State grants a waiver or other form of relief, if a mortgage insurer is not in compliance with the Statutory RBC Requirement of that state, the mortgage insurer may be prohibited from writing new mortgage insurance business in that state. Radian Guaranty’s domiciliary state, Pennsylvania, is not one of the RBC States.
Radian Guaranty was in compliance with the Statutory RBC Requirements or MPP Requirements, as applicable, in each of the RBC States as of September 30, 2016. The NAIC is in the process of developing a new Model Act for mortgage insurers, which is expected to include among other items, new capital adequacy requirements for mortgage insurers. In May 2016, a working group of State regulators released an exposure draft of a risk-based capital framework to establish capital requirements for mortgage insurers. While the outcome and timing of this process are uncertain, the new Model Act, if and when finalized by the NAIC, has the potential to increase capital requirements in those states that adopt the Model Act. However, we continue to believe the changes to the Model Act will not result in financial requirements that require greater capital than the level currently required under the PMIERs Financial Requirements. See also Note 1 for information regarding the PMIERs, which set requirements for private mortgage insurers to remain eligible insurers of loans purchased by the GSEs.
Radian Guaranty’s Risk-to-capital calculation appears in the table below. For purposes of the Risk-to-capital calculation, as well as the Risk-to-capital requirements imposed by certain states, statutory capital is defined as the sum of statutory policyholders’ surplus (i.e., statutory capital and surplus) plus statutory contingency reserves.
September 30, 2016 | December 31, 2015 | ||||||
($ in millions) | |||||||
RIF, net (1) | $ | 34,849.2 | $ | 36,396.1 | |||
Common stock and paid-in capital | $ | 2,041.5 | $ | 2,041.4 | |||
Surplus Note | — | 325.0 | |||||
Unassigned earnings (deficit) | (656.3 | ) | (679.9 | ) | |||
Statutory policyholders’ surplus | 1,385.2 | 1,686.5 | |||||
Contingency reserve | 1,156.9 | 860.9 | |||||
Statutory capital | $ | 2,542.1 | $ | 2,547.4 | |||
Risk-to-capital | 13.7:1 | 14.3:1 | |||||
______________________
(1) | Excludes risk ceded through reinsurance contracts (to third parties and affiliates) and RIF on defaulted loans. |
The net decrease in Radian Guaranty’s Risk-to-capital in the first nine months of 2016 was primarily due to a decrease in net RIF at Radian Guaranty, resulting from insurance ceded pursuant to the Single Premium QSR Transaction during 2016, combined with statutory net income, which had the effect of increasing statutory policyholders’ surplus. The effect of both of these items was mainly offset by the repayment of the $325 million Surplus Note on June 30, 2016.
We have actively managed Radian Guaranty’s capital position in various ways, including: (1) through internal and external reinsurance arrangements; (2) by seeking opportunities to reduce our risk exposure through negotiated transactions; and (3) by contributing additional capital from Radian Group, including through the use of the Surplus Note.
45
Part I. Item 2. Management’s Discussion and Analysis of Financial Condition and Results of Operations
Item 2. Management’s Discussion and Analysis of Financial Condition and Results of Operations.
The following analysis should be read in conjunction with our unaudited condensed consolidated financial statements and the notes thereto included in this report, and our audited annual financial statements, notes thereto and Management’s Discussion and Analysis of Financial Condition and Results of Operations included in our 2015 Form 10-K, for a more complete understanding of our financial position and results of operations. Certain terms and acronyms used throughout this report are defined in the Glossary of Abbreviations and Acronyms included as part of this report. In addition, investors should review the “Cautionary Note Regarding Forward Looking Statements—Safe Harbor Provisions” above and the “Risk Factors” detailed in Item 1A of our 2015 Form 10-K for a discussion of those risks and uncertainties that have the potential to affect our business, financial condition, results of operations, cash flows or prospects in a material and adverse manner. Our results of operations for interim periods are not necessarily indicative of results to be expected for the full year or for any other period.
Index to Management’s Discussion and Analysis of Financial Condition and Results of Operations | |
PAGE | |
Overview
We have two business segments—Mortgage Insurance and Services. Our Mortgage Insurance segment provides credit-related insurance coverage, principally through private mortgage insurance, to mortgage lending institutions nationwide. We provide our mortgage insurance products mainly through our wholly-owned subsidiary, Radian Guaranty. Our Services segment provides outsourced services, information-based analytics and specialty consulting for buyers and sellers of, and investors in, mortgage- and real estate-related loans and securities as well as other ABS. These services and solutions are provided primarily through Clayton and its subsidiaries, including Green River Capital, Red Bell and ValuAmerica.
Operating Environment and Business Strategy
Operating Environment. As a seller of mortgage credit protection and mortgage and real estate products and services, our results are subject to macroeconomic conditions and specific events that impact the mortgage origination environment and the credit performance of our underlying insured assets. The operating environment for our mortgage insurance business has been improving over the past several years as the U.S. economy generally, and unemployment levels and the housing markets in particular, have been recovering from the financial crisis that began in 2007.
New lending laws and regulations were enacted in response to the financial crisis, resulting in increased regulation and regulatory scrutiny. When combined with lenders’ more restrictive lending guidelines and the absence of a meaningful securitization market for non-GSE loans, this has resulted in more restrictive credit standards for home financing. As a result, post-2008 loan originations have consisted primarily of high credit quality loans with significantly better credit performance than the loans in our Legacy Portfolio. While credit quality has been improving, the restrictive credit environment has made it more challenging for many first-time home buyers to finance a home, which has limited the growth of the mortgage industry, and therefore, the number of loans available for private mortgage insurance. See “—Results of Operations—Mortgage Insurance—NIW, IIF, RIF” for additional information regarding our portfolio mix and the mortgage industry. Further, while the increased regulatory environment generally benefits our compliance consulting services, the lack of a meaningful securitization market has significantly limited the volume of business available for our Services business as further discussed below.
46
Part I. Item 2. Management’s Discussion and Analysis of Financial Condition and Results of Operations
As of September 30, 2016, our portfolio of business written in this improving credit environment (since the beginning of 2009), including HARP refinancings, represented 87% of our total primary RIF. The number of new primary mortgage insurance defaults in our insured portfolio declined by approximately 4% in the nine months ended September 30, 2016, compared to the same period of 2015. Similarly, our primary default rate of 3.3% at September 30, 2016 declined from 4.1% at September 30, 2015. In recent years, these favorable credit trends have had a significant positive impact on our results of operations, in particular the provision for losses in our Mortgage Insurance segment.
Private mortgage insurers, including Radian Guaranty, are required to comply with the PMIERs to remain eligible insurers of loans purchased by the GSEs. Radian Guaranty currently is in compliance with the PMIERs. The PMIERs were designed to ensure that the approved insurers will continue to possess the financial and operational capacity to serve as strong counterparties to the GSEs throughout various market conditions. The PMIERs are comprehensive, covering virtually all aspects of a private mortgage insurer’s business and operations, including internal risk management and quality controls, the relationship between the GSEs and the approved insurer and the approved insurer’s financial condition. The GSEs have a broad range of consent rights to approve various actions of the approved insurer. The GSEs may amend the PMIERs at any time, and they have broad discretion to interpret the requirements, which could impact the calculation of our Available Assets and/or Minimum Required Assets. The PMIERs specifically provide that the factors that are applied to calculate and determine a mortgage insurer’s Minimum Required Assets will be updated every two years following a minimum of 180 days’ notice (with the next review scheduled to take place in 2017), or more frequently, as determined by the GSEs, to reflect changes in macroeconomic conditions or loan performance. We have entered into reinsurance transactions as part of our capital and risk management activities, including to manage Radian Guaranty’s position under the PMIERs Financial Requirements, and the credit that we receive under the PMIERs Financial Requirements for these transactions is subject to the periodic review of the GSEs. In addition, it is our understanding that while a more comprehensive review of the PMIERs Financial Requirements is expected to take place in 2017, the GSEs currently are considering interim guidance for the industry that would negatively impact the amount of credit that we receive for our Single Premium QSR Transaction but also would give credit to certain liquid investments that are readily available to pay claims that previously were not permitted to be included in our Available Assets. As a result, we do not expect that this potential interim guidance, if and when issued, will impact Radian Guaranty’s compliance with the PMIERs. See “—Liquidity and Capital Resources—Radian Group—Short-Term Liquidity Needs” and Note 1 of Notes to Condensed Consolidated Financial Statements for additional information.
For our mortgage insurance business, our competitors include other private mortgage insurers and governmental agencies, principally the FHA and the VA. We currently compete with six other private mortgage insurers that are eligible to write business for the GSEs. We compete with these private mortgage insurers on the basis of price, underwriting guidelines, customer relationships, reputation, perceived financial strength (including based on comparative credit ratings) and overall service, including services and products that complement our mortgage insurance products and that are offered through our Services business. We compete with the FHA and VA on the basis of loan limits, pricing, credit guidelines and terms of our insurance policies. The FHA’s pricing reduction of its annual mortgage insurance premiums in January 2015, combined with our premium changes in April 2016 to increase our pricing for borrowers with lower FICO scores has negatively impacted our ability to compete with the FHA on certain high-LTV loans to borrowers with FICO scores below 720. However, we believe that our pricing changes made during the first half of 2016 enable us to more effectively compete with the FHA on certain high-LTV loans to borrowers with FICO scores above 720. Further, while the FHA may again determine to reduce its pricing or alter the terms of its insurance, which could further impact the competitiveness of private mortgage insurance with respect to certain products, we believe there is an increasing preference among many lenders for conventional versus FHA lending and that borrowers are often attracted to the cancellation option offered by private mortgage insurance. This, combined with the growing number of higher-LTV programs utilizing private mortgage insurance that have been introduced by lenders recently, could help increase the private mortgage insurance industry’s penetration of the insured market.
47
Part I. Item 2. Management’s Discussion and Analysis of Financial Condition and Results of Operations
The positive macroeconomic and credit trends in recent years also have encouraged newer entrants into the private mortgage insurance industry. The presence of newer entrants in the industry has increased price competition as these companies seek to gain a greater presence in the market and more established industry participants seek to defend their market share and customer relationships. As a result, recent pricing trends have included: (i) the use of a spectrum of filed rates to allow for formulaic, risk-based pricing (commonly referred to as “black-box” pricing) or customized pricing engines; (ii) the use of customized (often discounted) rates on lender-paid, Single Premium policies; and (iii) overall reductions in standard filed rates on borrower-paid Monthly Premium Policies. In the recent past, the willingness of mortgage insurers to offer reduced pricing (whether through filed or customized rates) has led to an increased demand from certain lenders for reduced rate products. This produced a marketplace where balancing both targeted returns on new business and an acceptable share of the insured market became more challenging for all participants. Although the industry remains highly competitive and there can be no assurance that there will not be further broad-based declines in mortgage insurance pricing in the future, the use of discounted pricing strategies related to borrower-paid Monthly Premium Policies appears to have moderated subsequent to the widespread industry pricing changes for standard rates that occurred during the first half of 2016.
Business Strategy. Radian is focused on a number of strategic objectives, as described below.
RADIAN’S LONG-TERM STRATEGIC OBJECTIVES |
• Grow earnings per share while maintaining attractive returns on equity » Write high-quality and profitable NIW » Improve margins through efficiency initiatives and business mix |
• Expand the role of private mortgage insurance in the mortgage finance industry |
• Provide credit-based mortgage solutions outside of traditional mortgage insurance |
• Grow fee income by expanding our presence in the real estate and mortgage finance industries |
• Enhance our financial strength and effectively manage Radian Group’s debt maturity profile |
• Manage risk and compliance proactively through strong governance and culture |
In formulating our strategy in this highly competitive operating environment, we have taken a disciplined approach to establishing our premium rates and producing a mix of business that we expect to produce our targeted level of returns on a blended basis and an acceptable level of NIW. During the first nine months of 2016, in furtherance of this strategy, we:
• | increased our filed rates for lender-paid mortgage insurance; |
• | adjusted our borrower-paid, filed rates, effective on April 7, 2016, which generally had the effect of decreasing our standard rates on higher FICO business, and raising our standard rates on lower FICO business where the FHA is already very competitive; |
• | continued to use the authority set forth in our rate filings to provide customized premiums for lender-paid, Single Premium mortgage insurance on a limited basis while maintaining our focus on our overall risk and return targets and, because the level of discounting moderated and the current pricing levels are within our targeted returns, during the third quarter of 2016 we have chosen to selectively participate in certain discounted Single Premium business that has been offered on an aggregated basis; and |
• | entered into the Single Premium QSR Transaction to proactively manage the risk and return profile of Radian Guaranty’s insured portfolio, which resulted in increasing our return on required capital for Single Premium Policies and decreasing the percentage of our Single Premium RIF, net of reinsurance ceded. |
See Note 7 of Notes to Unaudited Condensed Consolidated Financial Statements and “—Liquidity and Capital Resources—Radian Group—Short-Term Liquidity Needs” for more information about the Single Premium QSR Transaction.
48
Part I. Item 2. Management’s Discussion and Analysis of Financial Condition and Results of Operations
As a result of the actions described above and as demonstrated by our strong NIW generated in the three months ended September 30, 2016, we believe we remain well positioned to compete for the high-quality business being originated today, including the generally more profitable, borrower-paid business, while at the same time maintaining projected returns on NIW within our targeted ranges. In addition, the changes that were implemented to our filed premium rates in the first half of 2016 are expected to generate more consistent returns across the credit spectrum and provide stable loss ratios in periods of further credit expansion. Over the life of the policies, we expect our current pricing (including the impact of the Single Premium QSR Transaction) will produce returns on required capital on new business on an unlevered basis (i.e., after-tax underwriting returns plus projected investment income) of approximately 13% to 14%, and approximately 16% to 17% on a levered basis (i.e., after-tax returns taking into consideration a targeted corporate debt to capital ratio of less than 30%). Our actual portfolio returns will depend on a number of factors, including economic conditions, the amount and mix of NIW that we are able to write at these new pricing levels and the amount of reinsurance we use.
As part of our strategy to leverage our core expertise in credit risk management and expand our presence in the mortgage finance industry, we have chosen to participate in a new front-end credit insurance risk transfer pilot program developed by Fannie Mae, as well as a similar pilot program developed by Freddie Mac. These pilot programs involve participation as part of a panel of mortgage insurance company affiliates in writing forward credit insurance policies. Our current commitment level for both of these pilot programs will result in premiums and required capital that are immaterial.
Our Services segment provides a diverse array of services to participants in multiple facets of the residential real estate and mortgage finance markets. As a result, we believe the Services segment is well-positioned to generate revenue in both healthy and distressed mortgage market conditions. Historically, a significant portion of this revenue was generated from activities related to non-agency RMBS issuance, which, as discussed above, has been limited since the financial crisis. We believe that the potential future re-emergence of the non-agency RMBS market may represent a significant long-term growth opportunity for our loan review, due diligence and surveillance services. However, the size and timing for the return of this market are uncertain and will be impacted by factors outside our control, including market demand and regulation.
Following the financial crisis, SFR securitizations, fueled by home purchases by institutional investors, experienced rapid growth. Our Services business was able to capitalize on this growth by providing a variety of services to this market, including REO management. However, during 2015 and the first half of 2016, a decline in the pace of home purchases by institutional investors and a substantial slowdown in SFR securitizations negatively impacted our Services revenues. We have recently experienced a modest increase in SFR securitization activity, and we expect this level of activity to continue through 2017.
Our strategy for future growth includes continuing to grow our Mortgage Insurance business and expanding our capabilities in our Services business to increase the depth and breadth of mortgage and real estate products and services we offer to the residential real estate and mortgage finance markets. A key element of this business strategy is to use our Services segment to broaden our participation in the residential mortgage market value chain by offering a range of mortgage and real estate-related products and services that complement our mortgage insurance business. This strategy is designed to satisfy demand in the market, grow our fee-based revenues, strengthen our existing mortgage insurance customer relationships, attract new customers and differentiate us from our mortgage insurance peers.
49
Part I. Item 2. Management’s Discussion and Analysis of Financial Condition and Results of Operations
Through the combination of our Mortgage Insurance and Services business segments, our array of capabilities is illustrated below.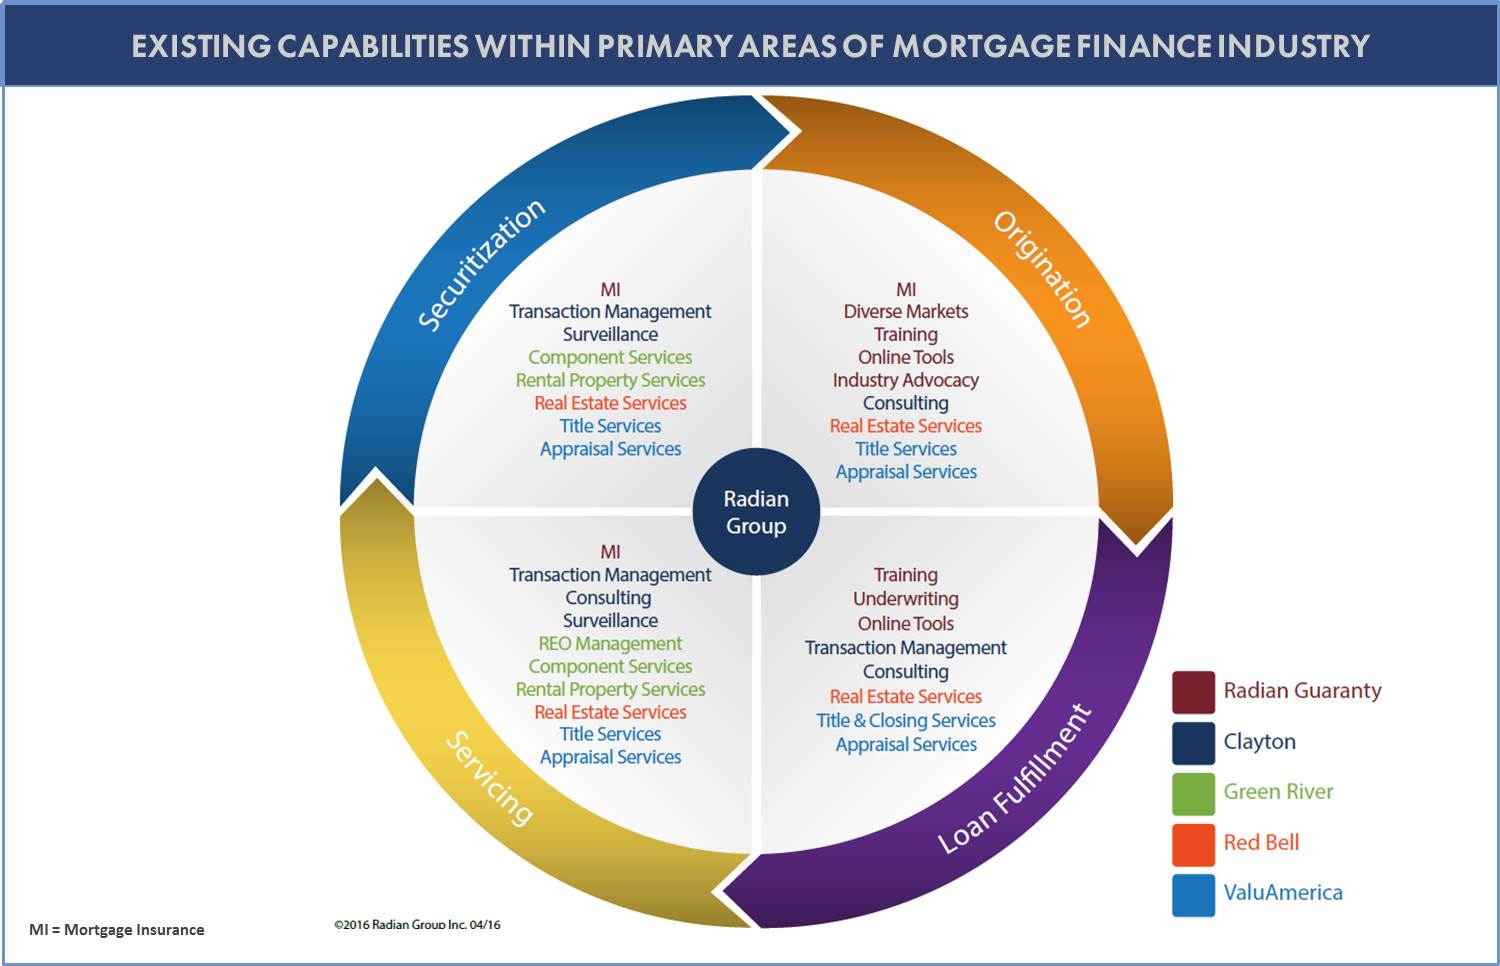
2016 Developments
Capital Management. During the first nine months of 2016, we completed a series of transactions to strengthen our financial position. The combination of these actions had the impact of decreasing diluted shares, improving Radian Group’s debt maturity profile and improving Radian Guaranty’s position under the PMIERs Financial Requirements. This series of capital management transactions consists of:
• | the issuance of $350 million aggregate principal amount of Senior Notes due 2021; |
• | the purchases of aggregate principal amounts of $30.1 million and $322.0 million, respectively, of our outstanding Convertible Senior Notes due 2017 and 2019; |
• | the termination of the portion of the capped call transactions related to the purchased Convertible Senior Notes due 2017; |
• | the completion of the share repurchase program announced in January 2016, by purchasing an aggregate of 9.4 million shares of Radian Group common stock for $100.2 million, including commissions; |
• | the execution of the Single Premium QSR Transaction, which had the effect of increasing the amount by which Radian Guaranty’s Available Assets exceed its Minimum Required Assets under the PMIERs Financial Requirements; and |
• | the early redemption of the remaining $195.5 million aggregate principal amount of our Senior Notes due 2017. |
See Notes 7, 11 and 13 of Notes to Unaudited Condensed Consolidated Financial Statements for additional information on the individual transactions.
50
Part I. Item 2. Management’s Discussion and Analysis of Financial Condition and Results of Operations
Our purchases of Convertible Senior Notes due 2017 and 2019 and the early redemption of the Senior Notes due 2017 resulted in a loss on induced conversion and debt extinguishment of $75.1 million for the nine months ended September 30, 2016. Following the purchases described above, $22.2 million and $68.0 million, respectively, of the principal amounts of the Convertible Senior Notes due 2017 and 2019 remained outstanding as of September 30, 2016.
In connection with the termination of the capped call transactions related to the purchased Convertible Senior Notes due 2017, we received 0.2 million shares of Radian Group common stock, which was valued at $2.6 million based on a stock price on the closing date of $11.86.
In the aggregate, as of their effective dates, the series of recent capital management transactions described above resulted in the following changes to liquidity, long-term debt and stockholders’ equity since December 31, 2015:
• | a net decrease in available holding company liquidity of $204.6 million; |
• | a net decrease in long-term debt of $161.7 million; and |
• | a net decrease in stockholders’ equity of $16.9 million. |
In addition, available holding company liquidity increased by $325 million at June 30, 2016 due to the repayment of the Surplus Note. See “—Liquidity and Capital Resources—Radian Group—Short-Term Liquidity Needs—Sources of Liquidity.”
The aggregate net decrease in diluted shares resulting from the transactions described above, in each case as of the date of the completion of the respective transaction, was approximately 23.1 million shares for purposes of determining diluted net income per share. This aggregate net decrease reflects: (i) the impact of the completed share repurchase program; and (ii) that the number of dilutive shares related to the purchased Convertible Senior Notes due 2017 and 2019 (which shares had been included in the calculations of dilutive shares, in accordance with GAAP) exceeded the actual net increase in shares issued as a result of these transactions. Although these transactions resulted in a decrease in diluted shares outstanding, the actual shares outstanding increased at September 30, 2016 from December 31, 2015.
In the first quarter of 2016, in order to proactively manage the risk and return profile of Radian Guaranty’s insured portfolio and continue managing its position under the PMIERs Financial Requirements in a cost-effective manner, Radian Guaranty entered into the Single Premium QSR Transaction with a panel of third-party reinsurers. Radian Guaranty began ceding business under this agreement effective January 1, 2016.
The Single Premium QSR Transaction had the effect of increasing the amount by which Radian Guaranty’s Available Assets exceed its Minimum Required Assets under the PMIERs Financial Requirements. The Single Premium QSR Transaction also results in the following impacts, which are expected to continue over the term of the transaction:
• | increases the amount of our RIF covered by reinsurance, and therefore, the amount of premiums and losses ceded; |
• | reduces net premiums written and earned; |
• | reduces other operating expenses by the amount of ceding commissions earned; and |
• | improves Radian Guaranty’s return on required capital for its Single Premium mortgage insurance products as a result of the combination of the favorable impact to our PMIERs Financial Requirements and the expected ceded underwriting margin. |
For risks ceded under the Single Premium QSR Transaction, the after-tax implied cost of required capital over the term of the transaction under the current PMIERs Financial Requirements is expected to be approximately 2%. See Note 7 of Notes to Unaudited Condensed Consolidated Financial Statements and “—Liquidity and Capital Resources—Radian Group—Short-Term Liquidity Needs” for more information about the Single Premium QSR Transaction.
In June 2016, Radian Guaranty repaid in full the $325 million Surplus Note due to Radian Group. On June 29, 2016, Radian Group’s board of directors authorized a new share repurchase program of up to $125 million of Radian Group common stock. As of November 3, 2016, the full purchase authority remained available under this share repurchase program, which expires on June 30, 2017.
Key Factors Affecting Our Results
There have been no material changes to the key factors affecting our results that are discussed in our 2015 Form 10-K.
51
Part I. Item 2. Management’s Discussion and Analysis of Financial Condition and Results of Operations
Results of Operations—Consolidated
Three and Nine Months Ended September 30, 2016 Compared to Three and Nine Months Ended September 30, 2015
Radian Group serves as the holding company for our operating subsidiaries and does not have any operations of its own. Our consolidated operating results for the three and nine months ended September 30, 2016 primarily reflect the financial results and performance of our two business segments—Mortgage Insurance and Services. See Note 3 of Notes to Unaudited Condensed Consolidated Financial Statements for information regarding the basis of our segment reporting, including the related allocations. See “—Results of Operations—Mortgage Insurance” and “—Results of Operations—Services” for the operating results of these business segments for the three and nine months ended September 30, 2016.
In addition to the results of our operating segments, pretax income (loss) is also affected by those factors described in Item 7. Management’s Discussion and Analysis of Financial Condition and Results of Operations “—Key Factors Affecting Our Results” in our 2015 Form 10-K.
The following table highlights selected information related to our consolidated results of operations for the three and nine months ended September 30, 2016 and 2015:
$ Change | $ Change | ||||||||||||||||||||||
Three Months Ended September 30, | Favorable (Unfavorable) | Nine Months Ended September 30, | Favorable (Unfavorable) | ||||||||||||||||||||
(In millions, except per-share amounts) | 2016 | 2015 | 2016 vs. 2015 | 2016 | 2015 | 2016 vs. 2015 | |||||||||||||||||
Pretax income from continuing operations | $ | 126.9 | $ | 115.7 | $ | 11.2 | $ | 385.9 | $ | 333.1 | $ | 52.8 | |||||||||||
Net income from continuing operations | 82.8 | 70.1 | 12.7 | 247.2 | 207.0 | 40.2 | |||||||||||||||||
Income (loss) from discontinued operations, net of tax | — | — | — | — | 5.4 | (5.4 | ) | ||||||||||||||||
Net income | 82.8 | 70.1 | 12.7 | 247.2 | 212.4 | 34.8 | |||||||||||||||||
Diluted net income per share | 0.37 | 0.29 | 0.08 | 1.09 | 0.90 | 0.19 | |||||||||||||||||
Book value per share at September 30 | 13.47 | 11.77 | 1.70 | 13.47 | 11.77 | 1.70 | |||||||||||||||||
Net premiums earned—insurance | 238.1 | 227.4 | 10.7 | 688.2 | 689.5 | (1.3 | ) | ||||||||||||||||
Services revenue | 43.1 | 42.2 | 0.9 | 113.0 | 116.3 | (3.3 | ) | ||||||||||||||||
Net investment income | 28.4 | 22.1 | 6.3 | 84.5 | 58.7 | 25.8 | |||||||||||||||||
Net gains (losses) on investments and other financial instruments | 7.7 | 3.9 | 3.8 | 69.5 | 49.1 | 20.4 | |||||||||||||||||
Provision for losses | 55.8 | 64.2 | 8.4 | 148.5 | 141.8 | (6.7 | ) | ||||||||||||||||
Direct cost of services | 26.7 | 24.9 | (1.8 | ) | 73.3 | 67.7 | (5.6 | ) | |||||||||||||||
Other operating expenses | 64.9 | 65.1 | 0.2 | 189.5 | 186.6 | (2.9 | ) | ||||||||||||||||
Interest expense | 19.8 | 21.2 | 1.4 | 63.9 | 70.1 | 6.2 | |||||||||||||||||
Loss on induced conversion and debt extinguishment | 17.4 | — | (17.4 | ) | 75.1 | 91.9 | 16.8 | ||||||||||||||||
Income tax provision (benefit) | 44.1 | 45.6 | 1.5 | 138.7 | 126.1 | (12.6 | ) | ||||||||||||||||
Adjusted pretax operating income (1) | 139.9 | 115.6 | 24.3 | 401.5 | 386.8 | 14.7 | |||||||||||||||||
______________________
(1) | See “—Use of Non-GAAP Financial Measure” below. |
Net Income from Continuing Operations. As discussed in more detail below, our net income from continuing operations for the three months ended September 30, 2016, compared to the same period in 2015, reflects higher revenue, a decrease in provision for losses, and increases in net investment income and net gains on investments and other financial instruments, partially offset by a loss on induced conversion and debt extinguishment. Both revenue and operating expenses for the three months ended September 30, 2016, compared to the same period in 2015, include increases related to an increased volume of NIW. Our net income from continuing operations for the nine months ended September 30, 2016 compared to the same period of 2015, also reflects increases in net investment income and net gains on investments and other financial instruments combined with a decrease in loss on induced conversion and debt extinguishment, partially offset by an increase in provision for losses and lower gross profit on Services. See “—Results of Operations—Mortgage Insurance” and “—Results of Operations—Services” for more information on our segment results.
52
Part I. Item 2. Management’s Discussion and Analysis of Financial Condition and Results of Operations
Income (Loss) from Discontinued Operations, Net of Tax. Radian completed the sale of Radian Asset Assurance to Assured on April 1, 2015, pursuant to the Radian Asset Assurance Stock Purchase Agreement. As a result, until the April 1, 2015 sale date, the operating results of Radian Asset Assurance were classified as discontinued operations for all periods presented in our condensed consolidated statements of operations. The divestiture of our financial guaranty business was part of Radian’s strategy to focus its business on the mortgage and real estate markets and to comply with the PMIERs.
There were no amounts recorded in 2016 related to discontinued operations. We recorded net income from discontinued operations of $5.4 million in the first six months of 2015, consisting primarily of the recognition of investment gains previously deferred and recorded in accumulated other comprehensive income and recognized as a result of the completion of the sale of Radian Asset Assurance to Assured on April 1, 2015, as well as adjustments to estimated transaction costs and taxes.
For additional information related to discontinued operations, see Note 15 of Notes to Unaudited Condensed Consolidated Financial Statements.
Diluted Net Income Per Share. The increase in diluted net income per share for the three and nine months ended September 30, 2016, compared to the same periods in 2015, is primarily due to the increase in net income from continuing operations, as discussed above, and the decrease in average diluted shares. The average diluted shares decreased from 250.8 million shares and 247.0 million shares for the three and nine months ended September 30, 2015, respectively, to 226.0 million shares and 230.7 million shares, respectively, for the same periods in 2016. This decrease in average diluted shares is primarily due to the impact of the June 2015 repurchase of $389.1 million of our Convertible Senior Notes due 2017, combined with the impact of the series of 2016 capital management transactions described above, included as of their effective dates. See “—Overview—2016 Developments” above.
The aggregate net decrease in diluted shares resulting from the transactions described above, in each case as of the date of the completion of the respective transaction, was approximately 23.1 million shares for purposes of determining diluted net income per share. This aggregate net decrease reflects: (i) the impact of the completed share repurchase program; and (ii) that the number of dilutive shares related to the purchased Convertible Senior Notes due 2017 and 2019 (which shares had been included in the calculations of dilutive shares, in accordance with GAAP) exceeded the actual net increase in shares issued as a result of these transactions. Although these transactions resulted in a decrease in diluted shares outstanding, the actual shares outstanding increased at September 30, 2016 from December 31, 2015.
53
Part I. Item 2. Management’s Discussion and Analysis of Financial Condition and Results of Operations
Book Value Per Share. The increase in book value per share from $12.07 at December 31, 2015 to $13.47 at September 30, 2016 is primarily due to net income, the increase in unrealized gains in other comprehensive income and the equity impact of the series of 2016 capital management transactions described above, partially offset by a net increase in the number of shares outstanding, as shown below.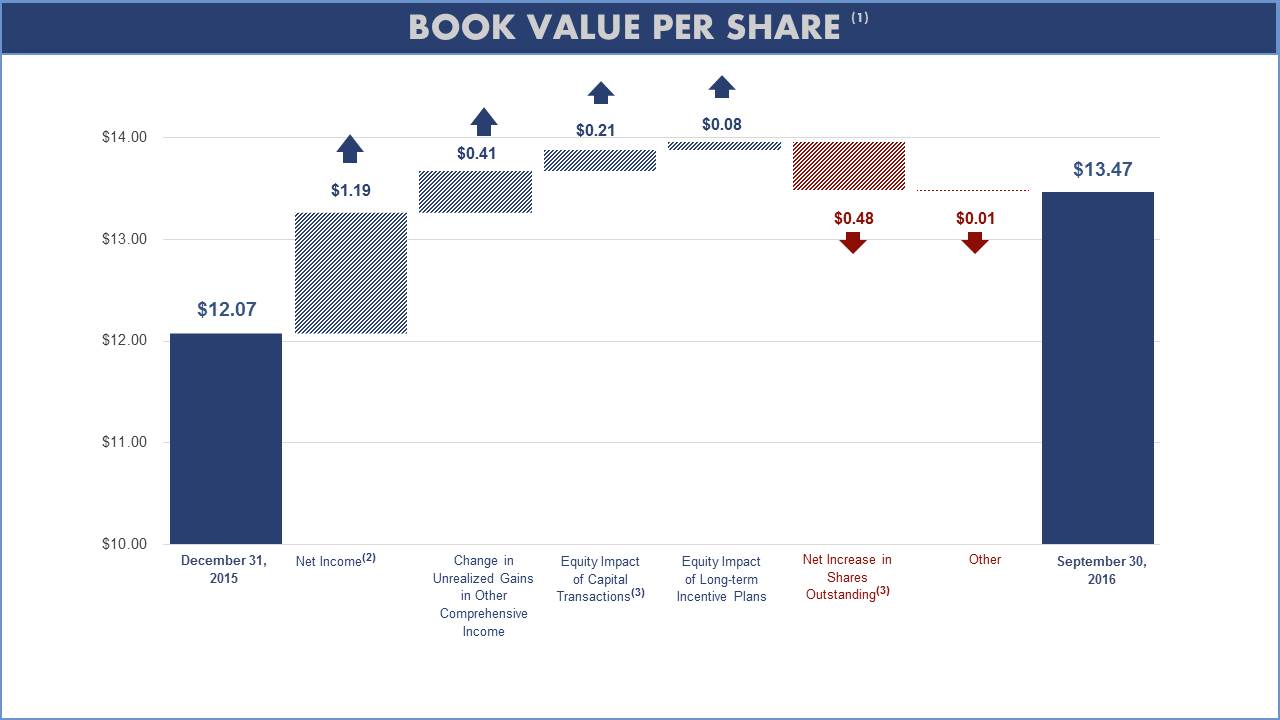
__________________
(1) | All book value per share items above are calculated based on 206.9 million shares outstanding as of December 31, 2015, except for: |
(a) | the increase in Shares Outstanding, which represents the difference between: (i) total equity as of September 30, 2016 divided by the shares outstanding as of September 30, 2016; and (ii) total equity as of September 30, 2016 divided by the shares outstanding as of December 31, 2015; and |
(b) | the September 30, 2016 book value per share, which was calculated based on 214.4 million shares outstanding as of September 30, 2016. |
(2) | Includes the impact, net of related tax expense, of loss on induced conversion and debt extinguishment related to the series of capital management transactions. |
(3) | Reflects the combined net impact on equity and shares, respectively, from the series of capital management transactions completed in the first nine months of 2016, as further described in “—Overview—2016 Developments.” The impact on equity shown above includes the impact of: (i) the extinguishment of Convertible Senior Notes due 2017 and 2019; (ii) the termination of the portion of the capped call transactions related to the purchased Convertible Senior Notes due 2017; and (iii) the shares repurchased under the share repurchase program, and excludes the loss on induced conversion and debt extinguishment, which is included in net income. |
Services Revenue and Direct Cost of Services. Services revenue and direct cost of services represent amounts related to our Services segment. See “—Results of Operations—Services” below for more information.
Net Investment Income. For the three and nine months ended September 30, 2016 and 2015, net investment income represents investment income from investments held at Radian Group that are allocated to the Mortgage Insurance segment and investment income from investments held by the Mortgage Insurance segment. See “—Results of Operations—Mortgage Insurance” for more information.
54
Part I. Item 2. Management’s Discussion and Analysis of Financial Condition and Results of Operations
Net Gains (Losses) on Investments and Other Financial Instruments. The components of the net gains (losses) on investments and other financial instruments for the periods indicated are as follows:
______________________
Three Months Ended September 30, | Nine Months Ended September 30, | |||||||||||||||
(In millions) | 2016 | 2015 | 2016 | 2015 | ||||||||||||
Net unrealized gains (losses) related to change in fair value of trading securities and other investments | $ | (0.1 | ) | $ | 1.8 | $ | 62.8 | $ | (9.1 | ) | ||||||
Net realized gains (losses) on investments | 7.9 | 2.4 | 3.9 | 58.3 | (1) | |||||||||||
Net gains (losses) on other financial instruments | (0.1 | ) | (0.3 | ) | 2.8 | (0.1 | ) | |||||||||
Net gains (losses) on investments and other financial instruments | $ | 7.7 | $ | 3.9 | $ | 69.5 | $ | 49.1 | ||||||||
(1) | During the second quarter of 2015, we sold equity securities in our portfolio and reinvested the proceeds in assets that qualify as PMIERs-compliant Available Assets, recognizing pretax gains of $68.7 million. |
Other Operating Expenses. Other operating expenses for the three months ended September 30, 2016, as compared to the same period of 2015, reflect a decrease primarily due to the increase in ceding commissions from the Single Premium QSR Transaction, partially offset by: (i) increased compensation expense, primarily due to severance expense and increased short-term incentive compensation expense related to year-to-date performance; and (ii) increased operating expenses resulting from the acquisition of ValuAmerica in October 2015. Other operating expenses for the three months ended September 30, 2015 include the accelerated expense associated with the annual grants of new equity-settled long-term incentive awards, primarily due to the acceleration of such expense for retirement-eligible employees. In contrast, for 2016, the annual grant and associated acceleration of expense related to these awards occurred in the second quarter of 2016.
Other operating expenses for the nine months ended September 30, 2016, as compared to the same period of 2015, increased primarily due to operating expenses resulting from the acquisitions of Red Bell and ValuAmerica, which occurred in March 2015 and October 2015, respectively. Compensation expense for the nine months ended September 30, 2016 also included severance costs of $4.5 million, which was primarily related to expense reduction initiatives. The increase in other operating expenses for the nine months ended September 30, 2016 was substantially offset by the increase in ceding commissions from the Single Premium QSR Transaction.
Throughout 2016, we have implemented various targeted efficiency initiatives with the objective of managing expenses. We continue to expect the initiatives to be substantially completed by the end of 2016. We previously estimated that we would reduce our fourth quarter 2016 other operating expenses to approximately $60 million, which includes the favorable impact of the targeted efficiency initiatives as well as our continued incremental expense related to our ongoing investment to significantly upgrade our technology systems. However, based on our revised projections of increased NIW, as discussed below in “—Results of Operations—Mortgage Insurance—NIW, IIF, RIF,” we expect other operating expenses for the fourth quarter of 2016 to modestly increase from our previous estimate, primarily due to certain incremental expenses related to our increased mortgage insurance business volumes.
Interest Expense. Interest expense for the three and nine months ended September 30, 2016 decreased compared to the same periods in 2015. This decrease was primarily due to reductions in interest expense from: (i) the March 2016 and June 2015 purchases of aggregate principal amounts of $30.1 million and $389.1 million, respectively, of Convertible Senior Notes due 2017; (ii) the 2016 purchases of $322.0 million aggregate principal amount of Convertible Senior Notes due 2019; and (iii) the August 2016 redemption of the remaining $195.5 million aggregate principal amount of our Senior Notes due 2017. These reductions were partially offset by increased interest expense from the March 2016 issuance of $350 million aggregate principal amount of 7.000% Senior Notes due 2021 and the June 2015 issuance of $350 million aggregate principal amount of 5.250% Senior Notes due 2020. See Note 11 of Notes to Unaudited Condensed Consolidated Financial Statements for additional information.
55
Part I. Item 2. Management’s Discussion and Analysis of Financial Condition and Results of Operations
Loss on Induced Conversion and Debt Extinguishment. During the first nine months of 2016, our purchases of Convertible Senior Notes due 2017 and 2019 and redemption of Senior Notes due 2017 resulted in a loss on induced conversion and debt extinguishment of $75.1 million consisting of: (i) a market premium of $41.8 million, representing the excess of the fair value of the total consideration delivered to the sellers of the Convertible Senior Notes due 2017 and 2019 over fair value of securities issuable pursuant to the original conversion terms; (ii) a loss on debt extinguishment of $17.2 million, representing the difference between the fair value and the carrying value, net of unamortized issuance costs, of the liability component of the purchased Convertible Senior Notes due 2017 and 2019; (iii) a loss on debt extinguishment of $15.0 million on the redemption of the Senior Notes due 2017; and (iv) expenses totaling $1.1 million for transaction costs.
During the first nine months of 2015, our purchases of Convertible Senior Notes due 2017 resulted in a loss on induced conversion and debt extinguishment of $91.9 million, consisting of: (i) a market premium of $35.5 million, representing the excess of the fair value of the total consideration delivered to the sellers of the Convertible Senior Notes due 2017 over the fair value of securities issuable pursuant to the original conversion terms; (ii) a loss on debt extinguishment of $52.3 million, representing the excess of the fair value over the carrying amount of the purchased notes; and (iii) expenses totaling $4.1 million, representing the total of the transaction costs on the conversion and the remaining unamortized debt issuance costs on the purchased Convertible Senior Notes due 2017.
Income Tax Provision (Benefit). The effective tax rate for our income from continuing operations was 34.8% and 35.9% for the three and nine months ended September 30, 2016, respectively, compared to 39.4% and 37.9% for the three and nine months ended September 30, 2015, respectively. Our September 30, 2016 annualized effective tax rate was estimated at approximately 38.2%, which is higher than the federal statutory rate of 35%, primarily as a result of the non-deductible portion of the purchase premium relating to our Convertible Senior Notes due 2017 and 2019. Our tax rates for the three and nine months ended September 30, 2016, however, also were affected by the tax impact of discrete items, predominantly consisting of investment gains taxed at the statutory tax rate of 35% and the income tax benefit resulting from our 2015 return-to-provision adjustment. The change from our federal statutory tax rate of 35%, for the three and nine months ended September 30, 2015, was primarily due to the impact of the non-deductible portion of the premium associated with the purchases of our Convertible Senior Notes due 2017 on our annual effective tax rate. Additionally, the three and nine months ended September 30, 2015 were impacted by the accounting for uncertain tax positions and state and local income taxes.
Use of Non-GAAP Financial Measure. In addition to the traditional GAAP financial measures, we have presented “adjusted pretax operating income (loss),” a non-GAAP financial measure for the consolidated company, among our key performance indicators to evaluate our fundamental financial performance. This non-GAAP financial measure aligns with the way the Company’s business performance is evaluated by both management and Radian Group’s board of directors. This measure has been established in order to increase transparency for the purposes of evaluating our operating trends and enabling more meaningful comparisons with our peers. Although on a consolidated basis “adjusted pretax operating income (loss)” is a non-GAAP financial measure, for the reasons discussed above we believe this measure aids in understanding the underlying performance of our operations. Our senior management, including our Chief Executive Officer (the Company’s chief operating decision maker), uses adjusted pretax operating income (loss) as our primary measure to evaluate the fundamental financial performance of the Company’s business segments and to allocate resources to the segments.
Adjusted pretax operating income (loss) is defined as GAAP pretax income (loss) from continuing operations excluding the effects of net gains (losses) on investments and other financial instruments, loss on induced conversion and debt extinguishment, acquisition-related expenses, amortization and impairment of intangible assets and net impairment losses recognized in earnings.
Although adjusted pretax operating income (loss) excludes certain items that have occurred in the past and are expected to occur in the future, the excluded items represent those that are: (1) not viewed as part of the operating performance of our primary activities; or (2) not expected to result in an economic impact equal to the amount reflected in pretax income (loss) from continuing operations. These adjustments, along with the reasons for their treatment, are described below.
(1) | Net gains (losses) on investments and other financial instruments. The recognition of realized investment gains or losses can vary significantly across periods as the activity is highly discretionary based on the timing of individual securities sales due to such factors as market opportunities, our tax and capital profile and overall market cycles. Unrealized investment gains and losses arise primarily from changes in the market value of our investments that are classified as trading. These valuation adjustments may not necessarily result in economic gains or losses. |
56
Part I. Item 2. Management’s Discussion and Analysis of Financial Condition and Results of Operations
Trends in the profitability of our fundamental operating activities can be more clearly identified without the fluctuations of these realized and unrealized gains or losses. We do not view them to be indicative of our fundamental operating activities. Therefore, these items are excluded from our calculation of adjusted pretax operating income (loss). However, we include the change in expected economic loss or recovery associated with our consolidated VIEs, if any, in the calculation of adjusted pretax operating income (loss).
(2) | Loss on induced conversion and debt extinguishment. Gains or losses on early extinguishment of debt and losses incurred to purchase our convertible debt prior to maturity are discretionary activities that are undertaken in order to take advantage of market opportunities to strengthen our financial and capital positions; therefore, we do not view these activities as part of our operating performance. Such transactions do not reflect expected future operations and do not provide meaningful insight regarding our current or past operating trends. Therefore, these items are excluded from our calculation of adjusted pretax operating income (loss). |
(3) | Acquisition-related expenses. Acquisition-related expenses represent the costs incurred to effect an acquisition of a business (i.e., a business combination). Because we pursue acquisitions on a strategic and selective basis and not in the ordinary course of our business, we do not view acquisition-related expenses as a consequence of a primary business activity. Therefore, we do not consider these expenses to be part of our operating performance and they are excluded from our calculation of adjusted pretax operating income (loss). |
(4) | Amortization and impairment of intangible assets. Amortization of intangible assets represents the periodic expense required to amortize the cost of intangible assets over their estimated useful lives. Intangible assets with an indefinite useful life are also periodically reviewed for potential impairment, and impairment adjustments are made whenever appropriate. These charges are not viewed as part of the operating performance of our primary activities and therefore are excluded from our calculation of adjusted pretax operating income (loss). |
(5) | Net impairment losses recognized in earnings. The recognition of net impairment losses on investments can vary significantly in both size and timing, depending on market credit cycles. We do not view these impairment losses to be indicative of our fundamental operating activities. Therefore, whenever these losses occur, we exclude them from our calculation of adjusted pretax operating income (loss). |
Total adjusted pretax operating income (loss) is not a measure of total profitability, and therefore should not be viewed as a substitute for GAAP pretax income (loss) from continuing operations. Our definition of adjusted pretax operating income (loss) may not be comparable to similarly-named measures reported by other companies.
The following table provides a reconciliation of our non-GAAP financial measure for the consolidated company, adjusted pretax operating income, to the most comparable GAAP measure, pretax income from continuing operations:
______________________
Reconciliation of Consolidated Non-GAAP Financial Measure | |||||||||||||||
Three Months Ended September 30, | Nine Months Ended September 30, | ||||||||||||||
(In thousands) | 2016 | 2015 | 2016 | 2015 | |||||||||||
Adjusted pretax operating income (loss): | |||||||||||||||
Mortgage Insurance (1) | $ | 142,468 | $ | 115,905 | $ | 419,945 | $ | 387,223 | |||||||
Services (1) | (2,539 | ) | (279 | ) | (18,412 | ) | (436 | ) | |||||||
Total adjusted pretax operating income | 139,929 | 115,626 | 401,533 | 386,787 | |||||||||||
Net gains (losses) on investments and other financial instruments | 7,711 | 3,868 | 69,524 | 49,095 | |||||||||||
Loss on induced conversion and debt extinguishment | (17,397 | ) | (11 | ) | (75,075 | ) | (91,887 | ) | |||||||
Acquisition-related (expenses) benefits (2) | (10 | ) | (525 | ) | (161 | ) | (1,299 | ) | |||||||
Amortization and impairment of intangible assets | (3,292 | ) | (3,273 | ) | (9,931 | ) | (9,577 | ) | |||||||
Consolidated pretax income from continuing operations | $ | 126,941 | $ | 115,685 | $ | 385,890 | $ | 333,119 | |||||||
(1) | Includes inter-segment expenses and revenues as disclosed in Note 3 of Notes to Unaudited Condensed Consolidated Financial Statements. |
(2) | Acquisition-related (expenses) benefits represent expenses incurred to effect the acquisition of a business, net of adjustments to accruals previously recorded for acquisition expenses. |
57
Part I. Item 2. Management’s Discussion and Analysis of Financial Condition and Results of Operations
Results of Operations—Mortgage Insurance
Three and Nine Months Ended September 30, 2016 Compared to Three and Nine Months Ended September 30, 2015
The following table summarizes our Mortgage Insurance segment’s results of operations for the three and nine months ended September 30, 2016 and 2015:
$ Change | $ Change | ||||||||||||||||||||||
Three Months Ended September 30, | Favorable (Unfavorable) | Nine Months Ended September 30, | Favorable (Unfavorable) | ||||||||||||||||||||
(In millions) | 2016 | 2015 | 2016 vs. 2015 | 2016 | 2015 | 2016 vs. 2015 | |||||||||||||||||
Adjusted pretax operating income (1) | $ | 142.4 | $ | 115.9 | $ | 26.5 | $ | 419.9 | $ | 387.2 | $ | 32.7 | |||||||||||
Net premiums written—insurance (2) | 241.0 | 242.2 | (1.2 | ) | 499.7 | 735.2 | (235.5 | ) | |||||||||||||||
(Increase) decrease in unearned premiums | (2.9 | ) | (14.7 | ) | 11.8 | 188.5 | (45.7 | ) | 234.2 | ||||||||||||||
Net premiums earned—insurance | 238.2 | 227.4 | 10.8 | 688.2 | 689.5 | (1.3 | ) | ||||||||||||||||
Net investment income | 28.4 | 22.1 | 6.3 | 84.4 | 58.7 | 25.7 | |||||||||||||||||
Other income | 3.5 | 1.7 | 1.8 | 8.9 | 4.8 | 4.1 | |||||||||||||||||
Provision for losses | 56.1 | 64.1 | 8.0 | 149.5 | 141.6 | (7.9 | ) | ||||||||||||||||
Policy acquisition costs | 6.1 | 2.9 | (3.2 | ) | 17.9 | 17.6 | (0.3 | ) | |||||||||||||||
Other operating expenses | 50.0 | 51.5 | 1.5 | 143.6 | 149.7 | 6.1 | |||||||||||||||||
Interest expense | 15.4 | 16.8 | 1.4 | 50.6 | 56.8 | 6.2 | |||||||||||||||||
______________________
(1) | Our senior management uses adjusted pretax operating income (loss) as our primary measure to evaluate the fundamental financial performance of each of the Company’s business segments. |
(2) | Net of ceded premiums written under the QSR Transactions and the Single Premium QSR Transaction. See Note 7 of Notes to Unaudited Condensed Consolidated Financial Statements for more information. |
Adjusted Pretax Operating Income. Our Mortgage Insurance segment’s adjusted pretax operating income increased for the three months ended September 30, 2016, compared to the same period in 2015, primarily reflecting an increase in net premiums earned, a decrease in provision for losses and an increase in net investment income. The impact of these increases in adjusted pretax operating income was partially offset by the net impact of the Single Premium QSR Transaction, as further described below. Adjusted pretax operating income increased for the nine months ended September 30, 2016, compared to the same period in 2015, primarily reflecting an increase in net investment income and a decrease in interest expense, partially offset by an increase in provision for losses and the net impact of the Single Premium QSR Transaction.
NIW, IIF, RIF
A key component of our current business strategy is to grow our mortgage insurance business by writing insurance on high-quality mortgages in the U.S. Consistent with this objective, we wrote $15.7 billion and $36.6 billion of primary new mortgage insurance in the three and nine months ended September 30, 2016, respectively, compared to $11.2 billion and $32.3 billion in the three and nine months ended September 30, 2015, respectively. The volume of NIW written on a flow basis in the three months ended September 30, 2016 represented our highest quarterly volume.
We monitor competitive and economic factors while balancing both profitability and market share considerations in developing our pricing and origination strategies. The mortgage insurance industry is highly competitive and price competition among private mortgage insurers continues. Although it is difficult to project future volumes, the size of the total mortgage insurance market for the three months ended September 30, 2016 expanded, and industry sources have increased their market projections for 2016. Given these assumptions, and based on our NIW volume during the first nine months of 2016 combined with our current pipeline of mortgage insurance commitments, we expect our new business volume for 2016 to exceed $48 billion, compared to $41 billion of NIW in 2015.
Since 2009, virtually all of our new mortgage insurance business production has been prime business. The loans from our 2009 and later origination years possess significantly improved credit characteristics compared to our Legacy Portfolio. FICO scores for the borrowers of these insured mortgages are higher and there are fewer loans with LTVs greater than 95%, in both cases as compared to mortgages in our Legacy Portfolio.
58
Part I. Item 2. Management’s Discussion and Analysis of Financial Condition and Results of Operations
In addition to the improved composition of our mortgage insurance portfolio with respect to specific individual credit attributes, such as FICO scores and LTVs, more stringent underwriting requirements have also led to fewer loans from our 2009 and later origination years that combine multiple higher-risk attributes within the same loan, such as a low FICO score with an investment property, or a low FICO score with a cash-out refinancing. These changes have contributed to the improved overall credit quality of our portfolio. The combination of higher-risk attributes within the same loans was a factor that contributed to the increased defaults previously experienced in the Legacy Portfolio.
Refinancings under the HARP programs (discussed below) have also positively impacted the overall credit quality and composition of our mortgage insurance portfolio because the HARP refinancings generally result in terms under which a borrower has a greater ability to pay and more financial flexibility to cover the loan obligations.
The growth of our portfolio written since the beginning of 2009, together with, among other things, the various factors discussed above, have also contributed to the significant improvement in the credit quality of our mortgage insurance portfolio. Our portfolio written since the beginning of 2009, including HARP refinancings, accounted for approximately 87% of our total primary RIF at September 30, 2016, compared to 84% at December 31, 2015. The table below illustrates the improved composition of our mortgage insurance portfolio RIF, based on origination vintages.
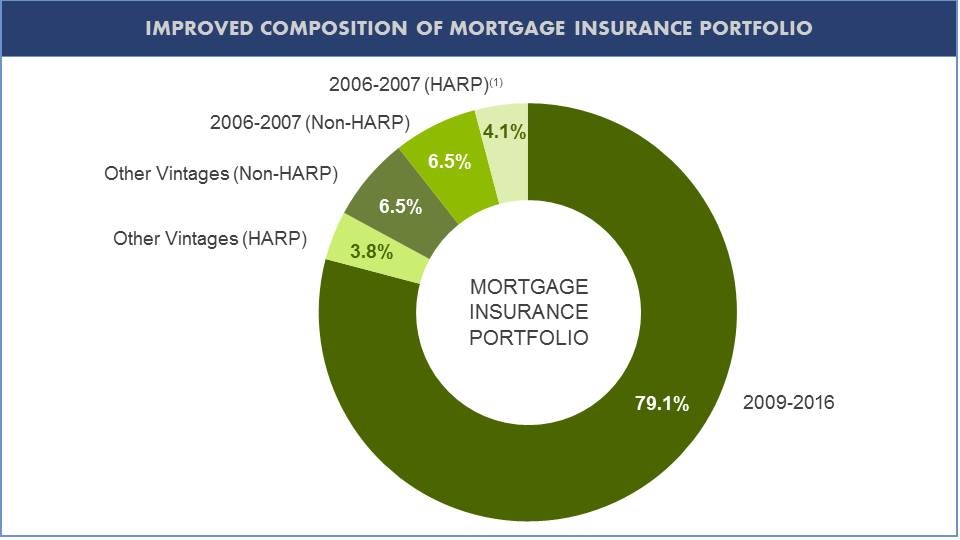 ____________________
(1) | In 2009, the GSEs began offering the HARP, which allows a borrower who is not delinquent to refinance a mortgage if the borrower has been unable to take advantage of lower interest rates because the borrower’s home has decreased in value. We exclude HARP loans from our NIW for the period in which the refinance occurs. During the nine months ended September 30, 2016, new HARP loans accounted for $158.7 million of newly refinanced loans that were not included in Radian Guaranty’s NIW for the period, compared to $607.0 million for the same period of 2015. |
In April 2016, the Federal Housing Finance Agency announced a new Principal Reduction Modification program, with the objective of benefiting borrowers whose mortgages were severely delinquent as of March 1, 2016. Eligible borrowers include those: (i) whose loans are owned or guaranteed by Fannie Mae or Freddie Mac; (ii) whose outstanding unpaid mortgage balance is less than or equal to $250,000; and (iii) whose outstanding unpaid mortgage balance exceeds 115% of the current value of their home. For certain eligible borrowers, this program includes an interest rate reduction down to the current market rate, an extension of the loan term to as much as 40 years, capitalization of certain past due amounts, and forgiveness of a portion of the principal balance after the borrower makes three on-time payments subsequent to the modification. The program is a one-time offering, and the servicers of eligible mortgages were required to solicit eligible borrowers by October 15, 2016.
59
Part I. Item 2. Management’s Discussion and Analysis of Financial Condition and Results of Operations
Although this program has the potential to reduce the number of future claims we would be required to pay, based on our evaluation of the program criteria, we do not expect that a material number of our loans currently in default will be affected. In addition, for any loans modified under this program that subsequently default and result in a claim, we will be required to pay the claim based upon the unpaid principal balance at the time of the default plus the principal forgiven in connection with the modification, without consideration of the modification. We continue to evaluate the impact of the program as more information becomes available.
Although in our overall portfolio there are currently fewer loans with LTVs greater than 95% as compared to mortgages in our Legacy Portfolio, the percentage of recent NIW with LTVs greater than 95% is beginning to steadily increase. Factors influencing the recent increases include: (i) GSE program enhancements and guideline changes; (ii) FHA regulatory enforcement actions; (iii) mortgage insurance pricing changes effective in the first half of 2016; and (iv) recent lender response to market demands and the volume of mortgage originations.
The improvement in the credit quality of our mortgage insurance portfolio is demonstrated by improved default trends for mortgage insurance policies issued since the beginning of 2009. Our expected future losses on our mortgage insurance portfolio written since the beginning of 2009, including HARP refinancings, are significantly lower than those experienced on our Legacy Portfolio. The following charts illustrate the improved trends of our cumulative incurred loss ratios by year of origination and development year.
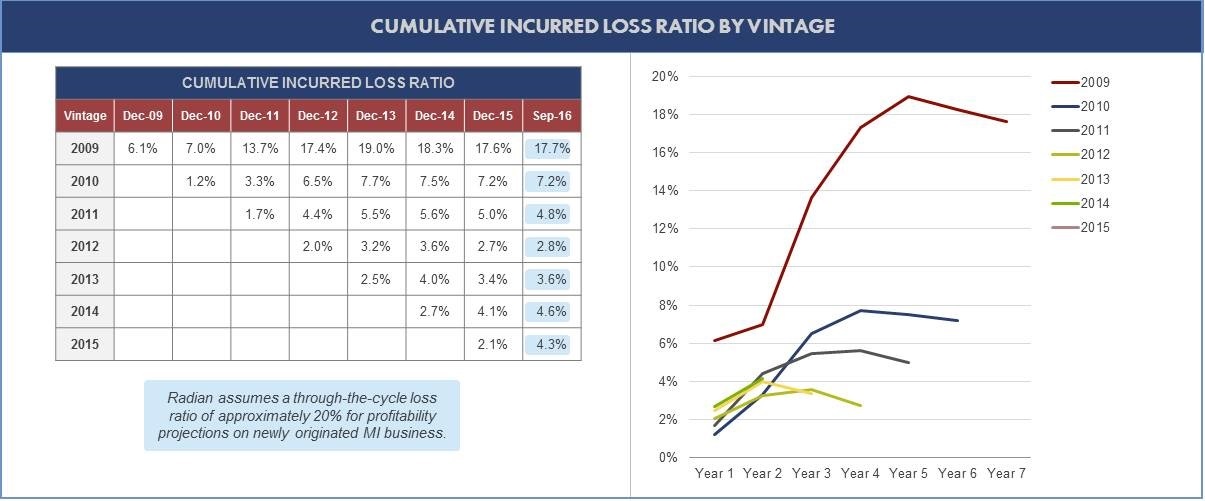
The following tables provide selected information as of and for the periods indicated related to mortgage insurance NIW, RIF and IIF. Policy years represent the original policy years, and have not been adjusted to reflect subsequent HARP refinancing activity. Primary RIF and IIF amounts at September 30, 2016 include $292 million and $1.2 billion, respectively, related to loans that are subject to the Freddie Mac Agreement. Although we no longer have future claim liability on these loans, we continue to receive premiums on the related loans and the insurance remains in force; therefore, these loans are included in our primary RIF and IIF. Throughout this report, unless otherwise noted, RIF is presented on a gross basis and includes the amount ceded under reinsurance. NIW, RIF and IIF for Direct Single Premiums include policies written on an individual basis (as each loan is originated) and on an aggregated basis (in which each individual loan in a group of loans is insured in a single transaction, typically after the loans have been originated).
As a percentage of our total NIW, the level of our purchase origination volume decreased and our refinance origination volume increased during the three months ended September 30, 2016, compared to the same period of 2015, driven by a significant increase in refinance mortgage originations due to the low interest rate environment. During the nine months ended September 30, 2016, the level of our purchase origination volume as a percentage of our total NIW increased and our refinance originations decreased, compared to the same period of 2015, primarily driven by growth in purchase originations during the first half of 2016. Purchase borrowers tend to have lower FICO scores and higher LTVs than borrowers who are refinancing. Our most recent trends in FICO scores and LTVs reflect the recent shift in our mix of purchase and refinance business, combined with a slow, steady expansion of credit in the marketplace as a result of the improving economy.
60
Part I. Item 2. Management’s Discussion and Analysis of Financial Condition and Results of Operations
Three Months Ended September 30, | Nine Months Ended September 30, | ||||||||||||||||||||||||||
($ in millions) | 2016 | 2015 | 2016 | 2015 | |||||||||||||||||||||||
Total primary NIW by FICO Score | |||||||||||||||||||||||||||
>=740 | $ | 10,043 | 64.2 | % | $ | 6,822 | 61.0 | % | $ | 22,630 | 61.7 | % | $ | 20,195 | 62.5 | % | |||||||||||
680-739 | 4,763 | 30.4 | 3,567 | 31.9 | 11,643 | 31.8 | 10,027 | 31.0 | |||||||||||||||||||
620-679 | 850 | 5.4 | 787 | 7.1 | 2,375 | 6.5 | 2,090 | 6.5 | |||||||||||||||||||
Total Primary | $ | 15,656 | 100.0 | % | $ | 11,176 | 100.0 | % | $ | 36,648 | 100.0 | % | $ | 32,312 | 100.0 | % | |||||||||||
Three Months Ended September 30, | Nine Months Ended September 30, | ||||||||||||||
($ in millions) | 2016 | 2015 | 2016 | 2015 | |||||||||||
Percentage of primary NIW | |||||||||||||||
Direct Monthly and Other Premiums | 73 | % | 73 | % | 73 | % | 68 | % | |||||||
Direct Single Premiums | 27 | % | 27 | % | 27 | % | 32 | % | |||||||
Net Single Premiums (1) | 17 | % | 27 | % | 18 | % | 32 | % | |||||||
Refinances | 22 | % | 13 | % | 20 | % | 22 | % | |||||||
LTV | |||||||||||||||
95.01% and above | 6.0 | % | 3.5 | % | 5.1 | % | 2.9 | % | |||||||
90.01% to 95.00% | 47.1 | % | 51.5 | % | 48.9 | % | 49.9 | % | |||||||
85.01% to 90.00% | 31.4 | % | 34.1 | % | 31.9 | % | 33.8 | % | |||||||
85.00% and below | 15.5 | % | 10.9 | % | 14.1 | % | 13.4 | % | |||||||
Primary risk written | $ | 3,869 | $ | 2,873 | $ | 9,162 | $ | 8,151 | |||||||
(1) | In 2016, represents the percentage of direct single premiums written, after consideration of the 35% single premium NIW ceded under the Single Premium QSR Transaction. |
($ in millions) | September 30, 2016 | December 31, 2015 | September 30, 2015 | ||||||||
Primary IIF | |||||||||||
Direct Monthly and Other Premiums | 68 | % | 69 | % | 69 | % | |||||
Direct Single Premiums | 32 | % | 31 | % | 31 | % | |||||
Net Single Premiums (1) | 25 | % | 31 | % | 31 | % | |||||
Total Primary IIF | $ | 181,165 | $ | 175,584 | $ | 174,866 | |||||
Persistency Rate (12 months ended) | 78.4 | % | 78.8 | % | 79.2 | % | |||||
Persistency Rate (quarterly, annualized) (2) | 75.3 | % | 81.8 | % | 80.5 | % | |||||
______________________
(1) | Represents the percentage of single premium IIF, after giving effect to all reinsurance ceded. |
(2) | The Persistency Rate on a quarterly, annualized basis may be impacted by seasonality or other factors, and may not be indicative of full-year trends. |
61
Part I. Item 2. Management’s Discussion and Analysis of Financial Condition and Results of Operations
($ in millions) | September 30, 2016 | December 31, 2015 | September 30, 2015 | |||||||||||||||||
Primary RIF by Premium Type | ||||||||||||||||||||
Direct Monthly and Other Premiums | $ | 31,839 | 68.9 | % | $ | 30,940 | 69.3 | % | $ | 30,972 | 69.8 | % | ||||||||
Direct Single Premiums | 14,383 | 31.1 | 13,687 | 30.7 | 13,392 | 30.2 | ||||||||||||||
Total Primary RIF | $ | 46,222 | 100.0 | % | $ | 44,627 | 100.0 | % | $ | 44,364 | 100.0 | % | ||||||||
Net Single Premiums (1) | $ | 10,037 | 24.6 | % | $ | 12,846 | 30.2 | % | $ | 12,523 | 29.7 | % | ||||||||
Primary RIF by Risk Grade | ||||||||||||||||||||
Prime | $ | 44,075 | 95.3 | % | $ | 42,170 | 94.5 | % | $ | 41,784 | 94.2 | % | ||||||||
Alt-A | 1,241 | 2.7 | 1,427 | 3.2 | 1,510 | 3.4 | ||||||||||||||
A minus and below | 906 | 2.0 | 1,030 | 2.3 | 1,070 | 2.4 | ||||||||||||||
Total Primary RIF | $ | 46,222 | 100.0 | % | $ | 44,627 | 100.0 | % | $ | 44,364 | 100.0 | % | ||||||||
(1) | Represents the dollar amount and percentage, respectively, of Single Premium RIF, after giving effect to all reinsurance ceded. |
($ in millions) | September 30, 2016 | December 31, 2015 | September 30, 2015 | |||||||||||||||||
Total primary RIF by FICO score | ||||||||||||||||||||
>=740 | $ | 26,531 | 57.4 | % | $ | 25,467 | 57.1 | % | $ | 25,265 | 57.0 | % | ||||||||
680-739 | 14,276 | 30.9 | 13,543 | 30.3 | 13,403 | 30.2 | ||||||||||||||
620-679 | 4,697 | 10.2 | 4,806 | 10.8 | 4,852 | 10.9 | ||||||||||||||
<=619 | 718 | 1.5 | 811 | 1.8 | 844 | 1.9 | ||||||||||||||
Total Primary RIF | $ | 46,222 | 100.0 | % | $ | 44,627 | 100.0 | % | $ | 44,364 | 100.0 | % | ||||||||
Primary RIF on defaulted loans (1) | $ | 1,381 | $ | 1,625 | $ | 1,666 | ||||||||||||||
(1) | Excludes risk related to loans subject to the Freddie Mac Agreement. |
62
Part I. Item 2. Management’s Discussion and Analysis of Financial Condition and Results of Operations
($ in millions) | September 30, 2016 | December 31, 2015 | September 30, 2015 | |||||||||||||||||
Total primary RIF by LTV | ||||||||||||||||||||
95.01% and above | $ | 3,322 | 7.2 | % | $ | 3,249 | 7.3 | % | $ | 3,301 | 7.4 | % | ||||||||
90.01% to 95.00% | 24,088 | 52.1 | 22,479 | 50.4 | 22,094 | 49.8 | ||||||||||||||
85.01% to 90.00% | 15,178 | 32.8 | 15,184 | 34.0 | 15,194 | 34.3 | ||||||||||||||
85.00% and below | 3,634 | 7.9 | 3,715 | 8.3 | 3,775 | 8.5 | ||||||||||||||
Total primary RIF | $ | 46,222 | 100.0 | % | $ | 44,627 | 100.0 | % | $ | 44,364 | 100.0 | % | ||||||||
Percentage of primary RIF | ||||||||||||||||||||
Refinances | 21 | % | 23 | % | 24 | % | ||||||||||||||
Loan Type: | ||||||||||||||||||||
Fixed | 96.8 | % | 96.1 | % | 95.9 | % | ||||||||||||||
Adjustable rate mortgages (fully indexed) (1) | 2.3 | 2.7 | 2.8 | |||||||||||||||||
Mortgages with interest only or potential negative amortization | 0.9 | 1.2 | 1.3 | |||||||||||||||||
Total | 100.0 | % | 100.0 | % | 100.0 | % | ||||||||||||||
Total primary RIF by policy year | ||||||||||||||||||||
2005 and prior | $ | 2,375 | 5.1 | % | $ | 2,823 | 6.3 | % | $ | 3,005 | 6.8 | % | ||||||||
2006 | 1,444 | 3.1 | 1,666 | 3.7 | 1,747 | 3.9 | ||||||||||||||
2007 | 3,432 | 7.4 | 3,891 | 8.7 | 4,033 | 9.1 | ||||||||||||||
2008 | 2,395 | 5.2 | 2,798 | 6.3 | 2,923 | 6.6 | ||||||||||||||
2009 | 536 | 1.2 | 736 | 1.7 | 805 | 1.8 | ||||||||||||||
2010 | 467 | 1.0 | 616 | 1.4 | 671 | 1.5 | ||||||||||||||
2011 | 1,012 | 2.2 | 1,294 | 2.9 | 1,387 | 3.1 | ||||||||||||||
2012 | 4,057 | 8.8 | 5,010 | 11.2 | 5,316 | 12.0 | ||||||||||||||
2013 | 6,422 | 13.9 | 8,056 | 18.1 | 8,534 | 19.2 | ||||||||||||||
2014 | 6,177 | 13.4 | 7,646 | 17.1 | 7,977 | 18.0 | ||||||||||||||
2015 | 8,966 | 19.4 | 10,091 | 22.6 | 7,966 | 18.0 | ||||||||||||||
2016 | 8,939 | 19.3 | — | — | — | — | ||||||||||||||
Total primary RIF | $ | 46,222 | 100.0 | % | $ | 44,627 | 100.0 | % | $ | 44,364 | 100.0 | % | ||||||||
(1) | “Fully indexed” refers to loans where payment adjustments are equal to mortgage-rate adjustments. |
Net Premiums Written and Earned. Net premiums written for the three and nine months ended September 30, 2016 decreased compared to the same periods of 2015, primarily due to $13.0 million and $222.1 million, respectively, of ceded premiums written under the Single Premium QSR Transaction. The Single Premium QSR Transaction was effective as of January 1, 2016.
63
Part I. Item 2. Management’s Discussion and Analysis of Financial Condition and Results of Operations
Net premiums earned increased for the three months ended September 30, 2016, compared to the same period of 2015, primarily as a result of the impact of the accelerated recognition of premiums earned on Single Premium Policies that were cancelled during the three months ended September 30, 2016, which was higher than the comparable period of 2015. This increase was partially offset by increased ceded premiums, net of profit commission, primarily associated with the Single Premium QSR Transaction, which was effective January 1, 2016. Net premiums earned decreased for the nine months ended September 30, 2016, compared to the same period of 2015, primarily as a result of the increased ceded premiums, net of profit commission, primarily associated with the Single Premium QSR Transaction, partially offset by the impact of the accelerated recognition of premiums earned on Single Premium Policies that were cancelled during the nine months ended September 30, 2016, which was higher than the comparable period of 2015. The nine months ended September 30, 2015 also included the favorable impact associated with prepayments that servicers had not previously reported to Radian. Net premiums earned were also impacted by our increased level of IIF in the three and nine months ended September 30, 2016, as compared to the same periods of 2015.
Approximately 60% of the loans in our total primary mortgage insurance portfolio at September 30, 2016 have Monthly Premium Policies that provide a level monthly premium for the first ten years of the policy, followed by a reduced level monthly premium thereafter. If a loan is refinanced under HARP, the initial ten-year period is reset. Due to the borrower’s ability to cancel the policy, generally when the LTV reaches 80% of the original unpaid principal balance, and the automatic cancellation of the policy when the LTV reaches 78% of the unpaid principal balance, the volume of loans that remain insured after ten years and would be subject to the premium reset is generally not material in relation to the total loans originated. However, to the extent the volume of loans resetting from year to year varies significantly, the trend in earned premiums may also vary.
Our expected rate of return on our Single Premium Policies is lower than on our Monthly Premium Policies because our premium rates are generally lower for these policies. Assuming all other factors remain constant, when loans with Single Premium Policies prepay earlier than expected, then our profitability on Single Premium Policies is higher than anticipated. If loans with Single Premium Policies are repaid later than expected, however, our profitability on Single Premium Policies is lower than anticipated. Prepayment speeds, which are impacted by changes in interest rates, among other factors, impact the expected profitability of our Monthly Premium Policies in the opposite direction. For our Monthly Premium Policies, earlier than anticipated prepayments generally reduce profitability.
The ultimate profitability of our mortgage insurance business is affected by the impact of mortgage prepayment speeds on the mix of business we write. Because prepayment speeds are difficult to project, our strategy has been to write a mix of Single Premium Policies and Monthly Premium Policies, which we believe balances the overall impact on our results if actual prepayment speeds are significantly different from expectations. The Single Premium QSR Transaction is consistent with our strategy to balance our mix of Single Premium Policies and Monthly Premium Policies. The impact of all of our third-party QSR transactions reduced our Single Premium RIF from 31.1% to 24.6% at September 30, 2016. See “—Operating Environment and Business Strategy” for more information.
Refinancing transactions are more frequently conducted using Single Premium Policies than purchase transactions. As a result, the reduced level of refinancing activity we experienced in the first nine months of 2016, compared to the same period of 2015, contributed to a decrease in our total mix of Single Premium Policies to 27% of our NIW for the first nine months of 2016, compared to 32% for the first nine months of 2015. In addition, a portion of the decline in the percentage of Single Premium Policies was due to a shift in mix toward Monthly Premium Policies due to widespread industry pricing changes. The decrease was also consistent with our deliberate actions related to pricing, including our disciplined approach to offering customized pricing levels. We believe our current production level of Single Premium Policies can be absorbed into our portfolio while maintaining an appropriate balance between risk and returns, which has been further enhanced by the Single Premium QSR Transaction, as further discussed below.
Historically, we have entered into reinsurance transactions as part of our capital and risk management activities, including to manage Radian Guaranty’s Risk-to-capital. Most recently, in the first quarter of 2016, in order to proactively manage the risk and return profile of Radian Guaranty’s insured portfolio and continue managing its position under the PMIERs Financial Requirements in a cost-effective manner, Radian Guaranty entered into the Single Premium QSR Transaction with a panel of third-party reinsurers. Radian Guaranty began ceding business under this agreement effective January 1, 2016.
64
Part I. Item 2. Management’s Discussion and Analysis of Financial Condition and Results of Operations
The Single Premium QSR Transaction had the following impact on Radian’s first nine months of 2016 financial results:
• | A decrease to net premiums earned of $21.7 million, net of accrued profit commission; |
• | A decrease to operating expenses of $10.7 million, related to the ceding commission; |
• | A decrease to provision for losses and amortization of deferred acquisition costs totaling $2.1 million; and |
• | A net decrease to pretax income from continuing operations (and to adjusted pretax operating income) of $8.9 million. |
The Single Premium QSR Transaction is expected to increase Radian Guaranty’s return on required capital for its Single Premium Policies. In future quarters, the impact of the Single Premium QSR Transaction will vary depending on the level of ceded RIF, as well as the levels of prepayments and incurred losses on the reinsured portfolio, among other factors.
The following table provides information related to the premium impact of our reinsurance transactions. See Note 7 of Notes to Unaudited Condensed Consolidated Financial Statements for more information about our reinsurance transactions, including the ceded amounts related to the QSR Transactions. See “Liquidity and Capital Resources—Radian Group—Short-Term Liquidity Needs” for more information about our Single Premium QSR Transaction.
Three Months Ended September 30, | Nine Months Ended September 30, | ||||||||||
2016 | 2015 | 2016 | 2015 | ||||||||
Initial and Second QSR Transactions | |||||||||||
% of total direct premiums written | 2.6 | % | 3.4 | % | 3.0 | % | 3.0 | % | |||
% of total direct premiums earned | 4.1 | % | 5.1 | % | 4.4 | % | 5.0 | % | |||
Single Premium QSR Transaction | |||||||||||
% of total direct premiums written | 5.0 | % | — | % | 29.7 | % | — | % | |||
% of total direct premiums earned | 3.3 | % | — | % | 2.9 | % | — | % | |||
First-Lien Captives | |||||||||||
% of total direct premiums written | 0.2 | % | 1.0 | % | 0.5 | % | 1.0 | % | |||
% of total direct premiums earned | 0.2 | % | 1.0 | % | 0.5 | % | 1.1 | % | |||
Net Investment Income. For the three and nine months ended September 30, 2016, net investment income increased compared to the same periods in 2015. As we progressed toward our investment and liquidity targets over the past several months, we extended the duration of investments in our portfolio and increased our investment yields. All periods include full allocation to the Mortgage Insurance segment of net investment income from investments held at Radian Group.
Provision for Losses. The following table details the significant components of our provision for losses for the periods indicated:
Three Months Ended September 30, | Nine Months Ended September 30, | ||||||||||||||
(In millions) | 2016 | 2015 | 2016 | 2015 | |||||||||||
Current period defaults (1) | $ | 57.6 | $ | 66.6 | $ | 152.3 | $ | 184.5 | |||||||
Prior period defaults (2) | (1.8 | ) | (3.2 | ) | (3.9 | ) | (42.2 | ) | |||||||
Second-lien premium deficiency reserve and other | 0.3 | 0.7 | 1.1 | (0.7 | ) | ||||||||||
Provision for losses | $ | 56.1 | $ | 64.1 | $ | 149.5 | $ | 141.6 | |||||||
______________________
(1) | Related to defaulted loans with a most recent default notice in the period indicated. For example, if a loan had defaulted in a prior period, but then subsequently cured and later re-defaulted in the current period, the default would be considered a current period default. |
(2) | Related to defaulted loans with a default notice dated in a period earlier than the period indicated, which have been continuously in default since that time. |
65
Part I. Item 2. Management’s Discussion and Analysis of Financial Condition and Results of Operations
Our mortgage insurance provision for losses for the three and nine months ended September 30, 2016 decreased by $8.0 million and increased by $7.9 million, respectively, as compared to the same periods in 2015. Reserves established for new default notices were the primary driver of our total incurred losses for the three and nine months ended September 30, 2016 and 2015. Current period primary defaults decreased by approximately 2% and 4%, respectively, for the three and nine months ended September 30, 2016, compared to the same periods in 2015. In addition, our gross Default to Claim Rate assumption for new primary defaults was approximately 12% as of September 30, 2016, compared to 14% as of September 30, 2015. This reduction in estimated Default to Claim Rates, which was based on observed trends, contributed to the reduction in the portion of our provision for losses related to new defaults in 2016, as compared to the same periods in 2015.
Partially mitigating the impact of our provision for losses for current period defaults in both 2016 and 2015 was positive reserve development on prior period defaults, primarily due to reductions in certain Default to Claim Rate assumptions based on observed trends of higher Cures than were previously estimated on those prior period defaults. However, the positive development on prior period defaults observed for the nine months ended September 30, 2016, was significantly lower than the comparable period for 2015.
Our primary default rate at September 30, 2016 was 3.3% compared to 4.0% at December 31, 2015. Our primary defaulted inventory comprised 29,530 loans at September 30, 2016, compared to 35,303 loans at December 31, 2015, representing a 16.4% decrease. The reduction in our primary defaulted inventory is the result of the total number of defaulted loans: (1) that have cured; (2) for which claim payments have been made; or (3) that have resulted in net Rescissions and Claim Denials, collectively exceeding the total number of new defaults on insured loans. We currently expect total new defaults for 2016 to continue to decrease, although the rate of decrease has moderated from that observed in 2015. This is due, in part, to the shift in our portfolio composition toward more recent vintages for which we expect increasing levels of new defaults, consistent with typical default seasoning patterns.
The following table shows the number of primary loans that we have insured, the number of loans in default and the percentage of loans in default as of the dates indicated:
September 30, 2016 | December 31, 2015 | September 30, 2015 | ||||||
Default Statistics—Primary Insurance: | ||||||||
Total Primary Insurance | ||||||||
Prime | ||||||||
Number of insured loans | 840,534 | 816,797 | 812,657 | |||||
Number of loans in default | 19,100 | 22,223 | 22,328 | |||||
Percentage of loans in default | 2.27 | % | 2.72 | % | 2.75 | % | ||
Alt-A | ||||||||
Number of insured loans | 28,080 | 32,411 | 34,166 | |||||
Number of loans in default | 4,545 | 5,813 | 6,318 | |||||
Percentage of loans in default | 16.19 | % | 17.94 | % | 18.49 | % | ||
A minus and below | ||||||||
Number of insured loans | 28,313 | 31,902 | 33,018 | |||||
Number of loans in default | 5,885 | 7,267 | 7,229 | |||||
Percentage of loans in default | 20.79 | % | 22.78 | % | 21.89 | % | ||
Total Primary Insurance | ||||||||
Number of insured loans (1) | 896,927 | 881,110 | 879,841 | |||||
Number of loans in default (2) | 29,530 | 35,303 | 35,875 | |||||
Percentage of loans in default | 3.29 | % | 4.01 | % | 4.08 | % | ||
______________________
(1) | Includes 6,227; 7,353; and 7,656 insured loans subject to the Freddie Mac Agreement at September 30, 2016, December 31, 2015 and September 30, 2015, respectively. |
(2) | Excludes 1,888; 2,821; and 2,993 loans that are in default at September 30, 2016, December 31, 2015 and September 30, 2015, respectively, subject to the Freddie Mac Agreement, and for which we no longer have claims exposure. |
66
Part I. Item 2. Management’s Discussion and Analysis of Financial Condition and Results of Operations
The following table shows a rollforward of our primary loans in default:
Three Months Ended September 30, | Nine Months Ended September 30, | ||||||||||
2016 | 2015 | 2016 | 2015 | ||||||||
Beginning default inventory | 29,827 | 37,676 | 35,303 | 45,319 | |||||||
Plus: New defaults (1) | 10,459 | 10,698 | 29,574 | 30,957 | |||||||
Less: Cures | 9,127 | 9,676 | 29,454 | 30,856 | |||||||
Less: Claims paid (2) (3) | 1,615 | 2,983 | 5,900 | 10,806 | |||||||
Less: Rescissions and Claim Denials, net of (Reinstatements) (4) | 14 | 73 | (7 | ) | 80 | ||||||
Less: Rescissions and Claim Denials, net of (Reinstatements), related to the BofA Settlement Agreement (5) | — | (233 | ) | — | (1,341 | ) | |||||
Ending default inventory | 29,530 | 35,875 | 29,530 | 35,875 | |||||||
______________________
(1) | A total of 73% of new notices of defaults are from our Legacy Portfolio. |
(2) | Includes those charged to a deductible or captive. |
(3) | Includes 876 and 3,666 claim payments related to the BofA Settlement Agreement for the three and nine months ended September 30, 2015, respectively. |
(4) | Net of any previous Rescissions and Claim Denials that were reinstated during the period (excluding activity related to the BofA Settlement Agreement). Such reinstated Rescissions and Claim Denials may ultimately result in a paid claim. |
(5) | Includes Rescissions, Claim Denials and Reinstatements on the population of loans subject to the BofA Settlement Agreement. Rescissions and Claim Denials, net of (Reinstatements), related to the BofA Settlement Agreement prior to the February 1, 2015 implementation date represent such activities on loans that subsequently became subject to the BofA Settlement Agreement. |
Our aggregate weighted average Default to Claim Rate assumption for our primary loans used in estimating our reserve for losses, which is net of estimated Claim Denials and Rescissions, was 45% and 46% at September 30, 2016 and December 31, 2015, respectively. We develop our Default to Claim Rate estimates on defaulted loans based on models that use a variety of loan characteristics to determine the likelihood that a default will reach claim status. Our Default to Claim Rate estimates on defaulted loans are mainly developed based on the Stage of Default and Time in Default of the underlying defaulted loans, as measured by the progress toward foreclosure sale and the number of months in default. During the nine months ended September 30, 2016, our gross Default to Claim Rate assumption for new primary defaults was modestly reduced from approximately 13% at December 31, 2015, to approximately 12%. As of September 30, 2016, our gross Default to Claim Rates on our primary portfolio ranged from approximately 12% for new defaults, up to approximately 65% for defaults not in foreclosure stage, and 81% for Foreclosure Stage Defaults.
67
Part I. Item 2. Management’s Discussion and Analysis of Financial Condition and Results of Operations
The following tables show additional information about our primary loans in default as of the dates indicated:
September 30, 2016 | ||||||||||||||||||
Total | Foreclosure Stage Defaulted Loans | Cure % During the 3rd Quarter | Reserve for Losses | % of Reserve | ||||||||||||||
($ in thousands) | # | % | # | % | $ | % | ||||||||||||
Missed payments: | ||||||||||||||||||
Three payments or less | 9,565 | 32.4 | % | 167 | 30.5 | % | $ | 97,303 | 14.1 | % | ||||||||
Four to eleven payments | 7,217 | 24.4 | 494 | 20.4 | 119,392 | 17.3 | ||||||||||||
Twelve payments or more | 10,828 | 36.7 | 2,814 | 6.1 | 377,215 | 54.8 | ||||||||||||
Pending claims | 1,920 | 6.5 | N/A | 2.3 | 95,003 | 13.8 | ||||||||||||
Total | 29,530 | 100.0 | % | 3,475 | 688,913 | 100.0 | % | |||||||||||
IBNR and other | 73,057 | |||||||||||||||||
LAE | 21,255 | |||||||||||||||||
Total primary reserve | $ | 783,225 | ||||||||||||||||
September 30, 2016 | ||||
Key Reserve Assumptions | ||||
Gross Default to Claim Rate % | Net Default to Claim Rate % | Claim Severity % (1) | ||
48% | 45% | 102% | ||
December 31, 2015 | ||||||||||||||||||
Total | Foreclosure Stage Defaulted Loans | Cure % During the 4th Quarter | Reserve for Losses | % of Reserve | ||||||||||||||
($ in thousands) | # | % | # | % | $ | % | ||||||||||||
Missed payments: | ||||||||||||||||||
Three payments or less | 10,742 | 30.4 | % | 187 | 29.0 | % | $ | 107,632 | 13.1 | % | ||||||||
Four to eleven payments | 8,481 | 24.0 | 541 | 16.2 | 127,183 | 15.5 | ||||||||||||
Twelve payments or more | 13,731 | 38.9 | 3,160 | 4.2 | 473,440 | 57.6 | ||||||||||||
Pending claims | 2,349 | 6.7 | N/A | 1.5 | 113,570 | 13.8 | ||||||||||||
Total | 35,303 | 100.0 | % | 3,888 | 821,825 | 100.0 | % | |||||||||||
IBNR and other | 83,066 | |||||||||||||||||
LAE | 26,108 | |||||||||||||||||
Total primary reserve | $ | 930,999 | ||||||||||||||||
December 31, 2015 | ||||
Key Reserve Assumptions | ||||
Gross Default to Claim Rate % | Net Default to Claim Rate % | Claim Severity % (1) | ||
48% | 46% | 101% | ||
______________________
N/A – Not applicable
(1) | Factors that impact the severity of a claim include, but are not limited to: the size of the loan; the amount of mortgage insurance coverage placed on the loan; the amount of time between default and claim during which we are expected to cover interest (capped at two years under our Prior Master Policy and capped at three years under our 2014 Master Policy) and certain expenses; and the impact of certain loss management activities with respect to the loan. |
68
Part I. Item 2. Management’s Discussion and Analysis of Financial Condition and Results of Operations
Our mortgage insurance total loss reserve as a percentage of our mortgage insurance total RIF was 1.7% at September 30, 2016, compared to 2.1% at December 31, 2015. Our primary reserve per default (calculated as primary reserve excluding IBNR and other reserves divided by the number of primary defaults) was $24,049 and $24,019 at September 30, 2016 and December 31, 2015, respectively. See Note 10 of Notes to Unaudited Condensed Consolidated Financial Statements for information regarding our reserves for losses by category and a reconciliation of our Mortgage Insurance segment’s beginning and ending reserves for losses and LAE.
We considered the sensitivity of our loss reserve estimates at September 30, 2016 by assessing the potential changes resulting from a parallel shift in Claim Severity and Default to Claim Rate for primary loans. For example, assuming all other factors remain constant, for every one percentage point change in primary Claim Severity (which we estimated to be 102% of our risk exposure at September 30, 2016), we estimated that our total loss reserve would change by approximately $7 million at September 30, 2016. For every one percentage point change in our primary net Default to Claim Rate (which we estimated to be 45% at September 30, 2016, including our assumptions related to Rescissions and Claim Denials), we estimated a change of approximately $15 million in our primary loss reserve at September 30, 2016.
Our net Default to Claim Rate and loss reserve estimate incorporates our future expectations with respect to future Claim Denials and Rescissions. These expectations are based on our recent experience with respect to the number of claims that have been denied due to the policyholder’s failure to submit sufficient documentation to perfect a claim within the time period permitted under our Master Policies and also our recent experience with respect to the number of insurance certificates that have been rescinded due to fraud, underwriter negligence or other factors. See Note 10 of Notes to Unaudited Condensed Consolidated Financial Statements.
The level of Rescissions and Claim Denials has been declining in recent periods as our defaulted Legacy Portfolio continues to decline, and we expect this trend to continue. Although our estimates of future Rescissions and Claim Denials have generally been declining, our Rescissions and Claim Denials continue to reduce our paid losses and have resulted in a reduction in our loss reserve. Our estimate of net future Rescissions and Claim Denials reduced our loss reserve as of September 30, 2016 and December 31, 2015 by approximately $59 million and $69 million, respectively. The impact to our mortgage insurance reserves due to estimated future Rescissions and Claim Denials incorporates our expectations regarding the number of policies that we expect to be reinstated as a result of our claims rebuttal process.
We expect that a portion of previous Rescissions will be reinstated and previous Claim Denials will be resubmitted with the required documentation and ultimately paid; therefore, we have incorporated this expectation into our IBNR reserve estimate. Our IBNR reserve estimate was $16.8 million and $26.6 million at September 30, 2016 and December 31, 2015, respectively.
On September 16, 2014, Radian Guaranty entered into the BofA Settlement Agreement in order to resolve various actual and potential claims or disputes related to the parties’ respective rights and duties as to mortgage insurance coverage on the Subject Loans. The consent of the GSEs required to implement the BofA Settlement Agreement was received in December 2014, and implementation of the agreement for Subject Loans owned by the GSEs or held in portfolio by the Insureds commenced on February 1, 2015. See Note 10 of Notes to Consolidated Financial Statements in our 2015 Form 10-K for additional information about the BofA Settlement Agreement.
Our reported Rescission and Claim Denial activity in any given period is subject to challenge by our lender and servicer customers through our claims rebuttal process. In addition, we at times engage in discussions with our lender and servicer customers regarding our Loss Mitigation Activities. Unless a liability associated with such activities or discussions becomes probable and can be reasonably estimated, we consider our claim payments and our Rescissions, Claim Denials and Claim Curtailments to be resolved for financial reporting purposes. In accordance with the accounting standard regarding contingencies, we accrue for an estimated loss when we determine that the loss is probable and can be reasonably estimated. See Note 12 of Notes to Unaudited Condensed Consolidated Financial Statements for additional information.
In addition, as part of our claims review process, we assess whether defaulted loans were serviced appropriately in accordance with our insurance policies and servicing guidelines. To the extent a servicer has failed to satisfy its servicing obligations, our policies provide that we may curtail the claim payment for such default, and in some circumstances, cancel coverage or deny the claim. Claim Curtailments due to servicer noncompliance with our insurance policies and servicing guidelines impact the severity of our claim payments. Claim Curtailments due to servicer noncompliance with our insurance policies and servicing guidelines were approximately $1.8 million and $6.6 million for the three and nine months ended September 30, 2016, respectively, compared to approximately $2.7 million and $14.0 million for the three and nine months ended September 30, 2015, respectively.
69
Part I. Item 2. Management’s Discussion and Analysis of Financial Condition and Results of Operations
Total mortgage insurance claims paid of $82.7 million and $301.1 million for the three and nine months ended September 30, 2016, respectively, have decreased from claims paid of $169.1 million and $588.2 million for the three and nine months ended September 30, 2015, respectively, primarily due to the completion of the reinstatement activities required by the BofA Settlement Agreement, which increased claims paid from February 2015 through December 31, 2015. Claims paid in the first nine months of 2015 included $236.6 million of claim payments associated with the BofA Settlement Agreement. We currently expect claims paid of approximately $375 million for the full year of 2016.
The following table shows claims paid by product and average claim paid by product for the periods indicated:
Three Months Ended September 30, | Nine Months Ended September 30, | ||||||||||||||
(In thousands) | 2016 | 2015 | 2016 | 2015 | |||||||||||
Net claims paid: (1) | |||||||||||||||
Prime | $ | 51,964 | $ | 65,396 | $ | 182,432 | $ | 225,071 | |||||||
Alt-A | 16,334 | 18,966 | 63,612 | 62,225 | |||||||||||
A minus and below | 9,615 | 14,028 | 35,126 | 44,134 | |||||||||||
Total primary claims paid | 77,913 | 98,390 | 281,170 | 331,430 | |||||||||||
Pool | 4,492 | 8,721 | 17,332 | 28,393 | |||||||||||
Second-lien and other | (234 | ) | (16 | ) | (120 | ) | (180 | ) | |||||||
Subtotal | 82,171 | 107,095 | 298,382 | 359,643 | |||||||||||
Impact of captive terminations | (171 | ) | — | (2,910 | ) | (12,000 | ) | ||||||||
Impact of settlements (2) | 705 | 61,994 | 5,605 | 240,557 | |||||||||||
Total net claims paid | $ | 82,705 | $ | 169,089 | $ | 301,077 | $ | 588,200 | |||||||
Average net claim paid: (3) | |||||||||||||||
Prime | $ | 48.3 | $ | 46.2 | $ | 48.3 | $ | 46.3 | |||||||
Alt-A | 65.3 | 60.2 | 63.9 | 57.8 | |||||||||||
A minus and below | 41.3 | 42.5 | 39.2 | 39.6 | |||||||||||
Total average net primary claim paid | 50.0 | 47.8 | 49.6 | 47.0 | |||||||||||
Pool | 51.0 | 51.3 | 54.0 | 59.0 | |||||||||||
Total average net claim paid | $ | 49.7 | $ | 47.8 | $ | 49.5 | $ | 47.5 | |||||||
Average direct primary claim paid (3) (4) | $ | 50.3 | $ | 48.5 | $ | 50.1 | $ | 47.9 | |||||||
Average total direct claim paid (3) (4) | $ | 50.0 | $ | 48.5 | $ | 49.9 | $ | 48.4 | |||||||
______________________
(1) | Net of reinsurance recoveries. |
(2) | For 2015, includes the impact of the BofA Settlement Agreement. |
(3) | Calculated without giving effect to the impact of the termination of captive transactions and settlements. |
(4) | Before reinsurance recoveries. |
Other Operating Expenses. Other operating expenses for the three and nine months ended September 30, 2016, decreased compared to the same periods in 2015, primarily as a result of the benefit of ceding commissions from the Single Premium QSR Transaction, partially offset by an increase in compensation-related expense and in technology expenses associated with a significant investment in upgrading our systems.
70
Part I. Item 2. Management’s Discussion and Analysis of Financial Condition and Results of Operations
Interest Expense. These amounts reflect the allocated portion of interest on Radian Group’s long-term debt, which exclude the Senior Notes due 2019. The allocated interest decreased in the three and nine months ended September 30, 2016, compared to the same periods in 2015. This decrease was primarily due to reductions in interest expense from: (i) the March 2016 and June 2015 purchases of aggregate principal amounts of $30.1 million and $389.1 million, respectively, of Convertible Senior Notes due 2017; (ii) the 2016 purchases of $322.0 million aggregate principal amount of Convertible Senior Notes due 2019; and (iii) the August 2016 redemption of the remaining $195.5 million aggregate principal amount of our Senior Notes due 2017. These reductions were partially offset by increased interest expense from the March 2016 issuance of $350 million aggregate principal amount of 7.000% Senior Notes due 2021 and the June 2015 issuance of $350 million aggregate principal amount of 5.250% Senior Notes due 2020. See Note 11 of Notes to Unaudited Condensed Consolidated Financial Statements for additional information.
Results of Operations—Services
Three and Nine Months Ended September 30, 2016 Compared to Three and Nine Months Ended September 30, 2015
The following table summarizes our Services segment’s results of operations for the three and nine months ended September 30, 2016 and 2015:
$ Change | $ Change | ||||||||||||||||||||||
Three Months Ended September 30, 2016 | Favorable (Unfavorable) | Nine Months Ended September 30, | Favorable (Unfavorable) | ||||||||||||||||||||
(In millions) | 2016 | 2015 | 2016 vs. 2015 | 2016 | 2015 | 2016 vs. 2015 | |||||||||||||||||
Adjusted pretax operating income (loss) (1) | $ | (2.5 | ) | $ | (0.3 | ) | $ | (2.2 | ) | $ | (18.4 | ) | $ | (0.4 | ) | $ | (18.0 | ) | |||||
Services revenue | 43.8 | 43.1 | 0.7 | 115.0 | 119.2 | (4.2 | ) | ||||||||||||||||
Direct cost of services | 26.9 | 25.9 | (1.0 | ) | 74.2 | 70.6 | (3.6 | ) | |||||||||||||||
Gross profit on services | 16.9 | 17.2 | (0.3 | ) | 40.8 | 48.6 | (7.8 | ) | |||||||||||||||
Other operating expenses | 15.0 | 13.1 | (1.9 | ) | 46.0 | 35.8 | (10.2 | ) | |||||||||||||||
______________________
(1) | Our senior management uses adjusted pretax operating income (loss) as our primary measure to evaluate the fundamental financial performance of each of the Company’s business segments. |
The Services segment is a fee-for-service business, with revenue derived from: (i) loan review and due diligence services; (ii) surveillance services, including RMBS surveillance, loan servicer oversight, loan-level servicing compliance reviews and operational reviews of mortgage servicers and originators; (iii) real estate valuation and component services that provide outsourcing and technology solutions for the SFR and residential real estate markets, as well as outsourced solutions for appraisal, title and closing services offered through Red Bell and ValuAmerica; (iv) REO management services; and (v) services for the United Kingdom and European mortgage markets through our EuroRisk operations.
Adjusted Pretax Operating Income (Loss). Our Services segment’s adjusted pretax operating loss was $2.5 million and $18.4 million for the three and nine months ended September 30, 2016, respectively, compared to adjusted pretax operating losses of $0.3 million and $0.4 million for the three and nine months ended September 30, 2015, respectively. The increase in our adjusted pretax operating loss in 2016 as compared to 2015 was primarily driven by increases in other operating expenses, combined with decreases in gross profit, as discussed further below.
Services Revenue. Revenue increased for the three months ended September 30, 2016 compared to the same period of 2015, primarily due to the acquisition of ValuAmerica in October 2015. Revenue decreased for the nine months ended September 30, 2016 as compared to the same period of 2015, primarily due to decreased activity in the securitization market. This decrease was partially offset by nine months of Red Bell and ValuAmerica operations in 2016, which were acquired in March 2015 and October 2015, respectively.
The top 10 customers of the Services segment generated approximately 54% and 50% of the services revenue for the three and nine months ended September 30, 2016, respectively, compared to 44% and 50% for the three and nine months ended September 30, 2015, respectively. The largest single customer generated approximately 9% of the services revenue for the nine months ended September 30, 2016 as compared to 11% for the nine months ended September 30, 2015.
71
Part I. Item 2. Management’s Discussion and Analysis of Financial Condition and Results of Operations
Real estate valuation and component services revenue for the three and nine months ended September 30, 2016 and 2015 includes revenue from SFR securitizations as well as revenue from financial institutions that extend loans to institutional investors to fund purchases of homes for the SFR market. Approximately 17% and 13%, respectively, of services revenue for the three and nine months ended September 30, 2016 related to the SFR market, including SFR securitizations, as compared to 18% and 20%, respectively, for the three and nine months ended September 30, 2015. The overall decreased activity related to the SFR market, compared to prior periods, has been driven by a decline in the pace of home purchases by institutional investors and a slowdown in SFR securitizations during 2015 and the first half of 2016, which negatively impacted our revenue in both years. We have recently experienced a modest increase in SFR securitization activity, and we expect this level of activity to continue through 2017.
The chart below provides the composition of services revenue on a quarterly basis. 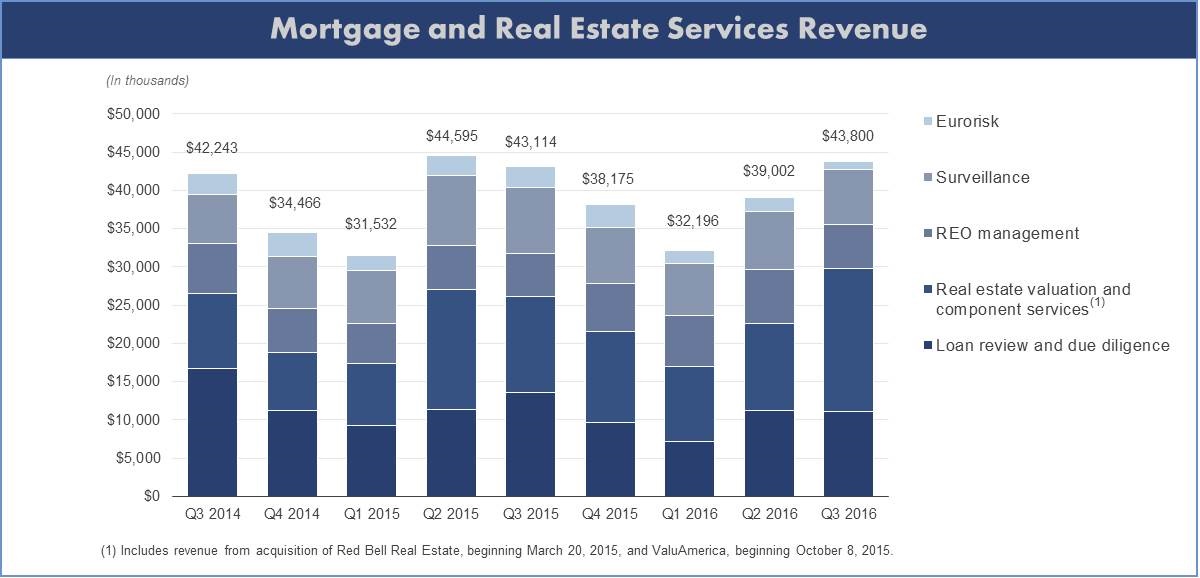
Direct Cost of Services. Direct cost of services primarily consists of employee compensation and related payroll benefits, and, to a lesser extent, other direct costs of providing services, such as travel and related expenses incurred in providing client services and costs paid to outside vendors. Direct cost of services is primarily affected by the level of services being provided and, therefore, is correlated to the level of services revenue.
Gross Profit on Services. Our gross profit on services represented 39% and 35% of our services revenues for the three and nine months ended September 30, 2016, respectively, compared to 40% and 41% for the three and nine months ended September 30, 2015, respectively. The reduction in our services gross profit percentage for the three and nine months ended September 30, 2016, as compared to the same periods of 2015, was primarily due to a decrease in revenue associated with SFR securitizations and non-agency securitizations (which generally have relatively higher gross profit margins), combined with a shift in the mix of services and higher than anticipated direct costs of services due to increased TRID documentation requirements.
72
Part I. Item 2. Management’s Discussion and Analysis of Financial Condition and Results of Operations
Other Operating Expenses. Other operating expenses primarily consist of compensation costs not classified as direct cost of services because they are related to employees, such as sales and corporate employees, who are not directly involved in providing client services. Compensation-related costs represent approximately 52% and 56% for the three and nine months ended September 30, 2016, respectively of the segment’s other operating expenses, compared to 58% for both the three and nine months ended September 30, 2015. Although compensation-related costs for the three months ended September 30, 2016 compared to the same period of 2015 decreased, primarily due to expense reduction initiatives undertaken throughout 2016, these decreases were offset by the increased expense for the three months and nine months ended September 30, 2016 from the acquisition of ValuAmerica in October 2015. In addition, the nine month period ended September 30, 2016 includes the impact of the expenses from Red Bell, acquired in March 2015, for the full period. Other operating expenses also include other selling, general and administrative expenses, depreciation, and allocations of corporate general and administrative expenses. Other operating expenses for the three and nine months ended September 30, 2016 include allocations of corporate operating expenses of $2.3 million and $6.8 million, respectively, compared to $1.6 million and $3.9 million for the three and nine months ended September 30, 2015, respectively.
Off-Balance Sheet Arrangements
There have been no material changes in off-balance sheet arrangements from those specified in our 2015 Form 10-K.
Contractual Obligations and Commitments
There have been no material changes outside of the ordinary course of business in our contractual obligations and commitments from those specified in our 2015 Form 10-K, except as follows:
• | During the first nine months of 2016, Radian Group entered into privately negotiated agreements to purchase, for cash or a combination of cash and shares of Radian Group common stock, aggregate principal amounts of $30.1 million and $322.0 million, respectively, of our outstanding Convertible Senior Notes due 2017 and 2019. Radian Group funded the purchases with $235.0 million in cash (plus accrued and unpaid interest due on the purchased notes) and by issuing to certain of the sellers 17.0 million shares of Radian Group common stock. Following the purchases described above, $22.2 million and $68.0 million, respectively, of the principal amounts of the Convertible Senior Notes due 2017 and 2019 remained outstanding as of September 30, 2016. |
• | In March 2016, Radian Group issued $350 million aggregate principal amount of Senior Notes due 2021 and received net proceeds of $343.4 million. |
• | On August 12, 2016, Radian Group redeemed the remaining $195.5 million aggregate principal amount of our Senior Notes due 2017 for the price established in accordance with the indenture governing the notes. Radian Group paid $211.3 million in cash (including accrued interest through the redemption date) to holders of the notes at redemption. |
See Note 11 of Notes to Unaudited Condensed Consolidated Financial Statements for further information.
Liquidity and Capital Resources
Radian Group—Short-Term Liquidity Needs
Radian Group serves as the holding company for our insurance and other subsidiaries and does not have any operations of its own. At September 30, 2016, Radian Group had immediately available, either directly or through an unregulated subsidiary, unrestricted cash and liquid investments of $483 million. This amount excludes certain additional cash and liquid investments that have been advanced from our subsidiaries for corporate expenses and interest payments, but includes $89 million that has been deposited with the IRS in connection with our dispute with the IRS related to the Deficiency Amount from the IRS’s examination of our 2000 through 2007 consolidated federal income tax returns. We have the ability to recall this deposit at any time.
73
Part I. Item 2. Management’s Discussion and Analysis of Financial Condition and Results of Operations
During the first nine months of 2016, we completed a series of transactions to strengthen our financial position. The combination of these actions had the impact of decreasing our diluted shares, improving Radian Group’s debt maturity profile and improving Radian Guaranty’s position under the PMIERs Financial Requirements. This series of capital management transactions is summarized as follows:
CAPITAL MANAGEMENT |
• Issued $350 million aggregate principal amount of Senior Notes due 2021 for net proceeds of $343.4 million; |
• Purchased aggregate principal amounts of $30.1 million and $322.0 million, respectively, of our outstanding Convertible Senior Notes due 2017 and 2019, for a combination of $235.0 million in cash and 17.0 million shares of Radian Group common stock; |
• Terminated the portion of the capped call transactions related to the purchased Convertible Senior Notes due 2017, and received consideration of 0.2 million shares of Radian Group common stock; |
• Completed the share repurchase program announced in January 2016, by purchasing an aggregate of 9.4 million shares of Radian Group common stock for $100.2 million, including commissions; |
• Entered into the Single Premium QSR Transaction, which had the effect of increasing the amount by which Radian Guaranty’s Available Assets exceed its Minimum Required Assets under the PMIERs Financial Requirements; and |
• Completed an early redemption of the remaining $195.5 million aggregate principal amount of our Senior Notes due 2017 for $211.3 million in cash (including accrued interest through the redemption date). |
The above purchases of Convertible Senior Notes due 2017 and 2019, combined with the early redemption of the Senior Notes due 2017 and the issuance of the Senior Notes due 2021, improved Radian Group’s debt maturity profile by increasing the time to maturity for our long-term debt. As described above, we completed the January 2016 share repurchase program and no further purchase authority is remaining under that program.
In June 2016, Radian Guaranty repaid in full the $325 million Surplus Note due to Radian Group that was issued in December 2015. On June 29, 2016, Radian Group’s board of directors authorized a new share repurchase program of up to $125 million of Radian Group common stock. As of November 3, 2016, the full purchase authority remained available under this share repurchase program, which expires on June 30, 2017. See Notes 7, 11, and 13 of Notes to Unaudited Condensed Consolidated Financial Statements for additional information on the individual transactions.
In addition to the potential use of up to $125 million to repurchase Radian Group common stock pursuant to the existing share repurchase program, Radian Group’s principal liquidity demands for the next 12 months are expected to include: (i) the payment of corporate expenses; (ii) interest payments on our outstanding long-term debt; and (iii) the payment of dividends on our common stock. These items occur in the ordinary course of our business and are expected to continue to result in liquidity demands in periods beyond the next twelve months.
Radian Group’s principal liquidity demands for the next 12 months could also include: (i) additional conversion settlements, repurchases or early redemptions of portions of our long-term debt; (ii) potential investments to support our strategy of growing our businesses; and (iii) potential payments to the U.S. Treasury resulting from our ongoing dispute with the IRS relating to the examination of our 2000 through 2007 consolidated federal income tax returns, as discussed below. These items could result in liquidity demands in the next twelve months or in future periods.
74
Part I. Item 2. Management’s Discussion and Analysis of Financial Condition and Results of Operations
Long-Term Debt. On a quarterly basis, we evaluate whether the conversion threshold requirements for our Convertible Senior Notes due 2017 and our Convertible Senior Notes due 2019 have been met. As of September 30, 2016, the holders of our Convertible Senior Notes due 2017 and of our Convertible Senior Notes due 2019 are not eligible to exercise their conversion rights during the three-month period ending December 31, 2016. In the event the conversion threshold requirements are met in the future and holders elect to exercise their conversion rights, we may elect, in our sole discretion, to settle any Convertible Senior Notes due 2019 in the form of cash, common shares or a combination thereof. In the case of the Convertible Senior Notes due 2017, the principal amount must be settled in cash, with the conversion premium to be settled in cash or common shares at our discretion. We cannot predict whether holders of our Convertible Senior Notes will choose to exercise their conversion rights prior to maturity. See Note 11 of Notes to Consolidated Financial Statements in our 2015 Form 10-K for further information about our Convertible Senior Notes due 2017 and 2019.
We may redeem at our option all or part of our Convertible Senior Notes due 2019, as long as the daily last reported sale price of our common stock is at least 130% of the then-current conversion price for at least 20 out of the immediately preceding 30 consecutive trading days before the delivery of a redemption notice. This threshold is equal to $13.78 per share and is subject to adjustments made pursuant to the terms of the indenture for the notes. The conversion rate initially is 94.3396 shares of our common stock per $1,000 principal amount of notes (corresponding to an initial conversion price of approximately $10.60 per share of common stock), subject to adjustment in certain events. See Note 11 of Notes to Consolidated Financial Statements in our 2015 Form 10-K for further information.
Corporate Expenses and Interest Expense. Radian Group has expense-sharing arrangements in place with its principal operating subsidiaries that require those subsidiaries to pay their allocated share of certain holding-company-level expenses, including interest payments on most of our outstanding long-term debt. Payments of such corporate expenses for the next 12 months, excluding interest payments on our long-term debt, are expected to be between $50 million and $55 million, a substantial portion of which are expected to be reimbursed by our subsidiaries under our existing expense-sharing arrangements. For the same period, payments of interest on our long-term debt are expected to be approximately $62 million, a significant portion of which is expected to be reimbursed by our subsidiaries under our existing expense-sharing arrangements. These expense-sharing arrangements, as amended, have been approved by applicable state insurance departments, but such approval may be modified or revoked at any time.
Capital Support for Subsidiaries. Private mortgage insurers, including Radian Guaranty, are required to comply with the PMIERs to remain eligible insurers of loans purchased by the GSEs. The PMIERs became effective on December 31, 2015. See Note 1 in Notes to Unaudited Condensed Consolidated Financial Statements for additional information.
Radian Guaranty currently is in compliance with the PMIERs, including the PMIERs Financial Requirements. At September 30, 2016, Radian Guaranty’s Available Assets under the PMIERs totaled approximately $4.1 billion, resulting in an excess or “cushion” of $249 million over its Minimum Required Assets of approximately $3.8 billion. Based on our current projections and the current requirements under the PMIERs, we expect to maintain Radian Guaranty’s Available Assets at a targeted range of approximately 5% to 8% above its Minimum Required Assets. While the amount of this cushion could fluctuate on a quarterly basis, we expect it to increase over time based, in part, on our expectations regarding the future financial performance of Radian Guaranty, including our projected NIW and expected decrease in defaults. Based on our projections, Radian Guaranty is not expected to require any additional capital contributions in order to remain in compliance with the current PMIERs Financial Requirements, including to the extent they are modified consistent with our understanding of the potential interim guidance that is further discussed in Note 1 of Notes to Unaudited Condensed Consolidated Financial Statements.
Radian Guaranty’s Risk-to-capital was 13.7 to 1 as of September 30, 2016. See Note 16 of Notes to Unaudited Condensed Consolidated Financial Statements for more information. Our combined Risk-to-capital, which represents the consolidated Risk-to-capital measure for all of our Mortgage Insurance subsidiaries (including affiliated reinsurers), was 13.9 to 1 as of September 30, 2016.
In the first quarter of 2016, in order to proactively manage the risk and return profile of Radian Guaranty’s insured portfolio and continue managing its position under the PMIERs Financial Requirements in a cost-effective manner, Radian Guaranty entered into the Single Premium QSR Transaction with a panel of third-party reinsurers. The Single Premium QSR Transaction had the effect of increasing the amount of Radian Guaranty’s cushion under the PMIERs Financial Requirements.
75
Part I. Item 2. Management’s Discussion and Analysis of Financial Condition and Results of Operations
The amount of credit that we receive under the PMIERs Financial Requirements for our third-party reinsurance transactions, including our QSR Transactions and our Single Premium QSR Transaction, is established by the GSEs at the time of each transaction based on terms generally prescribed in the PMIERs Financial Requirements as well as the GSEs’ view of the specific transaction. This credit is subject to periodic review by the GSEs. In addition, it is our understanding that the GSEs currently are considering interim guidance for the industry that would negatively impact the amount of credit that we receive for our Single Premium QSR Transaction but also would give credit to certain liquid investments that are readily available to pay claims that previously were not permitted to be included in our Available Assets. See Note 1 of Notes to Unaudited Condensed Consolidated Financial Statements for more information.
Although we do not believe it is likely in light of the PMIERs Financial Requirements, Radian Group could also be required to provide additional capital support for Radian Guaranty and our other mortgage insurance subsidiaries if additional capital is required pursuant to future changes to insurance laws and regulations or reinterpretations of existing requirements. The NAIC is in the process of reviewing the minimum capital and surplus requirements for mortgage insurers and considering changes to the Model Act. In May 2016, a working group of state regulators released an exposure draft of a risk-based capital framework to establish capital requirements for mortgage insurers. While the timing and outcome of this process is not known, in the event the NAIC adopts changes to the Model Act, we expect that the capital requirements in states that adopt the new Model Act may increase as a result of the changes. However, we continue to believe the changes to the Model Act will not result in financial requirements that require greater capital than the level currently required under the PMIERs Financial Requirements.
See also “Radian Group—Long-Term Liquidity Needs—Services.”
Dividends. Our quarterly common stock dividend is currently $0.0025 per share and, based on our current outstanding shares of common stock, we would require approximately $2.1 million in the aggregate to pay our quarterly dividends for the next 12 months. Radian Group is not subject to any limitations on its ability to pay dividends except those generally applicable to corporations that are incorporated in Delaware. Delaware corporation law provides that dividends are only payable out of a corporation’s capital surplus or (subject to certain limitations) recent net profits. As of September 30, 2016, our capital surplus was $2.9 billion, representing our dividend limitation under Delaware law.
IRS Matter. In addition to the items discussed above, in the event a final judgment or compromised settlement agreement is reached in Radian Group’s ongoing dispute with the IRS related to the Deficiency Amount from the examination of our 2000 through 2007 consolidated federal income tax returns, Radian Group may be required to make a payment to the U.S. Treasury. On December 3, 2014, we petitioned the U.S. Tax Court to litigate the Deficiency Amount. On September 1, 2015, we received a notice that the case had been scheduled for trial. However, the parties jointly filed, and the U.S. Tax Court approved, motions for continuance in this matter to postpone the trial date. The litigation could take several years to resolve and may result in substantial legal expenses. We can provide no assurance regarding the outcome of any such litigation or whether a compromised settlement with the IRS will ultimately be reached. As such, there remains significant uncertainty with regard to the amount and timing of any potential payments. See Note 9 of Notes to Unaudited Condensed Consolidated Financial Statements for additional information regarding the IRS matter.
Sources of Liquidity. In June 2016, Radian Guaranty repaid in full the $325 million Surplus Note due to Radian Group, which increased our holding company liquidity at June 30, 2016 by $325 million. We have since used a portion of this holding company liquidity as working capital in our operations and in connection with our capital management transactions.
In addition to existing available cash and marketable securities, Radian Group’s principal sources of cash to fund future short-term liquidity needs include: (i) payments made to Radian Group under expense-sharing arrangements with our subsidiaries, as discussed above; (ii) payments made to Radian Group under tax-sharing arrangements, as discussed below; and (iii) to the extent available, potential dividends from our Services segment, if any, in excess of payments due under tax-and expense-sharing arrangements. See also “Radian Group—Long-Term Liquidity Needs—Services.”
Under the provisions of its tax-sharing agreement with its subsidiaries, Radian Group may receive cash, in excess of its tax payment obligations to the U.S. Treasury. These excess tax payments would be a result of certain of our operating subsidiaries that may utilize their share of NOL carryforwards on a separate entity basis before our consolidated NOLs are fully utilized, and therefore those operating subsidiaries would be obligated to pay Radian Group under our tax-sharing agreement, before Radian Group becomes a consolidated taxpayer.
If Radian Group’s current sources of liquidity are insufficient for Radian Group to fund its obligations during the next 12 months, or if we otherwise decide to increase our liquidity position, Radian Group may seek additional capital by incurring additional debt, by issuing additional equity, or by selling assets, which we may not be able to do on favorable terms, if at all.
76
Part I. Item 2. Management’s Discussion and Analysis of Financial Condition and Results of Operations
We regularly evaluate opportunities, based on market conditions, to finance our operations by accessing the capital markets or other types of indebtedness with institutional and other lenders, and consider various measures to improve our capital and liquidity positions, as well as to strengthen our balance sheet and improve Radian Group’s debt maturity profile. In the past, we have repurchased and exchanged, prior to maturity, some of our outstanding debt, and in the future, we may, from time to time, seek to redeem, repurchase or exchange for other securities, some or all of our outstanding debt, prior to maturity, in the open market, through other public or private transactions, including pursuant to one or more tender offers, or through any combination of the foregoing, as circumstances may allow. The timing or amount of any potential transactions will depend on a number of factors, including market opportunities and our views regarding our capital and liquidity positions and potential future needs. There can be no assurance that any such transactions will be completed on favorable terms, or at all.
Radian Group—Long-Term Liquidity Needs
In addition to the items identified above with respect to our short-term liquidity needs, our most significant needs for liquidity beyond the next 12 months are expected to include:
(1) | the repayment of our outstanding long-term debt, consisting of: |
• | $22.2 million principal amount of convertible debt due in November 2017, which must be settled in cash, plus any related conversion premium which may, at our option, be settled in cash, common shares or a combination thereof; |
• | $68.0 million principal amount of convertible debt due in March 2019 for which the principal amount, if converted, and any conversion premium may, at our option, be settled in cash, common shares or a combination thereof; |
• | $300 million principal amount of outstanding debt due in June 2019; |
• | $350 million principal amount of outstanding debt due in June 2020; |
• | $350 million principal amount of outstanding debt due in March 2021; and |
(2) | potential additional capital contributions to our subsidiaries. |
As of September 30, 2016, certain of our subsidiaries have incurred NOLs that could not be carried-back and utilized on a separate company tax return basis. As a result, we are not currently obligated under our tax-sharing agreement to reimburse these subsidiaries for their separate company NOL carryforward. However, if in a future period our consolidated NOL is fully utilized before a subsidiary has utilized its share of NOL carryforward on a separate entity basis, then Radian Group may be obligated to fund such subsidiary’s share of our consolidated tax liability to the IRS. Our Clayton subsidiary currently has NOLs on a separate entity basis that have not yet been utilized. See also “Radian Group—Short-Term Liquidity Needs—Sources of Liquidity.”
We expect to meet the long-term liquidity needs of Radian Group with a combination of: (i) available cash and marketable securities; (ii) private or public issuances of debt or equity securities, which we may not be able to do on favorable terms, if at all; (iii) cash received under tax- and expense-sharing arrangements with our subsidiaries; and (iv) to the extent available, dividends from our subsidiaries.
Under Pennsylvania’s insurance laws, ordinary dividends and other distributions may only be paid out of an insurer’s positive unassigned surplus, measured as of the end of the prior fiscal year. Radian Guaranty had negative unassigned surplus at December 31, 2015 of $679.9 million, and therefore, no ordinary dividends can be paid from Radian Guaranty in 2016. Due in part to the need to set aside contingency reserves, we do not expect that Radian Guaranty will have positive unassigned surplus, and therefore will not have the ability to pay ordinary dividends, for the foreseeable future. Under Pennsylvania’s insurance laws, an insurer may request an extraordinary dividend, but payment is subject to the approval of the Pennsylvania Insurance Commissioner.
Mortgage Insurance
As of September 30, 2016, our Mortgage Insurance segment maintained claims paying resources of $4.1 billion on a statutory basis, which consist of contingency reserves, policyholders’ surplus, unearned premium reserves (premiums received but not yet earned) and loss reserves.
77
Part I. Item 2. Management’s Discussion and Analysis of Financial Condition and Results of Operations
The principal demands for liquidity in our mortgage insurance business include the payment of claims and potential claim settlement transactions, operating expenses (including those allocated from Radian Group) and taxes. The principal sources of liquidity in our mortgage insurance business currently include insurance premiums, net investment income, cash flows from investment sales and maturities and, potentially, capital contributions from Radian Group. We believe that the operating cash flows generated by each of our mortgage insurance subsidiaries will provide these subsidiaries with a substantial portion of the funds necessary to satisfy their claim payments, operating expenses and taxes for the foreseeable future.
In August 2016, Radian Guaranty and Radian Reinsurance became members of the Federal Home Loan Bank of Pittsburgh (“FHLB”) and, as members, may borrow from the FHLB. Borrowings from the FHLB may be used to provide low-cost, supplemental liquidity. As of September 30, 2016, there were no FHLB borrowings outstanding.
Private mortgage insurers, including Radian Guaranty, are required to comply with the PMIERs to remain eligible insurers of loans purchased by the GSEs. See “Radian Group—Short-Term Liquidity Needs” and Note 1 of Notes to Unaudited Condensed Consolidated Financial Statements for additional information. Radian Guaranty currently is in compliance with the PMIERs, including the PMIERs Financial Requirements.
Freddie Mac Agreement. At September 30, 2016 and December 31, 2015, Radian Guaranty had $75.8 million and $74.7 million, respectively, in a collateral account pursuant to the Freddie Mac Agreement. This collateral account, which contains investments primarily invested in and classified as part of our trading securities, is pledged to cover Loss Mitigation Activity on the loans subject to the Freddie Mac Agreement. Subject to certain conditions in the Freddie Mac Agreement, amounts in the collateral account may be released to Radian Guaranty over time to the extent that Loss Mitigation Activity becomes final in accordance with the terms of that agreement. In accordance with these provisions, Radian Guaranty withdrew $11.7 million from this account in October 2016 related to Loss Mitigation Activity that had become final as of August 31, 2016. Following this withdrawal, if, as of August 29, 2017, the amount of additional Loss Mitigation Activity that has become final in accordance with the Freddie Mac Agreement is less than $64 million, then any shortfall will be paid to Freddie Mac from the funds remaining in the collateral account, subject to certain adjustments designed to allow for any Loss Mitigation Activity that has not become final or any claims evaluation that has not been completed as of that date. As of September 30, 2016, we have $57 million, recorded in reserve for losses, that we expect to be paid to Freddie Mac from the funds expected to be remaining in the collateral account as of the August 29, 2017 measurement date.
Services
The principal demands for liquidity in our Services segment include the payment of employee compensation and other operating expenses (including those allocated from Radian Group), interest payments related to the Senior Notes due 2019, and dividends to Radian Group. The principal sources of liquidity in our Services segment are cash generated by operations and, to the extent necessary, capital contributions from Radian Group.
Liquidity levels fluctuate depending on the levels and contractual timing of our invoicing and the payment practices of the Services clients, in combination with the timing of Services’ payments for employee compensation and to external vendors. The amount, if any, and timing of the Services segment’s future dividend paying capacity also will depend primarily on the amount and availability of excess cash flow generated by the segment.
The Services segment has not generated sufficient cash flows to pay any dividends to Radian Group in 2016. Additionally, while cash flow is expected to be sufficient to pay the Services segment’s direct operating expenses, it has not been sufficient to reimburse Radian Group for $29.1 million of its allocated operating expense and interest expense. We expect the Services segment will be able to bring its reimbursement obligations current in the next three to five years. In the event the cash flow from operations of the Services segment is not adequate to fund all of its needs, Radian Group may provide additional funds to the Services segment in the form of a capital contribution or an intercompany note.
78
Part I. Item 2. Management’s Discussion and Analysis of Financial Condition and Results of Operations
Cash Flows
The following table summarizes our consolidated cash flows from operating, investing and financing activities:
(In thousands) | Nine Months Ended September 30, | ||||||
2016 | 2015 | ||||||
Net cash provided by (used in): | |||||||
Operating activities | $ | 290,137 | $ | (7,752 | ) | ||
Investing activities | (87,055 | ) | 19,451 | ||||
Financing activities | (203,242 | ) | 26,487 | ||||
Effect of exchange rate changes on cash | (382 | ) | (42 | ) | |||
Increase (decrease) in cash | $ | (542 | ) | $ | 38,144 | ||
Net cash provided by operating activities totaled $290.1 million for the nine months ended September 30, 2016, compared to net cash used in operating activities of $7.8 million in the same period of 2015. This improvement in net cash provided by operating activities was principally the result of a reduction in total claims paid in the nine months ended September 30, 2016 compared to the same period of 2015. Claims paid in 2015 were elevated from February 2015 through December 2015, primarily due to the implementation of the BofA Settlement Agreement.
Net cash was used in investing activities during the nine months ended September 30, 2016, primarily as a result of the investment of net cash provided by operating activities, which was substantially invested in fixed-maturity investments available for sale. Net sales and redemptions of short-term investments were also made to fund financing activities, as discussed below. During the nine months ended September 30, 2015, net cash was provided by investing activities, primarily due to the proceeds received from the sale of Radian Asset Assurance and redemptions of trading securities, partially offset by purchases, net of proceeds from sales and redemptions, of fixed-maturity investments available for sale.
Net cash used in financing activities increased for the nine months ended September 30, 2016, compared to net cash provided by financing activities for the same period of 2015, primarily due to: (i) purchases of aggregate principal amounts of $30.1 million and $322.0 million, respectively, of our outstanding Convertible Senior Notes due 2017 and 2019, which were partially settled in cash in the amount of $235.0 million; and (ii) the redemption of the remaining $195.5 million aggregate principal amount of our Senior Notes due 2017, which we settled in cash in the amount of $211.3 million. The cash flow impact of these 2016 purchases and redemptions collectively exceeded the purchases and redemption of long-term debt for the same period of 2015 and was partially offset by a reduction in purchases of our common shares.
See “Item 1. Condensed Consolidated Statements of Cash Flows (Unaudited)” for additional information.
Stockholders’ Equity
Stockholders’ equity was $2.9 billion at September 30, 2016, compared to $2.5 billion at December 31, 2015. The increase in stockholders’ equity resulted primarily from: (i) our net income of $247.2 million for the nine months ended September 30, 2016; (ii) the impact of our recently completed debt and equity transactions to strengthen Radian’s capital position, which increased stockholder’s equity by $42.9 million, after excluding the $59.8 million after-tax impact from the loss on induced conversion and debt extinguishment already reflected in our net income; and (iii) net unrealized gains on investment of $84.3 million. See “—2016 Developments—Capital Management” for additional information.
79
Part I. Item 2. Management’s Discussion and Analysis of Financial Condition and Results of Operations
Ratings
Radian Group and Radian Guaranty have been assigned the ratings set forth in the chart below. We believe that ratings often are considered by others in assessing our credit strength and the financial strength of our primary mortgage insurance subsidiary.
Moody’s (1) | S&P (2) | ||
Radian Group | Ba3 | BB | |
Radian Guaranty | Baa3 | BBB | |
______________________
(1) | Moody’s outlook for Radian Group and Radian Guaranty is currently Stable. |
(2) | S&P’s outlook for Radian Group and Radian Guaranty is currently Stable. |
Critical Accounting Policies
As of the filing date of this report, there were no significant changes in our critical accounting policies from those discussed in our 2015 Form 10-K. See Note 1 of Notes to Unaudited Condensed Consolidated Financial Statements for accounting pronouncements issued but not yet adopted that may impact the Company’s consolidated financial position, earnings, cash flows or disclosures.
80
Item 3. Quantitative and Qualitative Disclosures About Market Risk.
Market risk represents the potential for loss due to adverse changes in the value of financial instruments as a result of changes in market conditions. Examples of market risk include changes in interest rates, credit spreads, foreign currency exchange rates, and equity prices. We perform sensitivity analyses to determine the effects of market risk exposures on our investment securities by determining the potential loss in future earnings, fair values or cash flows of market-risk-sensitive instruments resulting from one or more selected hypothetical changes in interest rates, credit spreads, foreign currency exchange rates and equity prices.
Interest-Rate Risk and Credit-Spread Risk
The primary market risk in our investment portfolio is interest-rate risk, namely the fair value sensitivity of our fixed-income securities to changes in interest rates. An additional market risk in our investment portfolio is credit-spread risk, which is the sensitivity of the fair value of our fixed-income securities to changes in credit spreads. We regularly analyze our exposure to interest-rate risk and credit-spread risk and have determined that the fair value of our investments is materially exposed to changes in both interest rates and credit spreads.
Our sensitivity analysis for interest rates is based on the change in fair value of our fixed-income securities, assuming a hypothetical instantaneous and parallel 100-basis point increase or decrease in the yield curve, with all other factors remaining constant. We calculate the duration of our fixed-income securities, expressed in years, in order to estimate the interest-rate sensitivity of these securities, as shown in the table below. To assist us in setting duration targets for the investment portfolio, we analyze: (i) the interest-rate sensitivities of our liabilities; (ii) entity specific cash flows; and (iii) our current risk appetite.
Credit spread represents the additional yield on a fixed-income security, above the risk-free rate, that is paid by an issuer to compensate investors for assuming credit and liquidity risk. We manage credit-spread risk on an enterprise level, across issuer, sector and asset class. Our sensitivity analysis for credit-spread risk is based on the change in fair value of our fixed-income securities, assuming a hypothetical 100-basis point increase or decrease in all credit spreads, with the exception of U.S. Treasury and agency obligations, and assuming all other factors remain constant. Actual shifts in credit spreads generally vary by issuer and security, based on factors such as credit quality, duration and sector. Within a given asset class, investment grade securities generally exhibit less credit-spread volatility than securities with lower credit ratings. Our investment securities portfolio primarily consists of investment grade securities.
81
The following table illustrates the sensitivity of our investment portfolio to both interest-rate risk and credit-spread risk.
Short-term and Available for Sale | Trading | ||||||||||||||
($ in millions) | September 30, 2016 | December 31, 2015 | September 30, 2016 | December 31, 2015 | |||||||||||
Carrying value of fixed-income investment portfolio (1) | $ | 3,594 | $ | 2,943 | $ | 970 | $ | 1,279 | |||||||
Percentage of fixed-income securities compared to total investment portfolio | 78.7 | % | 68.5 | % | 21.2 | % | 29.8 | % | |||||||
Average duration of fixed-income portfolio | 4.7 years | 3.9 years | 6.0 years | 5.4 years | |||||||||||
Interest-rate risk increase/(decrease) in market value | |||||||||||||||
+100 basis points - $ | $ | (161.2 | ) | $ | (113.1 | ) | $ | (55.3 | ) | $ | (65.9 | ) | |||
+100 basis points - % (2) | (4.5 | )% | (3.8 | )% | (5.7 | )% | (5.2 | )% | |||||||
- 100 basis points - $ | $ | 174.4 | $ | 120.9 | $ | 61.8 | $ | 73.2 | |||||||
- 100 basis points - % (2) | 4.9 | % | 4.1 | % | 6.4 | % | 5.7 | % | |||||||
Credit-spread risk increase/(decrease) in market value | |||||||||||||||
+100 basis points - $ | $ | (157.7 | ) | $ | (108.2 | ) | $ | (57.5 | ) | $ | (63.0 | ) | |||
+100 basis points - % (2) | (4.4 | )% | (3.7 | )% | (5.9 | )% | (4.9 | )% | |||||||
- 100 basis points - $ | $ | 149.2 | $ | 106.7 | $ | 54.5 | $ | 61.8 | |||||||
- 100 basis points - % (2) | 4.2 | % | 3.6 | % | 5.6 | % | 4.8 | % | |||||||
_______________________
(1) | Total fixed-income securities include fixed-maturity investments available for sale, trading securities and short-term investments. |
(2) | Change in value expressed as a percentage of the market value of the related fixed-income portfolio. |
The change in the average duration of our total fixed-income portfolio, from 4.3 years at December 31, 2015 to 5.0 years at September 30, 2016, was primarily due to an increase in the percentage of corporate bonds and notes as well as a decrease in the percentage of short-term securities in the portfolio.
Foreign Exchange Rate Risk
As of September 30, 2016 and December 31, 2015, we did not hold any foreign currency denominated securities in our investment portfolio. Exchange gains and losses on foreign currency transactions from our foreign operations have not been material due to the limited amount of business performed in those locations. Currency risk is further limited because, in general, both the revenues and expenses of our foreign operations are denominated in their respective functional currencies, based on the countries in which the operations occur.
Equity Market Price
At September 30, 2016, both the market value and cost of the equity securities in our investment portfolio were $1.3 million. Although none of these securities were classified as trading securities, due to our limited basis in these investments, the exposure to changes in equity market prices is not significant.
82
Item 4. Controls and Procedures.
Evaluation of Disclosure Controls and Procedures
We maintain disclosure controls and procedures designed to provide reasonable assurance that information required to be disclosed in the reports we file or submit under the Exchange Act is recorded, processed, summarized and reported within the time periods specified in the SEC’s rules and forms and that such information is accumulated and communicated to our management, including our Chief Executive Officer and Chief Financial Officer, as appropriate, to allow timely decisions regarding required disclosure.
Our management, including our Chief Executive Officer and Chief Financial Officer, conducted an evaluation of the effectiveness of our disclosure controls and procedures (as defined in Rule 13a-15(e) of the Exchange Act) as of September 30, 2016, pursuant to Rule 15d-15(e) under the Exchange Act. Based upon that evaluation, our Chief Executive Officer and Chief Financial Officer concluded that, as of September 30, 2016, our disclosure controls and procedures were effective to provide reasonable assurance that the information required to be disclosed by us in the reports we file or submit under the Exchange Act is recorded, processed, summarized and reported within the time periods specified in the SEC’s rules and forms.
Changes in Internal Control Over Financial Reporting
During the three-month period ended September 30, 2016, there has been no change in our internal control over financial reporting (as defined in Rule 13a-15(f) of the Exchange Act) that has materially affected, or is reasonably likely to materially affect, our internal control over financial reporting.
83
PART II—OTHER INFORMATION
Item 1. Legal Proceedings.
We are routinely involved in a number of legal actions, reviews and audits, as well as inquiries and investigations by various regulatory entities involving compliance with laws or other regulations, the outcome of which are uncertain. These legal and regulatory matters could result in adverse judgments, settlements, fines, injunctions, restitutions or other relief that could require significant expenditures or have other effects on our business. Except as set forth below, there have been no material developments in the legal proceedings disclosed in our 2015 Form 10-K, in Part I, Item 3, “Legal Proceedings” and no additional reportable legal proceedings for the nine months ended September 30, 2016.
We are contesting adjustments resulting from the examination by the IRS of our 2000 through 2007 consolidated federal income tax returns. The IRS opposes the recognition of certain tax losses and deductions that were generated through our investment in a portfolio of non-economic REMIC residual interests and has proposed denying the associated tax benefits of these items. We appealed these proposed adjustments to Appeals and made “qualified deposits” with the U.S. Treasury of $85 million in June 2008 relating to the 2000 through 2004 tax years and $4 million in May 2010 relating to the 2005 through 2007 tax years, in order to avoid the accrual of incremental above-market-rate interest with respect to the proposed adjustments.
We attempted to reach a compromised settlement with Appeals, but in September 2014 we received Notices of Deficiency covering the 2000 through 2007 tax years that assert unpaid taxes and penalties of approximately $157 million. The Deficiency Amount has not been reduced to reflect our NOL carryback ability. As of September 30, 2016, there also would be interest of approximately $133 million related to these matters. Depending on the outcome, additional state income taxes, penalties and interest (estimated in the aggregate to be approximately $34 million as of September 30, 2016) also may become due when a final resolution is reached. The Notices of Deficiency also reflected additional amounts due of approximately $105 million, which are primarily associated with the disallowance of the previously filed carryback of our 2008 NOL to the 2006 and 2007 tax years. We currently believe that the disallowance of our 2008 NOL carryback is a precautionary position by the IRS and that we will ultimately maintain the benefit of this NOL carryback claim. On December 3, 2014, we petitioned the U.S. Tax Court to litigate the Deficiency Amount. On September 1, 2015, we received a notice that the case had been scheduled for trial. However, the parties have jointly filed, and the U.S. Tax Court has approved, motions for continuance in this matter to postpone the trial date. Also, in February 2016, the U.S. Tax Court approved a joint motion to consolidate for trial, briefing and opinion our case with a similar case involving MGIC Investment Corporation. The litigation could take several years to resolve and may result in substantial legal expenses. We can provide no assurance regarding the outcome of any such litigation or whether a compromised settlement with the IRS will ultimately be reached. We believe that an adequate provision for income taxes has been made for the potential liabilities that may result from this matter. However, if the ultimate resolution of this matter produces a result that differs materially from our current expectations, there could be a material impact on our effective tax rate, results of operations and cash flows.
We are involved in litigation that has arisen in the normal course of our business. We are contesting the allegations in each such pending action and management believes, based on current knowledge and after consultation with counsel, that the outcome of such actions will not have a material adverse effect on our consolidated financial condition. However, the outcome of litigation and other legal and regulatory matters is inherently uncertain, and it is possible that one or more of the matters currently pending or threatened could have an unanticipated adverse effect on our liquidity, financial condition or results of operations for any particular period.
Item 1A. Risk Factors.
There have been no material changes to our risk factors from those previously disclosed in our 2015 Form 10-K.
84
Item 2. Unregistered Sales of Equity Securities and Use of Proceeds.
Issuance of Unregistered Securities
On March 21, 2016, March 22, 2016 and March 24, 2016, we issued 11,914,620; 4,673,478; and 393,690 shares, respectively, of Radian Group common stock in separately negotiated transactions with certain holders of the Convertible Senior Notes due 2017 and 2019. These issuances were made in connection with, and as partial consideration for, the purchases in March 2016 of aggregate principal amounts of $30.1 million and $288.4 million of our Convertible Senior Notes due 2017 and 2019, respectively, for cash or a combination of cash and shares of Radian Group common stock. See Notes 11 and 13 of Notes to Unaudited Condensed Consolidated Financial Statements for additional information on the individual transactions.
The shares issued pursuant to these transactions were issued to “qualified institutional buyers” within the meaning of Rule 144A promulgated under the Securities Act and were offered and sold in reliance on the exemption from registration afforded by Section 4(a)(2) of the Securities Act and corresponding provisions of state securities laws.
Issuer Purchases of Equity Securities
There were no issuer purchases of equity securities during the three months ended September 30, 2016. On June 29, 2016, Radian Group’s board of directors authorized a new share repurchase program of up to $125 million of Radian Group common stock. The authorization provides Radian the flexibility to repurchase shares in the open market or in privately negotiated transactions from time to time, based on market and business conditions, stock price and other factors. As of September 30, 2016, the full purchase authority of up to $125 million remained available under this program, which expires on June 30, 2017. See Note 13 of Notes to Unaudited Condensed Consolidated Financial Statements.
Item 6. Exhibits.
The information required by this item is set forth on the Exhibit Index that follows the signature page of this report.
85
SIGNATURES
Pursuant to the requirements of the Securities Exchange Act of 1934, the registrant has duly caused this report to be signed on its behalf by the undersigned thereunto duly authorized.
Radian Group Inc. | |
November 4, 2016 | /s/ J. FRANKLIN HALL |
J. Franklin Hall | |
Executive Vice President, Chief Financial Officer | |
/s/ CATHERINE M. JACKSON | |
Catherine M. Jackson | |
Senior Vice President, Controller | |
86
EXHIBIT INDEX
Exhibit No. | Exhibit Name | |
*+10.1 | Form of Executive Severance Agreement (including for Jeffrey Tennyson) | |
*+10.2 | Form of Restrictive Covenant Agreement (including for Jeffrey Tennyson) | |
*12 | Statement of Ratio of Earnings to Fixed Charges | |
*31 | Rule 13a - 14(a) Certifications | |
**32 | Section 1350 Certifications | |
*101 | Pursuant to Rule 405 of Regulation S-T, the following financial information from Radian Group Inc.’s Quarterly Report on Form 10-Q for the quarter ended September 30, 2016 is formatted in XBRL (eXtensible Business Reporting Language): (i) Condensed Consolidated Balance Sheets as of September 30, 2016 and December 31, 2015; (ii) Condensed Consolidated Statements of Operations for the three and nine months ended September 30, 2016 and 2015; (iii) Condensed Consolidated Statements of Comprehensive Income (Loss) for the three and nine months ended September 30, 2016 and 2015; (iv) Condensed Consolidated Statements of Changes in Common Stockholders’ Equity for the nine months ended September 30, 2016, and 2015; (v) Condensed Consolidated Statements of Cash Flows for the nine months ended September 30, 2016, and 2015; and (vi) the Notes to Unaudited Condensed Consolidated Financial Statements. | |
_______________________
* Filed herewith.
** Furnished herewith.
+ Management contract, compensatory plan or arrangement.
87