Attached files
| file | filename |
|---|---|
| 8-K - FORM 8-K - RR Donnelley & Sons Co | d224660d8k.htm |
| Exhibit 99.1
|

Fourth Quarter 2016
|
|
Use of Forward Looking Statements
This presentation contains “forward-looking statements” as defined in the U.S. Private Securities Litigation Reform Act of 1995. Readers are cautioned not to place undue reliance on these forward-looking statements and any such forward-looking statements are qualified in their entirety by reference to the following cautionary statements. All forward-looking statements speak only as of the date of this presentation and are based on current expectations and involve a number of assumptions, risks and uncertainties that could cause the actual results to differ materially from such forward-looking statements, including risks associated with completion and execution of the spinoffs of LSC Communications, Inc. (“LSC”) and Donnelley Financial Solutions, Inc. (“Donnelley Financial”) and the ability of RR Donnelley, LSC and Donnelley Financial to perform as expected as separate, independent entities and risks associated with the volatility and disruption of the capital and credit markets, and adverse changes in the global economy. The company does not undertake to and specifically declines any obligation to publicly release the results of any revisions to these forward-looking statements that may be made to reflect future events or circumstances after the date of such statement or to reflect the occurrence of anticipated or unanticipated events.
The factors that could cause material differences in the expected results of RR Donnelley include, without limitation, the following: the spinoffs not achieving the intended results; the volatility of the price of the Company’s common stock following completion of the spinoff; not realizing the full benefits from the retained ownership interests in LSC Communications and Donnelley Financial Solutions; increased costs resulting from a decrease in purchase power as a result of the spinoffs; inability to hire and retain employees; the spinoffs resulting in significant tax liability; adverse changes in global economic conditions and the resulting effect on the businesses of our customers; loss of brand reputation and decreases in quality of customer support and service offerings; adverse credit market conditions and other issues that may affect the Company’s ability to obtain future financing on favorable terms; the Company’s ability to make payments on, reduce or extinguish any of its material indebtedness; changes in the availability or costs of key materials (such as ink, paper and fuel), increases in shipping costs or changes in prices received for the sale of by-products; the ability of the Company to improve operating efficiency rapidly enough to meet market conditions; successful negotiation, execution and integration of acquisitions; competitive pressures in all markets in which the Company operates; increasing health care and benefits costs for employees and retirees; changes in the Company’s pension and other post-retirement obligations; catastrophic events which may damage the Company’s facilities or otherwise disrupt the business; pricing pressure as a result of the competitive environment in which the Company operates; changes in technology, including electronic substitution and migration of paper based documents to digital data formats, and the ability of the Company to adapt to these changes; the effect of changes in laws and regulations, including changes in accounting standards, trade, tax, environmental compliance (including the emission of greenhouse gases and other air pollution controls), health and welfare benefits (including the Patient Protection and Affordable Care Act, as modified by the Health Care and Education Reconciliation Act, and further healthcare reform initiatives), price controls and other regulatory matters and the cost, which could be substantial, of complying with these laws and regulations; changes in the regulations applicable to the Company’s customers, which may adversely impact demand for the Company’s products and services; factors that affect customer demand, including changes in postal rates, postal regulations and service levels, changes in the capital markets, changes in advertising markets, customers’ budgetary constraints and changes in customers’ short-range and long-range plans; failures or errors in the Company’s products and services; the ability by the Company and/or its vendors to implement and maintain information technology and security measures sufficient to protect against breaches and data leakage; the effect of inflation, changes in currency exchange rates and changes in interest rates; the failure to properly use and protect customer, Company and employee information and data; and other risks and uncertainties detailed from time to time in the Company’s filings with the SEC.
Non-GAAP Financial Information
The company believes that certain non-GAAP measures, when presented in conjunction with comparable GAAP measures, are useful because that information is an appropriate measure for evaluating the company’s operating performance. Internally, the company uses this non-GAAP information as an indicator of business performance, and evaluates management’s effectiveness with specific reference to these indicators. These measures should be considered in addition to, not a substitute for, or superior to, measures of financial performance prepared in accordance with GAAP.
A reconciliation of GAAP Net Earnings to non-GAAP Adj. EBITDA and other metrics are presented in the appendix included in this presentation and in tables attached to our periodic reports on Form 8-K, furnished to the Securities and Exchange Commission on Sep 26, 2016 and Nov 2, 2016, both of which are also available in the investors section of our website, www.rrdonnelley.com.
Safe Harbor & Non-GAAP 1
|
|
Company Representatives
Dan Knotts
President & CEO
RR Donnelley
Brian Feeney
SVP FP&A and Investor Relations RR Donnelley Terry Peterson EVP, CFO RR Donnelley 2
|
|
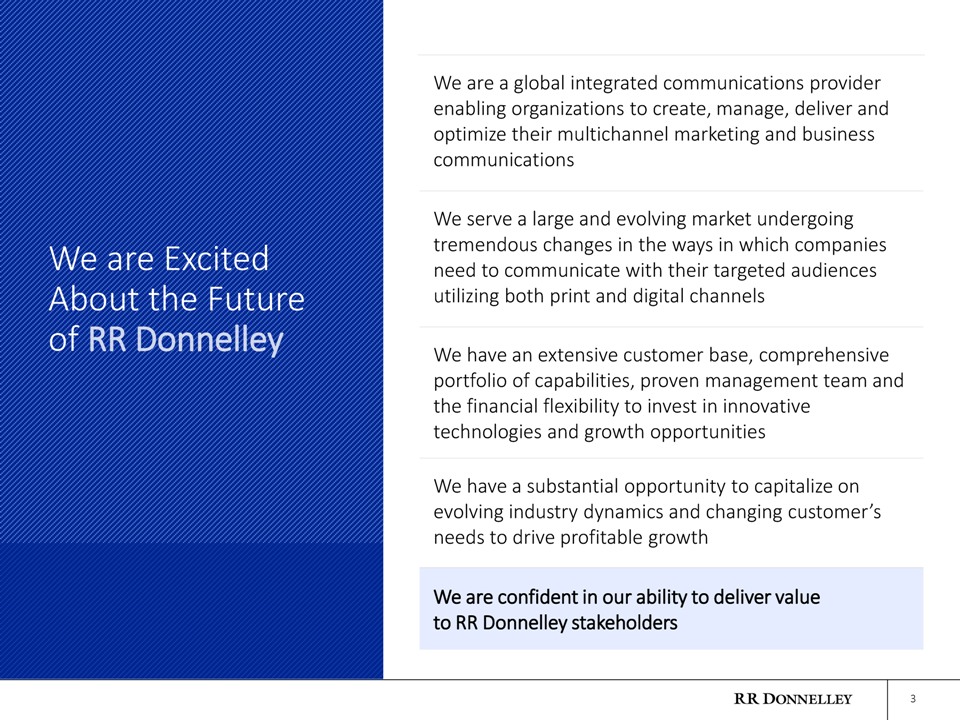
We are Excited About the Future of RR Donnelley 3
We are a global integrated communications provider enabling organizations to create, manage, deliver and optimize their multichannel marketing and business communications
We serve a large and evolving market undergoing tremendous changes in the ways in which companies need to communicate with their targeted audiences utilizing both print and digital channels
We have an extensive customer base, comprehensive portfolio of capabilities, proven management team and the financial flexibility to invest in innovative technologies and growth opportunities
We have a substantial opportunity to capitalize on evolving industry dynamics and changing customer’s needs to drive profitable growth
We are confident in our ability to deliver value to RR Donnelley stakeholders
|
|
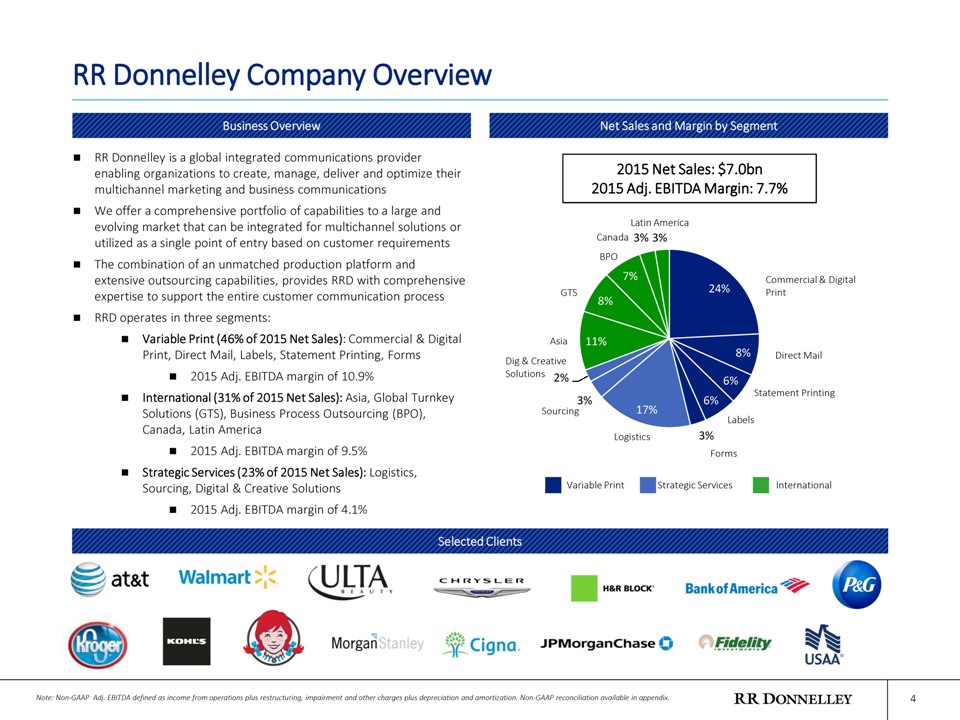
RR Donnelley is a global integrated communications provider enabling organizations to create, manage, deliver and optimize their multichannel marketing and business communications
We offer a comprehensive portfolio of capabilities to a large and evolving market that can be integrated for multichannel solutions or utilized as a single point of entry based on customer requirements
The combination of an unmatched production platform and extensive outsourcing capabilities, provides RRD with comprehensive expertise to support the entire customer communication process
RRD operates in three segments:
Variable Print (46% of 2015 Net Sales): Commercial & Digital Print, Direct Mail, Labels, Statement Printing, Forms
2015 Adj. EBITDA margin of 10.9%
International (31% of 2015 Net Sales): Asia, Global Turnkey Solutions (GTS), Business Process Outsourcing (BPO), Canada, Latin America
2015 Adj. EBITDA margin of 9.5%
Strategic Services (23% of 2015 Net Sales): Logistics, Sourcing, Digital & Creative Solutions
2015 Adj. EBITDA margin of 4.1%
RR Donnelley Company Overview 4
Business Overview
Selected Clients
Net Sales and Margin by Segment
2015 Net Sales: $7.0bn
2015 Adj. EBITDA Margin: 7.7%
24%8%6%6%3%17%3%2%11%8%7%3%3%
Asia
Commercial & Digital Print
Logistics
Direct Mail
Statement Printing
Labels
Forms
Sourcing
Dig & Creative Solutions
Variable Print
Strategic Services
International
Note: Non-GAAP Adj. EBITDA defined as income from operations plus restructuring, impairment and other charges plus depreciation and amortization. Non-GAAP reconciliation available in appendix.
GTS
BPO
Canada
Latin America
|
|
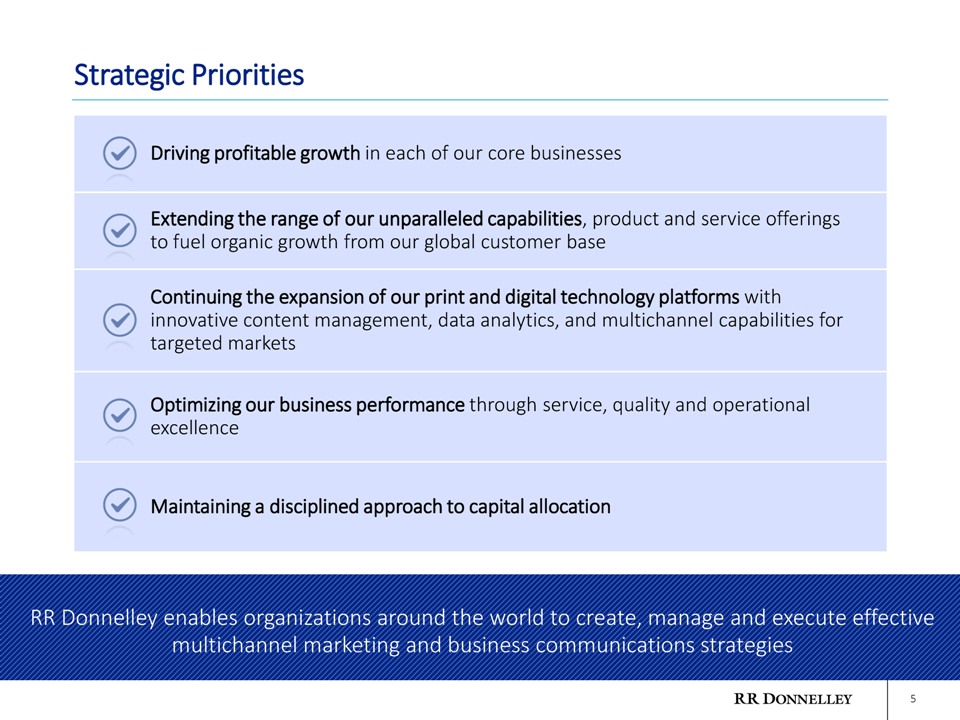
Strategic Priorities 5
With RRD’s long-standing customer relationships, unmatched portfolio of capabilities, experienced management team and solid financial position, we are well positioned to drive future growth
Driving profitable growth in each of our core businesses
Extending the range of our unparalleled capabilities, product and service offerings to fuel organic growth from our global customer base
Continuing the expansion of our print and digital technology platforms with innovative content management, data analytics, and multichannel capabilities for targeted markets
Optimizing our business performance through service, quality and operational excellence
Maintaining a disciplined approach to capital allocation
RR Donnelley enables organizations around the world to create, manage and execute effective multichannel marketing and business communications strategies
|
|
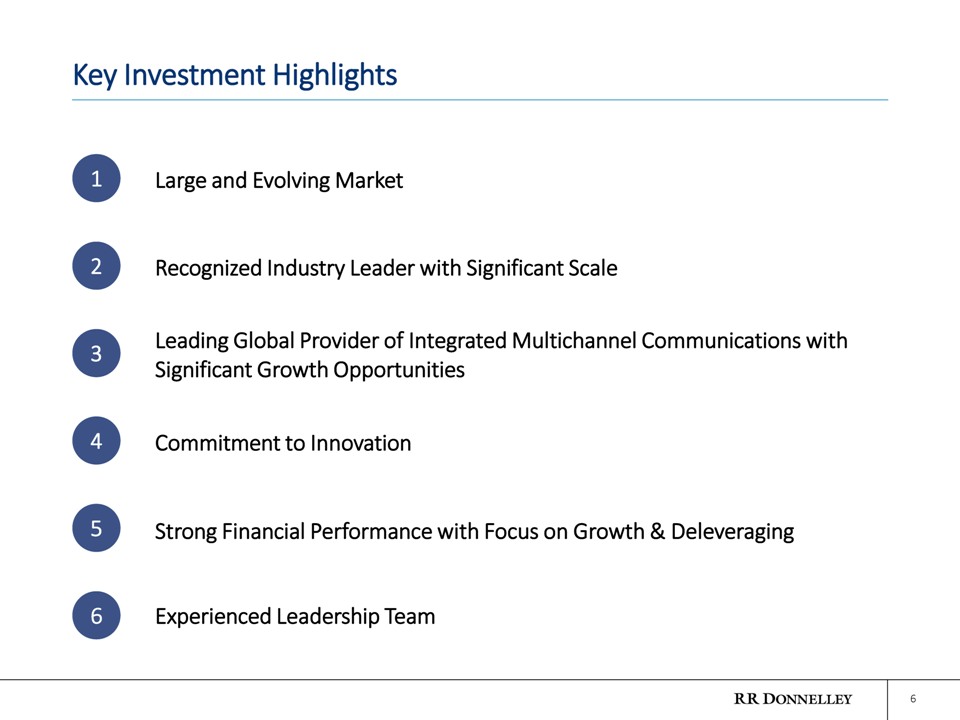
Key Investment Highlights 6
2
Recognized Industry Leader with Significant Scale
1
Large and Evolving Market
4
Commitment to Innovation
3
Leading Global Provider of Integrated Multichannel Communications with Significant Growth Opportunities
5
Strong Financial Performance with Focus on Growth & Deleveraging
6
Experienced Leadership Team
|
|
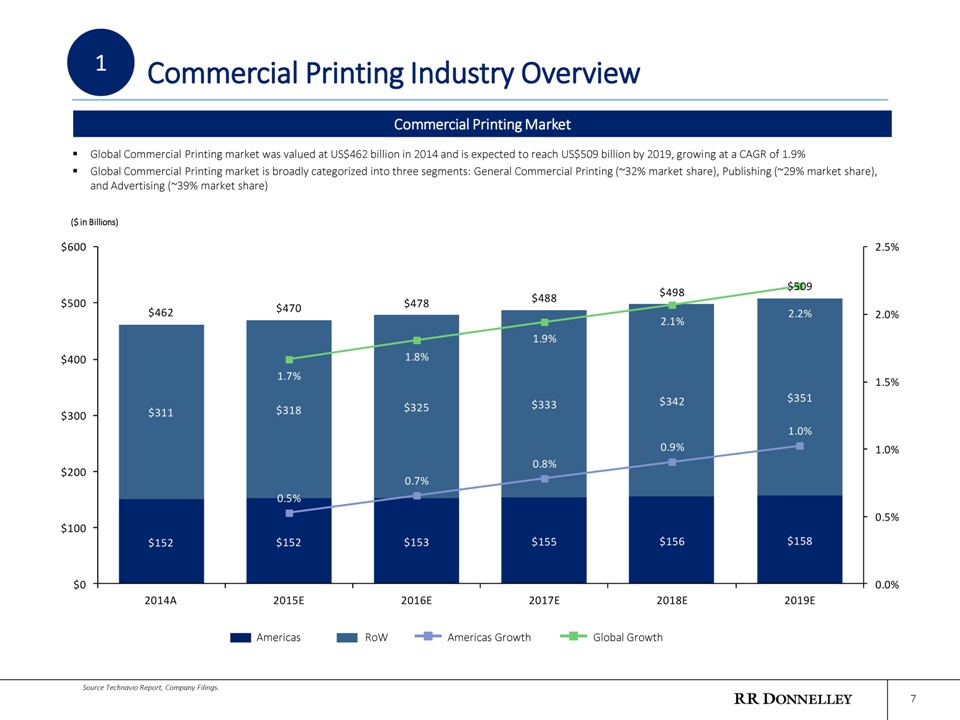
$152$152$153$155$156$158$311$318$325$333$342$351$462$470$478$488$498$5090.5% 0.7% 0.8% 0.9% 1.0% 1.7% 1.8% 1.9% 2.1% 2.2% 0.0%0.5%1.0%1.5%2.0%2.5%$0$100$200$300$400$500$6002014A2015E2016E2017E2018E2019E
7
Global Commercial Printing market was valued at US$462 billion in 2014 and is expected to reach US$509 billion by 2019, growing at a CAGR of 1.9%
Global Commercial Printing market is broadly categorized into three segments: General Commercial Printing (~32% market share), Publishing (~29% market share), and Advertising (~39% market share)
Commercial Printing Market
Source Technavio Report, Company Filings.
Commercial Printing Industry Overview
1
($ in Billions)
Americas
RoW
Americas Growth
Global Growth
|
|
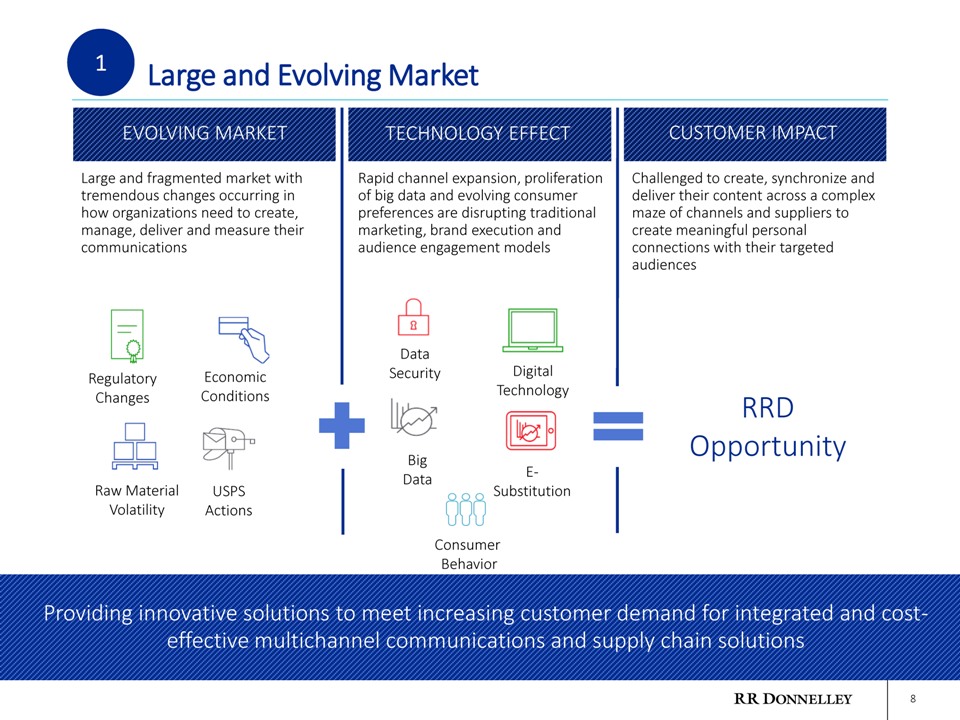
Large and Evolving Market 8
EVOLVING MARKET
Large and fragmented market with tremendous changes occurring in how organizations need to create, manage, deliver and measure their communications
Rapid channel expansion, proliferation of big data and evolving consumer preferences are disrupting traditional marketing, brand execution and audience engagement models
TECHNOLOGY EFFECT
Challenged to create, synchronize and deliver their content across a complex maze of channels and suppliers to create meaningful personal connections with their targeted audiences
CUSTOMER IMPACT
RRD
Opportunity
EVOLVING MARKET
E-Substitution
Data Security
Big Data
Digital Technology
Raw Material Volatility
Economic Conditions
Regulatory Changes
USPS Actions
Consumer
Behavior
1
Providing innovative solutions to meet increasing customer demand for integrated and cost-effective multichannel communications and supply chain solutions
|
|
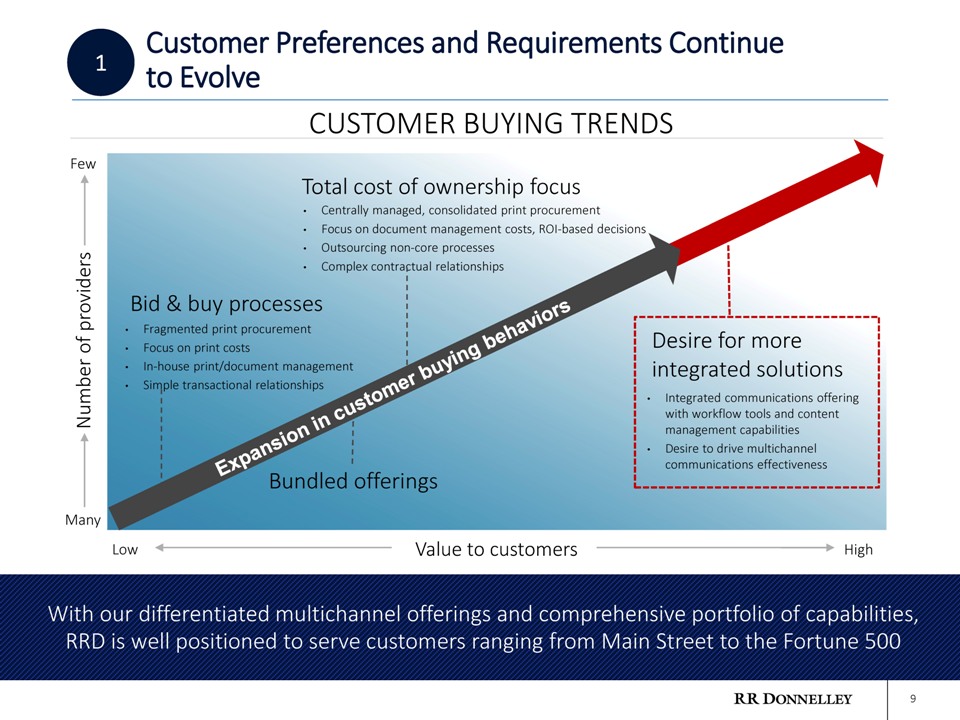
9
Value to customers
Number of providers
Few
Many
Low
High
•
Fragmented print procurement
•
Focus on print costs
•
In-house print/document management
•
Simple transactional relationships
Bid & buy processes
•
Centrally managed, consolidated print procurement
•
Focus on document management costs, ROI-based decisions
•
Outsourcing non-core processes
•
Complex contractual relationships
Bundled offerings
Total cost of ownership focus
•
Integrated communications offering with workflow tools and content management capabilities
•
Desire to drive multichannel communications effectiveness
Desire for more integrated solutions
CUSTOMER BUYING TRENDS
Customer Preferences and Requirements Continue to Evolve
1
With our differentiated multichannel offerings and comprehensive portfolio of capabilities, RRD is well positioned to serve customers ranging from Main Street to the Fortune 500
|
|
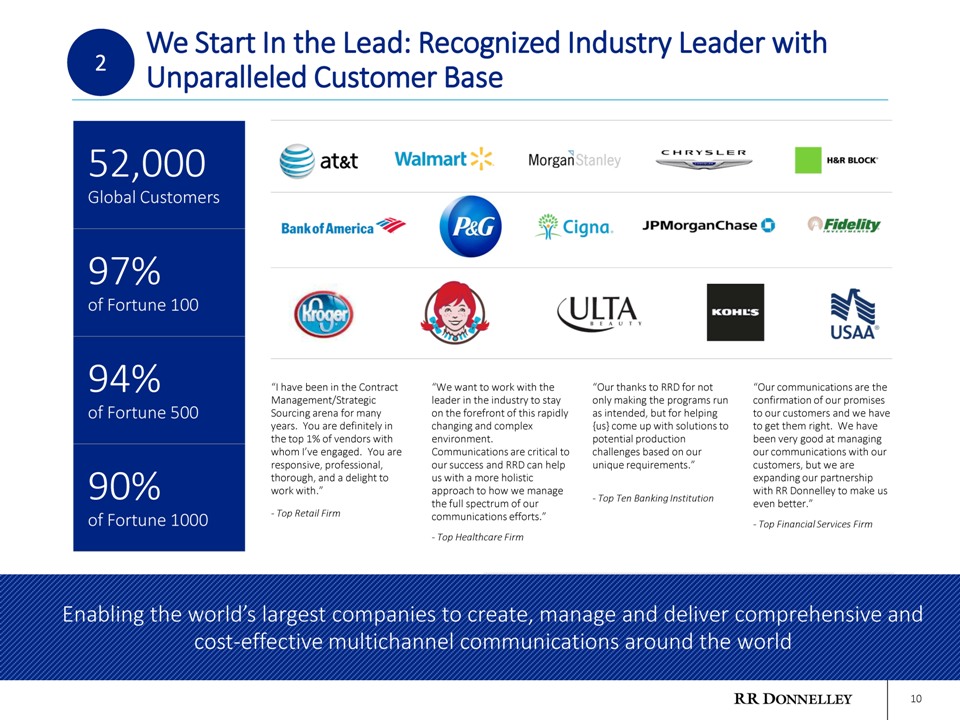
We Start In the Lead: Recognized Industry Leader with Unparalleled Customer Base 10
Enabling the world’s largest companies to create, manage and deliver comprehensive and cost-effective multi-channel communications around the world
52,000 Global Customers
97% of Fortune 100
94% of Fortune 500
90% of Fortune 1000
“Our thanks to RRD for not only making the programs run as intended, but for helping {us} come up with solutions to potential production challenges based on our unique requirements.”
- Top Ten Banking Institution
“Our communications are the confirmation of our promises to our customers and we have to get them right. We have been very good at managing our communications with our customers, but we are expanding our partnership with RR Donnelley to make us even better.”
- Top Financial Services Firm
“We want to work with the leader in the industry to stay on the forefront of this rapidly changing and complex environment. Communications are critical to our success and RRD can help us with a more holistic approach to how we manage the full spectrum of our communications efforts.”
- Top Healthcare Firm
“I have been in the Contract Management/Strategic Sourcing arena for many years. You are definitely in the top 1% of vendors with whom I’ve engaged. You are responsive, professional, thorough, and a delight to work with.”
- Top Retail Firm
2
Enabling the world’s largest companies to create, manage and deliver comprehensive and cost-effective multichannel communications around the world
|
|
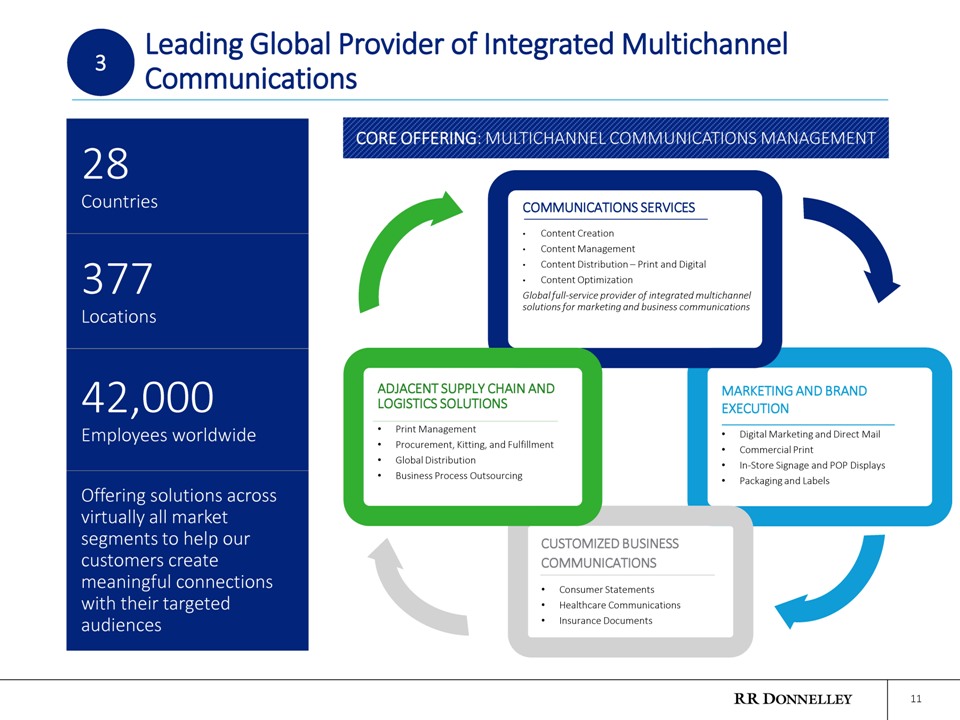
MARKETING AND BRAND EXECUTION
•
Digital Marketing and Direct Mail
•
Commercial Print
•
In-Store Signage and POP Displays
•
Packaging and Labels
COMMUNICATIONS SERVICES
•
Content Creation
•
Content Management
•
Content Distribution – Print and Digital
•
Content Optimization Global full-service provider of integrated multichannel solutions for marketing and business communications
Leading Global Provider of Integrated Multichannel Communications 11
28
Countries
377 Locations
42,000 Employees worldwide
Offering solutions across virtually all market segments to help our customers create meaningful connections with their targeted audiences
CUSTOMIZED BUSINESS COMMUNICATIONS
•
Consumer Statements
•
Healthcare Communications
•
Insurance Documents
ADJACENT SUPPLY CHAIN AND LOGISTICS SOLUTIONS
•
Print Management
•
Procurement, Kitting, and Fulfillment
•
Global Distribution
•
Business Process Outsourcing
CORE OFFERING: MULTICHANNEL COMMUNICATIONS MANAGEMENT
3
|
|
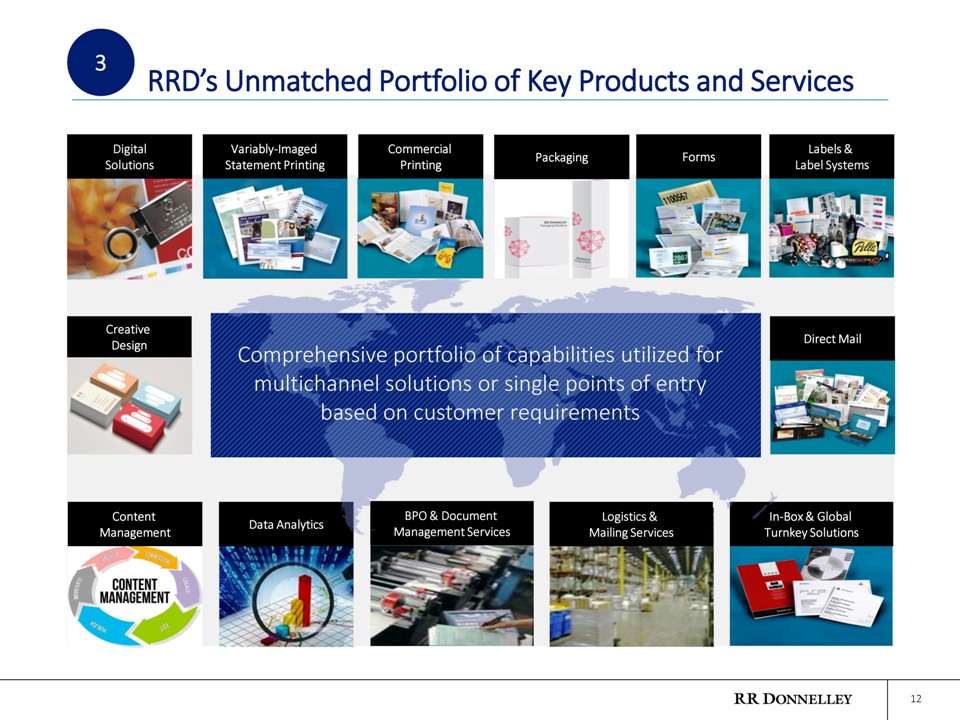
RRD’s Unmatched Portfolio of Key Products and Services 12
Variably-Imaged
Statement Printing
Commercial
Printing
Direct Mail
Forms
Labels & Label Systems
Packaging
Creative
Design
BPO & Document
Management Services
Digital Solutions
Logistics & Mailing Services
In-Box & Global Turnkey Solutions
Content
Management
Data Analytics
Comprehensive portfolio of capabilities utilized for multichannel solutions or single points of entry based on customer requirements
3
|
|
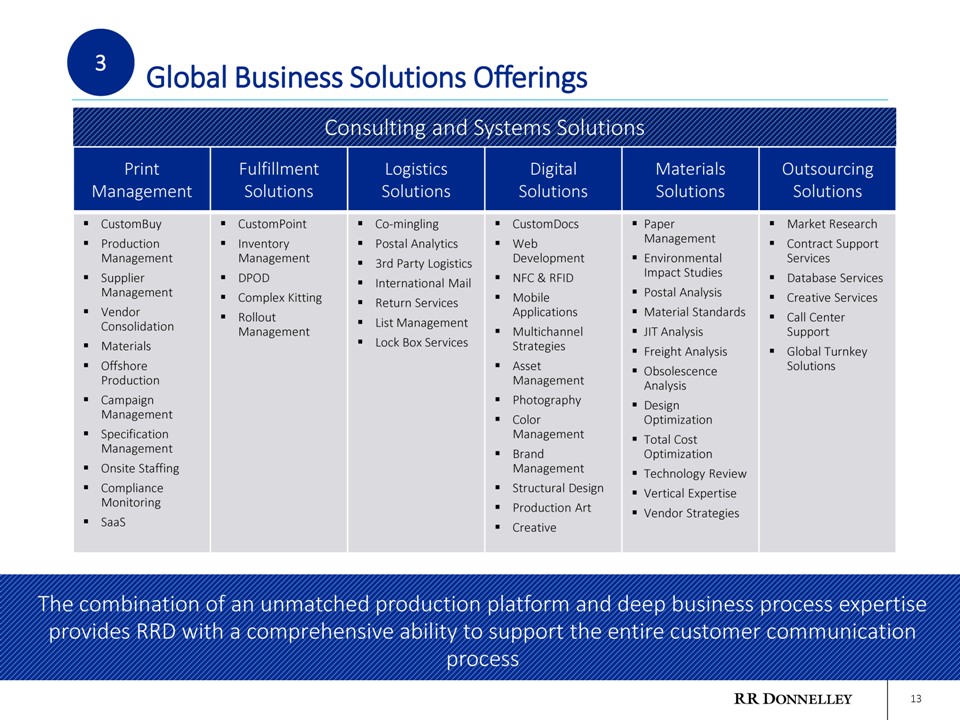
Global Business Solutions Offerings 13
The combination of an unmatched production platform and > $1 billion in outsourcing, provides RRD with a unique expertise to support the entire customer communication process
Consulting and Systems Solutions
Print Management
Fulfillment Solutions
Logistics Solutions
Digital Solutions
Materials Solutions
Outsourcing Solutions
CustomBuy
Production Management
Supplier Management
Vendor Consolidation
Materials
Offshore Production
Campaign Management
Specification Management
Onsite Staffing
Compliance Monitoring
SaaS
CustomPoint
Inventory Management
DPOD
Complex Kitting
Rollout Management
Co-mingling
Postal Analytics
3rd Party Logistics
International Mail
Return Services
List Management
Lock Box Services
CustomDocs
Web Development
NFC & RFID
Mobile Applications
Multichannel Strategies
Asset Management
Photography
Color Management
Brand Management
Structural Design
Production Art
Creative
Paper Management
Environmental Impact Studies
Postal Analysis
Material Standards
JIT Analysis
Freight Analysis
Obsolescence Analysis
Design Optimization
Total Cost Optimization
Technology Review
Vertical Expertise
Vendor Strategies
Market Research
Contract Support Services
Database Services
Creative Services
Call Center Support
Global Turnkey Solutions
3
The combination of an unmatched production platform and deep business process expertise provides RRD with a comprehensive ability to support the entire customer communication process
|
|
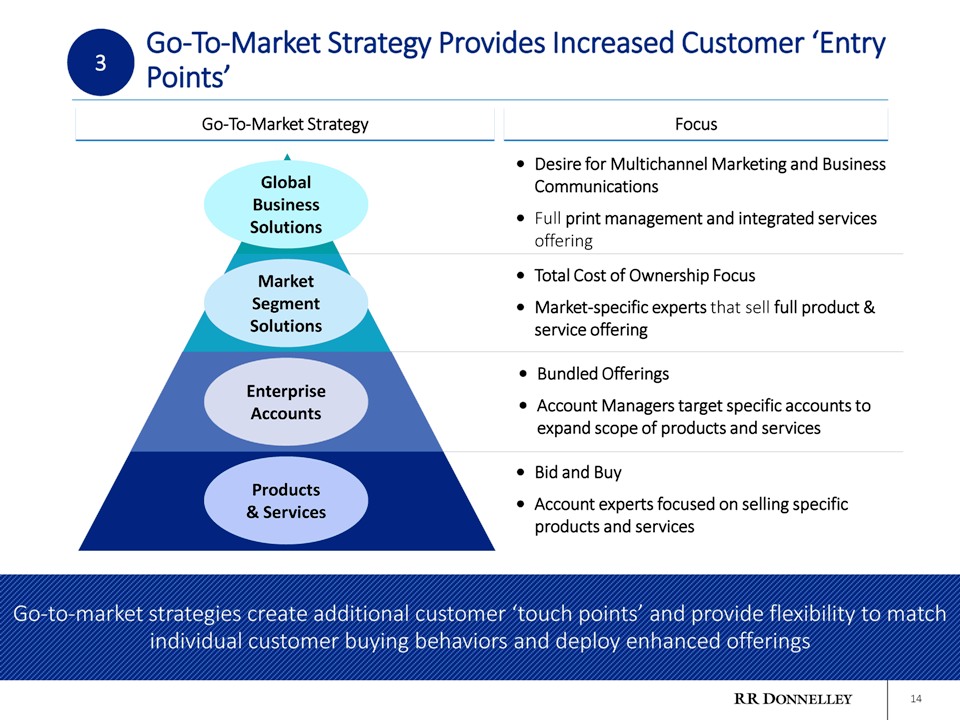
Go-To-Market Strategy Provides Increased Customer ‘Entry
3 Points’
Go-To-Market Strategy Focus
Global
Business
• Desire for Multichannel Marketing and Business
Communications
Solutions
Market
Segment
• Full print management and integrated services
offering
• Total Cost of Ownership Focus
• Market-specific that sell full Solutions
Enterprise
Accounts
Market experts product &
service offering
• Bundled Offerings
• Account Managers target specific accounts to
Products
& • Bid and Buy
• Account experts focused on selling specific
g g p
expand scope of products and services
Go-to-market strategies create additional customer ‘touch points’ and flexibility to match
Services
products and services
Go to points provide individual customer buying behaviors and deploy enhanced offerings
14
|
|
3
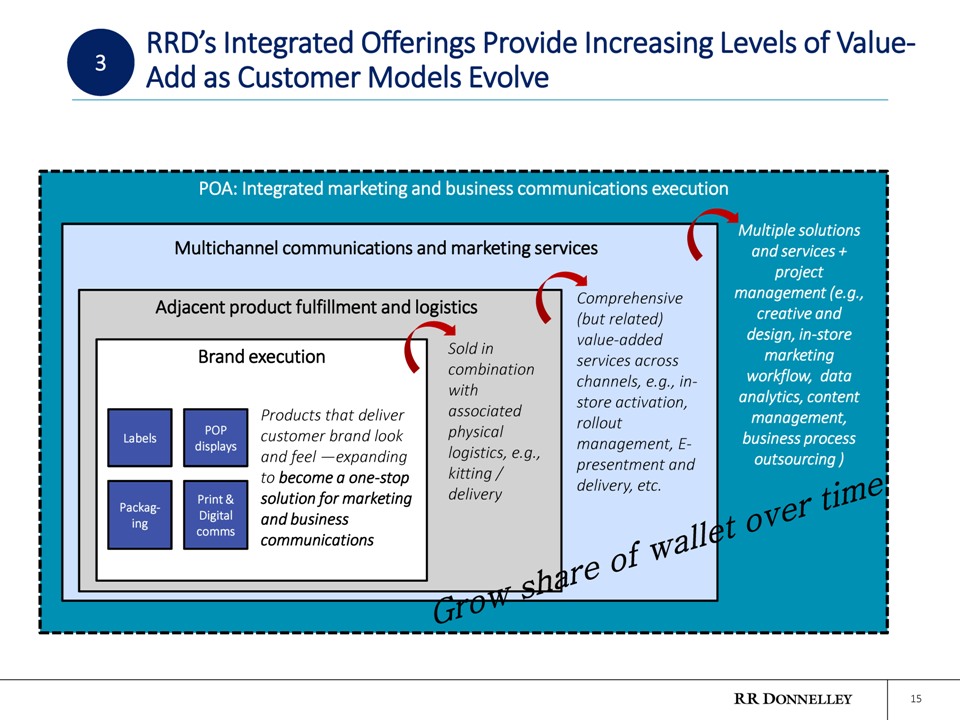
POA: Integrated marketing and business communications execution
Multichannel communications and marketing services
Adjacent product fulfillment and logistics
Brand execution
Multiple solutions and services + project management (e.g., creative and design, in-store marketing workflow, data analytics, content management, business process outsourcing )
Packag-ing
Labels
POP displays
Print & Digital comms
Products that deliver customer brand look and feel —expanding to become a one-stop solution for marketing and business communications
Sold in combination with associated physical logistics, e.g., kitting / delivery
Comprehensive (but related) value-added services across channels, e.g., in-store activation, rollout management, E-presentment and delivery, etc. 15
RRD’s Integrated Offerings Provide Increasing Levels of Value-Add as Customer Models Evolve
|
|
16
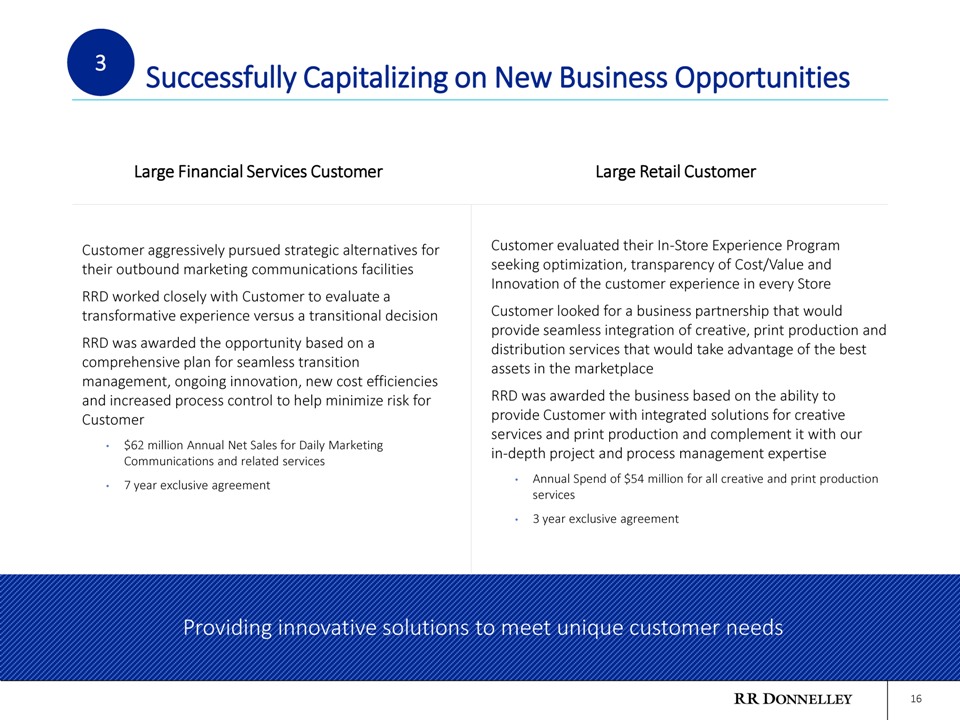
Customer evaluated their In-Store Experience Program seeking optimization, transparency of Cost/Value and Innovation of the customer experience in every Store
Customer looked for a business partnership that would provide seamless integration of creative, print production and distribution services that would take advantage of the best assets in the marketplace
RRD was awarded the business based on the ability to provide Customer with integrated solutions for creative services and print production and complement it with our in-depth project and process management expertise
•
Annual Spend of $54 million for all creative and print production services
•
3 year exclusive agreement
Providing innovative solutions to meet unique customer needs
Customer aggressively pursued strategic alternatives for their outbound marketing communications facilities RRD worked closely with Customer to evaluate a transformative experience versus a transitional decision RRD was awarded the opportunity based on a comprehensive plan for seamless transition management, ongoing innovation, new cost efficiencies and increased process control to help minimize risk for Customer
•
$62 million Annual Net Sales for Daily Marketing Communications and related services
•
7 year exclusive agreement
Successfully Capitalizing on New Business Opportunities
3
Large Financial Services Customer
Large Retail Customer
|
|
17
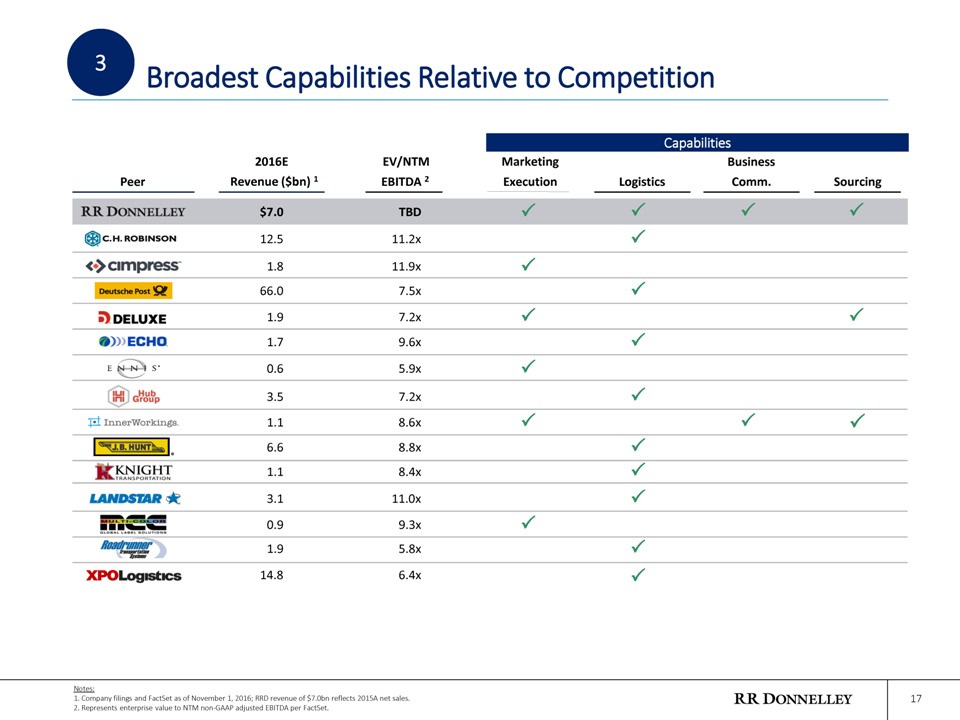
Broadest Capabilities Relative to Competition
3
Marketing
Business
Peer
Revenue ($bn) 1
Execution
Logistics
Comm.
Sourcing
12.5
1.8
66.0
1.9
1.7
0.6
3.5
1.1
6.6
1.1
3.1
0.9
1.9
14.8
$7.0
Capabilities
EBITDA 2
11.2x
11.9x
7.5x
7.2x
9.6x
5.9x
7.2x
8.6x
8.8x
8.4x
11.0x
9.3x
5.8x
6.4x
TBD
2016E
EV/NTM
Notes:
1. Company filings and FactSet as of November 1, 2016; RRD revenue of $7.0bn reflects 2015A net sales.
2. Represents enterprise value to NTM non-GAAP adjusted EBITDA per FactSet.
|
|
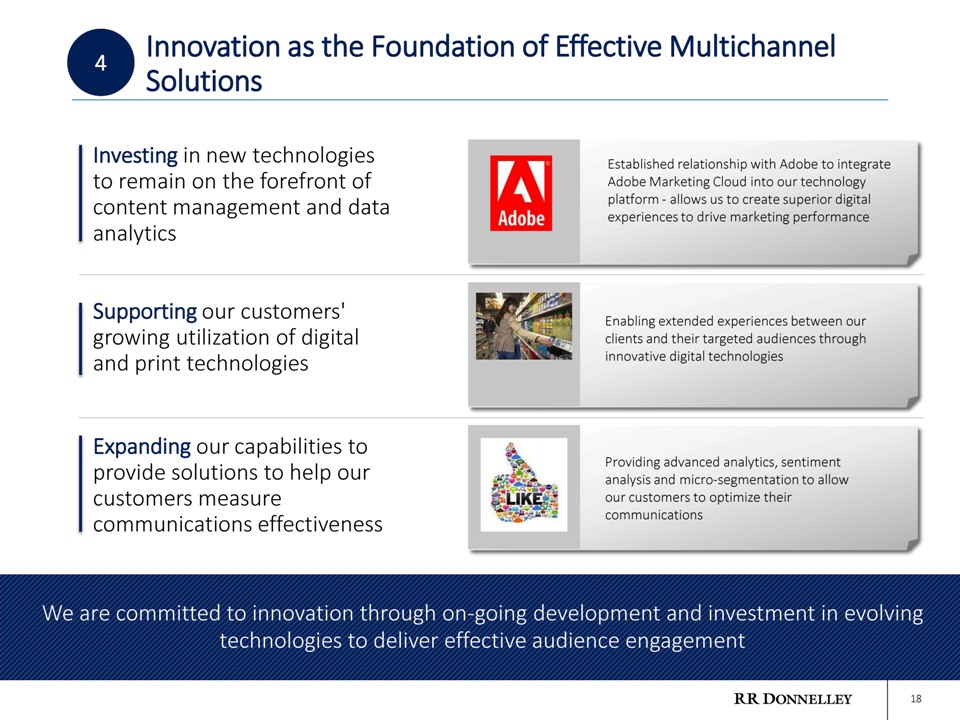
Innovation as the Foundation of Effective Multichannel Solutions 18
Investing in new technologies to remain on the forefront of content management and data analytics
Established relationship with Adobe to integrate Adobe Marketing Cloud into our technology platform—allows us to create superior digital experiences to drive marketing performance
Enabling extended experiences between our clients and their targeted audiences through innovative digital technologies
Providing advanced analytics, sentiment analysis and micro-segmentation to allow our customers to optimize their communications
4
We are committed to innovation through on-going development and investment in evolving technologies to deliver effective audience engagement
Supporting our customers’ growing utilization of digital and print technologies
Expanding our capabilities to provide solutions to help our customers measure communications effectiveness
|
|
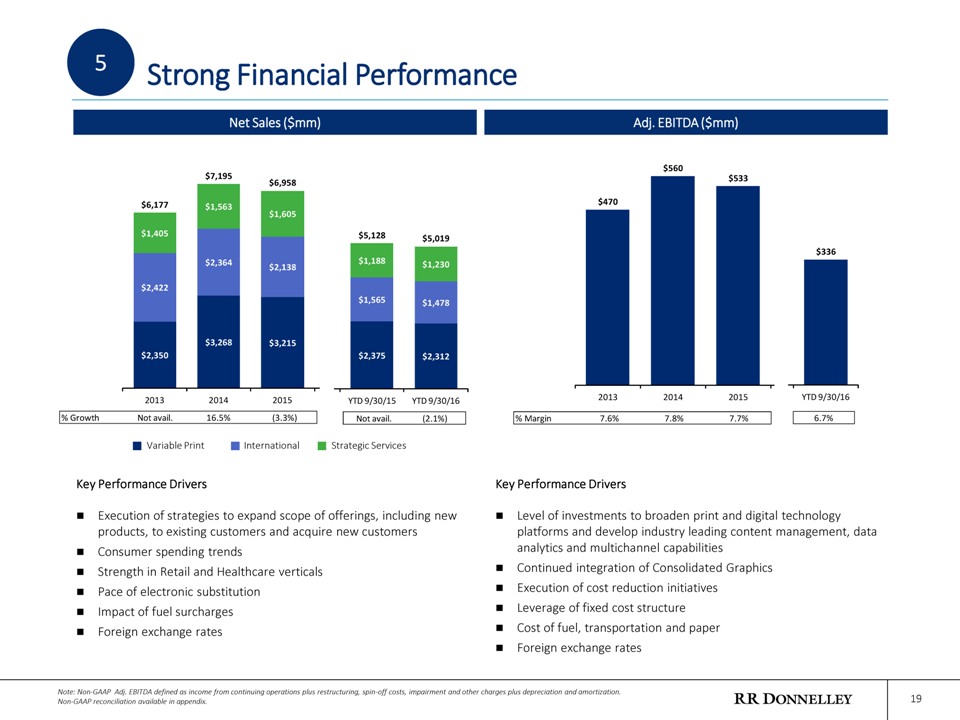
Strong Financial Performance 19
5
Execution of strategies to expand scope of offerings, including new products, to existing customers and acquire new customers
Consumer spending trends
Strength in Retail and Healthcare verticals
Pace of electronic substitution
Impact of fuel surcharges
Foreign exchange rates
Variable Print
International
Strategic Services
Note: Non-GAAP Adj. EBITDA defined as income from continuing operations plus restructuring, spin-off costs, impairment and other charges plus depreciation and amortization. Non-GAAP reconciliation available in appendix.
Net Sales ($mm)
Adj. EBITDA ($mm)
Level of investments to broaden print and digital technology platforms and develop industry leading content management, data analytics and multichannel capabilities
Continued integration of Consolidated Graphics
Execution of cost reduction initiatives
Leverage of fixed cost structure
Cost of fuel, transportation and paper
Foreign exchange rates
Key Performance Drivers
Key Performance Drivers
% Margin7.6%7.8%7.7%$470 $560 $533 201320142015 6.7% $336 YTD 9/30/16% GrowthNot avail.16.5%(3.3%) $2,350 $3,268 $3,215 $2,422 $2,364 $2,138 $1,405 $1,563 $1,605 $6,177 $7,195 $6,958 201320142015 Not avail.(2.1%) $2,375 $2,312 $1,565 $1,478 $1,188 $1,230 $5,128 $5,019 YTD 9/30/15YTD 9/30/16
|
|
20
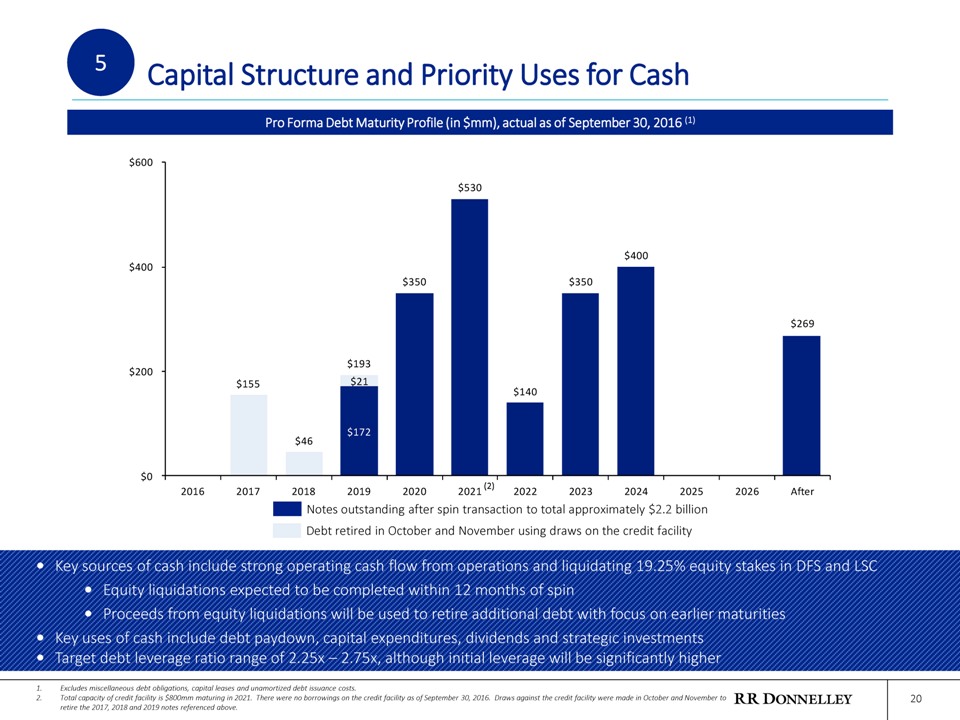
Capital Structure and Priority Uses for Cash
5
Notes outstanding after spin transaction to total approximately $2.2 billion
Pro Forma Debt Maturity Profile (in $mm), actual as of September 30, 2016 (1)
1.
Excludes miscellaneous debt obligations, capital leases and unamortized debt issuance costs.
2.
Total capacity of credit facility is $800mm maturing in 2021. There were no borrowings on the credit facility as of September 30, 2016. Draws against the credit facility were made in October and November to retire the 2017, 2018 and 2019 notes referenced above.
•
Key sources of cash include strong operating cash flow from operations and liquidating 19.25% equity stakes in DFS and LSC
•
Equity liquidations expected to be completed within 12 months of spin
•
Proceeds from equity liquidations will be used to retire additional debt with focus on earlier maturities
•
Key uses of cash include debt paydown, capital expenditures, dividends and strategic investments
•
Target debt leverage ratio range of 2.25x – 2.75x, although initial leverage will be significantly higher
(2)
$172 $269 $21 $155 $46 $193 $350 $530 $140 $350 $400 $0 $200 $400 $600 20162017201820192020202120222023202420252026After
Debt retired in October and November using draws on the credit facility
|
|
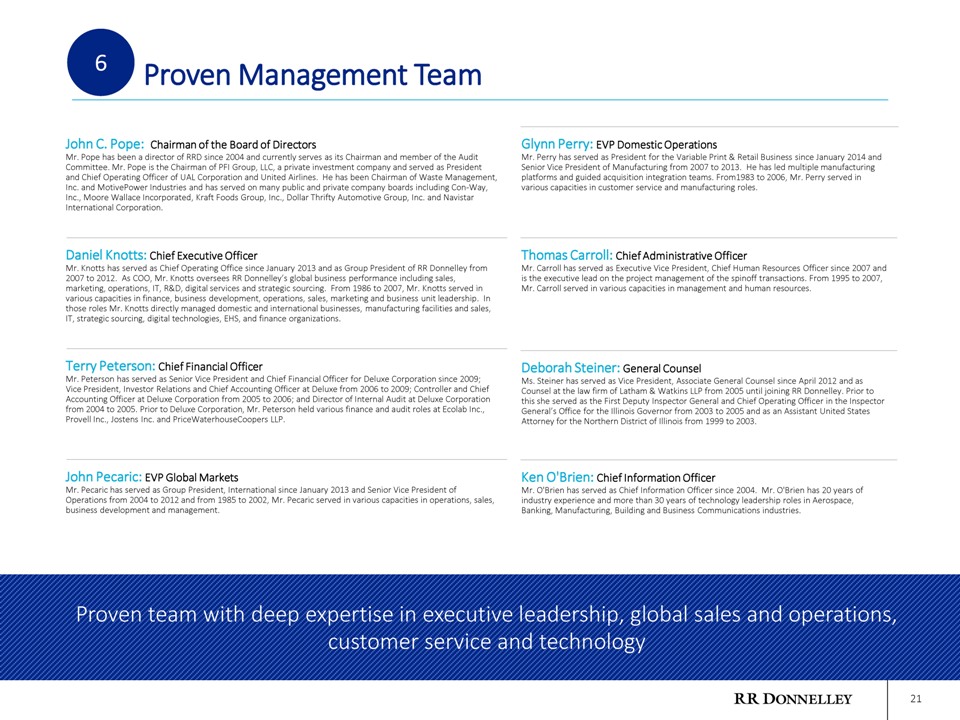
Proven Management Team
Proven team with deep expertise in executive leadership, global sales and operations, customer service and technology
Glynn Perry: EVP Domestic Operations
Mr. Perry has served as President for the Variable Print & Retail Business since January 2014 and Senior Vice President of Manufacturing from 2007 to 2013. He has led multiple manufacturing platforms and guided acquisition integration teams. From1983 to 2006, Mr. Perry served in various capacities in customer service and manufacturing roles.
Thomas Carroll: Chief Administrative Officer
Mr. Carroll has served as Executive Vice President, Chief Human Resources Officer since 2007 and is the executive lead on the project management of the spinoff transactions. From 1995 to 2007, Mr. Carroll served in various capacities in management and human resources.
Deborah Steiner: General Counsel
Ms. Steiner has served as Vice President, Associate General Counsel since April 2012 and as Counsel at the law firm of Latham & Watkins LLP from 2005 until joining RR Donnelley. Prior to this she served as the First Deputy Inspector General and Chief Operating Officer in the Inspector General’s Office for the Illinois Governor from 2003 to 2005 and as an Assistant United States Attorney for the Northern District of Illinois from 1999 to 2003.
Ken O’Brien: Chief Information Officer
Mr. O’Brien has served as Chief Information Officer since 2004. Mr. O’Brien has 20 years of industry experience and more than 30 years of technology leadership roles in Aerospace, Banking, Manufacturing, Building and Business Communications industries. 21
6
John C. Pope: Chairman of the Board of Directors
Mr. Pope has been a director of RRD since 2004 and currently serves as its Chairman and member of the Audit Committee. Mr. Pope is the Chairman of PFI Group, LLC, a private investment company and served as President and Chief Operating Officer of UAL Corporation and United Airlines. He has been Chairman of Waste Management, Inc. and MotivePower Industries and has served on many public and private company boards including Con-Way, Inc., Moore Wallace Incorporated, Kraft Foods Group, Inc., Dollar Thrifty Automotive Group, Inc. and Navistar International Corporation.
Daniel Knotts: Chief Executive Officer
Mr. Knotts has served as Chief Operating Office since January 2013 and as Group President of RR Donnelley from 2007 to 2012. As COO, Mr. Knotts oversees RR Donnelley’s global business performance including sales, marketing, operations, IT, R&D, digital services and strategic sourcing. From 1986 to 2007, Mr. Knotts served in various capacities in finance, business development, operations, sales, marketing and business unit leadership. In those roles Mr. Knotts directly managed domestic and international businesses, manufacturing facilities and sales, IT, strategic sourcing, digital technologies, EHS, and finance organizations.
Terry Peterson: Chief Financial Officer
Mr. Peterson has served as Senior Vice President and Chief Financial Officer for Deluxe Corporation since 2009; Vice President, Investor Relations and Chief Accounting Officer at Deluxe from 2006 to 2009; Controller and Chief Accounting Officer at Deluxe Corporation from 2005 to 2006; and Director of Internal Audit at Deluxe Corporation from 2004 to 2005. Prior to Deluxe Corporation, Mr. Peterson held various finance and audit roles at Ecolab Inc., Provell Inc., Jostens Inc. and PriceWaterhouseCoopers LLP.
John Pecaric: EVP Global Markets
Mr. Pecaric has served as Group President, International since January 2013 and Senior Vice President of Operations from 2004 to 2012 and from 1985 to 2002, Mr. Pecaric served in various capacities in operations, sales, business development and management.
|
|
22
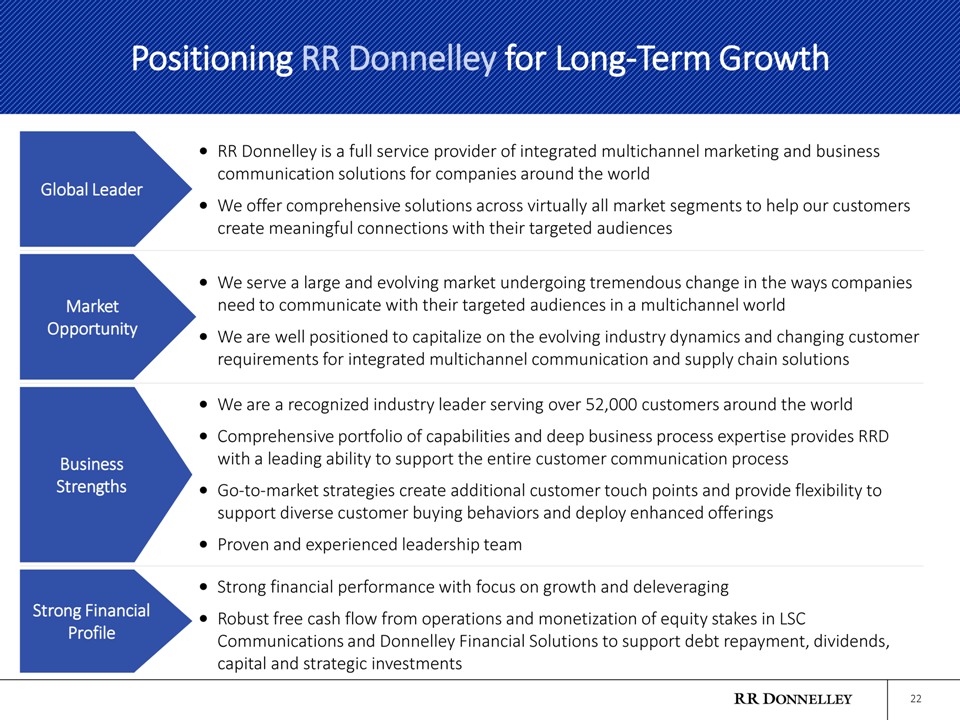
Positioning RR Donnelley for Long-Term Growth
Global Leader
Market Opportunity
Business Strengths
Strong Financial Profile
•
RR Donnelley is a full service provider of integrated multichannel marketing and business communication solutions for companies around the world
•
We offer comprehensive solutions across virtually all market segments to help our customers create meaningful connections with their targeted audiences
•
We serve a large and evolving market undergoing tremendous change in the ways companies need to communicate with their targeted audiences in a multichannel world
•
We are well positioned to capitalize on the evolving industry dynamics and changing customer requirements for integrated multichannel communication and supply chain solutions
•
We are a recognized industry leader serving over 52,000 customers around the world
•
Comprehensive portfolio of capabilities and deep business process expertise provides RRD with a leading ability to support the entire customer communication process
•
Go-to-market strategies create additional customer touch points and provide flexibility to support diverse customer buying behaviors and deploy enhanced offerings
•
Proven and experienced leadership team
•
Strong financial performance with focus on growth and deleveraging
•
Robust free cash flow from operations and monetization of equity stakes in LSC Communications and Donnelley Financial Solutions to support debt repayment, dividends, capital and strategic investments
|
|

Appendix 23
|
|
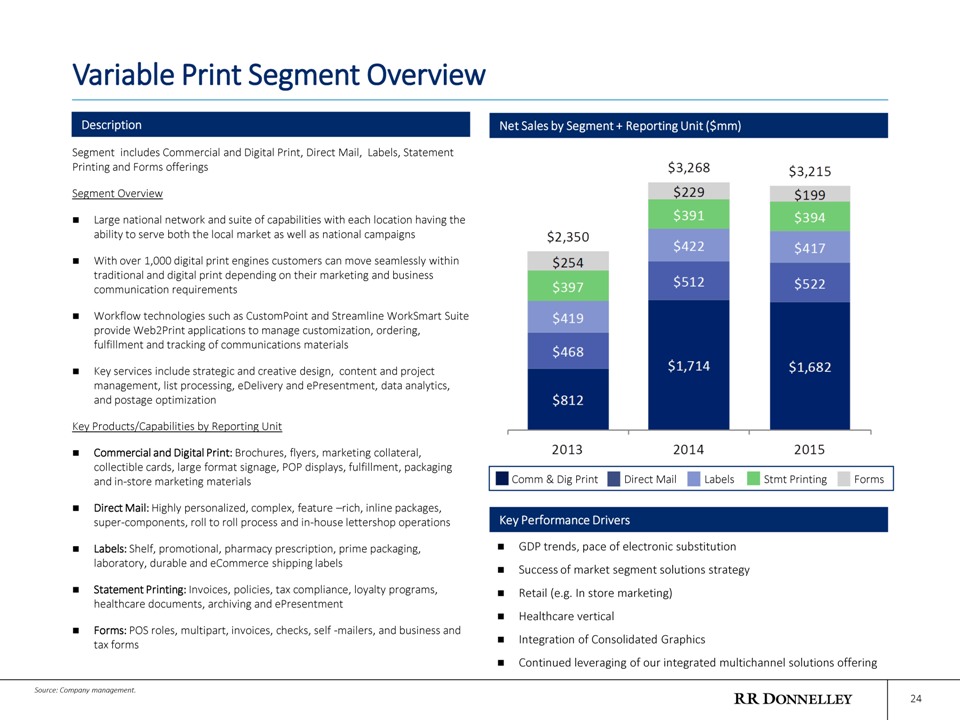
Segment includes Commercial and Digital Print, Direct Mail, Labels, Statement Printing and Forms offerings
Segment Overview
Large national network and suite of capabilities with each location having the ability to serve both the local market as well as national campaigns
With over 1,000 digital print engines customers can move seamlessly within traditional and digital print depending on their marketing and business communication requirements
Workflow technologies such as CustomPoint and Streamline WorkSmart Suite provide Web2Print applications to manage customization, ordering, fulfillment and tracking of communications materials
Key services include strategic and creative design, content and project management, list processing, eDelivery and ePresentment, data analytics, and postage optimization
Key Products/Capabilities by Reporting Unit
Commercial and Digital Print: Brochures, flyers, marketing collateral, collectible cards, large format signage, POP displays, fulfillment, packaging and in-store marketing materials
Direct Mail: Highly personalized, complex, feature –rich, inline packages, super-components, roll to roll process and in-house lettershop operations
Labels: Shelf, promotional, pharmacy prescription, prime packaging, laboratory, durable and eCommerce shipping labels
Statement Printing: Invoices, policies, tax compliance, loyalty programs, healthcare documents, archiving and ePresentment
Forms: POS roles, multipart, invoices, checks, self -mailers, and business and tax forms
Variable Print Segment Overview 24
GDP trends, pace of electronic substitution
Success of market segment solutions strategy
Retail (e.g. In store marketing)
Healthcare vertical
Integration of Consolidated Graphics
Continued leveraging of our integrated multichannel solutions offering
Net Sales by Segment + Reporting Unit ($mm)
Comm & Dig Print
Direct Mail
Labels
Stmt Printing
Forms
Description
Key Performance Drivers
Source: Company management.
|
|
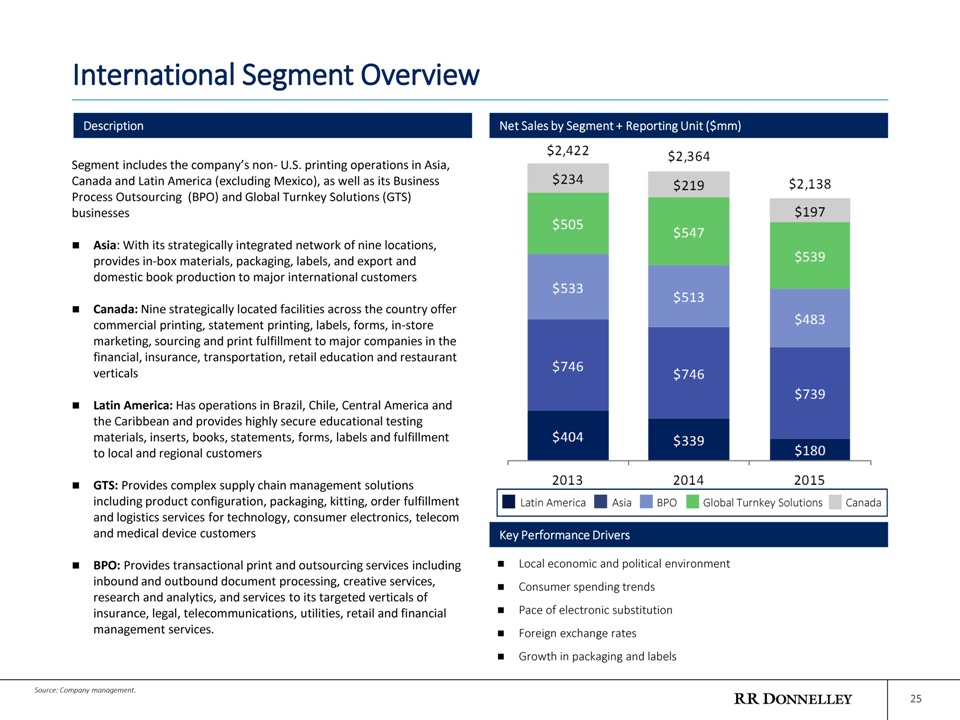
International Segment Overview 25
Local economic and political environment
Consumer spending trends
Pace of electronic substitution
Foreign exchange rates
Growth in packaging and labels
Net Sales by Segment + Reporting Unit ($mm)
Description
Key Performance Drivers
Latin America
Asia
BPO
Global Turnkey Solutions
Canada
Segment includes the company’s non- U.S. printing operations in Asia, Canada and Latin America (excluding Mexico), as well as its Business Process Outsourcing (BPO) and Global Turnkey Solutions (GTS) businesses
Asia: With its strategically integrated network of nine locations, provides in-box materials, packaging, labels, and export and domestic book production to major international customers
Canada: Nine strategically located facilities across the country offer commercial printing, statement printing, labels, forms, in-store marketing, sourcing and print fulfillment to major companies in the financial, insurance, transportation, retail education and restaurant verticals
Latin America: Has operations in Brazil, Chile, Central America and the Caribbean and provides highly secure educational testing materials, inserts, books, statements, forms, labels and fulfillment to local and regional customers
GTS: Provides complex supply chain management solutions including product configuration, packaging, kitting, order fulfillment and logistics services for technology, consumer electronics, telecom and medical device customers
BPO: Provides transactional print and outsourcing services including inbound and outbound document processing, creative services, research and analytics, and services to its targeted verticals of insurance, legal, telecommunications, utilities, retail and financial management services.
Source: Company management.
|
|
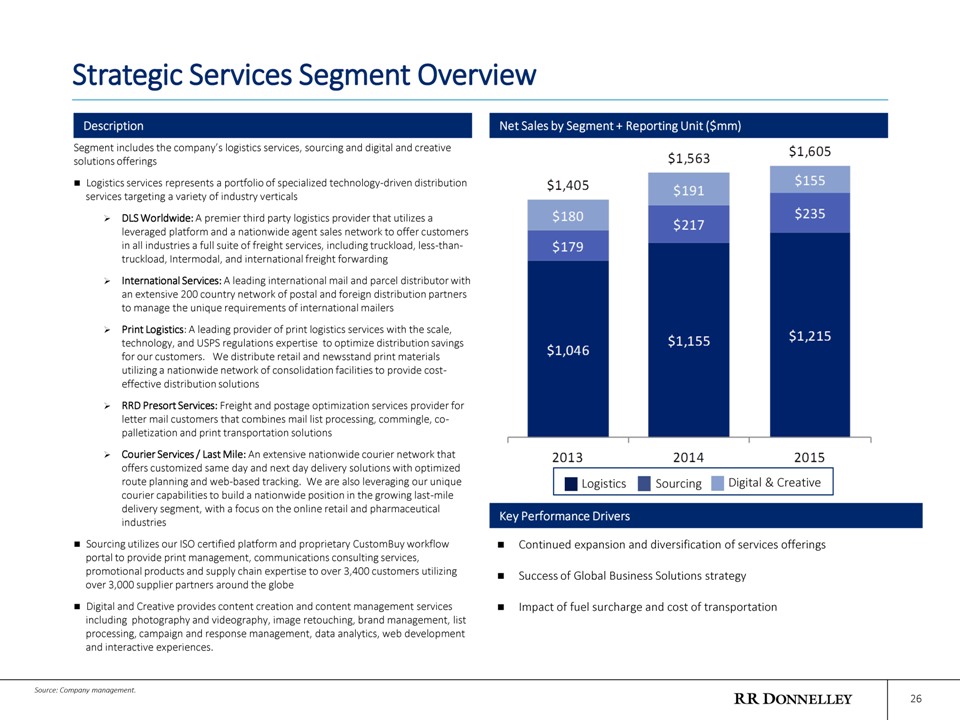
Strategic Services Segment Overview 26
Continued expansion and diversification of services offerings
Success of Global Business Solutions strategy
Impact of fuel surcharge and cost of transportation
Net Sales by Segment + Reporting Unit ($mm)
Description
Key Performance Drivers
Digital & Creative
Sourcing
Logistics
Segment includes the company’s logistics services, sourcing and digital and creative solutions offerings
Logistics services represents a portfolio of specialized technology-driven distribution services targeting a variety of industry verticals
DLS Worldwide: A premier third party logistics provider that utilizes a leveraged platform and a nationwide agent sales network to offer customers in all industries a full suite of freight services, including truckload, less-than- truckload, Intermodal, and international freight forwarding
International Services: A leading international mail and parcel distributor with an extensive 200 country network of postal and foreign distribution partners to manage the unique requirements of international mailers
Print Logistics: A leading provider of print logistics services with the scale, technology, and USPS regulations expertise to optimize distribution savings for our customers. We distribute retail and newsstand print materials utilizing a nationwide network of consolidation facilities to provide cost-effective distribution solutions
RRD Presort Services: Freight and postage optimization services provider for letter mail customers that combines mail list processing, commingle, co-palletization and print transportation solutions
Courier Services / Last Mile: An extensive nationwide courier network that offers customized same day and next day delivery solutions with optimized route planning and web-based tracking. We are also leveraging our unique courier capabilities to build a nationwide position in the growing last-mile delivery segment, with a focus on the online retail and pharmaceutical industries
Sourcing utilizes our ISO certified platform and proprietary CustomBuy workflow portal to provide print management, communications consulting services, promotional products and supply chain expertise to over 3,400 customers utilizing over 3,000 supplier partners around the globe
Digital and Creative provides content creation and content management services including photography and videography, image retouching, brand management, list processing, campaign and response management, data analytics, web development and interactive experiences.
Source: Company management.
|
|
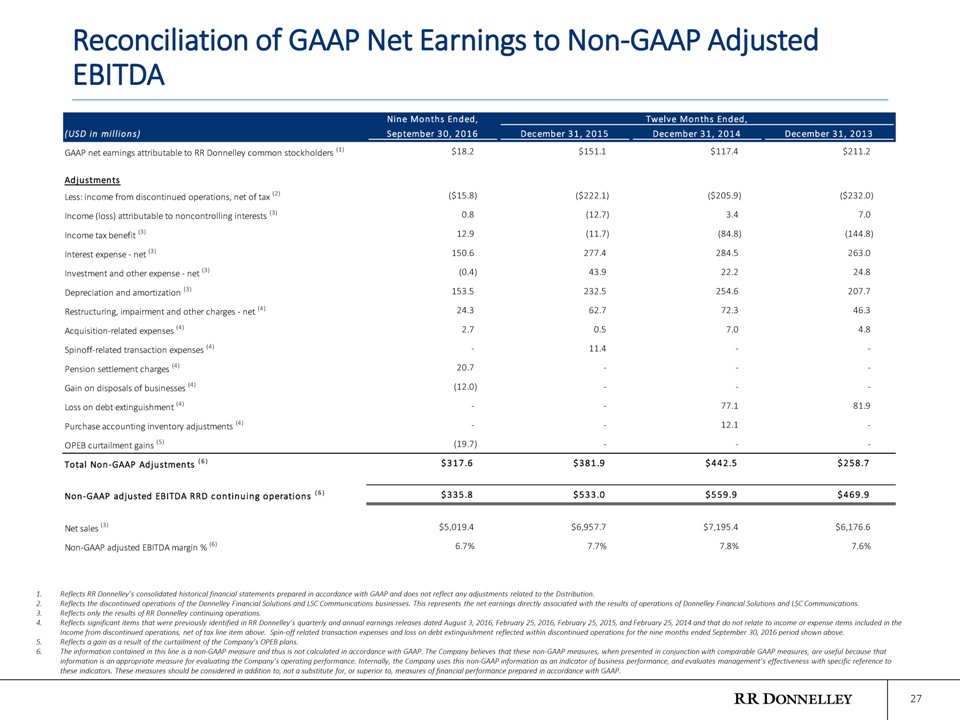
Reconciliation of GAAP Net Earnings to Non-GAAP Adjusted EBITDA 27
1.
Reflects RR Donnelley’s consolidated historical financial statements prepared in accordance with GAAP and does not reflect any adjustments related to the Distribution.
2.
Reflects the discontinued operations of the Donnelley Financial Solutions and LSC Communications businesses. This represents the net earnings directly associated with the results of operations of Donnelley Financial Solutions and LSC Communications.
3.
Reflects only the results of RR Donnelley continuing operations.
4.
Reflects significant items that were previously identified in RR Donnelley’s quarterly and annual earnings releases dated August 3, 2016, February 25, 2016, February 25, 2015, and February 25, 2014 and that do not relate to income or expense items included in the Income from discontinued operations, net of tax line item above. Spin-off related transaction expenses and loss on debt extinguishment reflected within discontinued operations for the nine months ended September 30, 2016 period shown above.
5.
Reflects a gain as a result of the curtailment of the Company’s OPEB plans.
6.
The information contained in this line is a non-GAAP measure and thus is not calculated in accordance with GAAP. The Company believes that these non-GAAP measures, when presented in conjunction with comparable GAAP measures, are useful because that information is an appropriate measure for evaluating the Company’s operating performance. Internally, the Company uses this non-GAAP information as an indicator of business performance, and evaluates management’s effectiveness with specific reference to these indicators. These measures should be considered in addition to, not a substitute for, or superior to, measures of financial performance prepared in accordance with GAAP.
Nine Months Ended,Twelve Months Ended, (USD in millions) September 30, 2016 December 31, 2015 December 31, 2014 December 31, 2013GAAP net earnings attributable to RR Donnelley common stockholders (1)$18.2$151.1$117.4$211.2 Adjustments Less: income from discontinued operations, net of tax (2)($15.8)($222.1)($205.9)($232.0)Income (loss) attributable to noncontrolling interests (3) 0.8(12.7)3.47.0 Income tax benefit (3) 12.9(11.7)(84.8)(144.8)Interest expense—net (3)150.6277.4284.5263.0Investment and other expense—net (3)(0.4)43.922.224.8 Depreciation and amortization (3)153.5232.5254.6207.7Restructuring, impairment and other charges—net (4)24.362.772.346.3 Acquisition-related expenses (4)2.70.57.04.8 Spinoff-related transaction expenses (4)-11.4—Pension settlement charges (4)20.7— Gain on disposals of businesses (4)(12.0)—Loss on debt extinguishment (4)—77.181.9 Purchase accounting inventory adjustments (4)—12.1-OPEB curtailment gains (5)(19.7)— Total Non-GAAP Adjustments (6)$317.6$381.9$442.5$258.7 Non-GAAP adjusted EBITDA RRD continuing operations (6)$335.8$533.0$559.9$469.9 Net sales (3)$5,019.4$6,957.7$7,195.4$6,176.6 Non-GAAP adjusted EBITDA margin % (6)6.7%7.7%7.8%7.6%
|
|

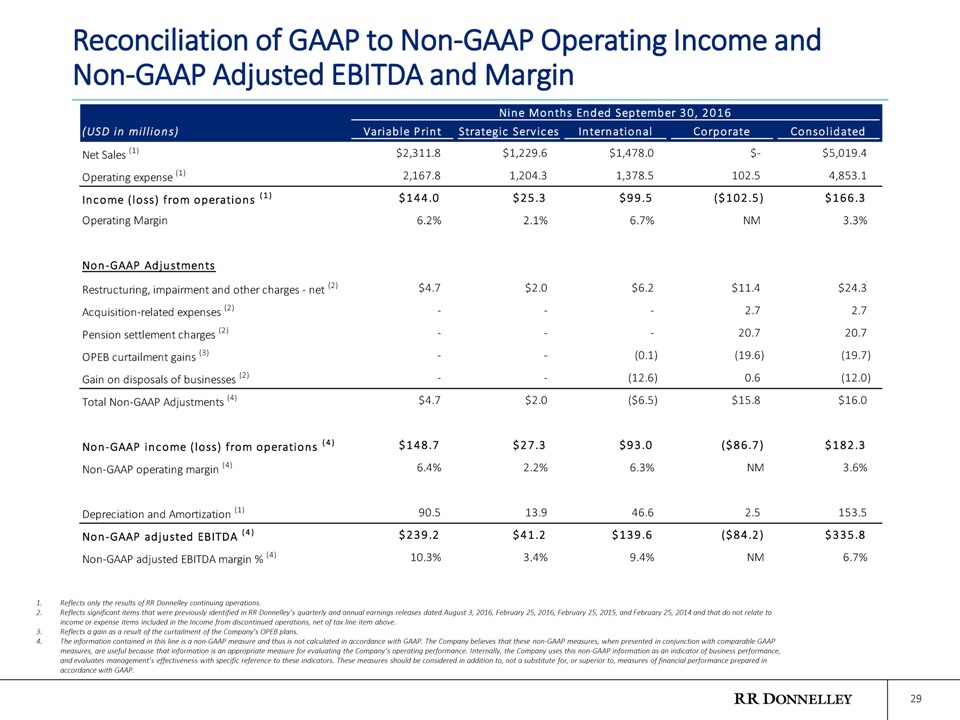
Reconciliation of GAAP to Non-GAAP Operating Income and Non-GAAP Adjusted EBITDA and Margin 28
1.
Reflects only the results of RR Donnelley continuing operations.
2.
Reflects significant items that were previously identified in RR Donnelley’s quarterly and annual earnings releases dated August 3, 2016, February 25, 2016, February 25, 2015, and February 25, 2014 and that do not relate to income or expense items included in the Income from discontinued operations, net of tax line item above.
3.
Reflects a gain as a result of the curtailment of the Company’s OPEB plans.
4.
The information contained in this line is a non-GAAP measure and thus is not calculated in accordance with GAAP. The Company believes that these non-GAAP measures, when presented in conjunction with comparable GAAP measures, are useful because that information is an appropriate measure for evaluating the Company’s operating performance. Internally, the Company uses this non-GAAP information as an indicator of business performance, and evaluates management’s effectiveness with specific reference to these indicators. These measures should be considered in addition to, not a substitute for, or superior to, measures of financial performance prepared in accordance with GAAP.
Three Months Ended September 30, 2016(USD in millions)Variable Print Strategic Services International Corporate Consolidated Net Sales (1)$790.3$445.0$495.7$-$1,731.0 Operating expense (1)740.2431.7460.015.11,647.0 Income (loss) from operations (1)$50.1$13.3$35.7($15.1)$84.0 Operating Margin 6.3%3.0%7.2% NM 4.9% Non-GAAP Adjustments Restructuring, impairment and other charges—net (2)$1.9$1.3$1.1$6.5$10.8 Acquisition-related expenses (2)—-0.70.7 Pension settlement charges (2)—-0.30.3 OPEB curtailment gains (3)—(0.1)(19.6)(19.7) Gain on disposals of businesses (2)—(0.3)0.60.3 Total Non-GAAP Adjustments (4)$1.9$1.3$0.7($11.5)($7.6) Non-GAAP income (loss) from operations (4)$52.0$14.6$36.4($26.6)$76.4 Non-GAAP operating margin (4)6.6%3.3%7.3% NM 4.4% Depreciation and Amortization (1)30.54.214.71.651.0 Non-GAAP adjusted EBITDA (4)$82.5$18.8$51.1($25.0)$127.4 Non-GAAP adjusted EBITDA margin % (4)10.4%4.2%10.3% NM 7.4%
|
|
Reconciliation of GAAP to Non-GAAP Operating Income and Non-GAAP Adjusted EBITDA and Margin 29
1.
Reflects only the results of RR Donnelley continuing operations.
2.
Reflects significant items that were previously identified in RR Donnelley’s quarterly and annual earnings releases dated August 3, 2016, February 25, 2016, February 25, 2015, and February 25, 2014 and that do not relate to income or expense items included in the Income from discontinued operations, net of tax line item above.
3.
Reflects a gain as a result of the curtailment of the Company’s OPEB plans.
4.
The information contained in this line is a non-GAAP measure and thus is not calculated in accordance with GAAP. The Company believes that these non-GAAP measures, when presented in conjunction with comparable GAAP measures, are useful because that information is an appropriate measure for evaluating the Company’s operating performance. Internally, the Company uses this non-GAAP information as an indicator of business performance, and evaluates management’s effectiveness with specific reference to these indicators. These measures should be considered in addition to, not a substitute for, or superior to, measures of financial performance prepared in accordance with GAAP.
Nine Months Ended September 30, 2016 (USD in millions)Variable PrintStrategic Services International Corporate Consolidated Net Sales (1)$2,311.8$1,229.6$1,478.0$-$5,019.4 Operating expense (1)2,167.81,204.31,378.5102.54,853.1 Income (loss) from operations (1)$144.0$25.3$99.5($102.5)$166.3 Operating Margin 6.2%2.1%6.7% NM 3.3% Non-GAAP Adjustments Restructuring, impairment and other charges—net (2)$4.7$2.0$6.2$11.4$24.3 Acquisition-related expenses (2)—-2.72.7 Pension settlement charges (2)—-20.720.7 OPEB curtailment gains (3)—(0.1)(19.6)(19.7) Gain on disposals of businesses (2)—(12.6)0.6(12.0) Total Non-GAAP Adjustments (4)$4.7$2.0($6.5)$15.8$16.0 Non-GAAP income (loss) from operations (4)$148.7$27.3$93.0($86.7)$182.3 Non-GAAP operating margin (4)6.4%2.2%6.3% NM 3.6% Depreciation and Amortization (1)90.513.946.62.5153.5 Non-GAAP adjusted EBITDA (4)$239.2$41.2$139.6($84.2)$335.8 Non-GAAP adjusted EBITDA margin % (4)10.3%3.4%9.4% NM 6.7%
|
|
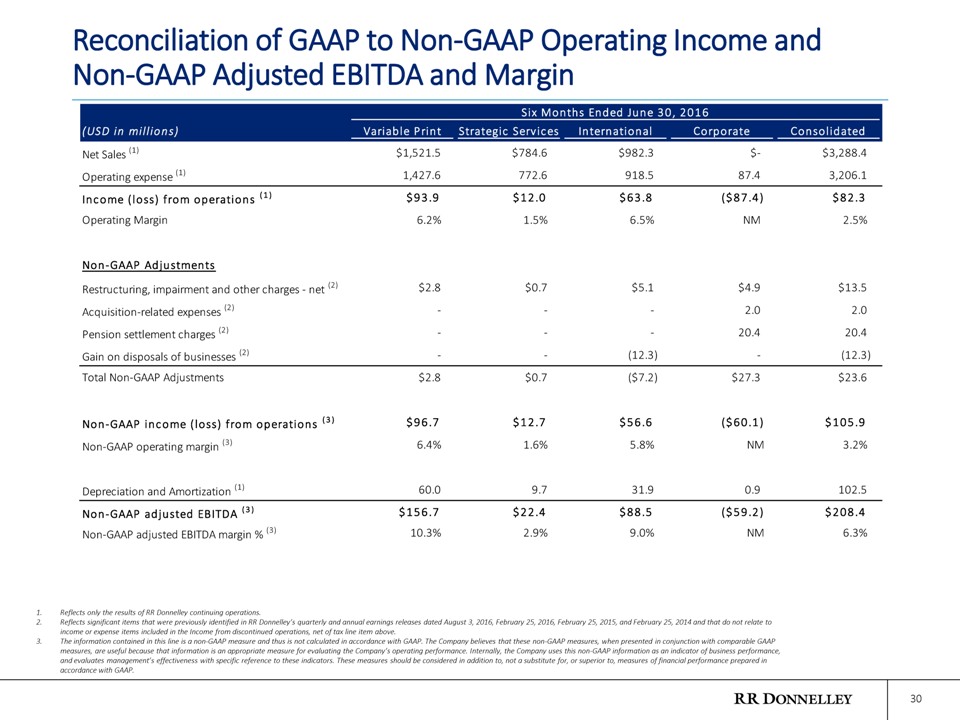
Reconciliation of GAAP to Non-GAAP Operating Income and Non-GAAP Adjusted EBITDA and Margin 30
1.
Reflects only the results of RR Donnelley continuing operations.
2.
Reflects significant items that were previously identified in RR Donnelley’s quarterly and annual earnings releases dated August 3, 2016, February 25, 2016, February 25, 2015, and February 25, 2014 and that do not relate to income or expense items included in the Income from discontinued operations, net of tax line item above.
3.
The information contained in this line is a non-GAAP measure and thus is not calculated in accordance with GAAP. The Company believes that these non-GAAP measures, when presented in conjunction with comparable GAAP measures, are useful because that information is an appropriate measure for evaluating the Company’s operating performance. Internally, the Company uses this non-GAAP information as an indicator of business performance, and evaluates management’s effectiveness with specific reference to these indicators. These measures should be considered in addition to, not a substitute for, or superior to, measures of financial performance prepared in accordance with GAAP.
Six Months Ended June 30, 2016 (USD in millions)Variable PrintStrategic Services International Corporate Consolidated Net Sales (1)$1,521.5$784.6$982.3$-$3,288.4 Operating expense (1)1,427.6772.6918.587.43,206.1 Income (loss) from operations (1)$93.9$12.0$63.8($87.4)$82.3 Operating Margin 6.2%1.5%6.5% NM 2.5% Non-GAAP Adjustments Restructuring, impairment and other charges—net (2)$2.8$0.7$5.1$4.9$13.5 Acquisition-related expenses (2)—-2.02.0 Pension settlement charges (2)—-20.420.4 Gain on disposals of businesses (2)—(12.3)-(12.3) Total Non-GAAP Adjustments $2.8$0.7($7.2)$27.3$23.6 Non-GAAP income (loss) from operations (3)$96.7$12.7$56.6($60.1)$105.9 Non-GAAP operating margin (3)6.4%1.6%5.8% NM 3.2% Depreciation and Amortization (1)60.09.731.90.9102.5 Non-GAAP adjusted EBITDA (3)$156.7$22.4$88.5($59.2)$208.4 Non-GAAP adjusted EBITDA margin % (3)10.3%2.9%9.0% NM 6.3%
|
|

Reconciliation of GAAP to Non-GAAP Operating Income and Non-GAAP Adjusted EBITDA and Margin 31
1.
Reflects only the results of RR Donnelley continuing operations.
2.
Reflects significant items that were previously identified in RR Donnelley’s quarterly and annual earnings releases dated August 3, 2016, February 25, 2016, February 25, 2015, and February 25, 2014 and that do not relate to income or expense items included in the Income from discontinued operations, net of tax line item above.
3.
The information contained in this line is a non-GAAP measure and thus is not calculated in accordance with GAAP. The Company believes that these non-GAAP measures, when presented in conjunction with comparable GAAP measures, are useful because that information is an appropriate measure for evaluating the Company’s operating performance. Internally, the Company uses this non-GAAP information as an indicator of business performance, and evaluates management’s effectiveness with specific reference to these indicators. These measures should be considered in addition to, not a substitute for, or superior to, measures of financial performance prepared in accordance with GAAP.
Twelve Months Ended December 31, 2015(USD in millions)Variable PrintStrategic Services International Corporate Consolidated Net Sales (1)$3,214.9$1,604.6$2,138.2$-$6,957.7 Operating expense (1)3,006.71,564.02,055.394.46,720.4 Income (loss) from operations (1)$208.2$40.6$82.9($94.4)$237.3 Operating Margin 6.5%2.5%3.9% NM 3.4% Non-GAAP Adjustments Restructuring, impairment and other charges—net (2)$9.1$5.8$43.6$4.2$62.7 Acquisition-related expenses (2)—-0.50.5 Total Non-GAAP Adjustments $9.1$5.8$43.6$4.7$63.2 Non-GAAP income (loss) from operations (3)$217.3$46.4$126.5($89.7)$300.5 Non-GAAP operating margin (3)6.8%2.9%5.9% NM 4.3% Depreciation and Amortization (1)134.119.575.73.2232.5 Non-GAAP adjusted EBITDA (3)$351.4$65.9$202.2($86.5)$533.0 Non-GAAP adjusted EBITDA margin % (3)10.9%4.1%9.5% NM 7.7%
|
|
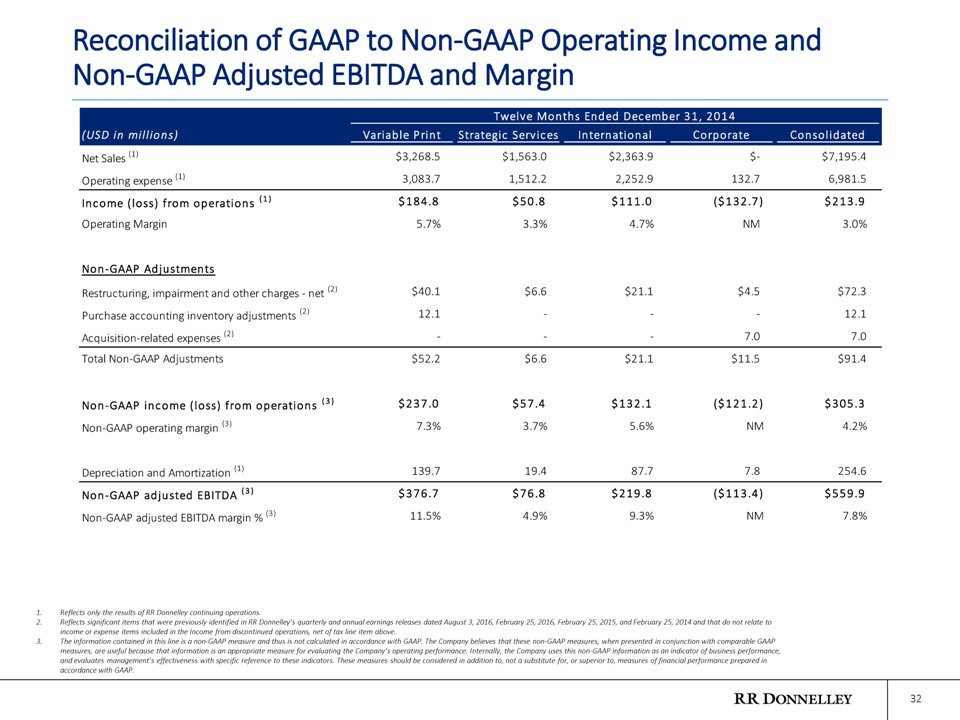
Reconciliation of GAAP to Non-GAAP Operating Income and Non-GAAP Adjusted EBITDA and Margin 32
1.
Reflects only the results of RR Donnelley continuing operations.
2.
Reflects significant items that were previously identified in RR Donnelley’s quarterly and annual earnings releases dated August 3, 2016, February 25, 2016, February 25, 2015, and February 25, 2014 and that do not relate to income or expense items included in the Income from discontinued operations, net of tax line item above.
3.
The information contained in this line is a non-GAAP measure and thus is not calculated in accordance with GAAP. The Company believes that these non-GAAP measures, when presented in conjunction with comparable GAAP measures, are useful because that information is an appropriate measure for evaluating the Company’s operating performance. Internally, the Company uses this non-GAAP information as an indicator of business performance, and evaluates management’s effectiveness with specific reference to these indicators. These measures should be considered in addition to, not a substitute for, or superior to, measures of financial performance prepared in accordance with GAAP.
Twelve Months Ended December 31, 2014(USD in millions)Variable PrintStrategic Services International Corporate Consolidated Net Sales (1)$3,268.5$1,563.0$2,363.9$-$7,195.4 Operating expense (1)3,083.71,512.22,252.9132.76,981.5 Income (loss) from operations (1)$184.8$50.8$111.0($132.7)$213.9 Operating Margin 5.7%3.3%4.7% NM 3.0% Non-GAAP Adjustments Restructuring, impairment and other charges—net (2)$40.1$6.6$21.1$4.5$72.3 Purchase accounting inventory adjustments (2)12.1—-12.1 Acquisition-related expenses (2)—-7.07.0 Total Non-GAAP Adjustments $52.2$6.6$21.1$11.5$91.4 Non-GAAP income (loss) from operations (3)$237.0$57.4$132.1($121.2)$305.3 Non-GAAP operating margin (3)7.3%3.7%5.6% NM 4.2% Depreciation and Amortization (1)139.719.487.77.8254.6 Non-GAAP adjusted EBITDA (3)$376.7$76.8$219.8($113.4)$559.9 Non-GAAP adjusted EBITDA margin % (3)11.5%4.9%9.3% NM 7.8%
|
|
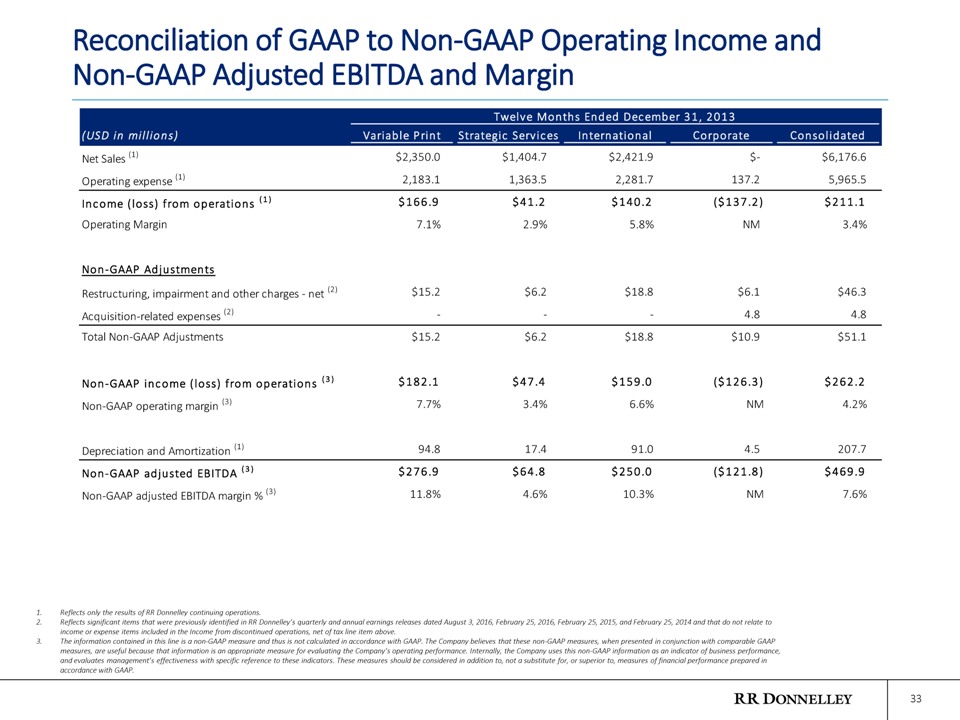
Reconciliation of GAAP to Non-GAAP Operating Income and Non-GAAP Adjusted EBITDA and Margin 33
1.
Reflects only the results of RR Donnelley continuing operations.
2.
Reflects significant items that were previously identified in RR Donnelley’s quarterly and annual earnings releases dated August 3, 2016, February 25, 2016, February 25, 2015, and February 25, 2014 and that do not relate to income or expense items included in the Income from discontinued operations, net of tax line item above.
3.
The information contained in this line is a non-GAAP measure and thus is not calculated in accordance with GAAP. The Company believes that these non-GAAP measures, when presented in conjunction with comparable GAAP measures, are useful because that information is an appropriate measure for evaluating the Company’s operating performance. Internally, the Company uses this non-GAAP information as an indicator of business performance, and evaluates management’s effectiveness with specific reference to these indicators. These measures should be considered in addition to, not a substitute for, or superior to, measures of financial performance prepared in accordance with GAAP.
Twelve Months Ended December 31, 2013(USD in millions)Variable PrintStrategic Services International Corporate Consolidated Net Sales (1)$2,350.0$1,404.7$2,421.9$-$6,176.6 Operating expense (1)2,183.11,363.52,281.7137.25,965.5 Income (loss) from operations (1)$166.9$41.2$140.2($137.2)$211.1 Operating Margin 7.1%2.9%5.8% NM 3.4% Non-GAAP Adjustments Restructuring, impairment and other charges—net (2)$15.2$6.2$18.8$6.1$46.3 Acquisition-related expenses (2)—-4.84.8 Total Non-GAAP Adjustments $15.2$6.2$18.8$10.9$51.1 Non-GAAP income (loss) from operations (3)$182.1$47.4$159.0($126.3)$262.2 Non-GAAP operating margin (3)7.7%3.4%6.6% NM 4.2% Depreciation and Amortization (1)94.817.491.04.5207.7 Non-GAAP adjusted EBITDA (3)$276.9$64.8$250.0($121.8)$469.9 Non-GAAP adjusted EBITDA margin % (3)11.8%4.6%10.3% NM 7.6%