Attached files
| file | filename |
|---|---|
| EX-99.1 - EXHIBIT 99.1 - Intrawest Resorts Holdings, Inc. | ex99_1.htm |
| 8-K - INTRAWEST RESORTS HOLDINGS, INC 8-K 11-3-2016 - Intrawest Resorts Holdings, Inc. | form8k.htm |
Exhibit 99.2

Intrawest Resorts Holdings, Inc.Fiscal 2017 First Quarter Earnings Call PresentationNovember 3, 2016
Important Information 2 This document contains forward-looking statements. These forward-looking statements are based on current expectations, estimates and projections about the industry and markets in which Intrawest operates as well as the Company’s beliefs and assumptions regarding our operations and financial performance, all of which are subject to known and unknown risks, uncertainties and other factors that may cause our actual results, performance or achievements, industry results or market trends to differ materially from those expressed or implied by such forward-looking statements. Therefore any statements contained herein that are not statements of historical fact may be forward-looking statements and should be evaluated as such. Without limiting the foregoing, words such as “Expects”, “Anticipates”, “Should”, “Intends”, “Plans”, “Believes”, “Seeks”, “Estimates”, “Projects”, and variations of such words and similar expressions are intended to identify such forward-looking statements. These statements are not guarantees of future performance and involve certain risks, uncertainties and assumptions which are difficult to predict, including those described in Part I - Item 1A, ‘‘Risk Factors’’ in our Annual Report on Form 10-K for the fiscal year ended June 30, 2016 filed with the Securities and Exchange Commission (“SEC”) on September 8, 2016, as may be revised in subsequent SEC filings. Therefore, actual outcomes and results may differ materially from what is expressed or forecasted in such forward-looking statements. The actual performance of Intrawest may differ from the budget, projections and returns set forth herein and may differ materially.Certain information contained herein has been obtained from published and non-published sources. Such information has not been independently verified by Intrawest. Except where otherwise indicated, the information provided herein is based on matters as they exist as of the date of preparation and not as of any future date, and will not be updated or otherwise revised to reflect information that subsequently becomes available, or circumstances existing or changes occurring after the date hereof.This presentation is part of the fiscal 2017 first quarter earnings call dated November 3, 2016, and includes certain non-GAAP financial measures, including Adjusted EBITDA (“Adj. EBITDA”). Non-GAAP financial measures such as Adj. EBITDA should be considered only as supplemental to, and not as superior to, financial measures prepared in accordance with GAAP. Please refer to our Current Report on Form 10-Q filed on November 3, 2016, with the SEC for a reconciliation of the non-GAAP financial measures included in this presentation to the most directly comparable financial measures prepared in accordance with GAAP.We use Adj. EBITDA as a measure of our operating performance. Adj. EBITDA is a supplemental non-GAAP financial measure.Our board of directors and management team focus on Adj. EBITDA as a key performance and compensation measure. Adj. EBITDA assists us in comparing our performance over various reporting periods because it removes from our operating results the impact of items that our management believes do not reflect our core operating performance. The compensation committee of our board of directors will determine the annual variable compensation for certain members of our management team, based in part, on Adj. EBITDA. Adj. EBITDA is not a substitute for net income (loss), income (loss) from continuing operations, cash flows from operating activities or any other measure prescribed by GAAP. There are limitations to using non-GAAP measures such as Adj. EBITDA. Although we believe that Adj. EBITDA can make an evaluation of our operating performance more consistent because it removes items that do not reflect our core operations, other companies in our industry may define Adj. EBITDA differently than we do. As a result, it may be difficult to use Adj. EBITDA to compare the performance of those companies to our performance. Adj. EBITDA should not be considered as a measure of the income generated by our business or discretionary cash available to us to invest in the growth of our business. Our management compensates for these limitations by reference to our GAAP results and using Adj. EBITDA as a supplemental measure.
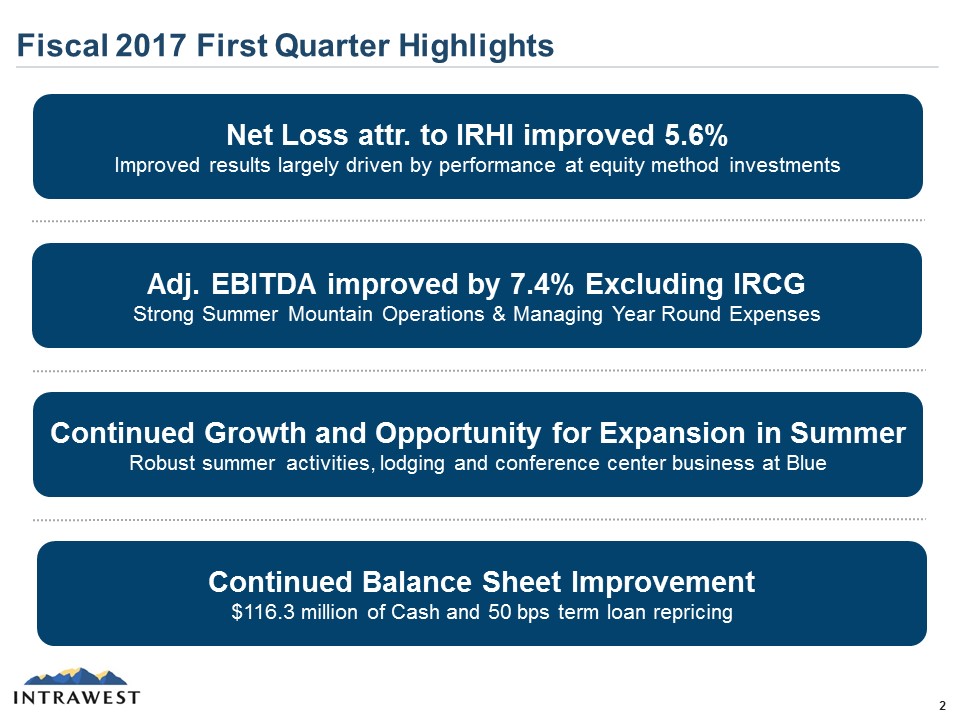
Fiscal 2017 First Quarter Highlights 3 Net Loss attr. to IRHI improved 5.6%Improved results largely driven by performance at equity method investments Continued Growth and Opportunity for Expansion in SummerRobust summer activities, lodging and conference center business at Blue Continued Balance Sheet Improvement $116.3 million of Cash and 50 bps term loan repricing Adj. EBITDA improved by 7.4% Excluding IRCGStrong Summer Mountain Operations & Managing Year Round Expenses
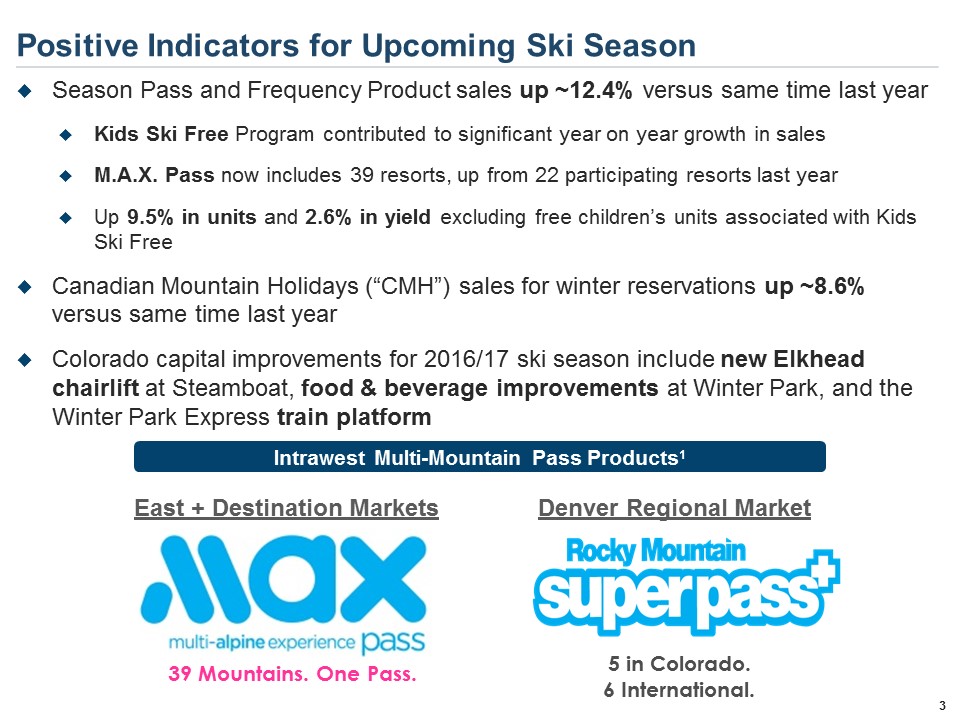
Positive Indicators for Upcoming Ski Season 3 Season Pass and Frequency Product sales up ~12.4% versus same time last yearKids Ski Free Program contributed to significant year on year growth in salesM.A.X. Pass now includes 39 resorts, up from 22 participating resorts last yearUp 9.5% in units and 2.6% in yield excluding free children’s units associated with Kids Ski FreeCanadian Mountain Holidays (“CMH”) sales for winter reservations up ~8.6% versus same time last yearColorado capital improvements for 2016/17 ski season include new Elkhead chairlift at Steamboat, food & beverage improvements at Winter Park, and the Winter Park Express train platform 39 Mountains. One Pass. 5 in Colorado. 6 International. East + Destination Markets Denver Regional Market Intrawest Multi-Mountain Pass Products1
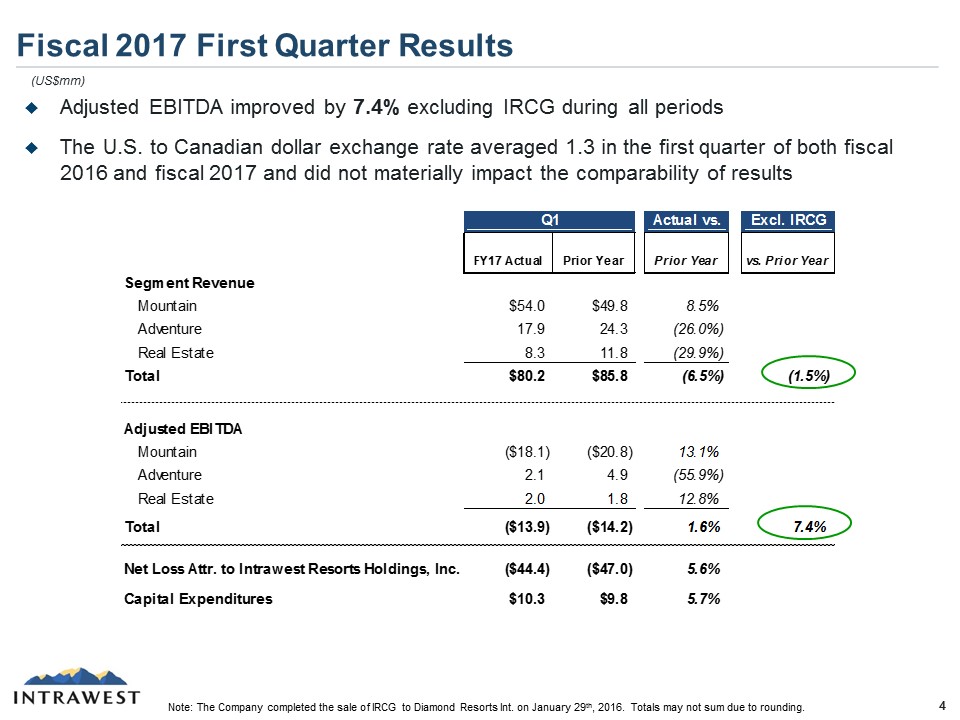
Fiscal 2017 First Quarter Results 5 (US$mm) Note: The Company completed the sale of IRCG to Diamond Resorts Int. on January 29th, 2016. Totals may not sum due to rounding. Adjusted EBITDA improved by 7.4% excluding IRCG during all periodsThe U.S. to Canadian dollar exchange rate averaged 1.3 in the first quarter of both fiscal 2016 and fiscal 2017 and did not materially impact the comparability of results