Attached files
| file | filename |
|---|---|
| EX-99.1 - EXHIBIT 99.1 - TRUIST FINANCIAL CORP | exh991bibleconfnov2016.htm |
| 8-K - 8-K - TRUIST FINANCIAL CORP | form8kbibleconfnov2016.htm |

2
Agenda
BB&T vision and mission
BB&T overview
Performance recap
Balancing expense objectives
Well-positioned for the future

4
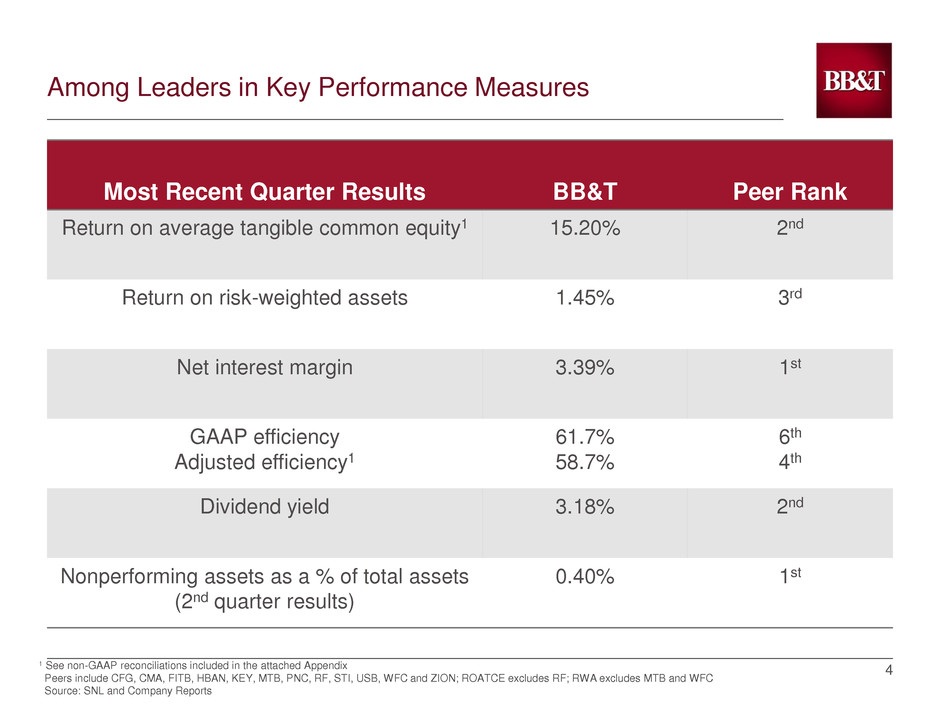
Among Leaders in Key Performance Measures
Most Recent Quarter Results BB&T Peer Rank
Return on average tangible common equity1 15.20% 2nd
Return on risk-weighted assets 1.45% 3rd
Net interest margin 3.39% 1st
GAAP efficiency
Adjusted efficiency1
61.7%
58.7%
6th
4th
Dividend yield 3.18% 2nd
Nonperforming assets as a % of total assets
(2nd quarter results)
0.40% 1st
1 See non-GAAP reconciliations included in the attached Appendix
Peers include CFG, CMA, FITB, HBAN, KEY, MTB, PNC, RF, STI, USB, WFC and ZION; ROATCE excludes RF; RWA excludes MTB and WFC
Source: SNL and Company Reports
5
BB&T is…
A values-driven highly profitable growth organization. While we have had a very
successful merger history, our primary focus is on organic growth; nonetheless, we are
well positioned for strategic opportunities.
Our fundamental strategy is to deliver the best value proposition in our markets.
Recognizing value is a function of quality to price, our focus is on delivering high quality
client service resulting in the Perfect Client Experience.
Our over-arching purpose is to achieve our vision and mission, consistent with our
values, with the ultimate goal of maximizing shareholder returns.
6
1 Excludes home office deposits
2 Deposit Market Share data as of June 30, 2016
Source: FactSet, FDIC, SNL DataSource
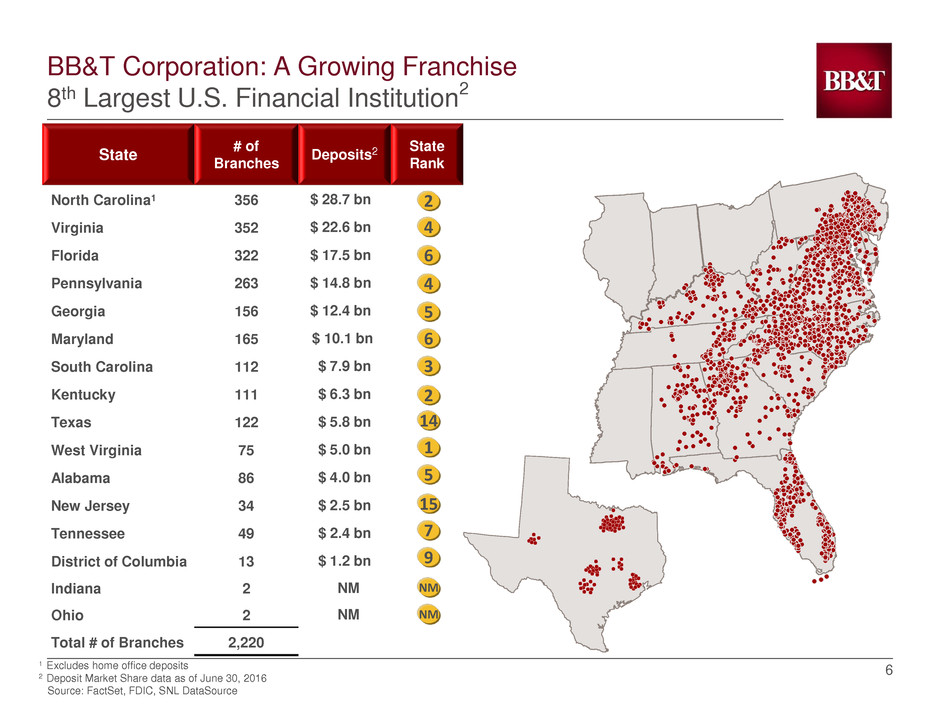
State
# of
Branches
Deposits2
State
Rank
North Carolina1 356 $ 28.7 bn
Virginia 352 $ 22.6 bn
Florida 322 $ 17.5 bn
Pennsylvania 263 $ 14.8 bn
Georgia 156 $ 12.4 bn
Maryland 165 $ 10.1 bn
South Carolina 112 $ 7.9 bn
Kentucky 111 $ 6.3 bn
Texas 122 $ 5.8 bn
West Virginia 75 $ 5.0 bn
Alabama 86 $ 4.0 bn
New Jersey 34 $ 2.5 bn
Tennessee 49 $ 2.4 bn
District of Columbia 13 $ 1.2 bn
Indiana 2 NM
Ohio 2 NM
Total # of Branches 2,220
BB&T Corporation: A Growing Franchise
8th Largest U.S. Financial Institution2
15
7
NM
4
2
6
4
2
14
3
5
1
5
NM
6
9
7
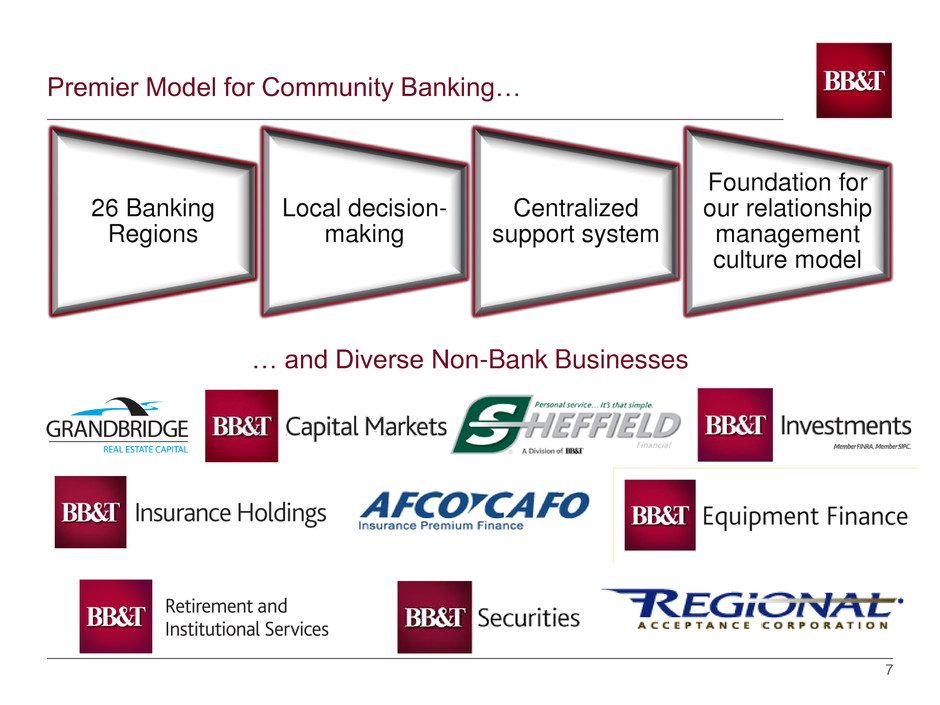
Premier Model for Community Banking…
26 Banking
Regions
Local decision-
making
Centralized
support system
Foundation for
our relationship
management
culture model
… and Diverse Non-Bank Businesses
8
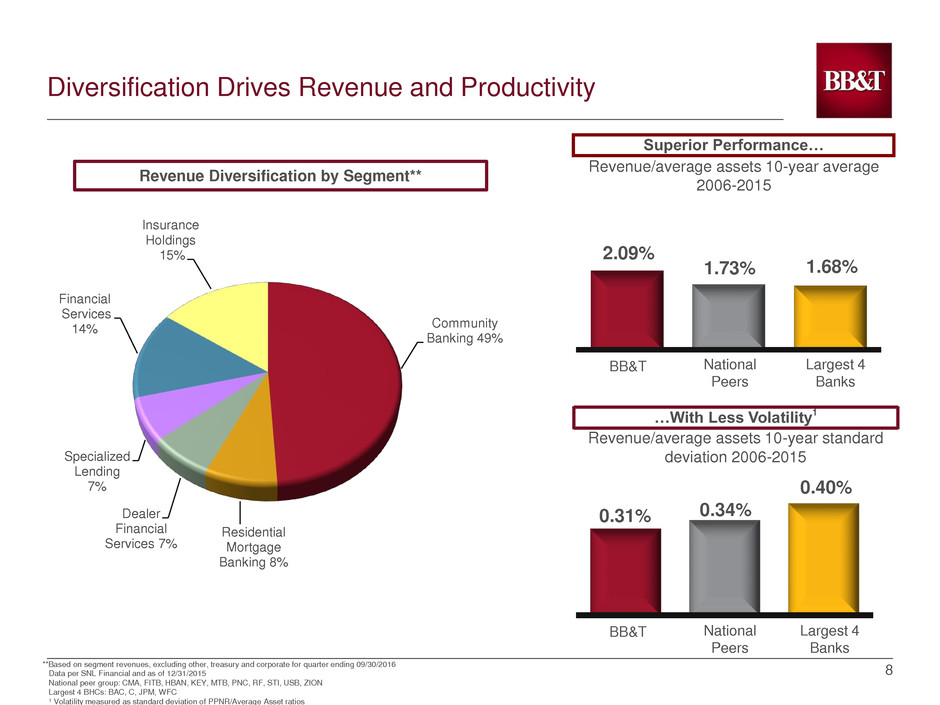
Diversification Drives Revenue and Productivity
**Based on segment revenues, excluding other, treasury and corporate for quarter ending 09/30/2016
2.09%
1.73% 1.68%
Superior Performance…
BB&T National
Peers
Largest 4
Banks
Revenue/average assets 10-year average
2006-2015
…With Less Volatility1
0.31% 0.34%
0.40%
Revenue/average assets 10-year standard
deviation 2006-2015
BB&T National
Peers
Largest 4
Banks
Data per SNL Financial and as of 12/31/2015
National peer group: CMA, FITB, HBAN, KEY, MTB, PNC, RF, STI, USB, ZION
Largest 4 BHCs: BAC, C, JPM, WFC
1 Volatility measured as standard deviation of PPNR/Average Asset ratios
Revenue Diversification by Segment**
Community
Banking 49%
Residential
Mortgage
Banking 8%
Dealer
Financial
Services 7%
Specialized
Lending
7%
Financial
Services
14%
Insurance
Holdings
15%
9
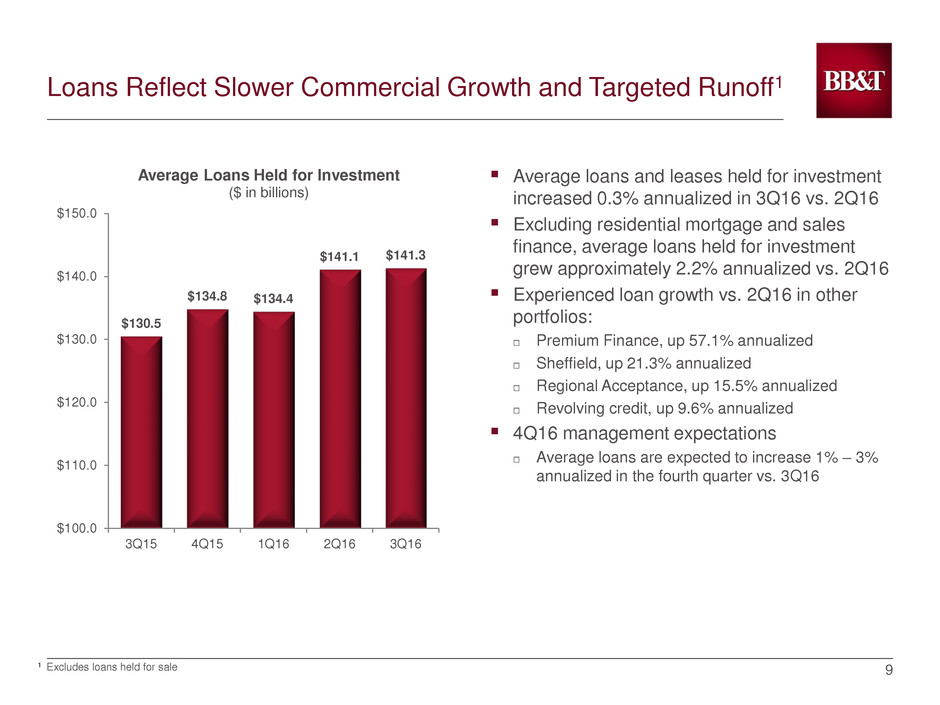
Loans Reflect Slower Commercial Growth and Targeted Runoff1
Average loans and leases held for investment
increased 0.3% annualized in 3Q16 vs. 2Q16
Excluding residential mortgage and sales
finance, average loans held for investment
grew approximately 2.2% annualized vs. 2Q16
Experienced loan growth vs. 2Q16 in other
portfolios:
Premium Finance, up 57.1% annualized
Sheffield, up 21.3% annualized
Regional Acceptance, up 15.5% annualized
Revolving credit, up 9.6% annualized
4Q16 management expectations
Average loans are expected to increase 1% – 3%
annualized in the fourth quarter vs. 3Q16
1 Excludes loans held for sale
$130.5
$134.8 $134.4
$141.1 $141.3
$100.0
$110.0
$120.0
$130.0
$140.0
$150.0
3Q15 4Q15 1Q16 2Q16 3Q16
Average Loans Held for Investment
($ in billions)
10
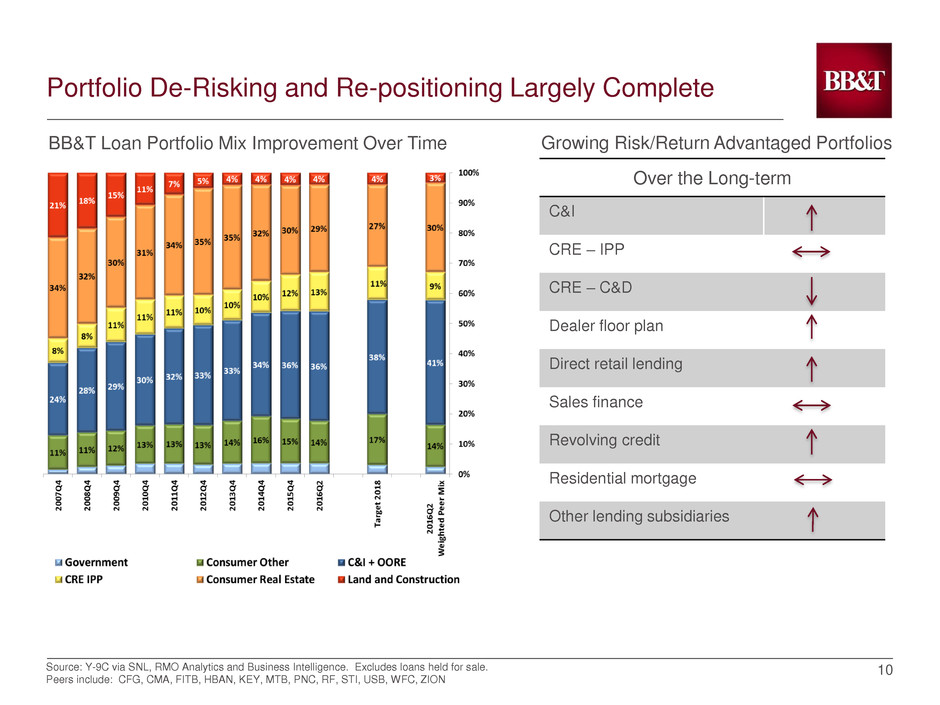
Portfolio De-Risking and Re-positioning Largely Complete
Source: Y-9C via SNL, RMO Analytics and Business Intelligence. Excludes loans held for sale.
Peers include: CFG, CMA, FITB, HBAN, KEY, MTB, PNC, RF, STI, USB, WFC, ZION
BB&T Loan Portfolio Mix Improvement Over Time
Over the Long-term
C&I
CRE – IPP
CRE – C&D
Dealer floor plan
Direct retail lending
Sales finance
Revolving credit
Residential mortgage
Other lending subsidiaries
Growing Risk/Return Advantaged Portfolios
11
Executing on Credit Portfolio Strategies
Allocating more
capital to risk / return
advantaged business
units
Improving the risk
adjusted return
within business
units
Increasing client
profitability and
retention by satisfying
all of their financial
needs
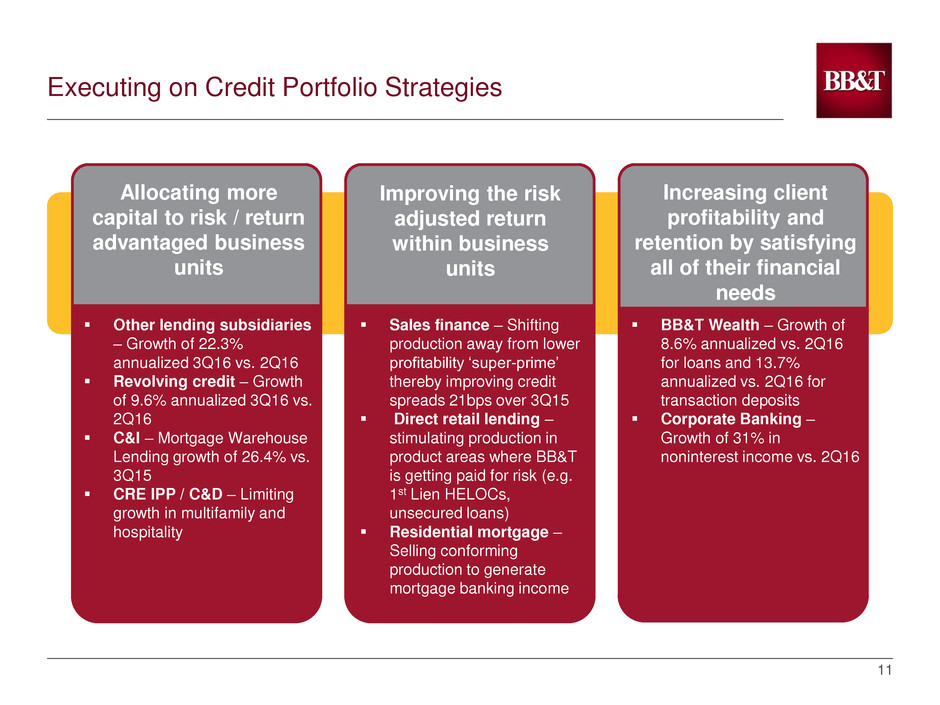
Other lending subsidiaries
– Growth of 22.3%
annualized 3Q16 vs. 2Q16
Revolving credit – Growth
of 9.6% annualized 3Q16 vs.
2Q16
C&I – Mortgage Warehouse
Lending growth of 26.4% vs.
3Q15
CRE IPP / C&D – Limiting
growth in multifamily and
hospitality
Sales finance – Shifting
production away from lower
profitability ‘super-prime’
thereby improving credit
spreads 21bps over 3Q15
Direct retail lending –
stimulating production in
product areas where BB&T
is getting paid for risk (e.g.
1st Lien HELOCs,
unsecured loans)
Residential mortgage –
Selling conforming
production to generate
mortgage banking income
BB&T Wealth – Growth of
8.6% annualized vs. 2Q16
for loans and 13.7%
annualized vs. 2Q16 for
transaction deposits
Corporate Banking –
Growth of 31% in
noninterest income vs. 2Q16
12
Noninterest-Bearing Deposits Reflect Strong Growth
$143.8
$148.5
$149.9
$160.3 $159.5
0.24% 0.24%
0.25%
0.23%
0.23%
0.20%
0.25%
0.30%
0.35%
0.40%
$120.0
$130.0
$140.0
$150.0
$160.0
$170.0
3Q15 4Q15 1Q16 2Q16 3Q16
Total Interest-Bearing Deposit Cost
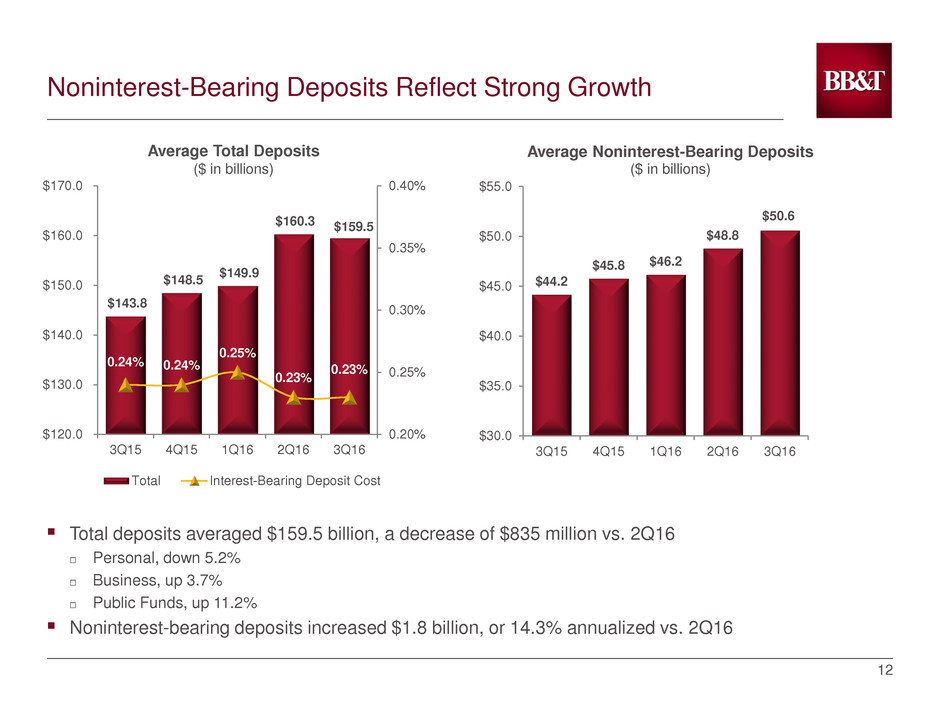
Total deposits averaged $159.5 billion, a decrease of $835 million vs. 2Q16
Personal, down 5.2%
Business, up 3.7%
Public Funds, up 11.2%
Noninterest-bearing deposits increased $1.8 billion, or 14.3% annualized vs. 2Q16
Average Total Deposits
($ in billions)
$44.2
$45.8 $46.2
$48.8
$50.6
$30.0
$35.0
$40.0
$45.0
$50.0
$55.0
3Q15 4Q15 1Q16 2Q16 3Q16
Average Noninterest-Bearing Deposits
($ in billions)
13
Credit Quality Reflects Seasonal Increase1
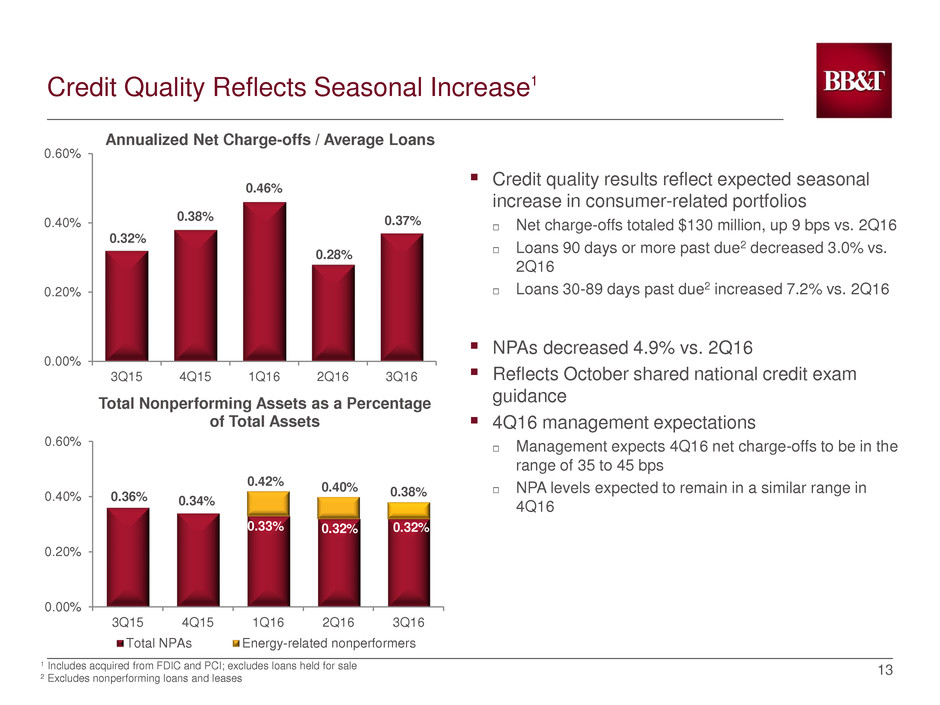
Credit quality results reflect expected seasonal
increase in consumer-related portfolios
Net charge-offs totaled $130 million, up 9 bps vs. 2Q16
Loans 90 days or more past due2 decreased 3.0% vs.
2Q16
Loans 30-89 days past due2 increased 7.2% vs. 2Q16
NPAs decreased 4.9% vs. 2Q16
Reflects October shared national credit exam
guidance
4Q16 management expectations
Management expects 4Q16 net charge-offs to be in the
range of 35 to 45 bps
NPA levels expected to remain in a similar range in
4Q16
0.36% 0.34%
0.42%
0.32%
0.38%
0.33%
0.40%
0.32%
0.00%
0.20%
0.40%
0.60%
3Q15 4Q15 1Q16 2Q16 3Q16
Total Nonperforming Assets as a Percentage
of Total Assets
Total NPAs Energy-related nonperformers
Annualized Net Charge-offs / Average Loans
1 Includes acquired from FDIC and PCI; excludes loans held for sale
2 Excludes nonperforming loans and leases
0.32%
0.38%
0.46%
0.28%
0.37%
0.00%
0.20%
0.40%
0.60%
3Q15 4Q15 1Q16 2Q16 3Q16
14
Net Interest Margin Decreases Slightly to 3.39%
3.35% 3.35%
3.43% 3.41% 3.39%
3.15% 3.12%
3.18% 3.16% 3.17%
2.96% 2.96% 2.99% 2.95% 2.96%
2.50%
3.00%
3.50%
4.00%
3Q15 4Q15 1Q16 2Q16 3Q16
Reported NIM Core NIM Peers
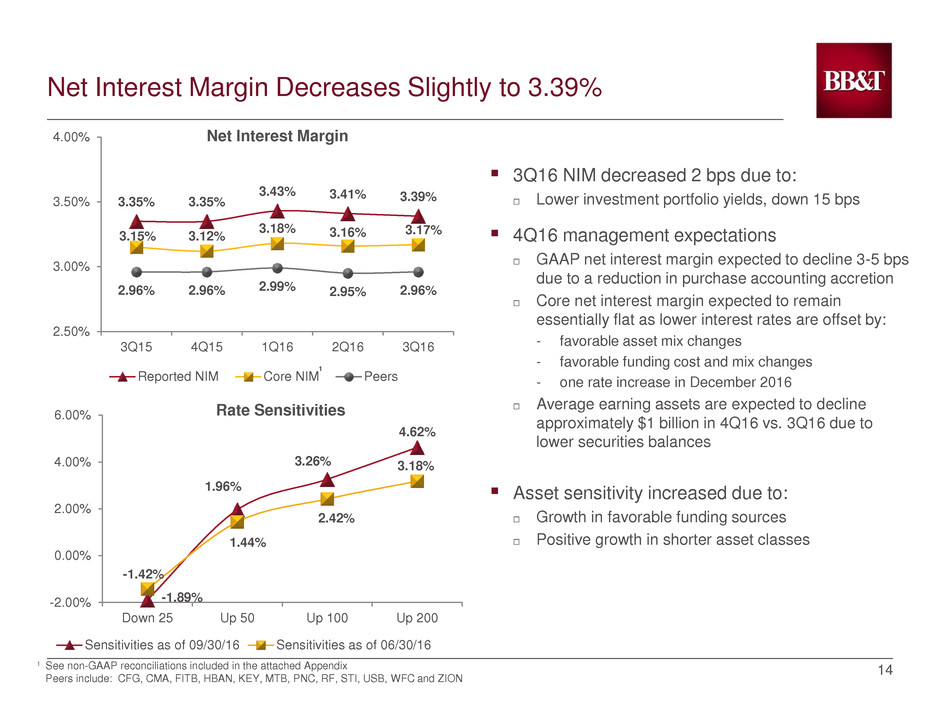
3Q16 NIM decreased 2 bps due to:
Lower investment portfolio yields, down 15 bps
4Q16 management expectations
GAAP net interest margin expected to decline 3-5 bps
due to a reduction in purchase accounting accretion
Core net interest margin expected to remain
essentially flat as lower interest rates are offset by:
- favorable asset mix changes
- favorable funding cost and mix changes
- one rate increase in December 2016
Average earning assets are expected to decline
approximately $1 billion in 4Q16 vs. 3Q16 due to
lower securities balances
Asset sensitivity increased due to:
Growth in favorable funding sources
Positive growth in shorter asset classes
Net Interest Margin
1
-1.89%
1.96%
3.26%
4.62%
-1.42%
1.44%
2.42%
3.18%
-2.00%
0.00%
2.00%
4.00%
6.00%
Down 25 Up 50 Up 100 Up 200
Sensitivities as of 09/30/16 Sensitivities as of 06/30/16
Rate Sensitivities
1 See non-GAAP reconciliations included in the attached Appendix
Peers include: CFG, CMA, FITB, HBAN, KEY, MTB, PNC, RF, STI, USB, WFC and ZION
15
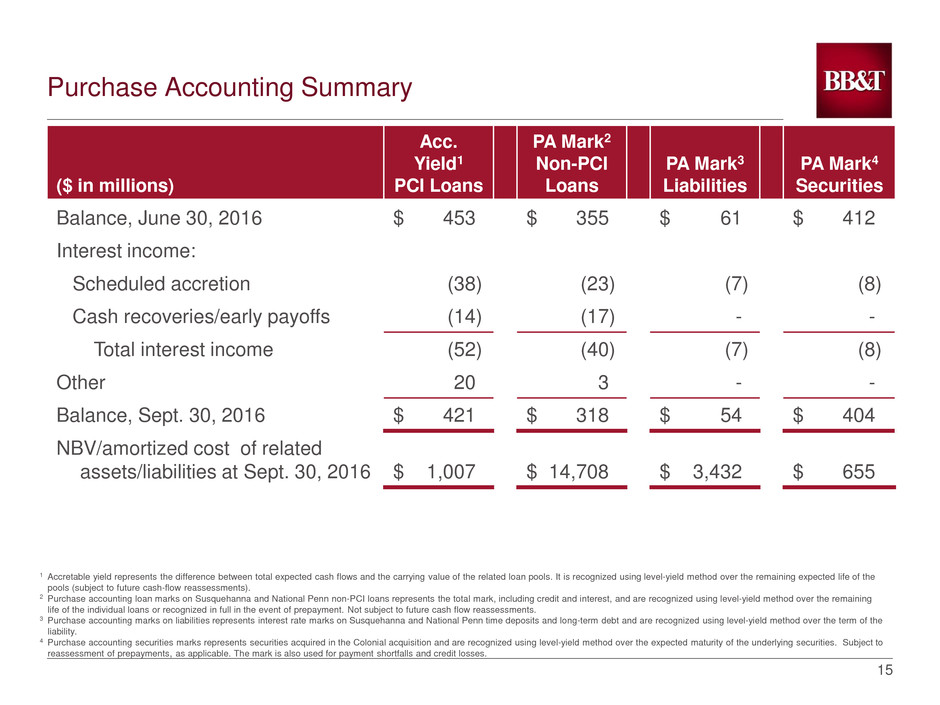
Purchase Accounting Summary
($ in millions)
Acc.
Yield1
PCI Loans
PA Mark2
Non-PCI
Loans
PA Mark3
Liabilities
PA Mark4
Securities
Balance, June 30, 2016 $ 453 $ 355 $ 61 $ 412
Interest income:
Scheduled accretion (38) (23) (7) (8)
Cash recoveries/early payoffs (14) (17) - -
Total interest income (52) (40) (7) (8)
Other 20 3 - -
Balance, Sept. 30, 2016 $ 421 $ 318 $ 54 $ 404
NBV/amortized cost of related
assets/liabilities at Sept. 30, 2016 $ 1,007 $ 14,708 $ 3,432 $ 655
1 Accretable yield represents the difference between total expected cash flows and the carrying value of the related loan pools. It is recognized using level-yield method over the remaining expected life of the
pools (subject to future cash-flow reassessments).
2 Purchase accounting loan marks on Susquehanna and National Penn non-PCI loans represents the total mark, including credit and interest, and are recognized using level-yield method over the remaining
life of the individual loans or recognized in full in the event of prepayment. Not subject to future cash flow reassessments.
3 Purchase accounting marks on liabilities represents interest rate marks on Susquehanna and National Penn time deposits and long-term debt and are recognized using level-yield method over the term of the
liability.
4 Purchase accounting securities marks represents securities acquired in the Colonial acquisition and are recognized using level-yield method over the expected maturity of the underlying securities. Subject to
reassessment of prepayments, as applicable. The mark is also used for payment shortfalls and credit losses.
16
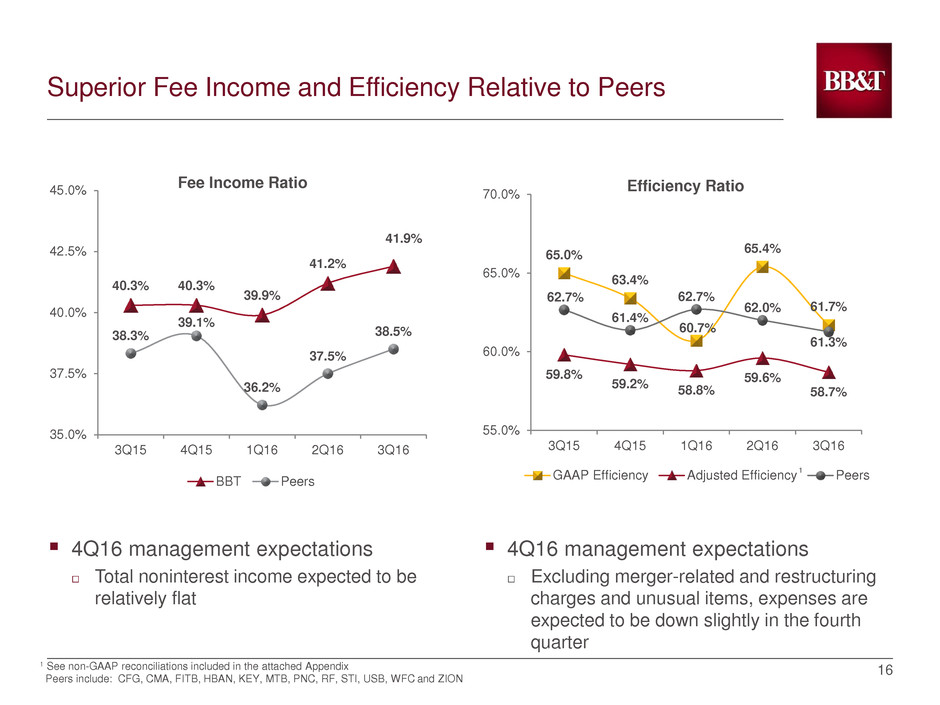
4Q16 management expectations
Total noninterest income expected to be
relatively flat
40.3% 40.3%
39.9%
41.2%
41.9%
38.3%
39.1%
36.2%
37.5%
38.5%
35.0%
37.5%
40.0%
42.5%
45.0%
3Q15 4Q15 1Q16 2Q16 3Q16
Fee Income Ratio
BBT Peers
1 See non-GAAP reconciliations included in the attached Appendix
Peers include: CFG, CMA, FITB, HBAN, KEY, MTB, PNC, RF, STI, USB, WFC and ZION
Superior Fee Income and Efficiency Relative to Peers
65.0%
63.4%
60.7%
65.4%
61.7%
59.8%
59.2% 58.8%
59.6%
58.7%
62.7%
61.4%
62.7%
62.0%
61.3%
55.0%
60.0%
65.0%
70.0%
3Q15 4Q15 1Q16 2Q16 3Q16
Efficiency Ratio
GAAP Efficiency Adjusted Efficiency Peers
4Q16 management expectations
Excluding merger-related and restructuring
charges and unusual items, expenses are
expected to be down slightly in the fourth
quarter
1
17
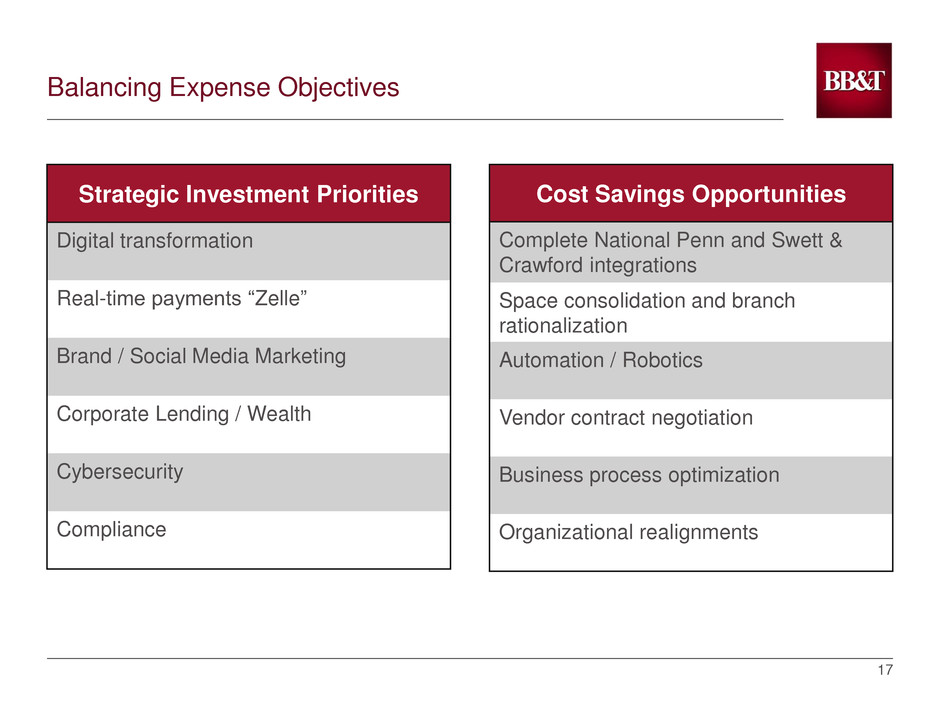
Balancing Expense Objectives
Strategic Investment Priorities
Digital transformation
Real-time payments “Zelle”
Brand / Social Media Marketing
Corporate Lending / Wealth
Cybersecurity
Compliance
Cost Savings Opportunities
Complete National Penn and Swett &
Crawford integrations
Space consolidation and branch
rationalization
Automation / Robotics
Vendor contract negotiation
Business process optimization
Organizational realignments
18
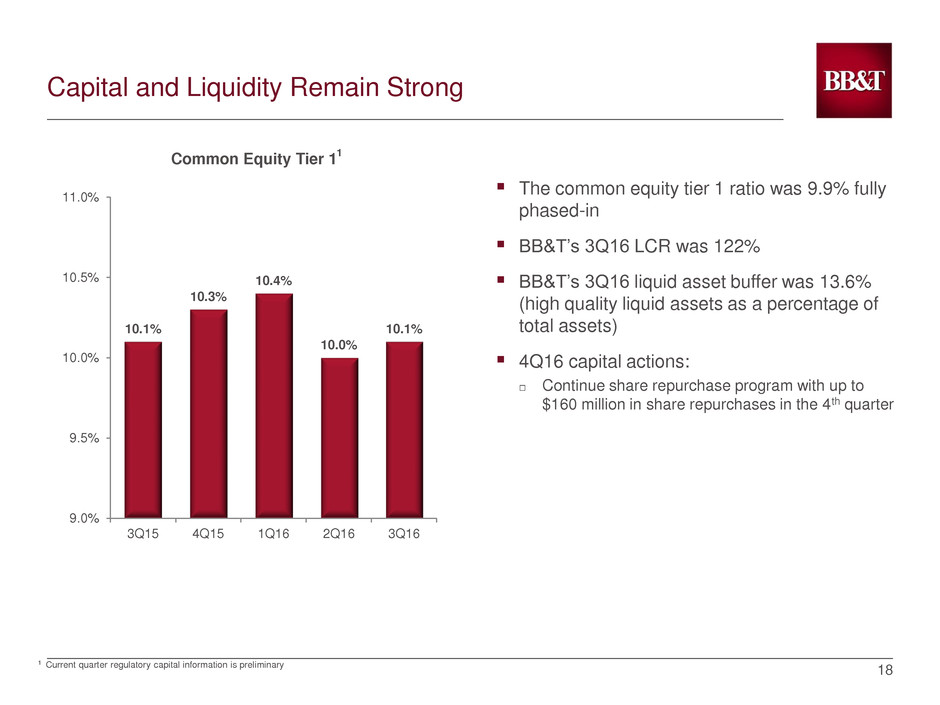
Capital and Liquidity Remain Strong
10.1%
10.3%
10.4%
10.0%
10.1%
9.0%
9.5%
10.0%
10.5%
11.0%
3Q15 4Q15 1Q16 2Q16 3Q16
The common equity tier 1 ratio was 9.9% fully
phased-in
BB&T’s 3Q16 LCR was 122%
BB&T’s 3Q16 liquid asset buffer was 13.6%
(high quality liquid assets as a percentage of
total assets)
4Q16 capital actions:
Continue share repurchase program with up to
$160 million in share repurchases in the 4th quarter
1 Current quarter regulatory capital information is preliminary
Common Equity Tier 1
1
19
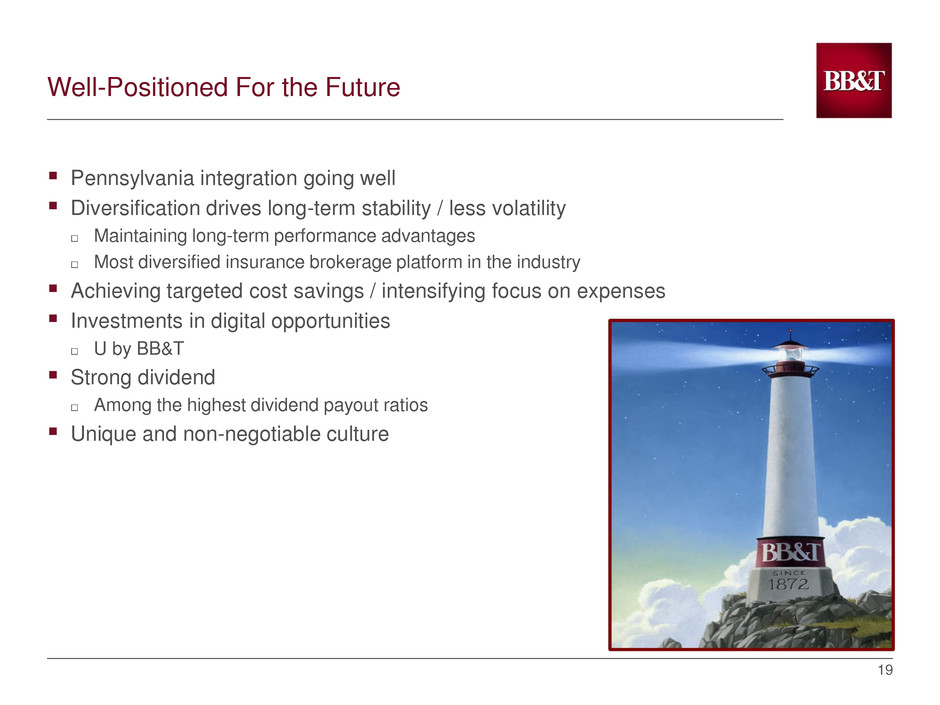
Well-Positioned For the Future
Pennsylvania integration going well
Diversification drives long-term stability / less volatility
Maintaining long-term performance advantages
Most diversified insurance brokerage platform in the industry
Achieving targeted cost savings / intensifying focus on expenses
Investments in digital opportunities
U by BB&T
Strong dividend
Among the highest dividend payout ratios
Unique and non-negotiable culture
20
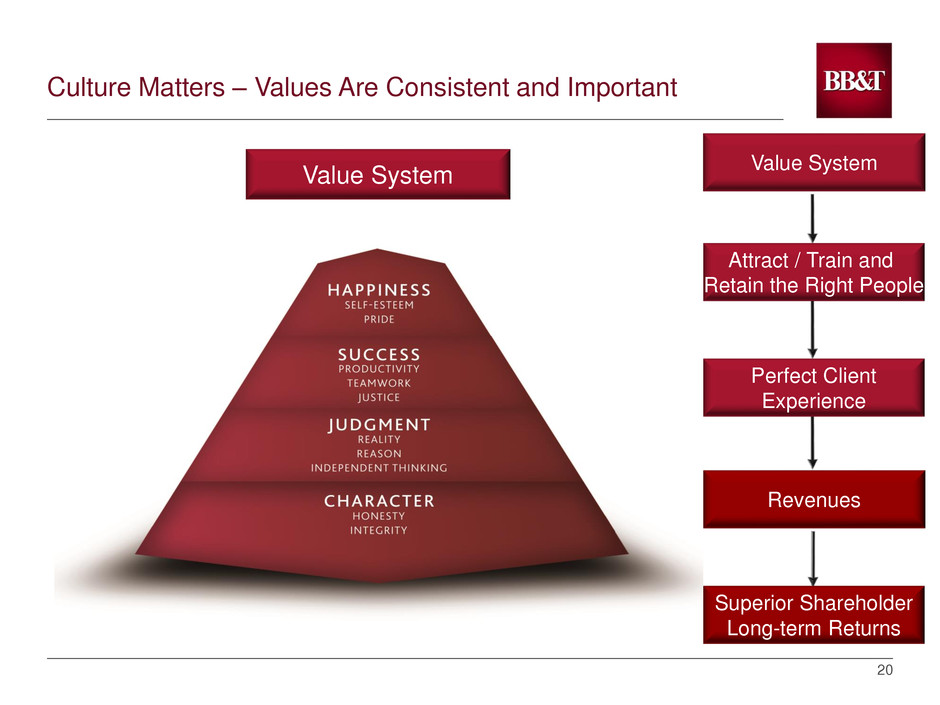
Value System
Revenues
Superior Shareholder
Long-term Returns
Value System
Attract / Train and
Retain the Right People
Perfect Client
Experience
Culture Matters – Values Are Consistent and Important

Appendix
23
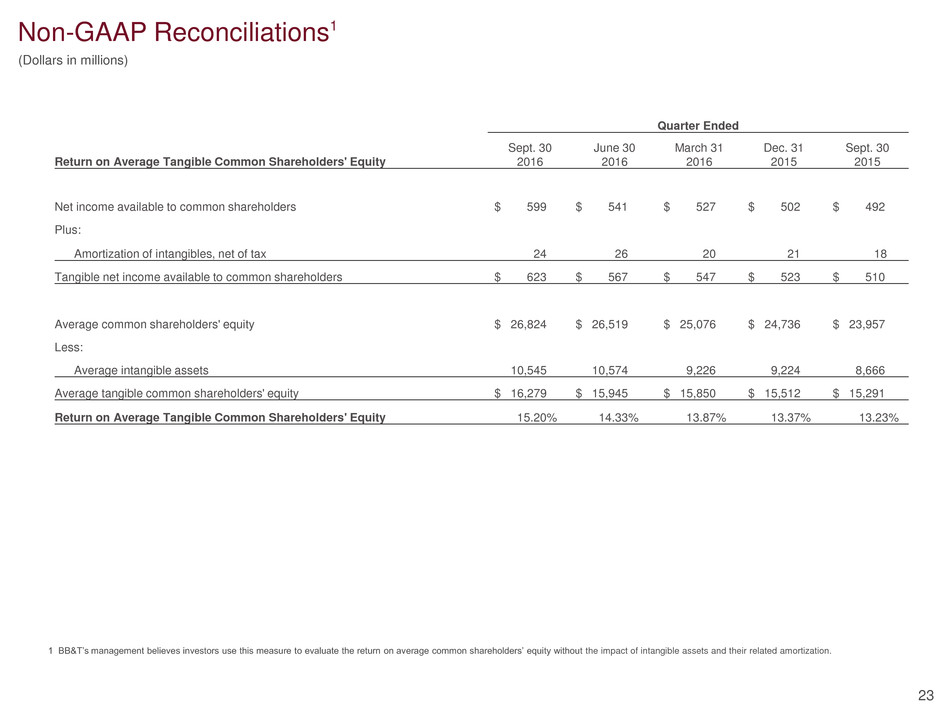
1 BB&T’s management believes investors use this measure to evaluate the return on average common shareholders’ equity without the impact of intangible assets and their related amortization.
Non-GAAP Reconciliations1
(Dollars in millions)
Quarter Ended
Sept. 30 June 30 March 31 Dec. 31 Sept. 30
Return on Average Tangible Common Shareholders' Equity 2016 2016 2016 2015 2015
Net income available to common shareholders $ 599 $ 541 $ 527 $ 502 $ 492
Plus:
Amortization of intangibles, net of tax 24 26 20 21 18
Tangible net income available to common shareholders $ 623 $ 567 $ 547 $ 523 $ 510
Average common shareholders' equity $ 26,824 $ 26,519 $ 25,076 $ 24,736 $ 23,957
Less:
Average intangible assets 10,545 10,574 9,226 9,224 8,666
Average tangible common shareholders' equity $ 16,279 $ 15,945 $ 15,850 $ 15,512 $ 15,291
Return on Average Tangible Common Shareholders' Equity 15.20% 14.33% 13.87% 13.37% 13.23%
Non-GAAP Reconciliations1
24
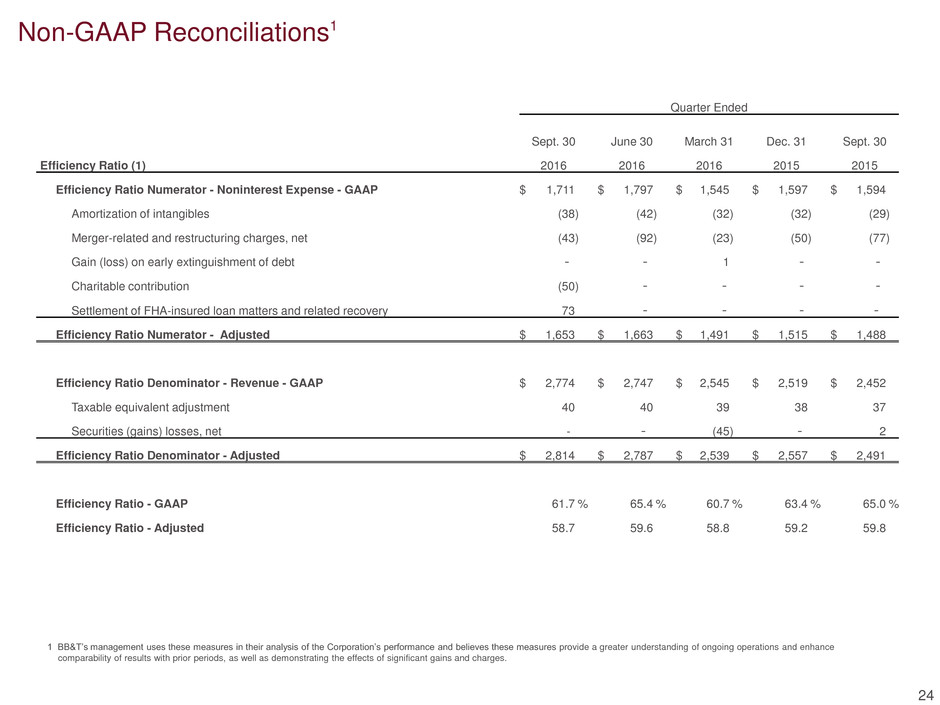
1 BB&T’s management uses these measures in their analysis of the Corporation’s performance and believes these measures provide a greater understanding of ongoing operations and enhance
comparability of results with prior periods, as well as demonstrating the effects of significant gains and charges.
Quarter Ended
Sept. 30 June 30 March 31 Dec. 31 Sept. 30
Efficiency Ratio (1) 2016 2016 2016 2015 2015
Efficiency Ratio Numerator - Noninterest Expense - GAAP $ 1,711
$ 1,797
$ 1,545
$ 1,597
$ 1,594
Amortization of intangibles (38 ) (42 ) (32 ) (32 ) (29 )
Merger-related and restructuring charges, net (43 ) (92 ) (23 ) (50 ) (77 )
Gain (loss) on early extinguishment of debt -
-
1
-
-
Charitable contribution (50 ) -
-
-
-
Settlement of FHA-insured loan matters and related recovery 73
-
-
-
-
Efficiency Ratio Numerator - Adjusted $ 1,653
$ 1,663
$ 1,491
$ 1,515
$ 1,488
Efficiency Ratio Denominator - Revenue - GAAP $ 2,774
$ 2,747
$ 2,545
$ 2,519
$ 2,452
Taxable equivalent adjustment 40
40
39
38
37
Securities (gains) losses, net -
-
(45 ) -
2
Efficiency Ratio Denominator - Adjusted $ 2,814
$ 2,787
$ 2,539
$ 2,557
$ 2,491
Efficiency Ratio - GAAP 61.7 % 65.4 % 60.7 % 63.4 % 65.0 %
Efficiency Ratio - Adjusted 58.7 59.6 58.8 59.2 59.8
Non-GAAP Reconciliations1
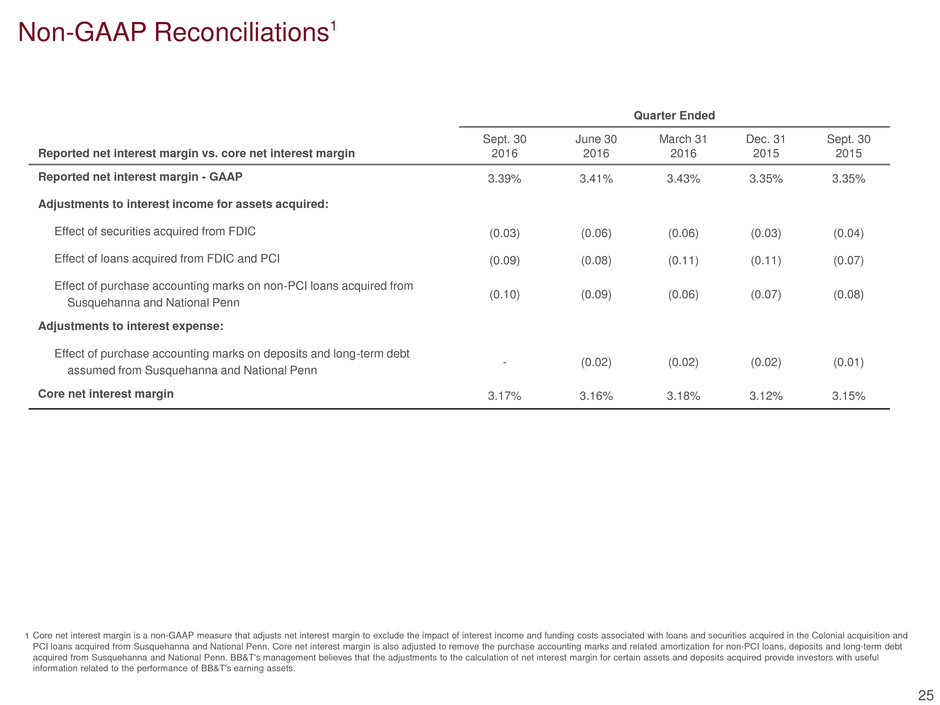
Quarter Ended
Reported net interest margin vs. core net interest margin
Sept. 30
2016
June 30
2016
March 31
2016
Dec. 31
2015
Sept. 30
2015
Reported net interest margin - GAAP 3.39% 3.41% 3.43% 3.35% 3.35%
Adjustments to interest income for assets acquired:
Effect of securities acquired from FDIC (0.03) (0.06) (0.06) (0.03) (0.04)
Effect of loans acquired from FDIC and PCI (0.09) (0.08) (0.11) (0.11) (0.07)
Effect of purchase accounting marks on non-PCI loans acquired from
Susquehanna and National Penn
(0.10) (0.09) (0.06) (0.07) (0.08)
Adjustments to interest expense:
Effect of purchase accounting marks on deposits and long-term debt
assumed from Susquehanna and National Penn
- (0.02) (0.02) (0.02) (0.01)
Core net interest margin 3.17% 3.16% 3.18% 3.12% 3.15%
25
Core net interest margin is a non-GAAP measure that adjusts net interest margin to exclude the impact of interest income and funding costs associated with loans and securities acquired in the Colonial acquisition and
PCI loans acquired from Susquehanna and National Penn. Core net interest margin is also adjusted to remove the purchase accounting marks and related amortization for non-PCI loans, deposits and long-term debt
acquired from Susquehanna and National Penn. BB&T's management believes that the adjustments to the calculation of net interest margin for certain assets and deposits acquired provide investors with useful
information related to the performance of BB&T's earning assets.
1
