Attached files
| file | filename |
|---|---|
| EX-99.1 - EXHIBIT 99.1 - AMAG PHARMACEUTICALS, INC. | ex991q32016earningsrelease.htm |
| 8-K - 8-K - AMAG PHARMACEUTICALS, INC. | amagq32016earningsrelease8.htm |

AMAG
Pharmaceuticals
Q3-2016 Financial Results
November 3, 2016

Forward-Looking Statements
2
This presentation contains forward-looking statements within the meaning of the Private Securities Litigation Reform Act of
1995 (PSLRA) and other federal securities laws. Any statements contained herein which do not describe historical facts,
including, among others, expected timing of certain milestones for the Makena subcutaneous auto-injector program, including
availability of topline data and submission and anticipated approval of the sNDA; expected timing of certain milestones for the
Phase 3 clinical trial for the expanded indication for Feraheme, including the completion of trial enrollment and submission and
anticipated approval of the sNDA; Makena’s position in the market and future growth drivers for Makena, including the
potential market opportunity, the ability to increase market share from compounders or increase Makena @Home
administration and the impact of the enhanced agreement with Optum Home Health to include co-promotion; future growth
drivers for CBR, including its ability to differentiate CBR’s offerings, improve commercial execution, leverage the larger sales
force and align price with value proposition; future growth drivers for Feraheme, including opportunities and plans to grow
market share in key segments, optimization of net revenue per gram, and the impact of potential approval of the label
expansion, including the potential increase in size of the addressable market for Feraheme; AMAG’s updated 2016 financial
guidance, including GAAP and non-GAAP revenues, GAAP operating income, adjusted EBITDA and GAAP and non-GAAP
net income; AMAG’s ability to expand its portfolio and license and acquire products or companies that will transform AMAG, by
providing a well-diversified portfolio with commercial and development products and enhanced internal capabilities, provide
long-term growth; and its ability to execute key 2016 milestones, including plans to achieve commercial, financial and
business development objectives are forward-looking statements which involve risks and uncertainties that could cause actual
results to differ materially from those discussed in such forward-looking statements.
Such risks and uncertainties include, among others, those risks identified in AMAG’s filings with the U.S. Securities and
Exchange Commission (SEC), including its Annual Report on Form 10-K for the year ended December 31, 2015, its Quarterly
Reports on Form 10-Q for the quarters ended March 31, 2016 and June 30, 2016 and subsequent filings with the SEC. Any
such risks and uncertainties could materially and adversely affect AMAG’s results of operations, its profitability and its cash
flows, which would, in turn, have a significant and adverse impact on AMAG’s stock price. AMAG cautions you not to place
undue reliance on any forward-looking statements, which speak only as of the date they are made. AMAG disclaims any
obligation to publicly update or revise any such statements to reflect any change in expectations or in events, conditions or
circumstances on which any such statements may be based, or that may affect the likelihood that actual results will differ from
those set forth in the forward-looking statements.

Q3-2016 Earnings Call Agenda
3
Q3-2016 and Recent Highlights1
5 Q&A
2 Commercial Performance
4 Portfolio Expansion and 2016 Key Priorities
3 Financial Results and Guidance

Strong Revenue Growth
4
GAAP Revenue ($M)
3Q-2015 3Q-2016
$96.2
$143.8
+50%
YTD 2015 YTD 2016
$309.5
$380.5
+23%
Makena CBRFeraheme Ex-US collaboration revenue1
1 Collaboration revenue related to the termination of AMAG’s ex-US ferumoxytol marketing agreement.

Q3-2016 Highlights and Recent Events
5
Drove significant top & bottom line growth in Q3-2016
– Achieved record sales of Makena; gained another 4 market share points
– Increased enrollments at CBR vs. Q2-2016
– Maintained Feraheme market share
– Realized strong operating income/adjusted EBITDA results
Generated $68M of cash and investments in Q3-2016 (YTD: $148M)
Tightened annual revenue guidance to upper end of previous range
Dosed first subjects in definitive pharmacokinetic (PK) study and
comparative pain study of Makena subcutaneous (SQ) auto-injector program
Accelerated potential approval timeline for Feraheme IDA label expansion
trial by approximately 6 months

Milestones: Next-Generation Development Programs
6
Milestone 2016 2017 2018
Makena SQ Auto-Injector Program Q1 Q2 Q3 Q4 Q1 Q2 Q3 Q4 Q1 Q2 Q3 Q4
Definitive PK – dose 1st patient
Pain study – dose 1st patient
Topline data
sNDA filed
Expected approval
Feraheme IDA Label Expansion Trial Q1 Q2 Q3 Q4 Q1 Q2 Q3 Q4 Q1 Q2 Q3 Q4
Trial initiated
Trial enrollment completed
Topline data
sNDA filed (accelerated 6 months)
Expected approval (accelerated 6 months)
Commercial
Performance

Continued to Drive Makena Sales
8
Strong commercial execution
($M)
M A T E R N A L H E A L T H : M A K E N A
$65.2
$93.4
Q3-2015 Q3-2016
$184.3
$236.8
YTD 2015 YTD 2016
+43%
+28%

9
Makena
41%
Off Guidance3
30%
Compounded
Hydroxyprogesterone
Caproate
29%
1 Based on 140,000 patients, >16 injections/patient and net revenue of ~$425/injection.
2 Company estimates Makena market share based on distributor dispensing data and all other market share based on physician market research data conducted by AMAG.
3 Off guidance represents patients treated outside guidance of Society for Maternal Fetal Medicine, including patients treated with unapproved therapies and untreated patients.
Q3-2016
$1B Market Opportunity1
Makena gained 11 Percentage Share Points YTD 2016
M A T E R N A L H E A L T H : M A K E N A
Makena
30%
Off Guidance3
30%
Compounded
Hydroxyprogesterone
Caproate
40%
Estimated Market Share2
Year end 2015

M A T E R N A L H E A L T H : M A K E N A
10
Continue share gains from compounders
Increased Q3-2016 single-dose vial sales to 66%
of total Makena sales, up from 30% in Q2-2016
1
Increase Makena @Home administration
Increased average paid injections per patient to
14.2 weeks, up from 14.0 in Q2-2016
2
Expanding share of voice with target
customers
Enhanced agreement with Optum Home Health
to include co-promotion of Makena
3
Growth Drivers
Accomplishments

11
$7.2
$28.0
Q3-2015 Q3-2016
$29.2 $29.9
Q3-2015 Q3-2016
+2.4%
GAAP CBR Revenue Non-GAAP, Pro Forma CBR Revenue2
1 AMAG acquired CBR on August 17, 2015.
2 See slides 29-31 for reconciliations of GAAP to non-GAAP financial information.
3 Represents pro forma revenue. AMAG acquired CBR on August 17, 2015.
Attractive Recurring Revenue Stream
Return to Growth
($M)
M A T E R N A L H E A L T H : C O R D B L O O D R E G I S T R Y
31

Growth Drivers
Accomplishments
12
M A T E R N A L H E A L T H : C O R D B L O O D R E G I S T R Y
Differentiate CBR’s offerings
Enhanced messaging to capitalize on
generational shift
1
Continue improvement in commercial
execution and leverage field footprint
Emphasized competitive advantages and market
position
2
Align pricing with value proposition on
cord blood and tissue storage
Increased enrollments versus prior quarter
Grew quarterly revenue versus prior quarter and
year over year
3
H E M A T O L O G Y / O N C O L O G Y : F E R A H E M E
13
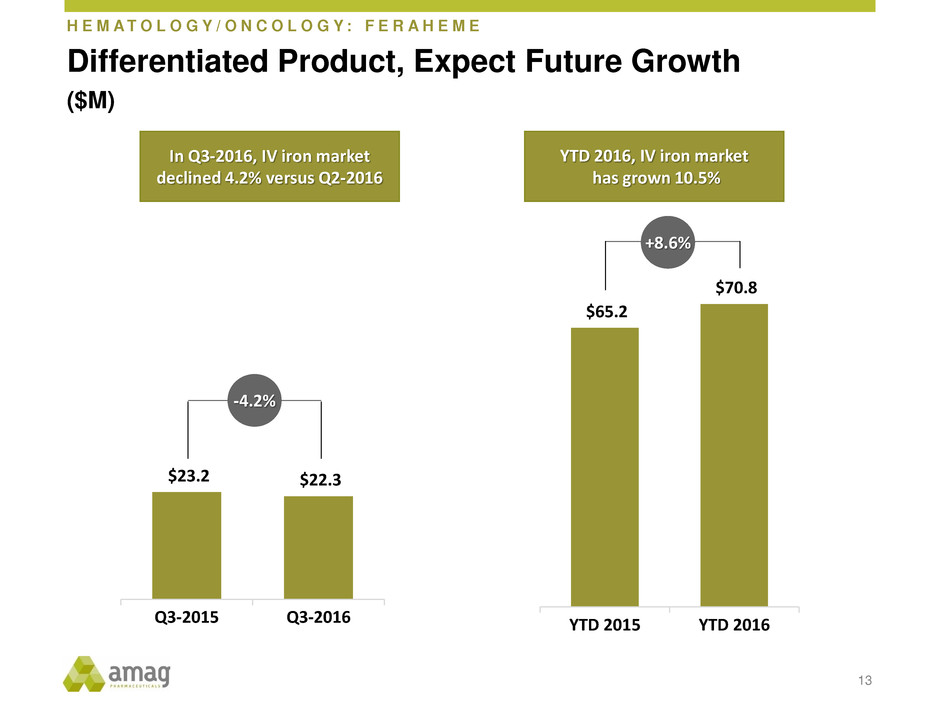
$23.2 $22.3
Q3-2015 Q3-2016
Differentiated Product, Expect Future Growth
($M)
$65.2
$70.8
YTD 2015 YTD 2016
+8.6%
-4.2%
In Q3-2016, IV iron market
declined 4.2% versus Q2-2016
YTD 2016, IV iron market
has grown 10.5%

Broad IDA Label Would Double Market Opportunity1
14
Feraheme
~26%
Other IV irons
~74%
IDA IV Iron Market (non-dialysis)
Opportunity with Broad IDA indication1
~$660M / year (non-dialysis)2
IDAIDA-CKD
IDA-CKD
IDA
4.5 million Americans
diagnosed with IDA3
1.5 million in
women’s health3
1 If regulatory approval is received for broad IDA indication.
2 AMAG estimates market opportunity using ~$600/gram and 1.1M grams (Q3-2016 IMS data annualized).
3 Global Intravenous (I.V.) Iron Drugs Market Report: 2015 Edition.
H E M A T O L O G Y / O N C O L O G Y : F E R A H E M E

Growth Drivers
Accomplishments
H E M A T O L O G Y / O N C O L O G Y : F E R A H E M E
Growth in key segments
Completed agreement with a large hospital GPO
for expanded access to more than 100,000 grams
of IV iron annually
1
Optimize net revenue per gram
Continued sustainable & predictable broad
patient access strategy
2
Expand label to include IDA all comers
which would double addressable market
Continued rapid enrollment in head-to-head, Ph. 3
trial thereby accelerating sNDA filing to mid-2017
3
15

Financial Results
GAAP Total Revenue and Operating Income (Loss)
($M)
17
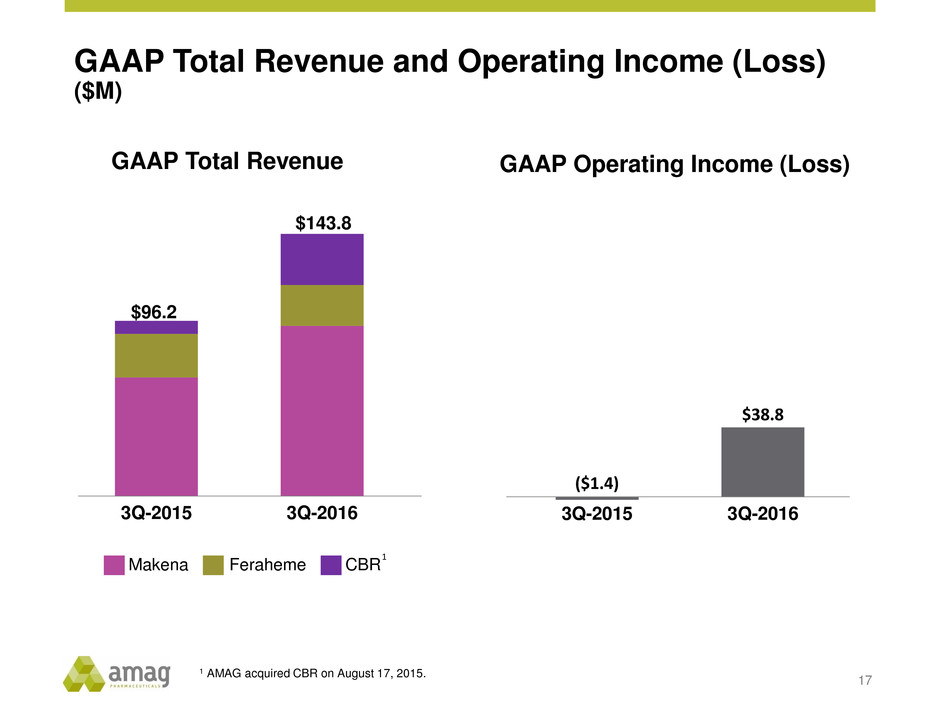
GAAP Total Revenue
3Q-2015 3Q-2016
$96.2
$143.8
Makena CBRFeraheme
GAAP Operating Income (Loss)
($1.4)
$38.8
3Q-2015 3Q-2016
1
1 AMAG acquired CBR on August 17, 2015.

Q3-2016 Financial Summary
18
($M, except per share data) Q3-2016
(GAAP)
Adjustments
Q3-2016
(Non-GAAP)
Total revenues $143.8 $2.0
4 $145.8
Cost of revenue 30.7 (21.3)
6,7 9.4
Gross profit $113.1 $23.3 $136.4
Operating expenses 74.3 (14.1)
8,9 60.2
Operating income / Adjusted EBITDA $38.8 $37.4 $76.2
Interest expense and other (17.5) 3.2
14 (14.3)
Net income (loss) before taxes $21.3 $40.6 $61.8
Income tax expense (benefit) 5.1 (5.1)
17 0
Net income (loss) $16.2 $45.6 $61.8
Net income (loss) per diluted share $0.43 $1.78
Weighted average diluted shares* 42.1 34.7
Note: See corresponding footnotes 4,6,7,8,9,14,17 on slide 30, and slides 29-31 for reconciliations of GAAP to non-GAAP financial information.
* See slide 33 for share reconciliation.

Non-GAAP Revenue Growth Translates into Strong Adjusted EBITDA
19
3Q-2015 3Q-2016
$103.5
$145.8
Non-GAAP Total Revenue1 Non-GAAP Adjusted EBITDA1
$52.8
$76.2
3Q-2015 3Q-2016
+44%
+41%
For the 3-months ended September 30
($M)
1 See slides 29-31 for reconciliations of GAAP to non-GAAP financial information.
2 AMAG acquired CBR on August 17, 2015.
Makena CBR2Feraheme/MuGard

Strong Cash Flow Generation
20
($M) 9/30/16 12/31/15
Cash, cash equivalents and investments $614 $466
Principal debt outstanding
Convertible senior notes (2.5%) $200 $200
Term loan facility (4.75%) 333 346
2023 senior notes (7.875%) 500 500
Total debt outstanding $1,033 $1,046
($M) 9/30/16 12/31/15
Net debt $419 $580
Net leverage ratio1 1.7x 2.7x
Total leverage ratio1 4.1x 4.9x
1 Leverage ratios based on LTM adjusted EBITDA for each period.
• Achieved $300M in prior 12 month sales of Makena as of September 30, 2016
• $100M milestone to be paid to former Lumara Health shareholders in Q4-2016

Non-GAAP Revenue Growth Translates into Strong Adjusted EBITDA
21
YTD 2015 YTD 2016
$276.9
$396.1
Non-GAAP Total Revenue1 Non-GAAP Adjusted EBITDA1
$152.1
$188.3
YTD 2015 YTD 2016
+24%
+43%
For the 9-months ended September 30
($M)
1 See slides 29-31 for reconciliations of GAAP to non-GAAP financial information.
2 AMAG acquired CBR on August 17, 2015.
Makena
CBR2
Feraheme/MuGard
License fee, collaboration and other revenues

Updated 2016 Financial Guidance Range
22
($M)
2016 GAAP Guidance 2016 Non-GAAP Guidance
Previous Updated Previous1 Updated1
Makena sales $310 - $340 $330 - $340 $310 - $340 $330 - $340
Feraheme/MuGard sales $95 - $105 $95 - $105 $95 - $105 $95 - $105
CBR revenue $98 - $108 $98 - $108 $115 - $1252 $115 - $1252
Total revenue $503 - $553 $523 - $553 $520 - $570 $540 - $570
Net income $0 - $30 $3 - $23 $195 - $225 $200 - $220
Operating income $93 - $123 $98 - $118 N/A N/A
Adjusted EBITDA N/A N/A $255 - $285 $260 - $280
1 See slide 32 for a reconciliation of 2016 financial guidance.
2 Revenue includes purchase accounting adjustments related to CBR deferred revenue of $17M in 2016. See slide 34 for an explanation of CBR deferred
revenue adjustments. CBR was acquired on August 17, 2015.
AMAG
Pharmaceuticals
Portfolio Expansion and
2016 Key Priorities
November 3, 2016

Transforming AMAG through M&A and Licensing
24
Future
Well-diversified portfolio of
products
Mix of commercial assets and
development pipeline for long-term
growth
Enhanced internal capabilities that
come with scaled organization
Today
Profitable company with strong
growth
Multiple therapeutic areas in
attractive segments
Maturing next generation
development pipeline
o Feraheme IDA label expansion1
o Makena SQ auto-injector1
Velo option agreement for the
treatment of severe preeclampsia
Past
Dependent on single
product
Significant cash burn
Limited opportunities for
organic growth
Feraheme MuGard Makena Product 5 Product 6CBR
1 If regulatory approval is received.
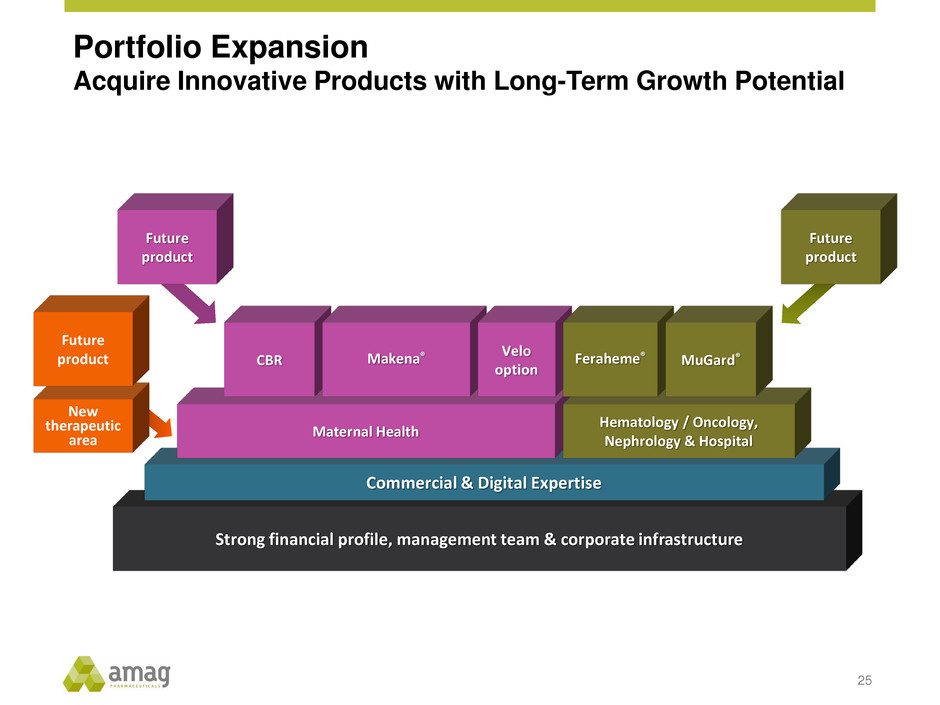
Portfolio Expansion
Acquire Innovative Products with Long-Term Growth Potential
25
Strong financial profile, management team & corporate infrastructure
Commercial & Digital Expertise
Maternal Health
Hematology / Oncology,
Nephrology & Hospital
Future
product
Makena® Feraheme® MuGard®
New
therapeutic
area
Future
product
Future
product

Executing on Key 2016 Milestones
26
2016
Commercialize single-dose, preservative-free formulation
Initiate definitive PK and comparative pain studies for subcutaneous auto-injector
Initiate a head-to-head Phase 3 clinical trial in Q1-2016 evaluating the safety
of Feraheme compared to Injectafer in adults with IDA
Makena
Feraheme
Drive significant net product sales growth of +40% versus prior year
Achieve non-GAAP adjusted EBITDA of >$260M
Initiate share repurchase program
Financial
Acquire or in-license marketed or late-stage development assets to
accelerate future growth
Business
Development

AMAG
Pharmaceuticals
Q&A
Q3-2016 Financial Results
November 3, 2016

AMAG
Pharmaceuticals
Appendix
Q3-2016 Financial Results
November 3, 2016
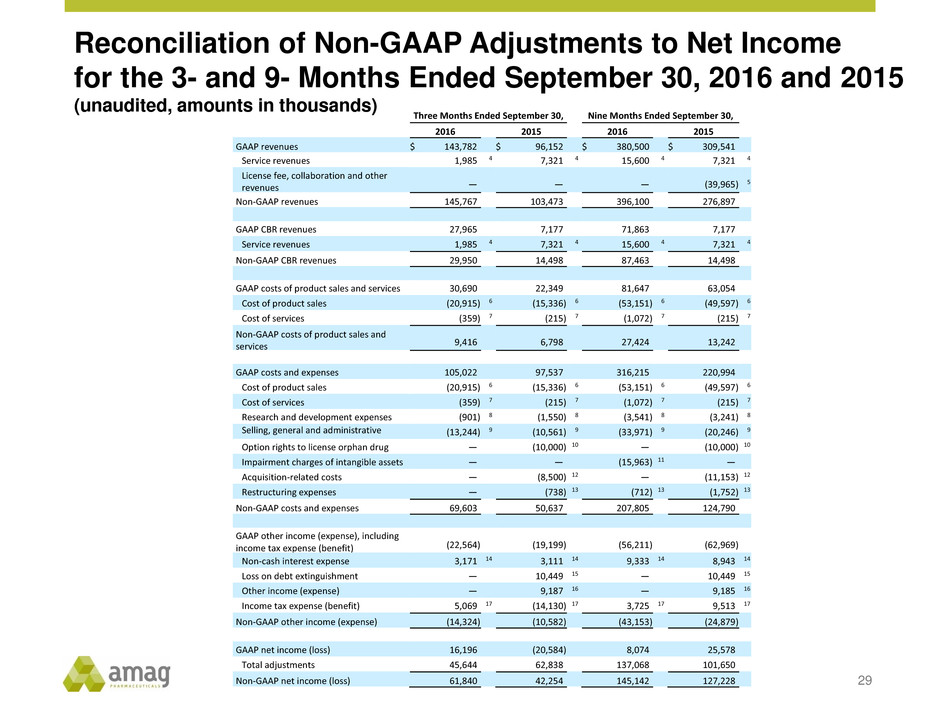
Reconciliation of Non-GAAP Adjustments to Net Income
for the 3- and 9- Months Ended September 30, 2016 and 2015
(unaudited, amounts in thousands)
29
Three Months Ended September 30, Nine Months Ended September 30,
2016 2015 2016 2015
GAAP revenues $ 143,782 $ 96,152 $ 380,500 $ 309,541
Service revenues 1,985 4 7,321 4 15,600 4 7,321 4
License fee, collaboration and other
revenues —
—
—
(39,965 ) 5
Non-GAAP revenues 145,767 103,473 396,100 276,897
GAAP CBR revenues 27,965 7,177 71,863 7,177
Service revenues 1,985 4 7,321 4 15,600 4 7,321 4
Non-GAAP CBR revenues 29,950 14,498 87,463 14,498
GAAP costs of product sales and services 30,690 22,349 81,647 63,054
Cost of product sales (20,915 ) 6 (15,336 ) 6 (53,151 ) 6 (49,597 ) 6
Cost of services (359 ) 7 (215 ) 7 (1,072 ) 7 (215 ) 7
Non-GAAP costs of product sales and
services 9,416
6,798
27,424
13,242
GAAP costs and expenses 105,022 97,537 316,215 220,994
Cost of product sales (20,915 ) 6 (15,336 ) 6 (53,151 ) 6 (49,597 ) 6
Cost of services (359 ) 7 (215 ) 7 (1,072 ) 7 (215 ) 7
Research and development expenses (901 ) 8 (1,550 ) 8 (3,541 ) 8 (3,241 ) 8
Selling, general and administrative
expenses
(13,244 ) 9 (10,561 ) 9 (33,971 ) 9 (20,246 ) 9
Option rights to license orphan drug — (10,000 ) 10 — (10,000 ) 10
Impairment charges of intangible assets — — (15,963 ) 11 —
Acquisition-related costs — (8,500 ) 12 — (11,153 ) 12
Restructuring expenses — (738 ) 13 (712 ) 13 (1,752 ) 13
Non-GAAP costs and expenses 69,603 50,637 207,805 124,790
GAAP other income (expense), including
income tax expense (benefit) (22,564 ) (19,199 ) (56,211 ) (62,969 )
Non-cash interest expense 3,171 14 3,111 14 9,333 14 8,943 14
Loss on debt extinguishment — 10,449 15 — 10,449 15
Other income (expense) — 9,187 16 — 9,185 16
Income tax expense (benefit) 5,069 17 (14,130 ) 17 3,725 17 9,513 17
Non-GAAP other income (expense) (14,324 ) (10,582 ) (43,153 ) (24,879 )
GAAP net income (loss) 16,196 (20,584 ) 8,074 25,578
Total adjustments 45,644 62,838 137,068 101,650
Non-GAAP net income (loss) 61,840 42,254 145,142 127,228

Footnotes: Reconciliation of Non-GAAP Adjustments to Net Income
for the 3- and 9- Months Ended September 30, 2016 and 2015
30
4 Represents purchase accounting adjustments related to deferred revenue in connection with the CBR acquisition.
5 Represents adjustments to exclude certain non-cash revenue associated with the 2014 termination of the company’s
ex-US ferumoxytol marketing agreement.
6 Adjustments to eliminate the following: (i) non-cash step-up of inventory from purchase accounting; (ii) amortization
expense related to intangible assets; (iii) depreciation expense; and (iv) stock-based compensation expense.
7 Adjustments to eliminate depreciation expense.
8 Adjustments to eliminate the following: (i) non-cash step-up of inventory used in research and development from
purchase accounting; (ii) depreciation expense; and (iii) stock-based compensation expense.
9 Adjustments to eliminate the following: (i) non-cash adjustments related to contingent consideration; (ii) amortization
expense related to intangible assets; (iii) depreciation expense; and (iv) stock-based compensation expense.
10 Eliminate one-time costs related to Velo option.
11 Impairment expense of $15.7 million related to the MuGard intangible asset and $0.2 million related to the favorable
lease intangible asset
12 Adjustments to eliminate one-time costs related to CBR acquisition.
13 Adjustments to eliminate non-recurring restructuring costs.
14 Adjustments to eliminate non-cash interest expense.
15 Eliminate non-cash or one-time expenses related to the August 2015 term loan refinancing.
16 Eliminate one-time expenses related to the August 2015 debt financing.
17 Adjustments to eliminate non-cash income tax expense (benefit).

Reconciliation of GAAP to Non-GAAP Net Income (Loss) and Adjusted Net
Income Per Share for the 3- and 9-Months Ended September 30, 2016 and 2015
(unaudited, amounts in thousands, except per share data)
31
Three Months Ended September 30, Nine Months Ended September 30,
2016 2015 2016 2015
GAAP Net Income (Loss) $ 16,196 $ (20,584 ) $ 8,074 $ 25,578
Adjustments:
Interest expense, net 17,471 13,698 52,683 33,827
Loss on debt extinguishment — 10,449 — 10,449
Other income 24 9,182 (197 ) 9,180
Provision for income tax 5,069 (14,130 ) 3,725 9,513
Operating income 38,760 (1,385 ) 64,285 88,547
Purchase accounting adjustments related to CBR
deferred revenue 1,985
7,321
15,600
7,321
Non-cash collaboration revenue — — — (39,965 )
Depreciation and intangible asset amortization 24,672 15,350 65,104 40,333
Non-cash inventory step-up adjustments 1,573 2,122 4,718 11,948
Stock-based compensation 5,468 4,889 16,808 11,572
Adjustments to contingent consideration 3,708 2,886 5,106 4,525
Option rights to license orphan drug — 10,000 — 10,000
Impairment charges of intangible assets — — 15,963 —
Acquisition-related costs — 10,901 — 13,735
Restructuring costs — 753 712 4,090
Non-GAAP adjusted EBITDA 76,166 52,837 188,296 152,106
Cash interest (14,323 ) (10,582 ) (43,154 ) (24,879 )
Non-GAAP Net Income $ 61,843 $ 42,255 $ 145,142 $ 127,227
Basic:
GAAP net income (loss) per share - Basic $ 0.47 $ (0.62 ) $ 0.23 $ 0.84
Shares used in GAAP per share computation 34,171 33,223 34,377 30,379
Non-GAAP net income per share - Basic $ 1.81 $ 1.27 $ 4.22 $ 4.19
Shares used in non-GAAP per share computation 34,171 33,223 34,377 30,379
Diluted:
GAAP net income (loss) per share - Diluted $ 0.43 $ (0.62 ) $ 0.23 $ 0.73
Shares used in GAAP per share computation 42,111 33,223 34,764 34,962
Non-GAAP net income per share - Diluted $ 1.78 $ 1.02 $ 4.18 $ 3.31
Shares used in non-GAAP per share computation 34,730 41,229 34,764 38,430
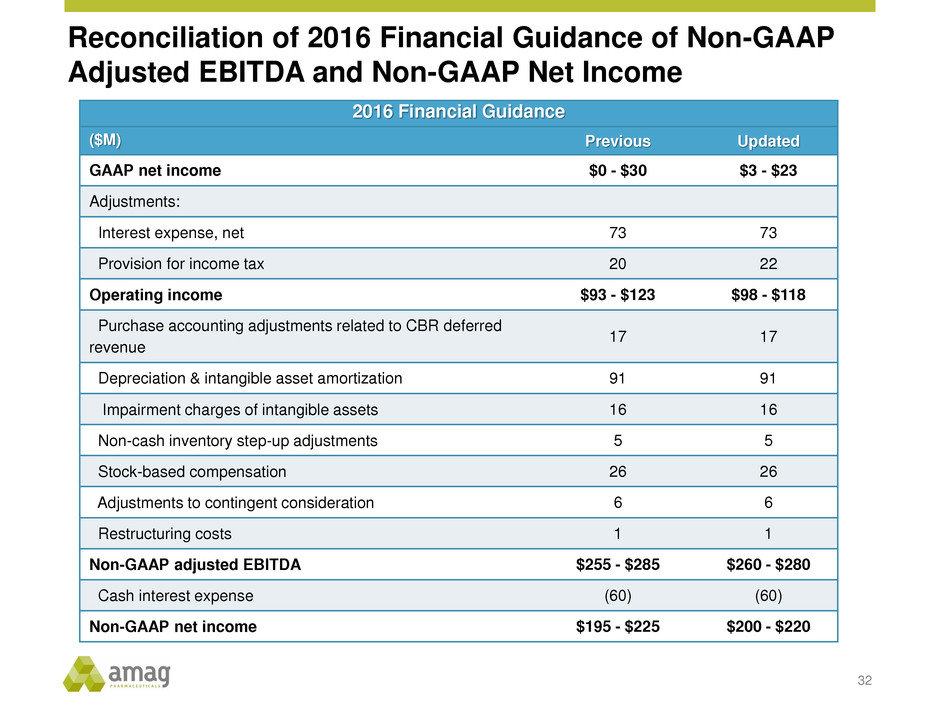
Reconciliation of 2016 Financial Guidance of Non-GAAP
Adjusted EBITDA and Non-GAAP Net Income
32
2016 Financial Guidance
($M) Previous Updated
GAAP net income $0 - $30 $3 - $23
Adjustments:
Interest expense, net 73 73
Provision for income tax 20 22
Operating income $93 - $123 $98 - $118
Purchase accounting adjustments related to CBR deferred
revenue
17 17
Depreciation & intangible asset amortization 91 91
Impairment charges of intangible assets 16 16
Non-cash inventory step-up adjustments 5 5
Stock-based compensation 26 26
Adjustments to contingent consideration 6 6
Restructuring costs 1 1
Non-GAAP adjusted EBITDA $255 - $285 $260 - $280
Cash interest expense (60) (60)
Non-GAAP net income $195 - $225 $200 - $220

Share Count Reconciliation
33
1 Employee equity incentive awards, convertible notes and warrants would be anti-dilutive in this period utilizing the “if-converted” method,
which adjusts net income for the after-tax interest expense applicable to the convertible notes.
2 Reflects the Non-GAAP dilutive impact of employee equity incentive awards and convertible notes.
3 Reflects the impact of the non-GAAP benefit of the bond hedge and warrants.
(M) Q3-2016 Q3-2015
Weighted average basic shares outstanding 34.2 33.2
Employee equity incentive awards 0.5 --1
Convertible notes 7.4 --1
Warrants --1 --1
GAAP diluted shares outstanding 42.1 33.2
Employee equity incentive awards -- 1.52
Convertible notes (7.4)2 7.42
Effect of bond hedge and warrants -- (0.9)3
Non-GAAP diluted shares outstanding 34.7 41.2

CBR Non-GAAP Revenue Adjustment
34
PURCHASE ACCOUNTING FUTURE IMPACT
$3.1
$58.8
$0
$10
$20
$30
$40
$50
$60
$70
Closing Date
GAAP Write-Off Amount
Deferred revenue balance
on August 17, 2015
$17.0
$5.5 $5.4 $5.3
$55.4
$0
$10
$20
$30
$40
$50
2016 2017 2018 2019 2020-2078
Non-GAAP Addback
Addback to calculate non-GAAP
revenue to be reported in future
periods
($M)
Purchase
accounting rules
require write-
down of closing
date deferred
revenue on
balance sheet at
acquisition date
($M)
1 2
3

AMAG
Pharmaceuticals
Q3-2016 Financial Results
November 3, 2016
