Attached files
| file | filename |
|---|---|
| 8-K - FORM 8-K - Summit Hotel Properties, Inc. | v452014_8-k.htm |
Exhibit 99.1
 |
12600 Hill Country Blvd., Suite R-100, Austin, TX 78738 Telephone: 512-538-2300 Fax: 512-538-2333 www.shpreit.com |
NEWS RELEASE
SUMMIT HOTEL PROPERTIES REPORTS THIRD QUARTER 2016 RESULTS
Net Income increases to $22.1 million; Common Dividend increase of 22.6 percent;
Adjusted FFO increases to $0.37 per share
Austin, Texas, November 2, 2016 --- Summit Hotel Properties, Inc. (NYSE: INN) (the “Company”), today announced results for the third quarter 2016.
“We are extremely pleased with the continued performance of our diversified portfolio of premium select-service hotels. Our hotels acquired over the past two years led the way during the third quarter, which demonstrates our ability to execute a differentiated investment strategy, targeting higher growth hotels in attractive markets,” said Dan Hansen, the Company’s President and Chief Executive Officer. “In addition, for the second time this year, we are pleased to have announced another common dividend increase. Our dividend increase of 22.6 percent, which is on top of a 12.8 percent increase earlier in the year, is the result of continued strong cash flows generated by our portfolio of high-quality assets,” commented Mr. Hansen.
Third Quarter 2016 Highlights
| · | Net Income: Net income attributable to common stockholders increased by 135.2 percent to $22.1 million, or $0.25 per diluted share, compared with $9.4 million, or $0.11 per diluted share, in the same period of 2015. |
| · | Pro Forma RevPAR: Pro forma revenue per available room (“RevPAR”) grew to $113.32, an increase of 2.2 percent over the same period in 2015. Pro forma average daily rate (“ADR”) grew to $143.56, an increase of 3.3 percent from the same period in 2015. Pro forma occupancy decreased by 1.1 percent to 78.9 percent. |
| · | Same-Store RevPAR: Same-store RevPAR grew to $107.33, an increase of 1.6 percent over the same period in 2015. Same-store ADR grew to $137.81, an increase of 3.1 percent from the same period in 2015. Same-store occupancy decreased by 1.5 percent to 77.9 percent compared to the same period in 2015. |
| · | Pro Forma Hotel EBITDA: Pro forma hotel EBITDA grew to $45.4 million, an increase of 2.4 percent over the same period in 2015. Pro forma hotel EBITDA margin expanded by 18 basis points to 37.9 percent compared to 37.7 percent in the same period of 2015. |
| · | Adjusted EBITDA: Adjusted EBITDA decreased to $42.1 million from $43.7 million in the same period of 2015, a decrease of $1.6 million or 3.7 percent. |
| · | Adjusted FFO: Adjusted Funds from Operations (“AFFO”) increased to $32.3 million, or $0.37 per diluted share, an increase in AFFO per diluted share of 0.4 percent over the same period in 2015. |
| · | Acquisitions: The Company acquired the 157-guestroom Marriott in Boulder, Colorado for a gross purchase price of $61.4 million. The hotel had RevPAR of $166.55 for the trailing twelve months ended June 30, 2016. |
| · | Dispositions: The Company sold the 122-guestroom Hyatt Place in Irving (Las Colinas), Texas, for a total sales price of $14.0 million. The hotel had RevPAR of $90.03 for the trailing twelve months ended June 30, 2016. |
 | 1 | Page |
The Company’s results for the three and nine months ended September 30, 2016, and 2015 are as follows:
| For the Three Months Ended September 30, | For the Nine Months Ended September 30, | |||||||||||||||
| 2016 | 2015 | 2016 | 2015 | |||||||||||||
| (Unaudited) | ||||||||||||||||
| ($ in thousands, except per unit and RevPAR data) | ||||||||||||||||
| Net income attributable to common stockholders | $ | 22,090 | $ | 9,393 | $ | 84,146 | $ | 27,837 | ||||||||
| Net income per diluted share and unit | $ | 0.25 | $ | 0.11 | $ | 0.96 | $ | 0.32 | ||||||||
| Total revenues | $ | 118,336 | $ | 125,091 | $ | 363,613 | $ | 353,416 | ||||||||
| EBITDA (1) | $ | 50,453 | $ | 37,535 | $ | 173,277 | $ | 110,907 | ||||||||
| Adjusted EBITDA (1) | $ | 42,105 | $ | 43,735 | $ | 130,382 | $ | 119,940 | ||||||||
| FFO (1) | $ | 30,093 | $ | 26,415 | $ | 88,638 | $ | 76,170 | ||||||||
| Adjusted FFO (1) | $ | 32,266 | $ | 32,006 | $ | 97,045 | $ | 84,923 | ||||||||
| FFO per diluted share and unit (1) (2) | $ | 0.34 | $ | 0.30 | $ | 1.02 | $ | 0.88 | ||||||||
| Adjusted FFO per diluted share and unit (1) (2) | $ | 0.37 | $ | 0.37 | $ | 1.11 | $ | 0.98 | ||||||||
| Pro Forma (3) | ||||||||||||||||
| RevPAR | $ | 113.32 | $ | 110.84 | $ | 115.16 | $ | 110.67 | ||||||||
| RevPAR growth | 2.2 | % | 4.1 | % | ||||||||||||
| Hotel EBITDA | $ | 45,401 | $ | 44,336 | $ | 140,232 | $ | 130,532 | ||||||||
| Hotel EBITDA margin | 37.9 | % | 37.7 | % | 38.6 | % | 37.7 | % | ||||||||
| Hotel EBITDA margin growth | 18 bps | 88 bps | ||||||||||||||
| (1) | See tables later in this press release for a discussion and reconciliation of net income to non-GAAP financial measures, including earnings before interest, taxes, depreciation and amortization (“EBITDA”), adjusted EBITDA, funds from operations (“FFO”), FFO per diluted share and unit, adjusted FFO (“AFFO”), and AFFO per diluted share and unit, as well as a discussion of hotel EBITDA. See “Non-GAAP Financial Measures” at the end of this release. Non-GAAP financial measures are unaudited. |
| (2) | Amounts are based on 87,401,000 weighted average diluted common shares and units and 87,065,000 weighted average diluted common shares and units for the three months ended September 30, 2016, and 2015, respectively, and 87,319,000 weighted average diluted common shares and units and 87,000,000 weighted average diluted common shares and units for the nine months ended September 30, 2016, and 2015, respectively. The Company includes the outstanding common units of limited partnership interests (“OP Units”) in Summit Hotel OP, LP, the Company’s operating partnership, held by limited partners other than the Company in the determination of weighted average diluted common shares and units because the OP Units are redeemable for cash or, at the Company’s option, shares of the Company’s common stock on a one-for-one basis. |
| (3) | Unless stated otherwise in this release, all pro forma information includes operating and financial results for 80 hotels owned as of September 30, 2016, as if each hotel had been owned by the Company since January 1, 2015. As a result, all pro forma information includes operating and financial results for hotels acquired since January 1, 2015, which includes periods prior to the Company’s ownership. Pro forma and non-GAAP financial measures are unaudited. |
| | 2 | Page |
Year-To-Date 2016 Highlights
| · | Net Income: Net income attributable to common stockholders increased to $84.1 million, or $0.96 per diluted share, compared with $27.8 million, or $0.32 per diluted share, for the same period of 2015. |
| · | Pro Forma RevPAR: Pro forma RevPAR grew to $115.16, an increase of 4.1 percent over the same period in 2015. Pro forma ADR grew to $144.62, an increase of 3.0 percent from the same period in 2015. Pro forma occupancy increased by 1.1 percent to 79.6 percent. |
| · | Same-Store RevPAR: Same-store RevPAR grew to $111.22, an increase of 4.3 percent over the same period in 2015. Same-store ADR grew to $140.32, an increase of 2.7 percent from the same period in 2015. Same-store occupancy increased by 1.5 percent to 79.3 percent compared to the same period in 2015. |
| · | Pro Forma Hotel EBITDA: Pro forma hotel EBITDA grew to $140.2 million, an increase of 7.4 percent over the same period in 2015. Pro forma hotel EBITDA margin expanded by 88 basis points to 38.6 percent compared to 37.7 percent in the same period of 2015. |
| · | Adjusted EBITDA: Adjusted EBITDA increased to $130.4 million from $119.9 million in the same period of 2015, an increase of $10.5 million or 8.7 percent. |
| · | Adjusted FFO: AFFO increased to $97.0 million, or $1.11 per diluted share, an increase in AFFO per diluted share of 13.9 percent over the same period in 2015. |
| · | Acquisitions: The Company acquired three hotels containing 543 guestrooms for a total purchase price of $170.4 million. The three acquired hotels had RevPAR of $139.44 for the year ended December 31, 2015. |
| · | Dispositions: The Company sold ten hotels containing 1,212 guestrooms for a total sales price of $147.3 million. The ten hotels sold had RevPAR of $85.18 for the year ended December 31, 2015. |
Summit vs. Industry Results (% change)
For the Three Months Ended September 30, 2016
| Occupancy | ADR | RevPAR | ||||||||||
| Summit Pro Forma (80) | -1.1 | % | 3.3 | % | 2.2 | % | ||||||
| Summit Same-Store (70) | -1.5 | % | 3.1 | % | 1.6 | % | ||||||
| STR Total US | 0.0 | % | 3.4 | % | 3.3 | % | ||||||
| STR Upscale | -0.6 | % | 2.7 | % | 2.0 | % | ||||||
Source: Smith Travel Research Quarterly Hotel Review, Volume 16, Issue Q3
| | 3 | Page |
Acquisitions
On August 9, 2016, the Company acquired the 157-guestroom Marriott in Boulder, Colorado for a gross purchase price of $61.4 million. The gross purchase price represents a capitalization rate of 8.2 percent based on management’s current estimate of the hotel’s 2017 net operating income, which includes tenant income from approximately 20,000 square feet of retail and restaurant space. The hotel performed exceptionally well during the Company’s first two months of ownership having posted RevPAR growth of 12.6 percent and 7.4 percent in August and September, respectively. The hotel had RevPAR of $171.79 for the trailing twelve months ended September 30, 2016, which represents a 53.9 percent premium over the Company’s pro forma RevPAR for the portfolio.
Dispositions
On July 6, 2016, the Company completed the sale of the 122-guestroom Hyatt Place located in Irving (Las Colinas), Texas, for a total sales price of $14.0 million. The sales price represents a capitalization rate of 7.0 percent based on the hotel’s net operating income for the trailing twelve months ended June 30, 2016 and adjusted for planned capital improvements. The Company estimates that the hotel would have contributed approximately $0.3 million and $0.6 million of EBITDA from the sale date through the third quarter and full year 2016, respectively. This hotel was not part of the previously announced disposition of 26 hotels to affiliates of American Realty Capital Hospitality Trust, Inc. (“ARCH”).
Capital Investment
The Company invested $12.9 million and $31.1 million in capital improvements during the three and nine months ended September 30, 2016, respectively. For the properties renovated during the quarter, the scope of work ranged from common space improvements to complete guestroom renovations, including furniture, soft goods and guest bathrooms.
Balance Sheet
At September 30, 2016, the Company had the following:
| · | Total outstanding debt of $624.6 million with a weighted average interest rate of 3.67 percent. |
| · | Maximum borrowing capacity of $450.0 million under its senior unsecured credit facility, including both the revolver and term loan portions of the facility, with $165.0 million outstanding and $285.0 million available to borrow. |
| · | Total net debt, which the Company defines as total outstanding debt less cash and cash equivalents, to trailing twelve month adjusted EBITDA of 3.6x. |
During the quarter, the Company repaid a mortgage loan that had an interest rate of 6.22 percent, a principal balance of $17.0 million and a maturity date of November 1, 2016. There was no prepayment penalty related to the early repayment of the mortgage loan, and the Company added the hotel to its unencumbered asset pool during the third quarter 2016. As a result of the loan repayment, only 2.3 percent of the Company’s total debt is scheduled to mature through 2018.
| | 4 | Page |
At October 28, 2016, the Company had the following:
| · | Total outstanding debt of $738.9 million with a weighted average interest rate of 3.42 percent. |
| · | Maximum borrowing capacity of $450.0 million under its senior unsecured credit facility, including both the revolver and term loan portions of the facility, with $280.0 million outstanding and $170.0 million available to borrow. |
| · | Total net debt to trailing twelve month adjusted EBITDA of 4.3x. |
Common Dividend Increase
On October 31, 2016, the Company increased its quarterly cash dividend to $0.1625 per share on its common stock and per common unit of limited partnership interest in Summit Hotel OP, LP. The increase represents a 22.6 percent increase over the Company’s previous quarterly common dividend of $0.1325 per share and an annualized dividend yield of 5.0 percent based on the October 31, 2016 closing stock price.
In addition, the Company declared a quarterly cash dividend of:
| · | $0.4921875 per share on its 7.875% Series B Cumulative Redeemable Preferred Stock. |
| · | $0.4453125 per share on its 7.125% Series C Cumulative Redeemable Preferred Stock. |
| · | $0.403125 per share on its 6.45% Series D Cumulative Redeemable Preferred Stock. |
The dividends are payable on November 30, 2016, to holders of record as of November 16, 2016.
| | 5 | Page |
Subsequent Events
|
Acquisitions
On October 28, 2016, the Company acquired the newly-built 206-guestroom Hyatt Place Chicago Downtown-The Loop for a total purchase price of $73.8 million and entered into a management agreement with OTO Development, LLC. Opened in 2015 and recognized by Hyatt as its “Development Project of the Year,” the LEED Silver Certified hotel is surrounded by 80 million square feet of office space in Chicago’s central business district, which is home to a premier mix of notable businesses, cultural destinations, and social entertainment venues. The hotel is also in close proximity to other tourist destinations such as the Civic Opera House, Willis Tower, Millennium Park and the Magnificent Mile, all of which are easily accessible.
The total purchase price represents a capitalization rate of 8.0 percent based on management’s current estimate of the hotel’s 2017 net operating income. The hotel achieved RevPAR of $162.94 for the trailing twelve months ended September 30, 2016, which represents a 45.9 percent premium over the Company’s pro forma RevPAR for the portfolio.
|
 |
Capital Markets
On October 28, 2016, the Company paid $50.7 million to redeem all 2,000,000 shares of its issued and outstanding 9.25% Series A Cumulative Preferred Stock at a redemption price of $25.00 per share plus accrued and unpaid dividends. The redemption was funded using a portion of the net proceeds from our 6.45% Series D Cumulative Preferred Stock Issuance in June 2016.
| | 6 | Page |
2016 Outlook
The Company is providing its outlook for the fourth quarter and full year 2016 based on its 81 hotels owned as of November 2, 2016. In addition to the 81 hotels, the Company’s outlook for the fourth quarter and full year 2016 assumes the sale of the 90-guestroom Courtyard by Marriott located in El Paso, Texas, for a total sales price of $11.0 million in the fourth quarter 2016. The hotel is expected to be sold to a third party unrelated to ARCH, but is part of the previously announced disposition of 26 hotels to affiliates of ARCH. The remaining seven hotels containing 651 guestrooms continue to be under contract with ARCH for $66.8 million with a scheduled closing of December 30, 2016.
| FOURTH QUARTER 2016 | ||||||||
| ($ in thousands, except RevPAR and per unit data) | ||||||||
| Low | High | |||||||
| Pro forma RevPAR (80) (1) | $ | 102.00 | $ | 104.00 | ||||
| Pro forma RevPAR growth (80) (1) | 0.00 | % | 2.00 | % | ||||
| RevPAR (same-store 69) (2) | $ | 97.00 | $ | 99.00 | ||||
| RevPAR growth (same-store 69) (2) | (0.50 | %) | 1.50 | % | ||||
| Adjusted FFO | $ | 21,800 | $ | 23,600 | ||||
| Adjusted FFO per diluted share and unit (3) | $ | 0.25 | $ | 0.27 | ||||
| FULL YEAR 2016 | ||||||||||||
| ($ in thousands, except RevPAR and per unit data) | ||||||||||||
| Low | High | Variance to Prior Midpoint | ||||||||||
| Pro forma RevPAR (80) (1) | $ | 112.75 | $ | 113.25 | $ | 0.75 | ||||||
| Pro forma RevPAR growth (80) (1) | 3.50 | % | 4.00 | % | 0.00 | % | ||||||
| RevPAR (same-store 69) (2) | $ | 107.50 | $ | 108.00 | $ | (0.50 | ) | |||||
| RevPAR growth (same-store 69) (2) | 3.00 | % | 3.50 | % | (0.50 | %) | ||||||
| Adjusted FFO | $ | 118,700 | $ | 120,500 | $ | 2,650 | ||||||
| Adjusted FFO per diluted share and unit (3) | $ | 1.36 | $ | 1.38 | $ | 0.03 | ||||||
| Capital improvements | $ | 44,000 | $ | 47,000 | $ | 500 | ||||||
| (1) | As of November 2, 2016, the Company owned 81 hotels. The pro forma outlook information includes operating estimates as if each hotel had been owned since January 1, 2015, for 80 hotels because one hotel is expected to be sold in the fourth quarter 2016. |
| (2) | As of November 2, 2016, the Company owned 70 same-store hotels. The same-store outlook information includes operating estimates for 69 hotels owned by the Company as of January 1, 2015, because one hotel is expected to be sold in the fourth quarter 2016. |
| (3) | Assumes weighted average diluted common shares and units outstanding of 87,300,000 for the fourth quarter and 87,300,000 for the full year 2016. |
| | 7 | Page |
Third Quarter 2016 Earnings Conference Call
The Company will conduct its quarterly conference call on Thursday, November 3, 2016, at 9:00 a.m. (ET). To participate in the conference call, please dial 877-930-8101. The conference identification code for the call is 95840495. Additionally, a live webcast of the call will be available through the Company’s website, www.shpreit.com. A replay of the conference call will be available until 11:59 p.m. (ET) on Thursday, November 10, 2016, by dialing 855-859-2056; conference identification code 95840495. A replay of the conference call will also be available on the Company’s website until February 28, 2017.
About Summit Hotel Properties
Summit Hotel Properties, Inc., is a publicly-traded real estate investment trust focused primarily on owning premium-branded, select-service hotels in the Upscale segment of the lodging industry. As of November 2, 2016, the Company’s portfolio consisted of 81 hotels with a total of 10,957 guestrooms located in 23 states.
For additional information, please visit the Company’s website, www.shpreit.com, and follow the Company on Twitter at @SummitHotel_INN.
Contact:
Adam Wudel
Vice President – Finance
Summit Hotel Properties, Inc.
(512) 538-2325
| | 8 | Page |
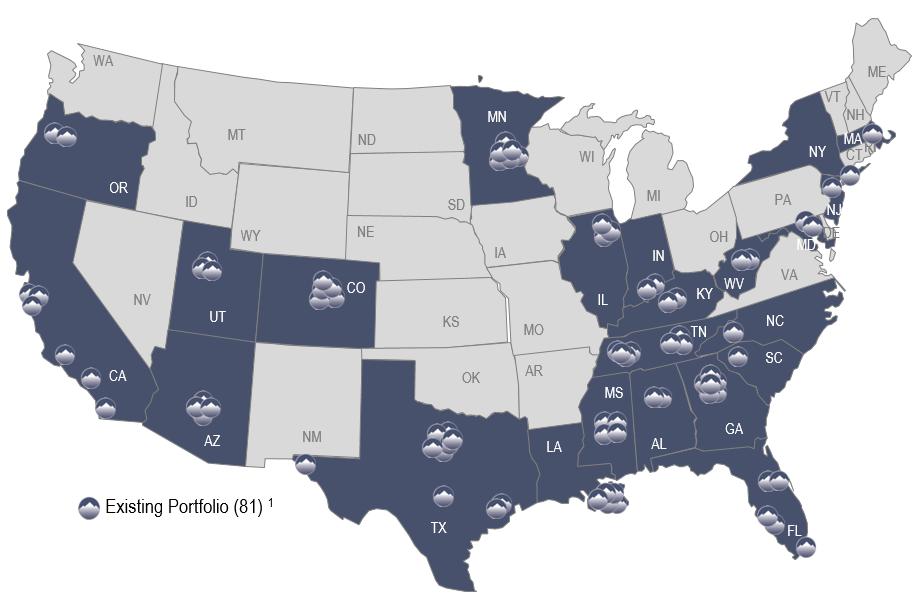
(1) Includes all acquisitions and dispositions closed as of November 2, 2016.
Forward-Looking Statements
This press release contains statements that are “forward-looking statements” within the meaning of Section 27A of the Securities Act of 1933, as amended, and Section 21E of the Securities Exchange Act of 1934, as amended, pursuant to the safe harbor provisions of the Private Securities Litigation Reform Act of 1995. Forward-looking statements are generally identifiable by use of forward-looking terminology such as “may,” “will,” “should,” “potential,” “intend,” “expect,” “seek,” “anticipate,” “estimate,” “approximately,” “believe,” “could,” “project,” “predict,” “forecast,” “continue,” “plan,” “likely,” “would” or other similar words or expressions. Forward-looking statements are based on certain assumptions and can include future expectations, future plans and strategies, financial and operating projections or other forward-looking information. Examples of forward-looking statements include the following: the Company’s ability to realize embedded growth from the deployment of renovation capital; projections of the Company’s revenues and expenses, capital expenditures or other financial items; descriptions of the Company’s plans or objectives for future operations, acquisitions, dispositions, financings, redemptions or services; forecasts of the Company’s future financial performance and potential increases in average daily rate, occupancy, RevPAR, room supply and demand, FFO and AFFO; the Company’s outlook with respect to pro forma RevPAR, pro forma RevPAR growth, RevPAR, RevPAR growth, AFFO, AFFO per diluted share and unit and renovation capital deployed; and descriptions of assumptions underlying or relating to any of the foregoing expectations regarding the timing of their occurrence. These forward-looking statements are subject to various risks and uncertainties, not all of which are known to the Company and many of which are beyond the Company’s control, which could cause actual results to differ materially from such statements. These risks and uncertainties include, but are not limited to, the state of the U.S. economy, supply and demand in the hotel industry, and other factors as are described in greater detail in the Company’s filings with the Securities and Exchange Commission (“SEC”). Unless legally required, the Company disclaims any obligation to update any forward-looking statements, whether as a result of new information, future events, or otherwise.
For information about the Company’s business and financial results, please refer to the “Management’s Discussion and Analysis of Financial Condition and Results of Operations” and “Risk Factors” sections of the Company’s Annual Report on Form 10-K for the year ended December 31, 2015, filed with the SEC, and its quarterly and other periodic filings with the SEC. The Company undertakes no duty to update the statements in this release to conform the statements to actual results or changes in the Company’s expectations.
| | 9 | Page |
SUMMIT HOTEL PROPERTIES, INC.
Consolidated Balance Sheets
(Amounts in thousands)
| September 30, 2016 | December 31, 2015 | |||||||
| (Unaudited) | ||||||||
| ASSETS | ||||||||
| Investment in hotel properties, net | $ | 1,470,749 | $ | 1,333,407 | ||||
| Land held for development | 5,742 | 5,742 | ||||||
| Assets held for sale | 62,613 | 133,138 | ||||||
| Investment in real estate loans, net | 17,582 | 12,803 | ||||||
| Cash and cash equivalents | 40,491 | 29,326 | ||||||
| Restricted cash | 25,567 | 23,073 | ||||||
| Trade receivables, net | 15,232 | 9,437 | ||||||
| Prepaid expenses and other | 8,013 | 15,281 | ||||||
| Deferred charges, net | 3,729 | 3,628 | ||||||
| Other assets | 10,510 | 9,559 | ||||||
| Total assets | $ | 1,660,228 | $ | 1,575,394 | ||||
| LIABILITIES AND EQUITY | ||||||||
| Liabilities: | ||||||||
| Debt, net of debt issuance costs | $ | 618,892 | $ | 671,536 | ||||
| Accounts payable | 4,162 | 2,947 | ||||||
| Accrued expenses and other | 53,829 | 42,174 | ||||||
| Derivative financial instruments | 1,913 | 1,811 | ||||||
| Total liabilities | 678,796 | 718,468 | ||||||
| Total stockholders' equity | 977,436 | 852,711 | ||||||
| Non-controlling interests in operating partnership | 3,996 | 4,215 | ||||||
| Total equity | 981,432 | 856,926 | ||||||
| Total liabilities and equity | $ | 1,660,228 | $ | 1,575,394 | ||||
| | 10 | Page |
SUMMIT HOTEL PROPERTIES, INC.
Consolidated Statements of Operations
(Unaudited)
(Amounts in thousands, except per share amounts)
| For the Three Months Ended September 30, | For the Nine Months Ended September 30, | |||||||||||||||
| 2016 | 2015 | 2016 | 2015 | |||||||||||||
| Revenues: | ||||||||||||||||
| Room | $ | 110,777 | $ | 118,292 | $ | 340,657 | $ | 333,431 | ||||||||
| Other hotel operations revenue | 7,559 | 6,799 | 22,956 | 19,985 | ||||||||||||
| Total revenues | 118,336 | 125,091 | 363,613 | 353,416 | ||||||||||||
| Expenses: | ||||||||||||||||
| Hotel operating expenses: | ||||||||||||||||
| Room | 28,705 | 29,428 | 82,959 | 82,663 | ||||||||||||
| Other direct | 15,513 | 17,073 | 48,596 | 47,968 | ||||||||||||
| Other indirect | 29,312 | 31,893 | 92,870 | 92,308 | ||||||||||||
| Total hotel operating expenses | 73,530 | 78,394 | 224,425 | 222,939 | ||||||||||||
| Depreciation and amortization | 17,887 | 15,916 | 53,715 | 46,583 | ||||||||||||
| Corporate general and administrative | 4,388 | 6,897 | 14,358 | 16,775 | ||||||||||||
| Hotel property acquisition costs | 527 | 837 | 2,809 | 950 | ||||||||||||
| Loss on impairment of assets | 577 | 1,115 | 577 | 1,115 | ||||||||||||
| Total expenses | 96,909 | 103,159 | 295,884 | 288,362 | ||||||||||||
| Operating income | 21,427 | 21,932 | 67,729 | 65,054 | ||||||||||||
| Other income (expense): | ||||||||||||||||
| Interest expense | (6,626 | ) | (8,083 | ) | (21,232 | ) | (22,985 | ) | ||||||||
| Gain (loss) on disposal of assets, net | 10,491 | (1 | ) | 49,997 | (712 | ) | ||||||||||
| Other income (expense), net | 661 | (58 | ) | 1,854 | 727 | |||||||||||
| Total other income (expense) | 4,526 | (8,142 | ) | 30,619 | (22,970 | ) | ||||||||||
| Income from continuing operations before income taxes | 25,953 | 13,790 | 98,348 | 42,084 | ||||||||||||
| Income tax benefit (expense) | 1,245 | (184 | ) | (461 | ) | (1,586 | ) | |||||||||
| Net income | 27,198 | 13,606 | 97,887 | 40,498 | ||||||||||||
| Less - Income attributable to Operating Partnership | (115 | ) | (66 | ) | (454 | ) | (220 | ) | ||||||||
| Net income attributable to Summit Hotel Properties, Inc. | 27,083 | 13,540 | 97,433 | 40,278 | ||||||||||||
| Preferred dividends | (4,993 | ) | (4,147 | ) | (13,287 | ) | (12,441 | ) | ||||||||
| Net income attributable to common stockholders | $ | 22,090 | $ | 9,393 | $ | 84,146 | $ | 27,837 | ||||||||
| Earnings per share: | ||||||||||||||||
| Basic | $ | 0.25 | $ | 0.11 | $ | 0.97 | $ | 0.32 | ||||||||
| Diluted | $ | 0.25 | $ | 0.11 | $ | 0.96 | $ | 0.32 | ||||||||
| Weighted average common shares outstanding: | ||||||||||||||||
| Basic | 86,492 | 85,995 | 86,428 | 85,844 | ||||||||||||
| Diluted | 87,401 | 87,065 | 87,319 | 87,000 | ||||||||||||
| | 11 | Page |
SUMMIT HOTEL PROPERTIES, INC.
Reconciliation of Net Income to Non-GAAP Measures – Funds From Operations
(Unaudited)
(Amounts in thousands except per share and unit)
| For
the Three Months Ended September 30, | For
the Nine Months Ended | |||||||||||||||
| 2016 | 2015 | 2016 | 2015 | |||||||||||||
| Net income | $ | 27,198 | $ | 13,606 | $ | 97,887 | $ | 40,498 | ||||||||
| Preferred dividends | (4,993 | ) | (4,147 | ) | (13,287 | ) | (12,441 | ) | ||||||||
| Net income applicable to common shares and units | 22,205 | 9,459 | 84,600 | 28,057 | ||||||||||||
| Net income per common share and unit | $ | 0.25 | $ | 0.11 | $ | 0.97 | $ | 0.32 | ||||||||
| Real estate-related depreciation (1) | 17,802 | 15,840 | 53,458 | 46,286 | ||||||||||||
| Loss on impairment of assets | 577 | 1,115 | 577 | 1,115 | ||||||||||||
| (Gain) loss on disposal of assets | (10,491 | ) | 1 | (49,997 | ) | 712 | ||||||||||
| FFO applicable to common shares and units | 30,093 | 26,415 | 88,638 | 76,170 | ||||||||||||
| FFO per common share and unit | $ | 0.34 | $ | 0.30 | $ | 1.02 | $ | 0.88 | ||||||||
| Amortization of deferred financing costs | 522 | 431 | 1,625 | 1,250 | ||||||||||||
| Amortization of franchise fees (1) | 85 | 76 | 257 | 297 | ||||||||||||
| Equity based compensation | 1,020 | 1,960 | 3,202 | 3,968 | ||||||||||||
| Hotel property acquisition costs | 527 | 837 | 2,809 | 950 | ||||||||||||
| Debt transaction costs | 38 | 337 | 514 | 337 | ||||||||||||
| (Gain) loss on derivative instruments | (19 | ) | - | - | 1 | |||||||||||
| Expenses related to the transition of directors and officers | - | 1,950 | - | 1,950 | ||||||||||||
| Adjusted Funds From Operations | $ | 32,266 | $ | 32,006 | $ | 97,045 | $ | 84,923 | ||||||||
| AFFO per common share and unit | $ | 0.37 | $ | 0.37 | $ | 1.11 | $ | 0.98 | ||||||||
| Weighted average diluted common units (2) | 87,401 | 87,065 | 87,319 | 87,000 | ||||||||||||
| (1) | The total of these line items represents depreciation and amortization as reported on the Company’s Consolidated Statements of Operations for the periods presented. |
| (2) | The Company includes the outstanding OP units issued by Summit Hotel OP, LP, the Company’s operating partnership, held by limited partners other than the Company because the OP units are redeemable for cash or, at the Company’s option, shares of the Company’s common stock on a one-for-one basis. |
| | 12 | Page |
SUMMIT HOTEL PROPERTIES, INC.
Reconciliation of Net Income to Non-GAAP Measures – EBITDA
(Amounts in thousands)
(Unaudited)
For the Three Months Ended
| For
the Nine Months Ended | |||||||||||||||
| 2016 | 2015 | 2016 | 2015 | |||||||||||||
| Net income | $ | 27,198 | $ | 13,606 | $ | 97,887 | $ | 40,498 | ||||||||
| Depreciation and amortization | 17,887 | 15,916 | 53,715 | 46,583 | ||||||||||||
| Interest expense | 6,626 | 8,083 | 21,232 | 22,985 | ||||||||||||
| Interest income | (13 | ) | (254 | ) | (18 | ) | (745 | ) | ||||||||
| Income tax (benefit) expense | (1,245 | ) | 184 | 461 | 1,586 | |||||||||||
| EBITDA | $ | 50,453 | $ | 37,535 | $ | 173,277 | $ | 110,907 | ||||||||
| Equity based compensation | 1,020 | 1,960 | 3,202 | 3,968 | ||||||||||||
| Hotel property acquisition costs | 527 | 837 | 2,809 | 950 | ||||||||||||
| Loss on impairment of assets | 577 | 1,115 | 577 | 1,115 | ||||||||||||
| Debt transaction costs | 38 | 337 | 514 | 337 | ||||||||||||
| (Gain) loss on disposal of assets | (10,491 | ) | 1 | (49,997 | ) | 712 | ||||||||||
| (Gain) loss on derivative instruments | (19 | ) | - | - | 1 | |||||||||||
| Expenses related to the transition of directors and officers | - | 1,950 | - | 1,950 | ||||||||||||
| Adjusted EBITDA | $ | 42,105 | $ | 43,735 | $ | 130,382 | $ | 119,940 | ||||||||
| | 13 | Page |
SUMMIT HOTEL PROPERTIES, INC.
Pro Forma (1) Operational and Statistical Data
(Dollars in thousands, except operating metrics)
(Unaudited)
For the Three Months Ended September 30, | For the Nine Months Ended September 30, | |||||||||||||||
| 2016 | 2015 | 2016 | 2015 | |||||||||||||
| REVENUES | ||||||||||||||||
| Room | $ | 112,085 | $ | 109,632 | $ | 339,236 | $ | 322,401 | ||||||||
| Other hotel operations revenue | 7,776 | 7,989 | 23,912 | 23,490 | ||||||||||||
| Total revenues | 119,861 | 117,621 | 363,148 | 345,891 | ||||||||||||
| EXPENSES | ||||||||||||||||
| Hotel operating expenses | ||||||||||||||||
| Room | 28,900 | 26,860 | 81,894 | 77,145 | ||||||||||||
| Other direct | 16,004 | 18,861 | 49,802 | 56,850 | ||||||||||||
| Other indirect | 29,556 | 27,564 | 91,220 | 81,364 | ||||||||||||
| Total hotel operating expenses | 74,460 | 73,285 | 222,916 | 215,359 | ||||||||||||
| Hotel EBITDA | $ | 45,401 | $ | 44,336 | $ | 140,232 | $ | 130,532 | ||||||||
| 2015 | 2016 | TTM Ended | ||||||||||||||||||
| Q4 | Q1 | Q2 | Q3 | September 30, 2016 | ||||||||||||||||
| Room | $ | 100,092 | $ | 107,846 | $ | 119,305 | $ | 112,085 | $ | 439,328 | ||||||||||
| Other hotel operations revenue | 7,947 | 7,854 | 8,282 | 7,776 | 31,859 | |||||||||||||||
| Total revenues | $ | 108,039 | $ | 115,700 | $ | 127,587 | $ | 119,861 | $ | 471,187 | ||||||||||
| Hotel EBITDA | $ | 37,708 | $ | 43,684 | $ | 51,147 | $ | 45,401 | $ | 177,940 | ||||||||||
| Hotel EBITDA Margin | 34.9 | % | 37.8 | % | 40.1 | % | 37.9 | % | 37.8 | % | ||||||||||
| Rooms occupied | 735,874 | 753,285 | 811,626 | 780,765 | 3,081,550 | |||||||||||||||
| Rooms available | 989,092 | 978,341 | 978,341 | 989,092 | 3,934,866 | |||||||||||||||
| Occupancy | 74.4 | % | 77.0 | % | 83.0 | % | 78.9 | % | 78.3 | % | ||||||||||
| ADR | $ | 136.02 | $ | 143.17 | $ | 147.00 | $ | 143.56 | $ | 142.57 | ||||||||||
| RevPAR | $ | 101.20 | $ | 110.23 | $ | 121.95 | $ | 113.32 | $ | 111.65 | ||||||||||
| (1) | Pro forma information includes operating results for 80 hotels owned as of September 30, 2016 as if each hotel had been owned by the Company since January 1, 2015. As a result, these pro forma operating and financial measures include operating results for certain hotels for periods prior to the Company’s ownership. |
| | 14 | Page |
SUMMIT HOTEL PROPERTIES, INC.
Pro Forma and Same-Store Data
(Unaudited)
| For
the Three Months Ended September 30, | For
the Nine Months Ended | |||||||||||||||
| 2016 | 2015 | 2016 | 2015 | |||||||||||||
| Pro Forma 1 (80 hotels) | ||||||||||||||||
| Rooms occupied | 780,765 | 789,174 | 2,345,676 | 2,295,569 | ||||||||||||
| Rooms available | 989,092 | 989,092 | 2,945,774 | 2,913,206 | ||||||||||||
| Occupancy | 78.9 | % | 79.8 | % | 79.6 | % | 78.8 | % | ||||||||
| ADR | $ | 143.56 | $ | 138.92 | $ | 144.62 | $ | 140.44 | ||||||||
| RevPAR | $ | 113.32 | $ | 110.84 | $ | 115.16 | $ | 110.67 | ||||||||
| Occupancy growth | -1.1 | % | 1.1 | % | ||||||||||||
| ADR growth | 3.3 | % | 3.0 | % | ||||||||||||
| RevPAR growth | 2.2 | % | 4.1 | % | ||||||||||||
For
the Three Months Ended | For
the Nine Months Ended | |||||||||||||||
| 2016 | 2015 | 2016 | 2015 | |||||||||||||
| Same-Store 2 (70 hotels) | ||||||||||||||||
| Rooms occupied | 656,798 | 666,586 | 1,990,594 | 1,953,874 | ||||||||||||
| Rooms available | 843,272 | 843,272 | 2,511,484 | 2,502,023 | ||||||||||||
| Occupancy | 77.9 | % | 79.0 | % | 79.3 | % | 78.1 | % | ||||||||
| ADR | $ | 137.81 | $ | 133.69 | $ | 140.32 | $ | 136.61 | ||||||||
| RevPAR | $ | 107.33 | $ | 105.68 | $ | 111.22 | $ | 106.68 | ||||||||
| Occupancy growth | -1.5 | % | 1.5 | % | ||||||||||||
| ADR growth | 3.1 | % | 2.7 | % | ||||||||||||
| RevPAR growth | 1.6 | % | 4.3 | % | ||||||||||||
| (1) | Pro forma information includes operating results for 80 hotels owned as of September 30, 2016, as if each hotel had been owned by the Company since January 1, 2015. As a result, these pro forma operating and financial measures include operating results for certain hotels for periods prior to the Company’s ownership. |
| (2) | Same-store information includes operating results for 70 hotels owned by the Company as of January 1, 2015, and at all times during the three and nine months ended September 30, 2016, and 2015. |
| | 15 | Page |
SUMMIT HOTEL PROPERTIES, INC.
Reconciliation of Net Income to Non-GAAP Measures – Funds From Operations for Financial Outlook
(Unaudited)
(Amounts in thousands except per share and unit)
| For the Three Months Ending December 31, 2016 | For the Year Ending December 31, 2016 | |||||||||||||||
| Low | High | Low | High | |||||||||||||
| Net income | $ | 7,100 | $ | 8,900 | $ | 105,500 | $ | 107,300 | ||||||||
| Preferred dividends | (4,900 | ) | (4,900 | ) | (18,200 | ) | (18,200 | ) | ||||||||
| Net income applicable to common shares and units | 2,200 | 4,000 | 87,300 | 89,100 | ||||||||||||
| Net income per common share and unit | $ | 0.03 | $ | 0.05 | $ | 1.00 | $ | 1.02 | ||||||||
| Real estate-related depreciation | 17,600 | 17,600 | 71,000 | 71,000 | ||||||||||||
| Gain on disposal of assets | - | - | (50,000 | ) | (50,000 | ) | ||||||||||
| FFO applicable to common shares and units | 19,800 | 21,600 | 108,300 | 110,100 | ||||||||||||
| FFO per common share and common unit | $ | 0.23 | $ | 0.25 | $ | 1.24 | $ | 1.26 | ||||||||
| Amortization of deferred financing costs | 500 | 500 | 2,100 | 2,100 | ||||||||||||
| Amortization of franchise fees | 100 | 100 | 400 | 400 | ||||||||||||
| Equity based compensation | 1,000 | 1,000 | 4,200 | 4,200 | ||||||||||||
| Hotel property acquisition costs | 400 | 400 | 3,200 | 3,200 | ||||||||||||
| Debt transaction costs | - | - | 500 | 500 | ||||||||||||
| Adjusted Funds From Operations | $ | 21,800 | $ | 23,600 | $ | 118,700 | $ | 120,500 | ||||||||
| AFFO per common share and common unit | $ | 0.25 | $ | 0.27 | $ | 1.36 | $ | 1.38 | ||||||||
| Weighted average diluted common units (1) | 87,300 | 87,300 | 87,300 | 87,300 | ||||||||||||
| (1) | The Company includes the outstanding OP units issued by Summit Hotel OP, LP, the Company’s operating partnership, held by limited partners other than the Company because the OP units are redeemable for cash or, at the Company’s option, shares of the Company’s common stock on a one-for-one basis. |
| | 16 | Page |
Non-GAAP Financial Measures
Funds From Operations (“FFO”) and Adjusted FFO (“AFFO”)
As defined by the National Association of Real Estate Investment Trusts (“NAREIT”), FFO represents net income or loss (computed in accordance with GAAP), excluding preferred dividends, gains (or losses) from sales of real property, impairment losses on real estate assets, items classified by GAAP as extraordinary, the cumulative effect of changes in accounting principles, plus depreciation and amortization related to real estate assets, and adjustments for unconsolidated partnerships and joint ventures. Unless otherwise indicated, we present FFO applicable to our common shares and common units. We present FFO because we consider it an important supplemental measure of our operational performance and believe it is frequently used by securities analysts, investors, and other interested parties in the evaluation of REITs, many of which present FFO when reporting their results. FFO is intended to exclude GAAP historical cost depreciation and amortization, which assumes that the value of real estate assets diminishes ratably over time. Historically, however, real estate values have risen or fallen with market conditions. Because FFO excludes depreciation and amortization related to real estate assets, gains and losses from real property dispositions and impairment losses on real estate assets, it provides a performance measure that, when compared year over year, reflects the effect to operations from trends in occupancy, guestroom rates, operating costs, development activities and interest costs, providing perspective not immediately apparent from net income. FFO should not be considered as an alternative to net income (loss) (computed in accordance with GAAP) as an indicator of our liquidity, nor is it indicative of funds available to fund our cash needs, including our ability to pay dividends or make distributions. References to FFO are based on the NAREIT-defined measure unless otherwise noted.
We further adjust FFO for certain additional items that are not included in the definition of FFO, such as hotel transaction and pursuit costs, equity-based compensation, loan transaction costs, prepayment penalties and certain other expenses, which we refer to as AFFO. We believe that AFFO provides investors with another financial measure that may facilitate comparisons of operating performance between periods and between REITs.
We caution investors that amounts presented in accordance with our definitions of FFO and AFFO may not be comparable to similar measures disclosed by other companies, since not all companies calculate these non-GAAP measures in the same manner. FFO and AFFO should be considered along with, but not as an alternative to, net income (loss) as a measure of our operating performance. FFO and AFFO may include funds that may not be available for our discretionary use due to functional requirements to conserve funds for capital expenditures, property acquisitions, debt service obligations and other commitments and uncertainties. Although we believe that FFO and AFFO can enhance the understanding of our financial condition and results of operations, these non-GAAP financial measures are not necessarily better indicators of any trend as compared to a comparable GAAP measure such as net income (loss). Above we have included a quantitative reconciliation of FFO and AFFO to the most directly comparable GAAP financial performance measure, which is net income (loss). Dollar amounts in such reconciliation are in thousands.
| | 17 | Page |
EBITDA, Adjusted EBITDA, and Hotel EBITDA
EBITDA represents net income or loss, excluding (i) interest, (ii) income tax expense and (iii) depreciation and amortization. We believe EBITDA is useful to investors in evaluating our operating performance because it provides investors with an indication of our ability to incur and service debt, to satisfy general operating expenses, to make capital expenditures, and to fund other cash needs or reinvest cash into our business. We also believe it helps investors meaningfully evaluate and compare the results of our operations from period to period by removing the effect of our asset base (primarily depreciation and amortization) from our operating results. Our management also uses EBITDA as one measure in determining the value of acquisitions and dispositions. We further adjust EBITDA by adding back hotel transaction and pursuit costs, equity based compensation, impairment losses, and certain other nonrecurring expenses. We believe that adjusted EBITDA provides investors with another financial measure that may facilitate comparisons of operating performance between periods and between REITs.
With respect to hotel EBITDA, we believe that excluding the effect of corporate-level expenses, non-cash items, and the portion of these items related to discontinued operations, provides a more complete understanding of the operating results over which individual hotels and operators have direct control. We believe the property-level results provide investors with supplemental information on the ongoing operational performance of our hotels and effectiveness of the third-party management companies operating our business on a property-level basis.
We caution investors that amounts presented in accordance with our definitions of EBITDA, adjusted EBITDA, and hotel EBITDA may not be comparable to similar measures disclosed by other companies, since not all companies calculate these non-GAAP measures in the same manner. EBITDA, adjusted EBITDA, and hotel EBITDA should not be considered as an alternative measure of our net income (loss) or operating performance. EBITDA, adjusted EBITDA, and hotel EBITDA may include funds that may not be available for our discretionary use due to functional requirements to conserve funds for capital expenditures and property acquisitions and other commitments and uncertainties. Although we believe that EBITDA, adjusted EBITDA, and hotel EBITDA can enhance your understanding of our financial condition and results of operations, these non-GAAP financial measures are not necessarily a better indicator of any trend as compared to a comparable GAAP measure such as net income (loss). Above, we include a quantitative reconciliation of EBITDA and adjusted EBITDA to the most directly comparable GAAP financial performance measure, which is net income (loss). Because hotel EBITDA is specific to individual hotels or groups of hotels and not to the Company as a whole, it is not directly comparable to any GAAP measure. Accordingly, hotel EBITDA has not been reconciled back to net income or loss, or any other GAAP measure, and hotel EBITDA should not be relied on as a measure of performance for our portfolio of hotels taken as a whole. Dollar amounts in such reconciliation are in thousands.
| | 18 | Page |