Attached files
| file | filename |
|---|---|
| 8-K - 8-K - SOUTH STATE Corp | ssb_currentfolio8k.htm |
Exhibit 99.1
|
|
2016 InvestorDay November 2, 2016 |
|
|
Forward Looking Statements Statements included in this communication which are not historical in nature are intended to be, and are hereby identified as, forward looking statements for purposes of the safe harbor provided by Section 27A of the Securities Act of 1933 and Section 21E of the Securities Exchange Act of 1934. The words “may,” “will,” “anticipate,” “should,” “would,” “believe,” “contemplate,” “expect,” “estimate,” “continue,” “may,” and “intend,” as well as other similar words and expressions of the future, are intended to identify forward looking statements. South State Corporation (“SSB”) cautions readers that forward looking statements are subject to certain risks and uncertainties that could cause actual results to differ materially from anticipated results. Such risks and uncertainties, include, among others, the following possibilities: the occurrence of any event, change or other circumstances that could give rise to right of one or both of the parties to terminate the definitive merger agreement between SSB and Southeastern Bank Financial Corporation (“SBFC”); the outcome of any legal proceedings that may be instituted against SSB or SBFC; the failure to obtain necessary regulatory approvals (and the risk that such approvals may result in the imposition of conditions that could adversely affect the combined company or the expected benefits of the transaction), and shareholder approvals or to satisfy any of the other conditions to the transaction on a timely basis or at all; the possibility that the anticipated benefits of the transaction are not realized when expected or at all, including as a result of the impact of, or problems arising from, the integration of the two companies or as a result of the strength of the economy and competitive factors in the areas where SSB and SBFC do business; the possibility that the transaction may be more expensive to complete than anticipated, including as a result of unexpected factors or events; diversion of management’s attention from ongoing business operations and opportunities; potential adverse reactions or changes to business or employee relationships, including those resulting from the announcement or completion of the transaction; SSB’s ability to complete the acquisition and integration of SBFC successfully; credit risk associated with an obligor’s failure to meet the terms of any contract with the bank or otherwise fail to perform as agreed; interest risk involving the effect of a change in interest rates on both the bank’s earnings and the market value of the portfolio equity; liquidity risk affecting the bank’s ability to meet its obligations when they come due; price risk focusing on changes in market factors that may affect the value of traded instruments in “mark-to-market” portfolios; transaction risk arising from problems with service or product delivery; compliance risk involving risk to earnings or capital resulting from violations of or nonconformance with laws, rules, regulations, prescribed practices, or ethical standards; strategic risk resulting from adverse business decisions or improper implementation of business decisions; reputation risk that adversely affects earnings or capital arising from negative public opinion; terrorist activities risk that results in loss of consumer confidence and economic disruptions; cybersecurity risk related to SSB’s dependence on internal computer systems and the technology of outside service providers, as well as the potential impacts of third-party security breaches, subjects the company to potential business disruptions or financial losses resulting from deliberate attacks or unintentional events; economic downturn risk resulting changes in the credit markets, greater than expected noninterest expenses, excessive loan losses and other factors and the implementation of federal spending cuts currently scheduled to go into effect; and other factors that may affect future results of SSB and SBFC. Additional factors that could cause results to differ materially from those described above can be found in SSB’s Annual Report on Form 10-K for the year ended December 31, 2015 and in its subsequent Quarterly Reports on Form 10-Q, including for the quarters ended June 30, 2016 and March 31, 2016, each of which is on file with the Securities and Exchange Commission (the “SEC”) and available in the “Investor Relations” section of SSB’s website, http://www.southstatebank.com, under the heading “SEC Filings” and in other documents SSB files with the SEC, and in SBFC’s Annual Report on Form 10-K for the year ended December 31, 2015 and in its subsequent Quarterly Reports on Form 10-Q, including for the quarters ended June 30, 2016 and March 31, 2016, each of which is on file with the SEC and in other documents SBFC files with the SEC. All forward-looking statements speak only as of the date they are made and are based on information available at that time. Neither SSB nor SBFC assumes any obligation to update forward-looking statements to reflect circumstances or events that occur after the date the forward-looking statements were made or to reflect the occurrence of unanticipated events except as required by federal securities laws. As forward-looking statements involve significant risks and uncertainties, caution should be exercised against placing undue reliance on such statements. 2 |
|
|
Welcome Jim Mabry Executive Vice President Investor Relations and Mergers & Acquisitions |
|
|
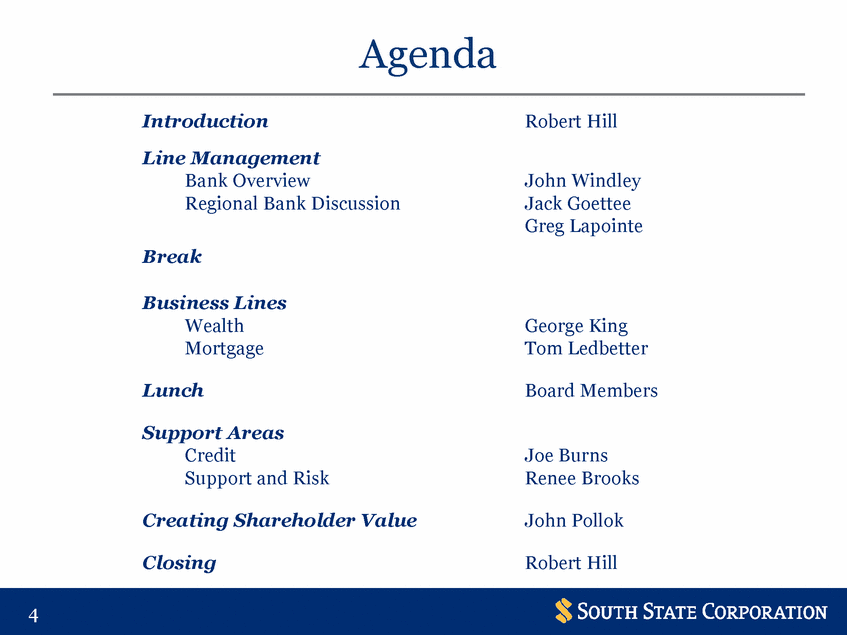
Agenda Introduction Line Management Bank Overview Regional Bank Discussion Robert Hill John Windley Jack Goettee Greg Lapointe Break Business Lines Wealth Mortgage George King Tom Ledbetter Lunch Board Members Support Areas Credit Support and Risk Joe Burns Renee Brooks Creating Shareholder Value John Pollok Closing Robert Hill 4 |
|
|
Introduction Robert Hill Chief Executive Officer South State Corporation |
|
|
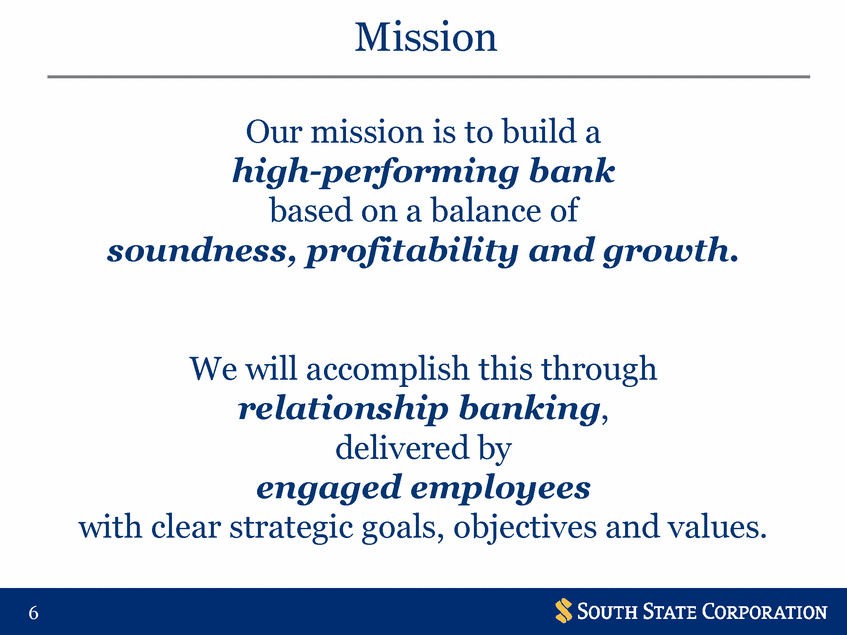
Mission 6 Our mission is to build a high-performing bank based on a balance of soundness, profitability and growth. We will accomplish this through relationship banking, delivered by engaged employees with clear strategic goals, objectives and values. |
|
|
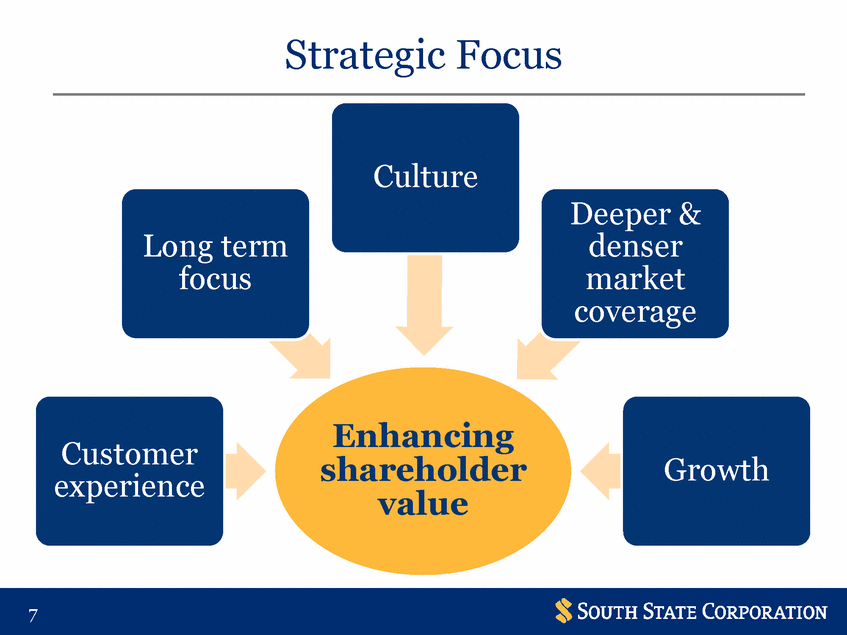
Strategic Focus Culture Deeper & denser market coverage Long term focus Enhancing shareholder value Customer experience Growth 7 |
|
|
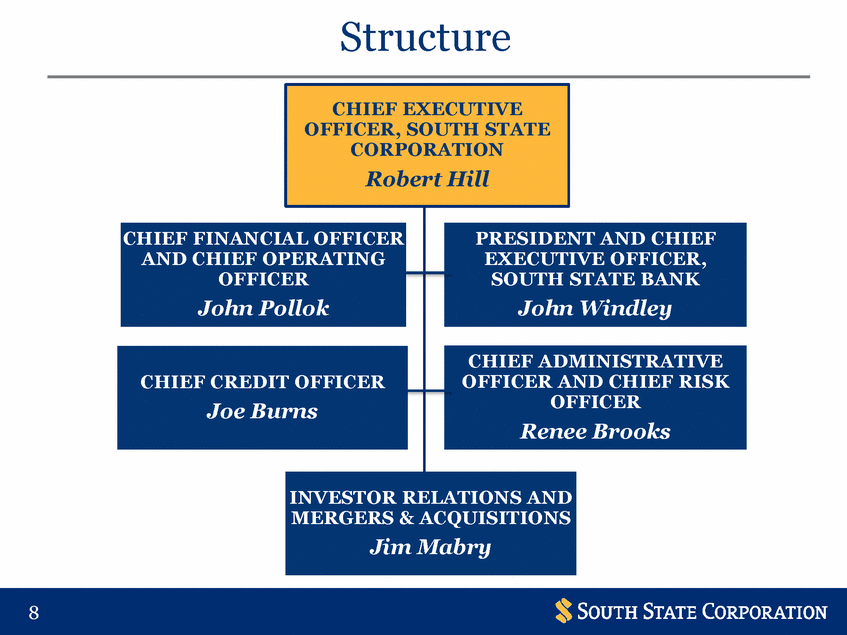
Structure Renee Brooks RELATIONS AND & ACQUISITIONS Jim Mabry 8 CHIEF EXECUTIVE OFFICER, SOUTH STATE CORPORATION Robert Hill CHIEF FINANCIAL OFFICER AND CHIEF OPERATING OFFICER John Pollok PRESIDENT AND CHIEF EXECUTIVE OFFICER, SOUTH STATE BANK John Windley CHIEF CREDIT OFFICER Joe Burns CHIEF ADMINISTRATIVE OFFICER AND CHIEF RISK OFFICER INVESTOR MERGERS |
|
|
BankOverview John Windley President and Chief Executive Officer South State Bank |
|
|
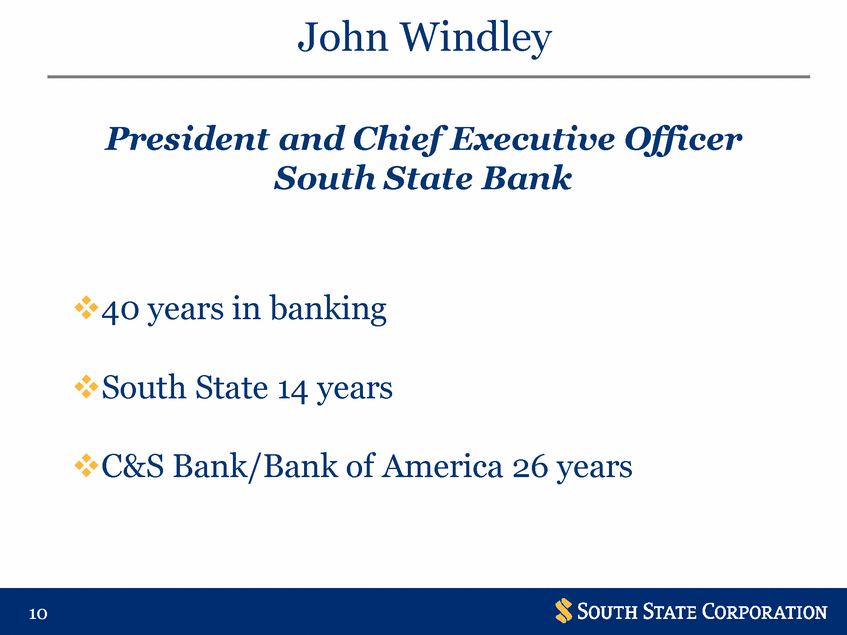
John Windley President and Chief Executive Officer South State Bank 40 years in banking South State 14 years C&S Bank/Bank of America 26 years 10 |
|
|
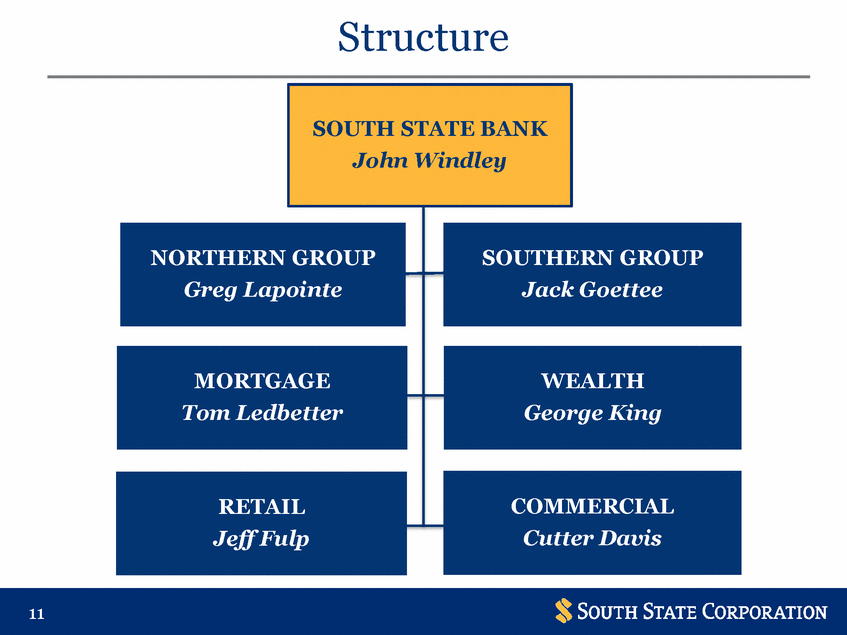
Structure 11 SOUTH STATE BANK John Windley NORTHERN GROUP Greg Lapointe SOUTHERN GROUP Jack Goettee MORTGAGE Tom Ledbetter WEALTH George King RETAIL Jeff Fulp COMMERCIAL Cutter Davis |
|
|
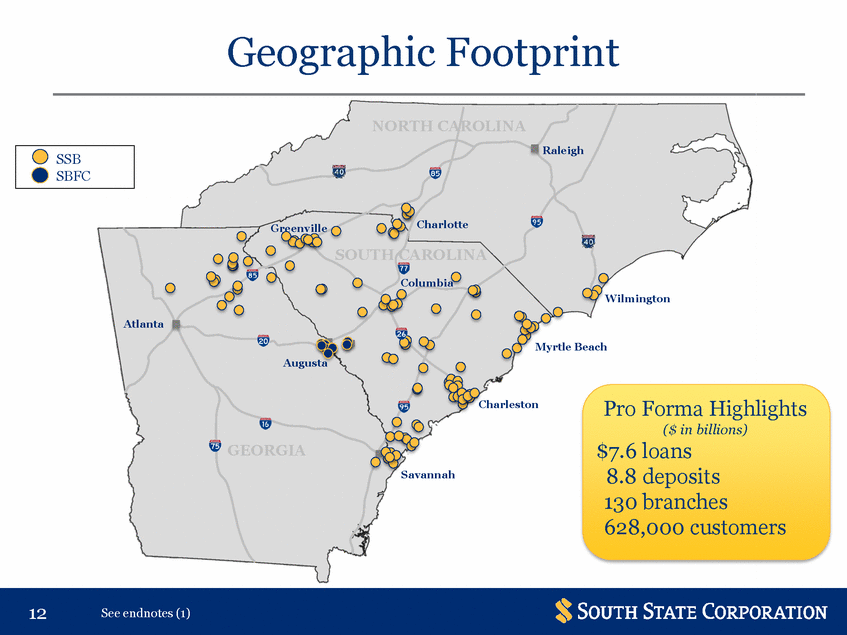
Geographic Footprint NORTH CAROLINA Raleigh Charlotte Greenville SOUTH CAROLINA Columbia Wilmington Atlanta Myrtle Beach Augusta Pro Forma Highlights ($ in billions) $7.6 loans 8.8 deposits 130 branches 628,000 customers Charleston GEORGIA Savannah 12 See endnotes (1) SSB SBFC |
|
|
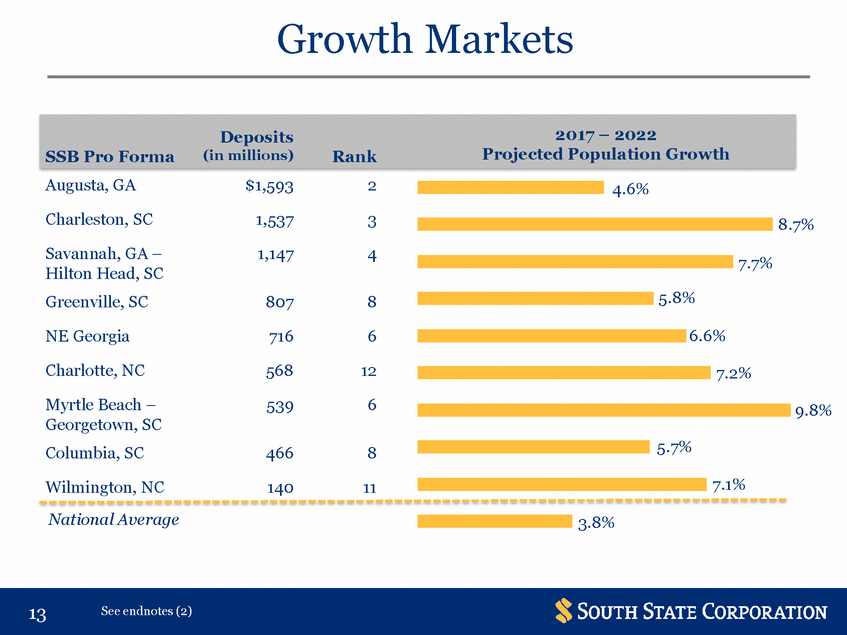
Growth Markets Augusta, GA $1,593 2 4.6% Charleston, SC 1,537 3 8.7% Savannah, GA – Hilton Head, SC Greenville, SC 1,147 4 7.7% 5.8% 807 8 NE Georgia 716 6 6.6% Charlotte, NC 568 12 7.2% Myrtle Beach – Georgetown, SC Columbia, SC 539 6 9.8% 5.7% 466 8 7.1% Wilmington, NC 140 11 National Average 3.8% 13 See endnotes (2) Deposits2017 – 2022 SSB Pro Forma(in millions)RankProjected Population Growth |
|
|
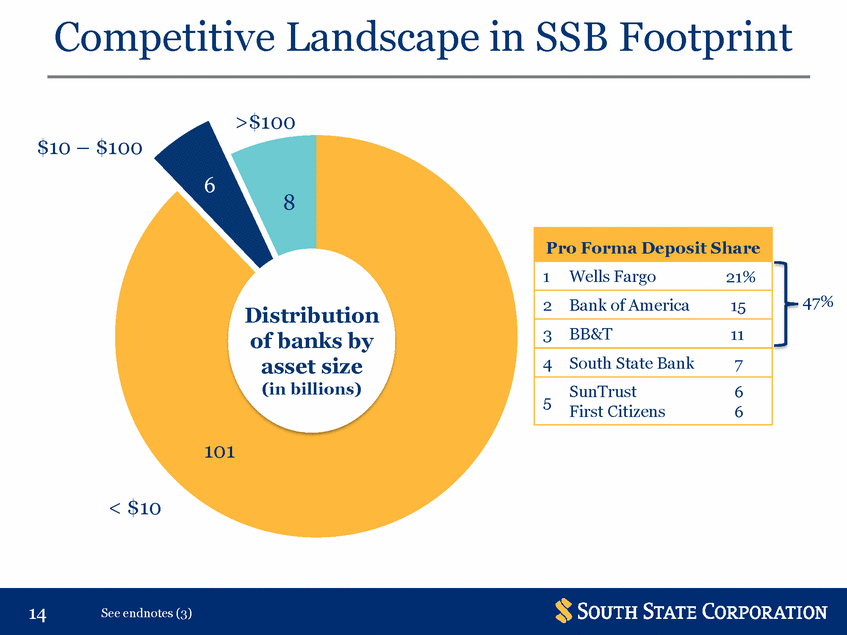
Competitive Landscape in SSB Footprint >$100 $10 – $100 6 8 47% Distribution of banks by asset size (in billions) First Citizens 6 101 < $10 14 See endnotes (3) Pro Forma Deposit Share 1Wells Fargo21% 2Bank of America15 3BB&T11 4South State Bank7 5SunTrust6 |
|
|
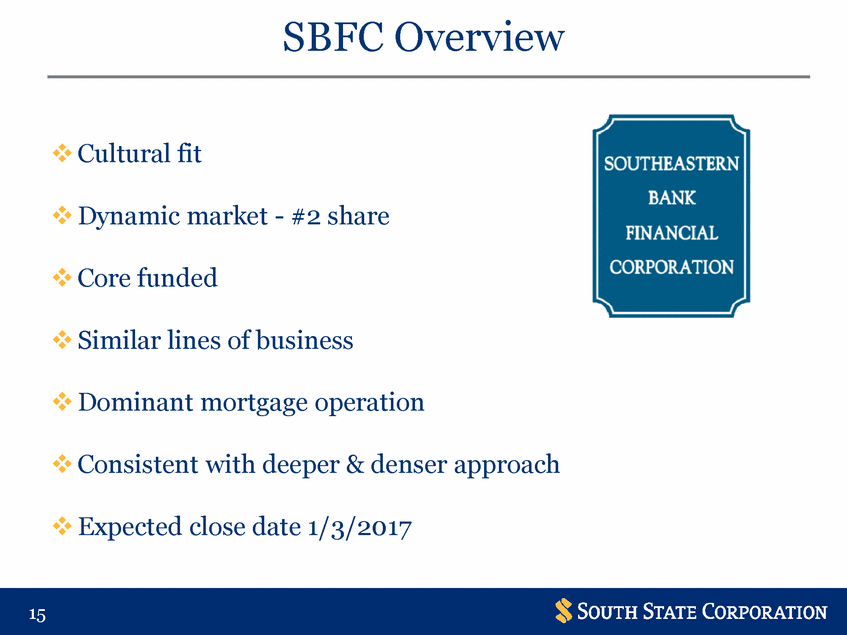
SBFC Overview Cultural fit Dynamic market - #2 share Core funded Similar lines of business Dominant mortgage operation Consistent with deeper & denser approach Expected close date 1/3/2017 15 |
|
|
Retail |
|
|
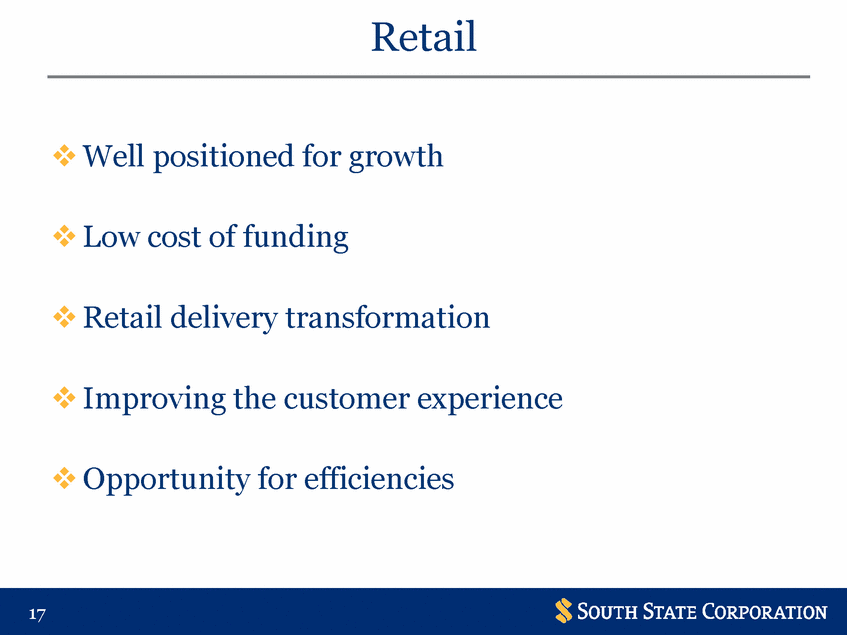
Retail Well positioned for growth Low cost of funding Retail delivery transformation Improving the customer experience Opportunity for efficiencies 17 |
|
|
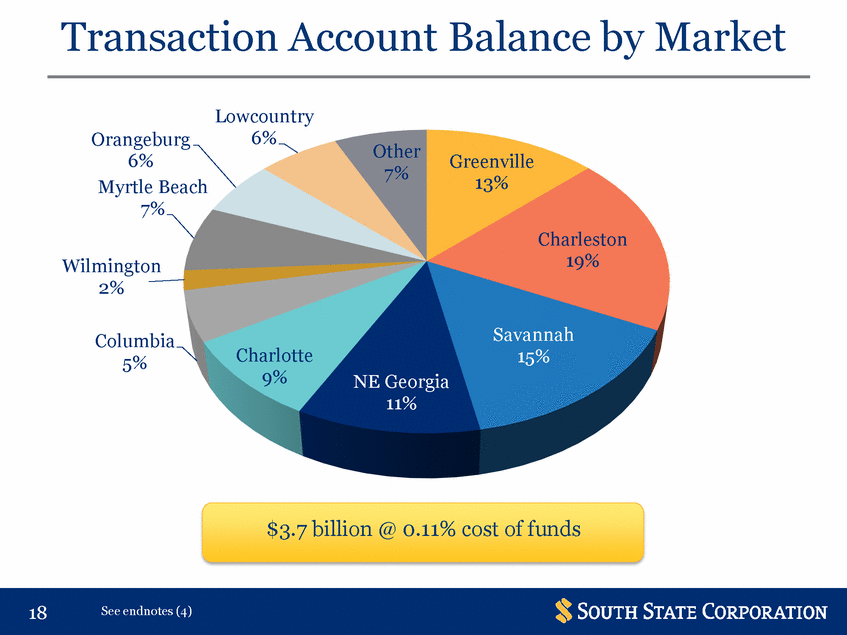
Transaction Account Balance by Market Lowcountry 6% Orangeburg 6% Myrtle Beach 7% Other 7% Greenville 13% Charleston 19% Wilmington 2% Savannah 15% Columbia 5% Charlotte 9% NE Georgia 11% $3.7 billion @ 0.11% cost of funds 18 See endnotes (4) |
|
|
Commercial |
|
|
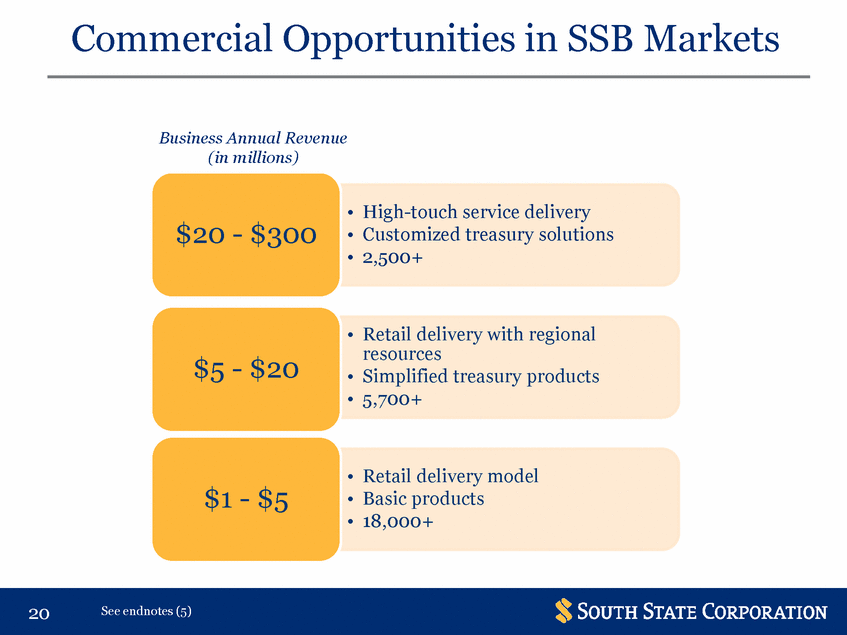
Commercial Opportunities in SSB Markets Business Annual Revenue (in millions) • • • High-touch service delivery Customized treasury solutions 2,500+ $20 - $300 • Retail delivery with regional resources Simplified treasury products 5,700+ $5 - $20 • • • • • Retail delivery model Basic products 18,000+ $1 - $5 20 See endnotes (5) |
|
|
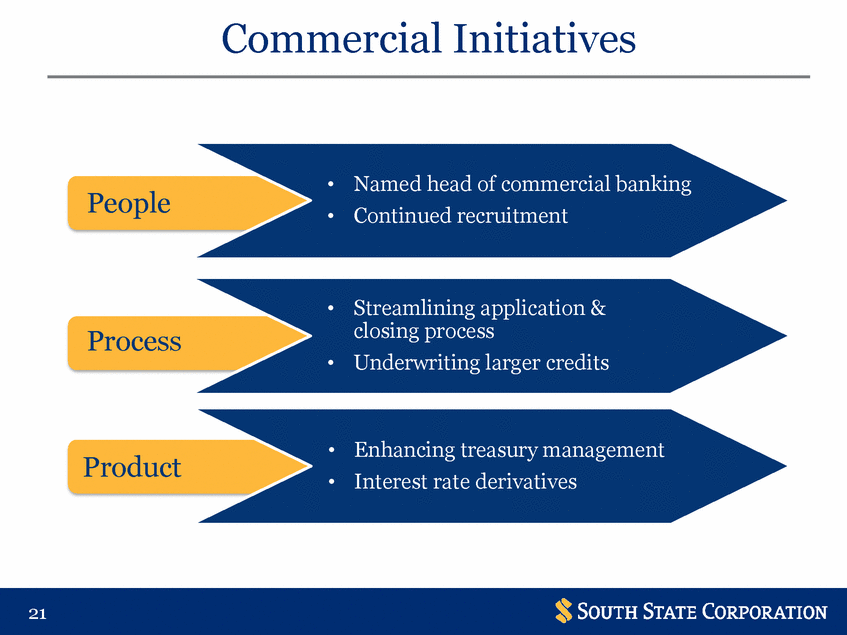
Commercial Initiatives • • Named head of commercial banking Continued recruitment People • Streamlining application & closing process Underwriting larger credits Process • • • Enhancing treasury management Interest rate derivatives Product 21 |
|
|
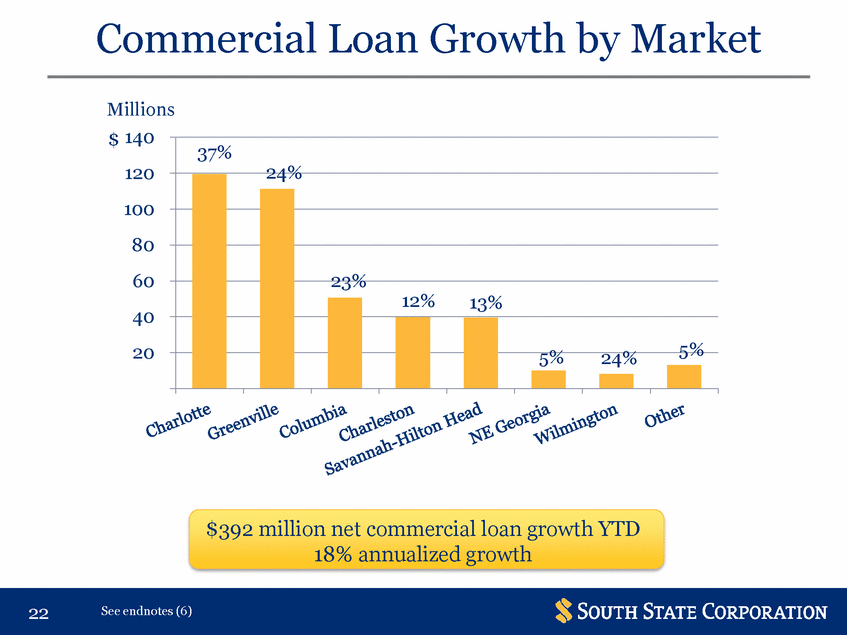
Commercial Loan Growth by Market Millions $ 140 120 100 80 60 40 20 - 24% 23% 5% 5% 24% $392 million net commercial loan growth YTD 18% annualized growth 22 See endnotes (6) 37% 12%13% |
|
|
Regional Discussion Jack Goettee Southern Group President Greg Lapointe Northern Group President |
|
|
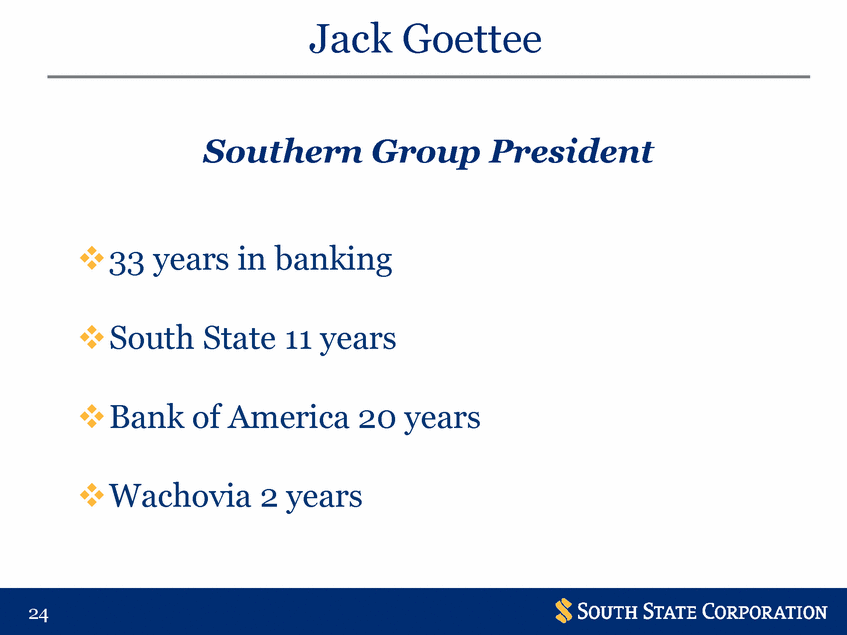
Jack Goettee Southern Group President 33 years in banking South State 11 years Bank of America 20 years Wachovia 2 years 24 |
|
|
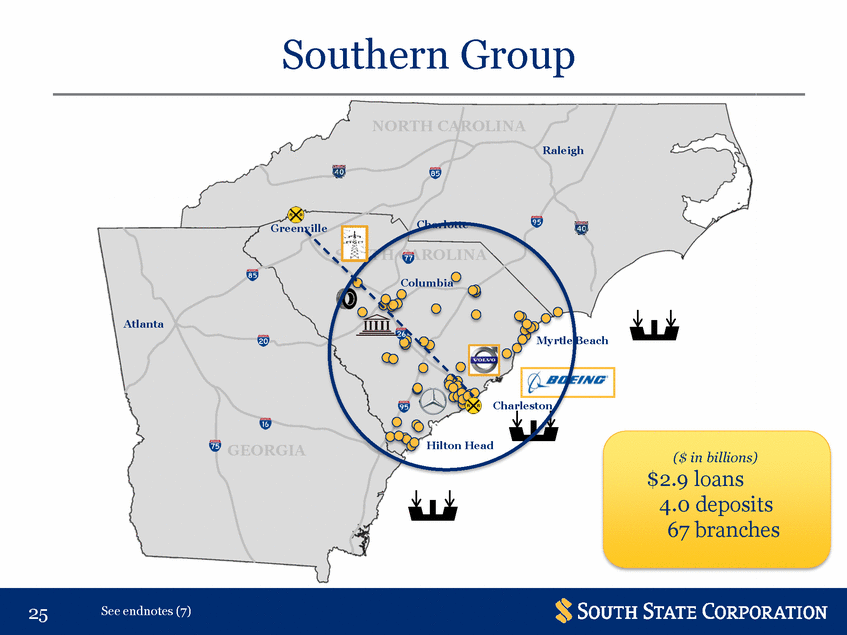
Southern Group NORTH CAROLINA Raleigh Charlotte Greenville SOUTH CAROLINA Columbia Atlanta Myrtle Beach Charleston Hilton Head GEORGIA ($ in billions) $2.9 loans 4.0 deposits 67 branches 25 See endnotes (7) |
|
|
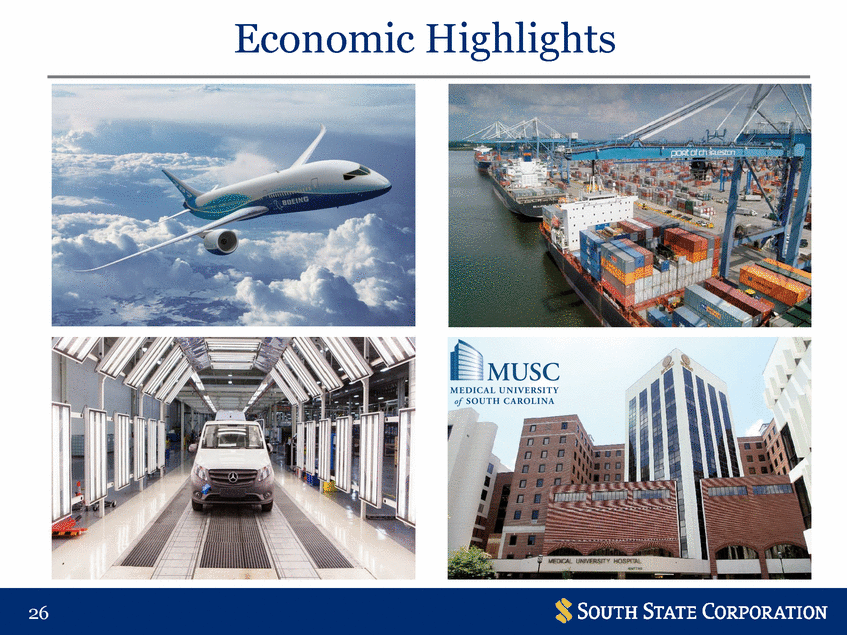
Economic Highlights ., MUSC MEDICAL UNIVERSITY of SOUTH CAROLI NA 'I' $ 26 SOUTH STATE CORPORATION |
|
|
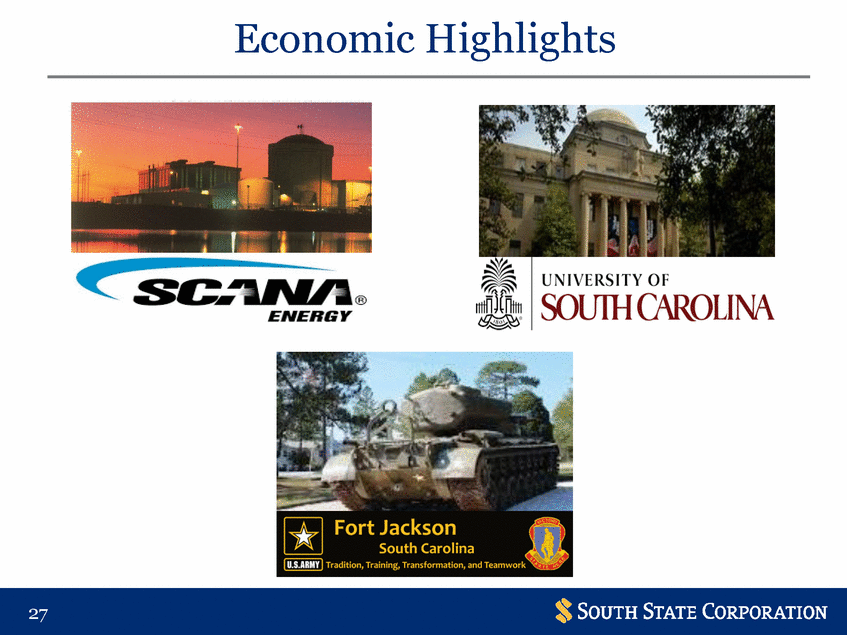
Economic Highlights 27 |
|
|
Greg Lapointe Northern Group President 32 years in banking South State 7 years Bank of America 18 years Wells Fargo/Wachovia 7 years 28 |
|
|
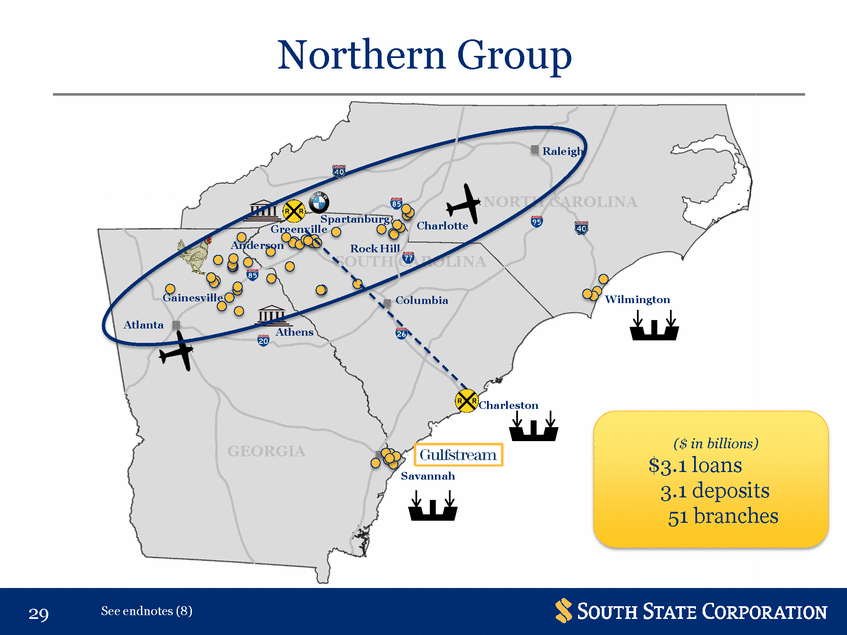
Northern Group Raleigh NORTH CAROLINA Spartanburg Greenville Charlotte Anderson Rock Hill SOUTH CAROLINA Gainesville Wilmington Columbia Atlanta Athens Charleston ($ in billions) $3.1 loans 3.1 deposits 51 branches GEORGIA Savannah 29 See endnotes (8) |
|
|
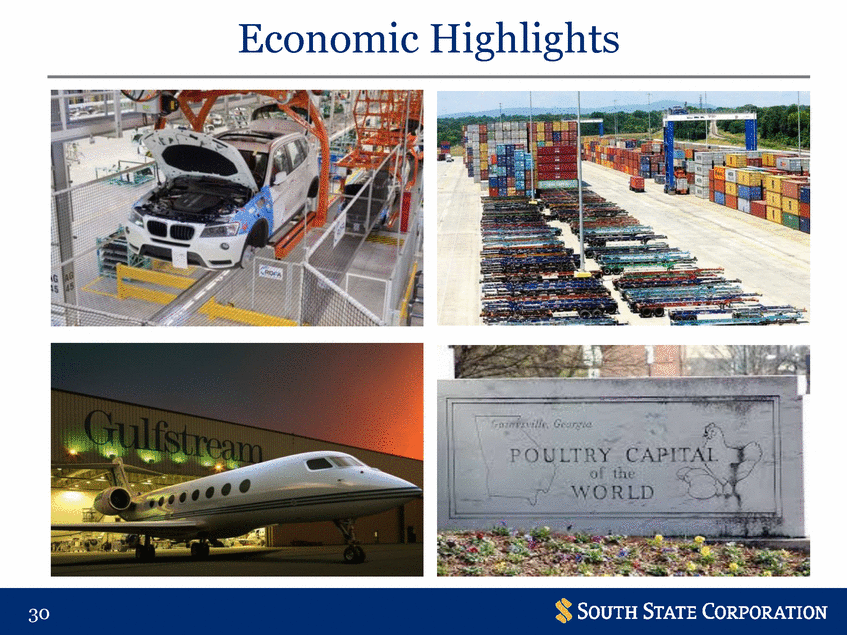
Economic Highlights POULTRYCAP 0 1h ''ORLD $ SOUTH STATE CORPORATION 30 |
|
|
Wealth George King Director of Wealth Management |
|
|
George King Director of Wealth Management 26 years in financial services industry South State 8 years Smith Barney / Citigroup 10 years Bank of Columbia / Comsouth 3 years Bank of America 5 years 32 |
|
|
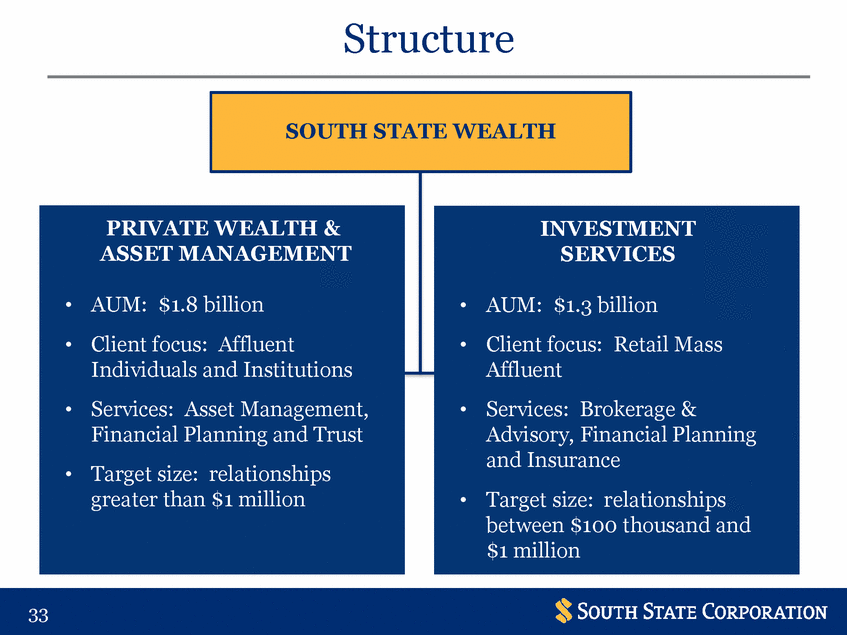
Structure 33 SOUTH STATE WEALTH PRIVATE WEALTH & ASSET MANAGEMENT •AUM: $1.8 billion •Client focus: Affluent Individuals and Institutions •Services: Asset Management, Financial Planning and Trust •Target size: relationships greater than $1 million INVESTMENT SERVICES •AUM: $1.3 billion •Client focus: Retail Mass Affluent •Services: Brokerage & Advisory, Financial Planning and Insurance •Target size: relationships between $100 thousand and $1 million |
|
|
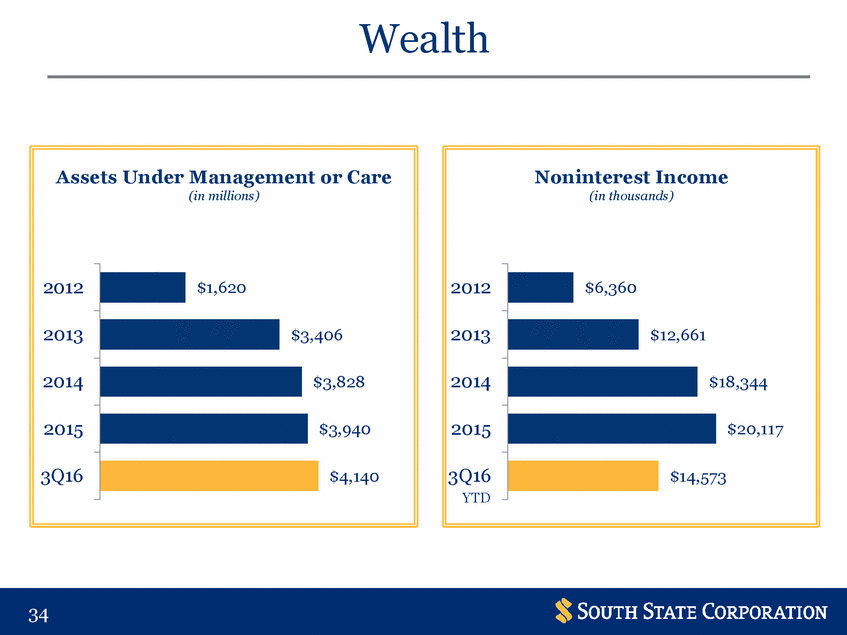
Wealth Assets Under Management or Care (in millions) Noninterest Income (in thousands) 2012 2012 2013 2013 406 2014 2014 $3,828 $18,344 2015 2015 $3,940 $20,117 3Q16 3Q16 YTD $4,140 3 34 $6,360 $12,661 $14,57 $1,620 $3, |
|
|
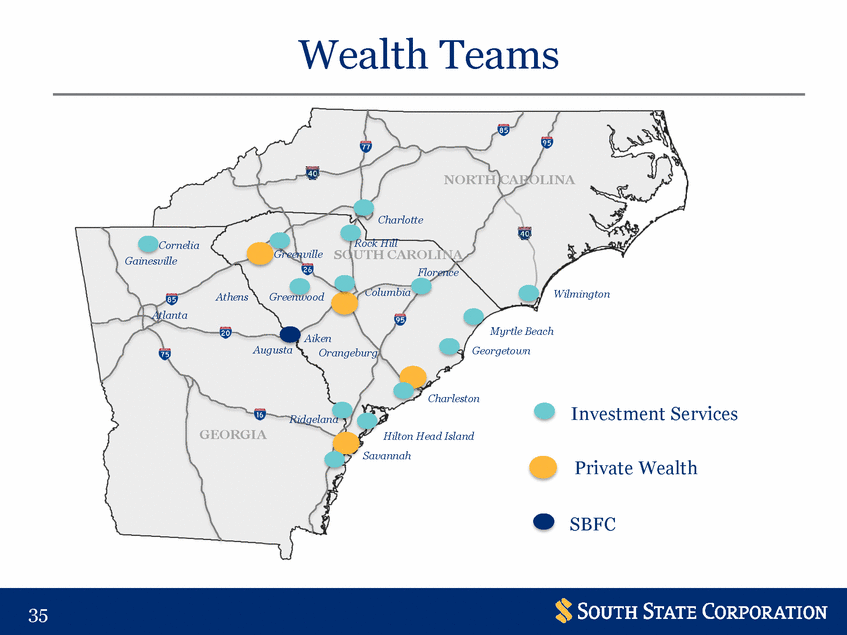
Wealth Teams NORTH CAROLINA Charlotte Rock Hill SOUTH CAROLINA Florence Columbia Cornelia Gainesville Greenville Wilmington Athens Greenwood Atlanta Myrtle Beach Georgetown Aiken Orangeburg Augusta Charleston Investment Services Ridgeland GEORGIA Hilton Head Island Savannah Private Wealth SBFC 35 |
|
|
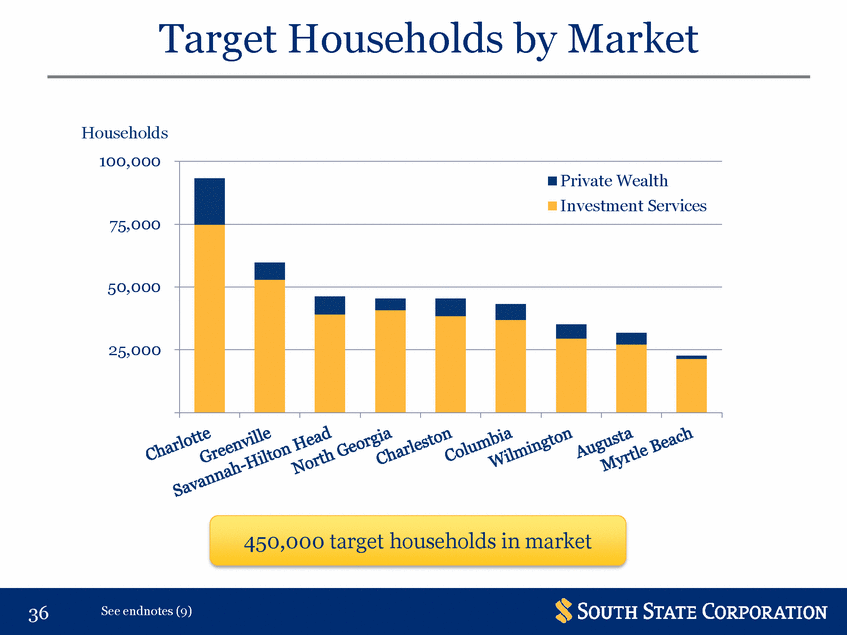
Target Households by Market Households 100,000 Private Wealth 75,000 50,000 25,000 - 450,000 target households in market 36 See endnotes (9) Investment Services |
|
|
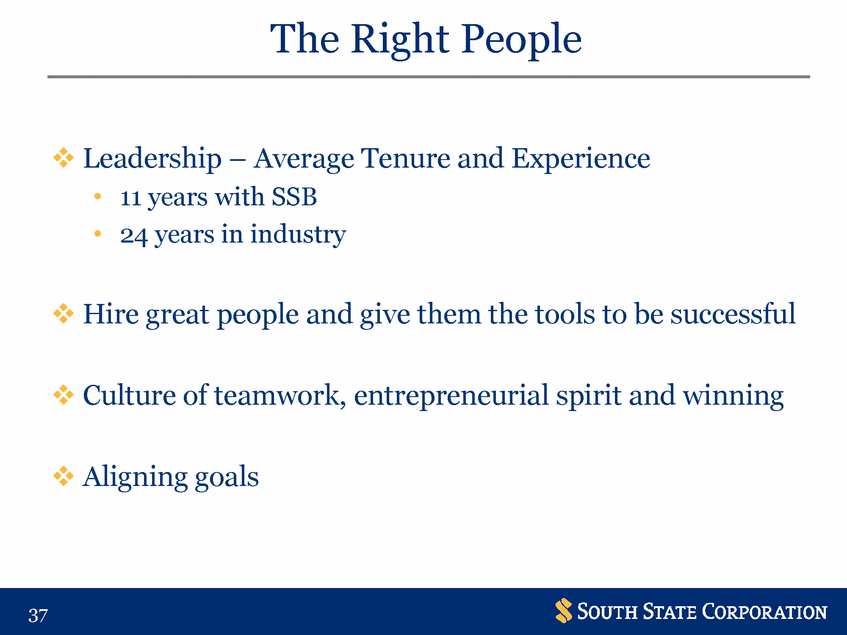
The Right People Leadership – Average Tenure and Experience • • 11 years with SSB 24 years in industry Hire great people and give them the tools to be successful Culture of teamwork, entrepreneurial spirit and winning Aligning goals 37 |
|
|
Opportunities Market expansion and penetration Changing competitive landscape Strength of brand Employer of choice 38 |
|
|
Mortgage Tom Ledbetter President, Mortgage Division |
|
|
Tom Ledbetter President, Mortgage Division 34 years in banking South State 14 years Bank of America 20 years 40 |
|
|
Structure 41 See endnotes (10) SERVICED LOANS $4.6 Billion SOLD LOANS 52% PORTFOLIO LOANS 48% DIRECT PRODUCTION 70 MLOs SOUTH STATE MORTGAGE Tom Ledbetter |
|
|
Mortgage Production (in millions) Noninterest Income (in thousands) 2012 2012 $2,198 2013 2013 1,668 2014 2014 170 2015 2015 $21,761 3Q16 YTD 3Q16 YTD 4 42 $12,545 $9,149 $16, $16,10 $ $1,195 $1,379 $1,038 |
|
|
Mortgage Investors Secondary Jumbo 5% Portfolio 48% Government 6% Fannie Mae 41% $1.0 billion production YTD 43 See endnotes (11) |
|
|
Mortgage Market Share 44 See endnotes (12) Georgia 1 Wells Fargo 8.2% 2 Quicken Loans 5.2 3 SunTrust 3.9 4 Fidelity Bank 3.4 5 Bank of America 2.6 64 South State Bank 0.4 North Carolina 1 Wells Fargo 8.9% 2 State Employees’ CU 5.8 3 BB&T 5.0 4 Quicken Loans 4.8 5 Movement Mortgage 3.6 52 South State Bank 0.4 South Carolina 1 Wells Fargo 8.2% 2 Quicken Loans 5.0 3 South State Bank 4.3 4 BB&T 3.4 5 Bank of America 3.3 |
|
|
Purchase Money 66% 45 See endnotes (13) 69% 63% 2013201420152016 YTD NationalSSB 60% 55% 53% 46% 40% |
|
|
Performance Indicators 46 See endnotes (14) Loans per FTE 8 6 4 2 MLOSupport BenchmarkSSB Customer Satisfaction 10091 8074 60 40 Net Promoter ScoreOverall Satisfaction SSB Fixed vs Adjustable IndustrySSB FixedAdjustable Loan Purpose PurchaseConstructionRefinance |
|
|
Credit Joe Burns Senior Executive Vice President Chief Credit Officer |
|
|
Joe Burns Senior Executive Vice President Chief Credit Officer 36 years in banking South State 16 years Bank of America 20 years 48 |
|
|
Structure 49 CREDIT ADMINISTRATION Joe Burns CONSUMER CHIEF CREDIT OFFICER COMMERCIAL CHIEF CREDIT OFFICER |
|
|
Asset Quality 3.00% 2.50% 2.68% 5.00% 4.13% 4.00% 1.70% 2.00% 1.50% 1.00% 0.50% 0.00% 2.50% 3.00% 2.00% 1.36% 0.74% 0.63% 1.02% 0.63% 0.48% 0.38% 0.30% 1.00% 0.00% 2011 2012 2013 2014 20153Q16 2011 2012 2013 2014 20153Q16 1.12% 248.6% 1.20% 250% 1.00% 0.80% 0.60% 0.40% 0.20% 0.00% 181.8% 200% 150% 100% 50% 0% 0.73% 121.1% 0.41% 81.2% 71.5% 64.2% 0.16% 0.09% 0.03% 2011 20122013 2014 2015 3Q16 2011 2012 2013 2014 20153Q16 50 See endnotes (15) NCOs / Average Loans ALLL / NPLs NPAs / Assets NPLs / Loans |
|
|
Credit Culture Credit Culture is the cumulative sum decisions and actions of our lending Two heads are better than one If you can’t measure it, you can’t manage it Inspect what you expect Risk based approaches 51 |
|
|
Credit Approval Process $2.9B requirements based on $2.4B recommendations at point Consumer $1.2B All managed by a robust credit committee structure & after the fact review 52 See endnotes (16) • Decentralized underwriting Commercial• Risk-based approval relationship size Small Business• Centralized underwriting & & Mortgageapprovals • Software assisted credit of sale with central overrides |
|
|
Lessons Learned Consumer Owner Occupied Commercial Owner Occupied Commercial Income Producing Commercial Non-Real Estate 22.3% 18.3 14.3 10.9 36.4% 19.6 11.8 10.0 9.4% Consumer Non-Real Estate Other Income Producing 4.0 7.1 7.7 4.4 53 Construction23.1%8.06.2 Land15.13.2 12/31/20089/30/2016 |
|
|
CRE Concentration Capacity Dollars in billions See endnotes (17) 54 September 30, 2016 Regulatory Guideline Remaining Balance % of RBC Balance % of RBC CRE $1.4 167% $2.5 300% $1.1 Construction Land & Development $0.6 74% $0.8 100% $0.2 |
|
|
Stratification of Loan Portfolio 100 % 70,000 60,000 80 50,000 60 40,000 30,000 40 20,000 20 10,000 0 - 12/31/2010 9/30/2016 < $100m $100m - $499m $500m - $999m $1M+ # of Active Notes 55 61,800 Avg Size (in thousands) All Loans $107 Commercial 275 Mortgage 192 Consumer 31 |
|
|
Focus Economy Concentration management Softening of multi-family development Pricing and structure discipline Increasing demands on information / data architecture 56 |
|
|
Support andRisk Renee Brooks Senior Executive Vice President Chief Administrative Officer and Chief Risk Officer |
|
|
Renee Brooks Chief Administrative Officer and Chief Risk Officer 25 years in banking South State 21 years Wachovia 4 years 58 |
|
|
Structure 59 SUPPORT AND RISK Renee Brooks TECHNOLOGY BANK OPERATIONS RISK/COMPLIANCE HR/TRAINING/CORPORATE COMMUNICATIONS |
|
|
Regulatory Relations Value Added Relationships (Beginning January 2017) 60 |
|
|
Investing for the Future Bank Operations Technology Risk/ Compliance 61 |
|
|
$10 Billion and Beyond Value-added Risk Framework Best in Class / Scalable Technology Improved Efficiencies Digital Strategy 62 |
|
|
Checking Account Customer Profile New Checking Accounts 2016 YTD All Checking Accounts 12/31/2015 Gen 23% Gen X 24% Baby Boomers 22% Baby Boomers Gen Y / Millennials 25% Mature 7% Gen Y / Millennials 48% Mature 17% 63 See endnotes (18) Gen Y / Millennials16 – 35 Gen X36 – 51 Baby Boomers52 – 70 MatureOver 70 |
|
|
Creating Shareholder Value John Pollok Senior Executive Vice President Chief Financial Officer and Chief Operating Officer |
|
|
John Pollok Chief Financial Officer and Chief Operating Officer 28 years in banking South State 20 years RHNB / NationsBank 5 years Wachovia 3 years 65 |
|
|
How We Create Shareholder Value? Leadership $ 66 SOUTH STATE CORPORATION |
|
|
Quality of Balance Sheet Growth Profitability • • • Strong Asset Quality Core Funded Capital Structure 67 Soundness |
|
|
High Performance Growth • • • • Return on Assets Return on Tangible Equity Earnings per Share Dividends & Book Value Profitability SoSuounnddneessss 68 |
|
|
Earnings Per Diluted Share $ 5.00 $4.11 4.00 3.00 2.00 1.00 - 2012 2013 2014 2015 2016 YTD Adjusted* EPS (Non - GAAP) EPS 69 See endnotes (19) $4.31 $3.40 $3.75 $3.16$3.08 $3.18 $2.49$2.38 $2.03 |
|
|
Dividends and Book Value $ 50.00 TOTAL RETURN 324% Dividends TBV 40.00 30.00 20.00 $9.91 10.00 0.00 2000 2001 2002 2003 2004 2005 2006 2007 2008 2009 2010 2011 2012 2013 2014 2015 3Q16 70 Cumulative $42.01 $26.60 $16.08 |
|
|
Opportunities for Growth • Market Share • Dense Footprint Growth • Mergers & Acquisitions Profitability SoSuounnddneessss 71 |
|
|
SSB Footprint Market Share 72 See endnotes (20) 1 Wells Fargo 21.1% 2 Bank of America 14.7 3 BB&T 11.2 4 South State Bank 7.1 5 SunTrust 6.0 5 First Citizens 6.0 7 Synovus 3.6 8 TD Bank 3.1 9 Regions 2.0 10 United Community 1.9 Total$124 Billion100% |
|
|
Another Piece of the Puzzle 73 SSB Branch SBFC Branch Existing Markets New Market |
|
|
Mergers and Acquisitions 298 institutions headquartered in GA, NC, and SC 60 $750 mm - $10 B 56 33 >$10 B 7 Distribution of Banks by Asset Size 182 258 <$750 mm 74 See endnotes (21) |
|
|
Closing Robert Hill |
|
|
South State Bank NORTH CAROLINA Raleigh Charlotte Greenville SOUTH CAROLINA Gainesville Columbia Wilmington Atlanta Athens Myrtle Beach Augusta Charleston Hilton Head GEORGIA Savannah 76 SSB SBFC |
|
|
Endnotes 1. 2. 3. Pro Forma highlights as of 9/30/2016 and is exclusive of any purchase accounting adjustments. Source: SNL Financial, 6/30/2016 Pro Forma FDIC deposits. NE Georgia rank excludes Atlanta MSA, Greenville includes Spartanburg MSA. Source: SNL Financial, data as of 6/30/16. Pro Forma deposits in SSB county footprint. Excludes $145 billion in deposits from Bank of America’s branch and $22 billion in deposits from Wells Fargo’s branch on Tryon in Charlotte. Number of banks excludes institutions with less than $150 million in market. As of 9/30/2016. Includes DDA’s, NOW’s, IOLTA’s, and 1031 exchange deposits. Source: Hoovers list of businesses in SSB markets as of 10/13/2016. 9/30/2016 YTD net commercial loan growth annualized. As of 9/30/2016. As of 9/30/2016. Source: SNL Financial 2016 households by P$YCLE segment, including Financial Elite, Wealthy Achievers, Upscale Empty Nests, and Flourishing Families. YTD production as of 9/30/2016. Servicing volume as of 9/30/2016 includes retained secondary market servicing and 1 – 4 family portfolio loans. As of 9/30/2016. Source: SNL Financial 2015 HMDA operating company market share. National refinance based on MBA estimates. Fixed vs adjustable volume – SSB is September 2016 YTD and industry is Ellie Mae August 2016 YTD. Loans per FTE is # of units divided by # of FTE in MLO or Operations positions, and the benchmark is the Stratmor/MBA Peer Group Survey. NPLs/Loans = Non-acquired & Acquired non-credit impaired NPLs/Total Loans. NPAs/Assets= Non-acquired & Acquired non-credit impaired NPLs, all OREO & OAO / Total Assets. ALLL/NPLs include Non-acquired only. NCOs / Average Loans include Non-acquired only. As of 9/30/2016. Acquired loans are net of mark. Concentration limits calculated with bank level RBC. Includes DDA’s, NOW’s, IOLTA’s, and 1031 exchange deposits. Adjusted is a Non-GAAP financial measure that excludes the impact of branch consolidation, merger related expenses, securities gains or losses, and FDIC loss share early termination. Source: SNL Financial, data as of 6/30/16. Pro Forma deposits in SSB county footprint. Excludes $145 billion in deposits from Bank of America’s branch and $22 billion in deposits from Wells Fargo’s branch on Tryon in Charlotte. Source: SNL Financial. Data as of the most recent quarter available; Pro Forma for pending acquisitions. Includes all top-tier consolidated banks and thrifts headquartered in GA, NC, and SC; excludes merger targets. 4. 5. 6. 7. 8. 9. 10. 11. 12. 13. 14. 15. 16. 17. 18. 19. 20. 21. 77 |
|
|
Investor Contacts Robert R. Hill, Jr. Chief Executive Officer John C. Pollok Senior Executive Vice President and Chief Financial Officer / Chief Operating Officer James C. Mabry IV Executive Vice President Investor Relations and Mergers & Acquisitions 520 Gervais Street Columbia, South Carolina 29201 800-277-2175 www.southstatebank.com |
|
|
[LOGO] |

