Attached files
| file | filename |
|---|---|
| EX-99.2 - EX-99.2 - METLIFE INC | d268923dex992.htm |
| EX-99.1 - EX-99.1 - METLIFE INC | d268923dex991.htm |
| 8-K - 8-K - METLIFE INC | d268923d8k.htm |
Exhibit 99.3
Description of Video Third Quarter 2016 Financial Update
From Chief Financial Officer John Hele
This exhibit (video transcript and slides) contains forward-looking statements. Forward-looking statements give expectations or forecasts of future events and use words such as “anticipate,” “estimate,” “expect,” “project” and other terms of similar meaning, or that are tied to future periods. Any or all forward-looking statements may turn out to be wrong, and actual results could differ materially from those expressed or implied in the forward-looking statements. Predictions of future performance are inherently difficult and are subject to numerous risks and uncertainties, including those identified in the “Risk Factors” section of MetLife, Inc.’s filings with the U.S. Securities and Exchange Commission. The company is not required to publicly correct or update any forward-looking statement if it later becomes aware that such statement is not likely to be achieved.
This exhibit (video transcript and slides) also contains measures that are not calculated based on accounting principles generally accepted in the United States of America, also known as GAAP. Information regarding those non-GAAP financial measures and the reconciliations of the non-GAAP financial measures to the most directly comparable GAAP measures is provided in the company’s third quarter 2016 Financial Supplement, and/or the company’s earnings news release dated November 2, 2016 for the three months ended September 30, 2016. Each of the Financial Supplement, the news release, and this exhibit (video transcript and slides) accompany one another as they are each exhibits to the company’s Current Report on Form 8-K, dated November 2, 2016.
Video Transcript and Description:
[Shows slide 1 and 2]
[MetLife Executive Vice President & CFO John Hele speaks from a studio at MetLife’s corporate headquarters in New York City]
Hi, I’m John Hele and I am joining you from MetLife’s global headquarters in New York City.
Before I discuss our third quarter 2016 results, I’d like to touch on the October 5th filing of Brighthouse Financial’s Registration Statement on Form 10 with the U.S. Securities and Exchange Commission.
While MetLife and Brighthouse are currently preparing for a spin-off transaction, the ultimate form and timing of a separation will be influenced by a number of factors, including regulatory considerations and economic conditions.
The first step in the separation transaction is expected to take place in the first half of 2017.
Also in October, we announced an exciting new global brand platform that we will be rolling out around the world through 2017.
Over our 148-year history, our company name, brand and logo have evolved to reflect changes in our business and strategy, as well as the world we live in. [Shows footage of MetLife’s brand identity over time]
This change is no different. Our new brand will help differentiate us in the industry, paving the way for enhanced value creation for customers and shareholders alike.
With that, I’ll turn to our third quarter results…
MetLife had a solid third quarter of 2016, driven by higher variable investment income, strong expense control and volume growth.
Net income for the quarter was 571 million dollars, down 52 percent from the third quarter of 2015. On a per share basis, net income was 51 cents, also down 52 percent. Year-over-year swings in net derivative gains and losses account for the decline in net income.
Operating earnings were 1.4 billion dollars, up 102 percent when compared to the prior-year period. On a per share basis, operating earnings were 1 dollar and 28 cents, up 106 percent.
Operating earnings included several notable items.
First was the re-segmentation of MetLife’s businesses that included the establishment of a Brighthouse Financial segment. As previously disclosed, this resulted in the loss of an aggregation benefit associated with GAAP reserve testing of variable and universal life policies, which decreased operating earnings by 254 million dollars, or 23 cents per share, after tax.
Second, the results of our annual actuarial assumption review completed in the third quarter, and other insurance adjustments, decreased operating earnings by 65 million dollars, or 6 cents per share, after tax.
Third, variable investment income for the quarter was above the company’s 2016 quarterly plan range by 22 million dollars, or 2 cents per share, after tax, and the impact of deferred acquisition costs.
Last, favorable catastrophe experience and prior year development increased operating earnings by 16 million dollars, or 1 cent per share, after tax.
Adjusting for all notable items in both the third quarter of 2015 and the third quarter of 2016, operating earnings were up 11 percent in the third quarter of 2016, and 10 percent on a constant currency basis. On a per share basis, operating earnings were up 13 percent, and 12 percent on a constant currency basis.
In the U.S., we reported third quarter operating earnings of 552 million dollars, up 8 percent from the third quarter of 2015. [Shows slide 3]
In Asia, third quarter operating earnings were 324 million dollars, down 4 percent on a reported basis, and 11 percent on a constant currency basis. Excluding all notable items from both periods, operating earnings were up 3 percent, but down 5 percent on a constant currency basis. Operating earnings benefitted from volume growth and lower expenses in the third quarter of 2016. [Shows slides 4 and 5]
In Latin America, third quarter operating earnings were 133 million dollars, down 27 percent on a reported basis, and 23 percent on a constant currency basis, mainly due to the effects on the year-over-year comparison of a one-time tax benefit of 60 million dollars in the third quarter of 2015. Excluding all notable items from both periods, operating earnings were up 1 percent, and 12 percent on a constant currency basis, due to market impacts and volume growth in the region. [Shows slides 6 and 7]
In EMEA, we achieved operating earnings of 74 million dollars, up 12 percent on a reported basis, and 19 percent on a constant currency basis, driven by favorable underwriting, lower expenses, several non-recurring items and volume growth. [Shows slides 8 and 9]
Our new MetLife Holdings segment, comprised of non-core businesses, reported operating earnings of 266 million dollars, up 9 percent, primarily due to higher variable investment income. [Shows slide 10]
Brighthouse Financial, which we are also now reporting as a separate segment, reported operating earnings of 68 million dollars, down 80 percent. This was primarily due to the re-segmentation I mentioned earlier that resulted in a one-time loss of 254 million dollars as well as a current quarter impact of 42 million dollars. [Shows slide 11]
Book value per common share was up 4 percent to 53 dollars and 40 cents. [Shows slide 12]
We remain focused on improving free cash flow, lowering unit costs and enhancing the customer experience to create shareholder value.
Thank you for watching.
[Shows slide 13]
Slide 1

Slide 2
MetLife
Navigating life together
Slide 3
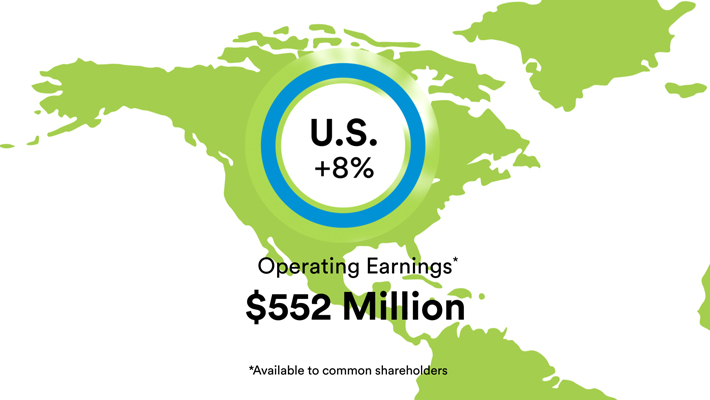
U.S. +8%
Operating Earnings*
$552 Million
*Available to common shareholders
Slide 4

Asia -4%
Operating Earnings*
$324 Million
*Available to common shareholders
Slide 5
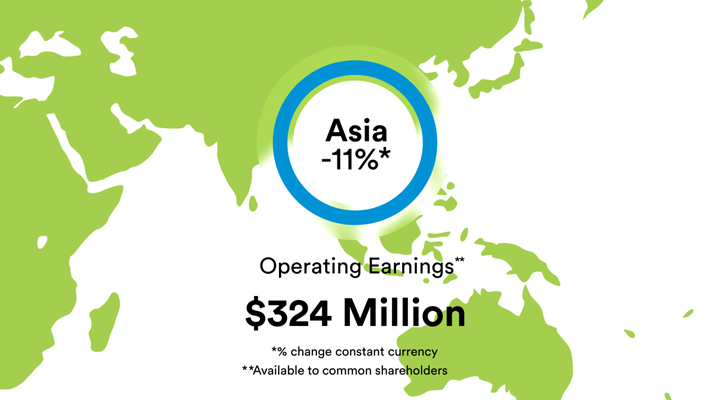
Asia -11%*
Operating Earnings**
$324 Million
*% change constant currency
**Available to common shareholders
Slide 6
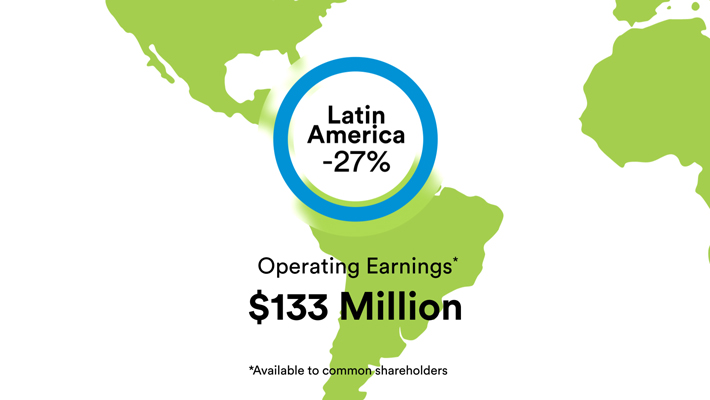
Lating America -27%
Operating Earnings*
$133 Million
*Available to common shareholders
Slide 7
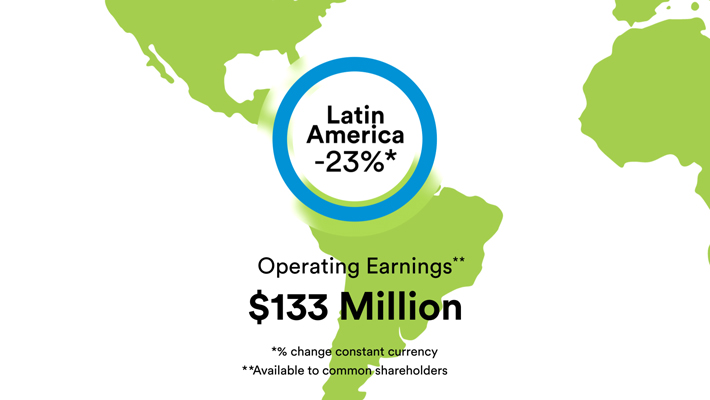
Latin America -23%
Operating Earnings**
$133 Million
% change constant currency
**Available to common shareholders
Slide 8

EMEA +12%
Operating Earnings*
$74 Million
*Available to common shareholders
Slide 9
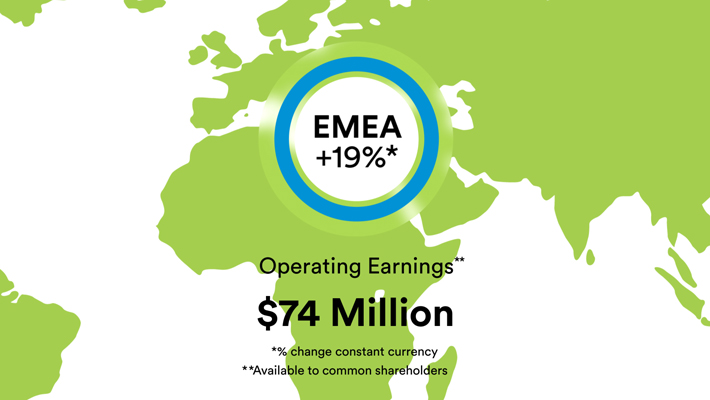
EMEA +19%*
Operating Earnings**
$74 Million
*% change constant currency
**Available to common shareholders
Slide 10
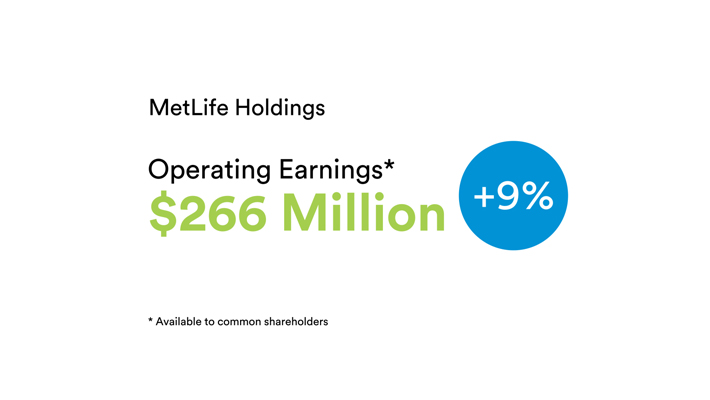
MetLife Holdings
Operating Earnings*
$266 Million +9%
*Available to common shareholders
Slide 11
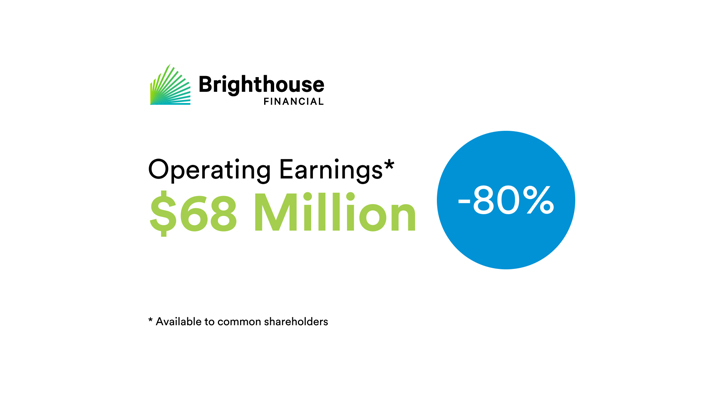
Brighthouse
FINANCIAL
Operating Earnings*
$68 Million -80%
*Available to common shareholders
Slide 12
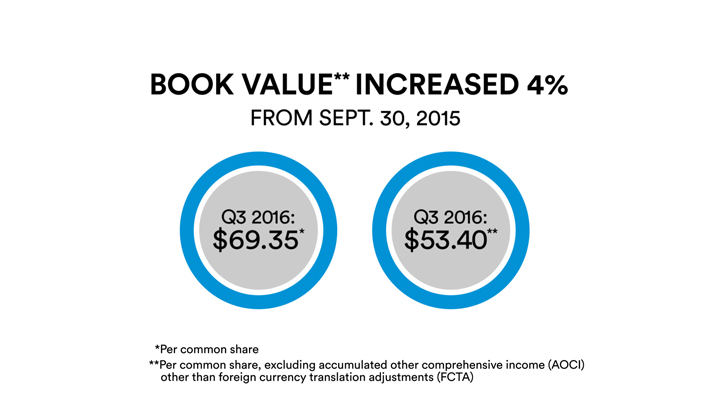
BOOK VALUE** INCREASED 4%
FROM SEPT. 30, 2015
Q3 2016: $69.35*
Q3 2016: $53.40**
*Per common share
**Per common share, excluding accumulated other comprehensive income (AOCI)
other than foreign currency translation adjustments (FCTA)
Slide 13
MetLife
This video contains forward-looking
statements. Forward-looking statements give expectations or forecasts of future events and use words such as “anticipate,” “estimate,” “expect,” “project” and other terms of similar meaning, or that are tied
to future periods. Any or all forward-looking statements may turn out to be wrong, and actual results could differ materially from those expressed or implied in the forward-looking statements. Predictions of future performance are inherently
difficult and are subject to numerous risks and uncertainties, including those identified in the “Risk Factors” section of MetLife, Inc.’s filings with the U.S. Securities and Exchange Commission. The company is not required to
publicly correct or update any forward-looking statement if it later becomes aware that such statement is not likely to be achieved.
The video also contains
measures that are not calculated based on accounting principles generally accepted in the United States of America, also known as GAAP. Information regarding those non-GAAP financial measures and the reconciliations of the non-GAAP financial
measures to the most directly comparable GAAP measures is provided in the company’s third quarter 2016 Financial Supplement and/or the company’s earnings news release dated Nov. 2, 2016 for the three months ended Sept. 30, 2016, which may
be obtained on the web page where you accessed this video and the Investor Relations section of www.metlife.com.