Attached files
| file | filename |
|---|---|
| EX-99.1 - PRESS RELEASE DATED NOVEMBER 1, 2016. - J2 GLOBAL, INC. | exh99-1_17998.htm |
| 8-K - FORM 8K DATED 11.1.16 - J2 GLOBAL, INC. | j2form8-k_17998.htm |
EXHIBIT 99.2

Investors Presentation ® Third Quarter 2016 Results November 1, 2016

Certain statements in this presentation are “forward-looking statements” within the meaning of the Private Securities Litigation Reform Act of 1995, particularly those regarding our 2016 Financial Guidance. Such forward-looking statements are subject to numerous assumptions, risks and uncertainties that could cause actual results to differ materially from those described in those statements. Readers should carefully review the Risk Factors slide of this presentation. These forward-looking statements are based on management’s expectations or beliefs as of November 1, 2016 and as well as those set forth in our Annual Report on Form 10-K filed by us on February 29, 2016 with the Securities and Exchange Commission (“SEC”) and the other reports we file from time-to-time with the SEC. We undertake no obligation to revise or publicly release any updates to such statements based on future information or actual results. Such forward-looking statements address the following subjects, among others: All information in this presentation speaks as of November 1, 2016 and any redistribution or rebroadcast of this presentation after that date is not intended and will not be construed as updating or confirming such information. Future operating resultsDeployment of cash and investment balances to grow the companyAbility to acquire businesses on acceptable terms and integrate and recognize synergies from acquired businessesSubscriber growth, retention, usage levels and average revenue per accountCloud service and digital media growth and continued demand for fax servicesInternational growthNew products, services, features and technologiesCorporate spending including stock repurchasesIntellectual property and related licensing revenuesLiquidity and ability to repay or refinance indebtednessNetwork capacity, coverage, reliability and securityRegulatory developments and taxes 2 Safe Harbor for Forward-Looking Statements
Inability to sustain growth or profitability, particularly in light of an uncertain U.S. and worldwide economy and the related impact on customer acquisition, retention and usage levels, advertising spend and credit and debit card payment declinesReduced use of fax services due to increased use of email, scanning or widespread adoption of digital signatures or otherwiseInability to acquire businesses on acceptable terms or successfully integrate and realize anticipated synergies Failure to offer compelling digital media content causing reduced traffic and advertising levels; loss of advertisers or reduction in advertising spend; increased prevalence or effectiveness of advertising blocking technologies; inability to monetize handheld devices and handheld traffic supplanting monetized trafficNew or unanticipated costs or tax liabilities, including those relating to federal and state income tax and indirect taxes, such as sales, value-added and telecommunications taxesInability to manage certain risks inherent to our business, such as fraudulent activity, system failure or a security breachCompetition from others with regard to price, service, content and functionalityInadequate intellectual property (IP) protection, expiration or invalidity of key patents, violations of 3rd party IP rights or inability or significant delay in monetizing IPInability to continue to expand our business and operations internationallyInability to maintain required services on acceptable terms with financially stable telecom, co-location and other critical vendors; and inability to obtain telephone numbers in sufficient quantities on acceptable terms and in desired locationsLevel of debt limiting availability of cash flow to reinvest in the business; inability to repay or refinance debt when due; and restrictive covenants relating to debt imposing operating and financial restrictions on business activities or plansInability to maintain and increase our cloud services customer base or average revenue per userEnactment of burdensome telecommunications, Internet, advertising or other regulations, or being subject to existing regulationsInability to adapt to technological change and diversify services & related revenues at acceptable levels of financial returnLoss of services of executive officers and other key employeesOther factors set forth in our Annual Report on Form 10-K filed by us on February 29, 2016 with the Securities and Exchange Commission (“SEC”) and the other reports we file from time-to-time with the SEC The following factors, among others, could cause our business, prospects, financial condition, operating results and cash flows to be materially adversely affected: 3 Risk Factors

The tender offer described in this communication (the “Offer”) has not yet commenced, and this communication is neither an offer to purchase nor a solicitation of an offer to sell any shares of the common stock of Everyday Health, Inc. (“Everyday Health”) or any other securities. This communication is for informational purposes only. The Offer is not being made to, nor will tenders be accepted from, or on behalf of, holders of shares in any jurisdiction in which the making of the tender offer or the acceptance thereof would not comply with the laws of that jurisdiction. On the commencement date of the Offer, a tender offer statement on Schedule TO, including an offer to purchase, a letter of transmittal and related documents, will be filed with the United States Securities and Exchange Commission (the “SEC”). The offer to purchase shares of Everyday Health common stock will only be made pursuant to the offer to purchase, the letter of transmittal and related documents filed as a part of the Schedule TO. INVESTORS AND SECURITY HOLDERS ARE URGED TO READ BOTH THE TENDER OFFER STATEMENT AND THE SOLICITATION/RECOMMENDATION STATEMENT REGARDING THE OFFER, AS THEY MAY BE AMENDED FROM TIME TO TIME, WHEN THEY BECOME AVAILABLE BECAUSE THEY WILL CONTAIN IMPORTANT INFORMATION. The tender offer statement will be filed with the SEC by Project Echo Acquisition Corp., a wholly owned subsidiary of Ziff Davis, LLC, Ziff Davis, LLC, a wholly owned subsidiary of j2 Global, Inc., and j2 Global, and the solicitation/recommendation statement will be filed with the SEC by Everyday Health. Investors and security holders may obtain a free copy of these statements (when available) and other documents filed with the SEC at the website maintained by the SEC at www.sec.gov or by directing such requests to Laura Hinson at laura.hinson@j2.com. 4 Additional Information

Q3 2016 Results
6 Q3 ‘16 Consolidated ResultsRecord Third Quarter Revenue $210.1M, +17.6% vs Q3 2015Q3 ‘16 Adjusted EBITDA(1)(2) $95.4M, +13.2% vs Q3 2015Executing M&A investment to further improve market position4 Cloud acquisitions completed in Q3 2016Cloud SegmentQ3 ‘16 Revenue of $143.3M, +$17M or +13% vs. prior yearCloud Connect (Fax/Voice) Revenue +$3M or +3.5% vs. prior yearCloud Services Revenue +$14M or +39% vs. prior yearAdjusted EBITDA(1)(2) margin 52.1%ARPU reached $15.28, highest since Q3 2008Digital Media SegmentQ3 ‘16 Revenue of $66.7M +28% vs. prior yearAdjusted EBITDA margin(1)(2) 36% 2016 Q3 Accomplishments Figures are Adjusted Non-GAAP. See slides 22-26 for a GAAP reconciliation of revenue, earnings per diluted share, free cash flow, and adjusted EBITDA.
j2 Global Consolidated

8 Q3 2016 Results vs. Prior Year See slides 22-26 for a GAAP reconciliation of revenue, earnings per diluted share and adjusted EBITDA for the Company as a whole and by segment.Includes Allocation from Cloud Connect to Cloud Services of $1.7M in Q2 ‘16 and $1.5M in Q2 ’15The Consolidated j2 Global data may not foot as each segment is calculated independently ($ in thousands)

Business Cloud Services
Q3 ‘16 Revenue of $92.6M, +3.5% vs. Q3 ’15, annual run rate ~$380M, +6% YoYFax Revenue of $77.3M, +1% vs. Q3 ‘15, led by premium brands and corporate faxFax Revenue represents 37% of consolidated Q3 ‘16 Revenue and ~44% of consolidated Adjusted EBITDA; prior year Fax Revenue was 43% of consolidated revenue (1)(2)(3)October acquisition of Fonebox Australia to be consolidated with our Zintel voice businessSubscriber base of 2.4M DIDs, +3% vs. Q3 ’15 4% average annual growth since 2011MaxEmail fully migrated and integrated into j2 systems during Q3 Q3 2016 Cloud Connect (Fax/Voice) Highlights Figures are Adjusted Non-GAAP. See slides 22-26 for a GAAP reconciliation of revenue, earnings per diluted share and adjusted EBITDA.Fax adjusted EBITDA margin is based on Cloud Connect (Fax/Voice) adjusted EBITDA margin 10

Revenue of $29.5M, +69% vs Q3 ’15Adjusted EBITDA(1)(2) of $15.2M, +124% vs. Q3 ’15Adjusted EBITDA margin(1)(2) +50% vs. ~39% in Q3 ‘15Completed 3 acquisitions in Q3 ’16 / 10 acquisitions to date in 2016Plan additional investment partially offset by savings from datacenter consolidation, positioning Cloud Backup for future growth Q3 2016 Cloud Backup Highlights Figures are Adjusted Non-GAAPSee slides 22-26 for a GAAP reconciliation of revenue, earnings per diluted share and adjusted EBITDA. 11

Email SecurityQ3 ‘16 Revenue of $11.2M2016 YTD Revenue $35.2M, +4% vs. prior year2016 YTD Adjusted EBITDA(1)(2) $12.0M, +17% vs. prior yearUSA - Excel Micro - McAfee EOL January 2017Completed migrating Nordic customers to FuseMail® branded platform Double-digit revenue growth in Nordics +17% vs. Q3 ’15 Email MarketingQ3 ‘16 Revenue of $7.7M, +38% vs. Q3 ’15, annual run-rate $31M, +38% vs prior yearQ3 ‘16 Adjusted EBITDA(1)(2) of $4.5M, +73% vs. Q3 ’15Q3 ‘16 Adjusted EBITDA(1)(2) margin 58% vs. 46% in Q3 ‘15 Campaigner won two Gold Stevie International Business Awards: Best Customer Service Department and Customer Service Team Acquired UnifiedEmail, a small SMTP relay company 12 Q3 2016 Email Highlights Figures are Adjusted Non-GAAP. See slides 22-26 for a GAAP reconciliation of revenue, earnings per diluted share and adjusted EBITDA.

Digital Media

14 Figures are Adjusted Non-GAAPSee slides 22-26 for a GAAP reconciliation of revenue, earnings per diluted share and EBITDA. Digital media business demonstrating strong fundamentalsQ3 ‘16 Revenue of $67M, +28% vs. Q3 ’15Q3 ‘16 EBITDA(1)(2) of $24M, up, +18% vs. Q3 ’15Total multi-platform visits were up 42% YoY at 1.4B (3) Q3 2016 Digital Media Highlights (3) Google Analytics (GA) and /or Partner Platforms Performance Marketing (CPC, CPA, CPL) grew 47% vs. Q3 2015 Shopping clicks merchant partners reached 26M, a 68% increase YOYLaunch of http://www.pcmag.com/coupons a collaborative effort utilizing content and technology from Offers.com and leveraging the domain authority of PCMag.Launched B2B Signals, a next generation data as a service (DaaS) platform Provides B2B marketers with detailed and timely intelligence to find their most targeted potential customers across 40k companies, 26M contacts Ookla releases new native appsOokla's mobile Speedtest app was installed on 15M new devices during Q3 ’16, an increase of 44% YOYLaunched a Speedtest Chrome extension in the Chrome Store, generating 258k installs and 1.2M tests

15 Q3 2016 Digital Media Highlights IGN’s distributed video strategy continues its acceleration(1) Total video views across all IGN platforms were up 88% YoY to 895M.Subscriber and follower growth grew substantially in Q3 ‘16YouTube subscribers across channels increased by 26% YoY to 9.2MSocial followers across platforms increased by 58% YoY to 19.5MApp installs across mobile and OTT increase by 11% to 14.5MIGN created multi-day live programming at the two largest fan expos in the world: Gamescom and San Diego Comic-Con, accumulation more than 6M live views (1) Google Analytics (GA) and/or Partner Platforms Key business development achievementsRe-Launched Geek.com with a new site design and new editorial focus on Geek Culture and Tech. The launch was sponsored “ad-free” by MicrosoftLaunched PCMag Israel (il.pcmag.com) in Hebrew language, in partnership with BrandStorm Media, who has operated IGN and AskMen in the country since 2014August - Relaunch of IGN Africa (africa.ign.com) in partnership with Little Empire, available in English language in South Africa and across the Southern African continent

2016 Financial Guidance
RationaleOur focus has always been to help our audiences make informed decisions; EVDY plays the same role in the health verticalSignificant learning to be shared and applied between EVDY and Ziff Davis – from data to performance marketing to platform publishingTransactionTender offer of $10.50 per share expected to commence Nov 2nd and expire Dec 2nd Hart-Scott-Rodino (HSR) filing made on October 27thTotal proceeds to close $470MExpected consideration includes cash on hand / new revolver 17 Everyday Health Update GuidanceEVDY current Revenue guidance of $252-$260M and Adjusted EBITDA of $43.6-$47.6M for 2016EVDY will report its Q3 2016 results on November 8th

Revenues $830M - $860M Adjusted Non-GAAP EPS(1)(2) $4.70 - $5.00 18 Reconfirming 2016 Guidance Figures are adjusted Non-GAAP.Adjusted earnings per diluted share excludes share-based compensation, amortization of acquired intangibles and the impact of any currently anticipated items, in each case net of tax. It is anticipated that the effective tax rate for 2016 (excluding certain expenses that may not be indicative of our recurring core business operating results) will be between 29% and 31%

Supplemental Information
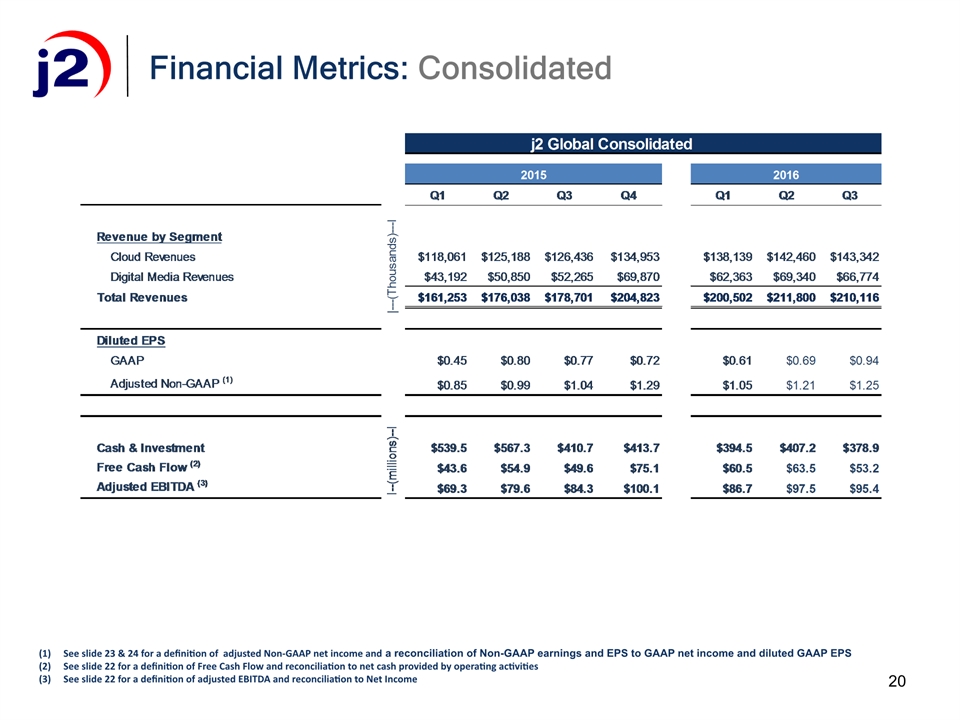
20 See slide 23 & 24 for a definition of adjusted Non-GAAP net income and a reconciliation of Non-GAAP earnings and EPS to GAAP net income and diluted GAAP EPSSee slide 22 for a definition of Free Cash Flow and reconciliation to net cash provided by operating activitiesSee slide 22 for a definition of adjusted EBITDA and reconciliation to Net Income Financial Metrics: Consolidated

21 Cloud Services revenue includes IP Licensing revenueCloud Services Customers are defined as paying DIDs for Fax & Voice services and direct and resellers’ accounts for other servicesQuarterly ARPU is calculated using our standard convention of applying the average of the quarter’s beginning and ending customer base to the total revenue of the quarterUser cancel rate, also called user churn, is defined as cancellation of service by Cloud Business customers with greater than 4 months of continuous service (continuous service includes Cloud Business customers that are administratively cancelled and reactivated within the same calendar month). User cancel rate is calculated monthly and expressed here as an average over the three months of the quarter. Digital Media Traffic figures based on Google Analytics & Partner Platforms Financial & Other Metrics Cloud & Media

22 Free Cash Flow (1) Free Cash Flow is defined as net cash provided by operating activities, less purchases of property, plant and equipment, plus excess tax benefits (deficiency) from share based compensation. In addition, the amount shown for Q2 and Q3 2015 excludes the effect of payments associated with taxes for prior periods under audit. Free Cash Flow amounts are not meant as a substitute for GAAP, but are solely for informational purposesAdjusted EBITDA is defined as net income plus interest and other expense, net; income tax expense; depreciation and amortization and the items used to reconcile GAAP to Adjusted Non-GAAP EPS. Adjusted EBITDA amounts are not meant as a substitute for GAAP, but are solely for informational purposes GAAP Reconciliation Free Cash Flow & Adjusted EBITDA Adjusted EBITDA (2) ($ in millions)

23 GAAP Reconciliation Q3 Adjusted Non-GAAP Earnings & EPS Adjusted Non-GAAP net income is not meant as a substitute for GAAP, and is defined as GAAP net income with the following modifications: 1) Elimination of shared-based compensation expense and associated payroll taxes 2) Elimination of certain acquisition-related integration costs and the impact of fair value adjustments to deferred revenue purchased in Livedrive acquisition 3) Elimination of amortization of acquired patents and intangible assets ($ in thousands)

24 GAAP Reconciliation Q3 Adjusted Non-GAAP Earnings & EPS (continued) Adjusted Non-GAAP net income is not meant as a substitute for GAAP, and is defined as GAAP net income with the following modifications: 1) Elimination of shared-based compensation expense and associated payroll taxes 2) Elimination of certain acquisition-related integration costs and the impact of fair value adjustments to deferred revenue purchased in Livedrive acquisition 3) Elimination of interest costs in excess of the coupon rate associated with the convertible notes 4) Elimination of IRS consulting fees 5) Elimination of amortization of acquired patents and intangible assets 6) Elimination of additional income tax (expense) benefit from prior years * Reconciliation of Net Income per share from GAAP to Adjusted Non-GAAP Net Income Per Share may not foot because each is calculated independently ($ in thousands)

25 GAAP Reconciliation Q3 2016 Adjusted EBITDA ($ in thousands)

26 GAAP Reconciliation Q3 2015 Adjusted EBITDA ($ in thousands)

®