Attached files
| file | filename |
|---|---|
| EX-99.1 - EXHIBIT 99.1 - COUSINS PROPERTIES INC | a8-kpressreleaseex9913q16.htm |
| 8-K - 8-K - COUSINS PROPERTIES INC | a8-k3q16.htm |


Q3 2016 SUPPLEMENTAL INFORMATION

1
TABLE OF CONTENTS | ||
Forward-Looking Statements | |
Key Performance Metrics | |
Funds From Operations - Detail | |
Portfolio Statistics | |
Office Leasing Activity | |
Office Lease Expirations | |
Top 20 Office Tenants | |
Tenant Industry Diversification | |
Investment Activity | |
Land Inventory | |
Debt Schedule | |
Non-GAAP Financial Measures - Calculations and Reconciliations | |
Non-GAAP Financial Measures - Discussion | |
Cousins Properties Incorporated | Q3 2016 Supplemental Information | |
FORWARD-LOOKING STATEMENTS | ||
Certain matters contained in this report are “forward-looking statements” within the meaning of the federal securities laws and are subject to uncertainties and risks, as itemized in Item 1A included in the Annual Report on Form 10-K for the year ended December 31, 2015 and in the Quarterly Report on Form 10-Q for the three months ended September 30, 2016. These forward-looking statements include information about possible or assumed future results of the business and our financial condition, liquidity, results of operations, plans, and objectives. They also include, among other things, statements regarding subjects that are forward-looking by their nature, such as, our business and financial strategy; our ability to obtain future financing arrangements; future acquisitions and future dispositions of operating assets; future acquisitions of land; future development and redevelopment opportunities; future dispositions of land and other non-core assets; future repurchases of common stock; projected operating results; market and industry trends; future distributions; projected capital expenditures; interest rates; statements about the benefits of the transactions involving the Company and Parkway Properties Inc. ("Parkway"), including future financial and operating results, plans, objectives, expectations, and intentions; all statements that address operating performance, events, or developments that we expect or anticipate will occur in the future — including statements relating to creating value for stockholders; benefits of the transactions to tenants, employees, stockholders, and other constituents of the combined company; integrating our companies; and cost savings.
Any forward-looking statements are based upon management's beliefs, assumptions, and expectations of our future performance, taking into account information currently available. These beliefs, assumptions, and expectations may change as a result of possible events or factors, not all of which are known. If a change occurs, our business, financial condition, liquidity, and results of operations may vary materially from those expressed in forward-looking statements. Actual results may vary from forward-looking statements due to, but not limited to, the following: the availability and terms of capital and financing; the ability to refinance or repay indebtedness as it matures; the failure of purchase, sale, or other contracts to ultimately close; the failure to achieve anticipated benefits from acquisitions and investments or from dispositions; the potential dilutive effect of common stock offerings; the failure to achieve benefits from the repurchase of common stock; the availability of buyers and adequate pricing with respect to the disposition of assets; risks and uncertainties related to national and local economic conditions, the real estate industry in general, and the commercial real estate markets in particular; changes to our strategy with regard to land and other non-core holdings that require impairment losses to be recognized; leasing risks, including the ability to obtain new tenants or renew expiring tenants, and the ability to lease newly developed and/or recently acquired space; the adverse change in the financial condition of one or more of our major tenants; volatility in interest rates and insurance rates; the availability of sufficient investment opportunities; competition from other developers or investors; the risks associated with real estate developments (such as zoning approval, receipt of required permits, construction delays, cost overruns, and leasing risk); the loss of key personnel; the potential liability for uninsured losses, condemnation, or environmental issues; the potential liability for a failure to meet regulatory requirements; the financial condition and liquidity of, or disputes with, joint venture partners; any failure to comply with debt covenants under credit agreements; any failure to continue to qualify for taxation as a real estate investment trust and meet regulatory requirements; the ability to successfully integrate our operations and employees in connection with the transactions with Parkway; the ability to realize anticipated benefits and synergies of the transactions with Parkway; material changes in the dividend rates on securities or the ability to pay dividends on common shares or other securities; potential changes to tax legislation; changes in demand for developed properties; risks associated with the acquisition, development, expansion, leasing and management of properties; risks associated with the geographic concentration of the Company; the potential impact of the transactions with Parkway on relationships, including with tenants, employees, customers, and competitors; the unfavorable outcome of any legal proceedings that have been or may be instituted against the Company, Parkway, or Parkway, Inc.; significant costs related to uninsured losses, condemnation, or environmental issues; the amount of the costs, fees, expenses and charges related to the transactions with Parkway; and those additional risks and factors discussed in reports filed with the Securities and Exchange Commission (“SEC”) by the Company, Parkway, and Parkway, Inc.
The words “believes,” “expects,” “anticipates,” “estimates,” “plans,” “may,” “intend,” “will,” or similar expressions are intended to identify forward-looking statements. Although we believe that our plans, intentions, and expectations reflected in any forward-looking statements are reasonable, we can give no assurance that such plans, intentions, or expectations will be achieved. We undertake no obligation to publicly update or revise any forward-looking statement, whether as a result of future events, new information, or otherwise, except as required under U.S. federal securities laws.
Cousins Properties Incorporated | 3 | Q3 2016 Supplemental Information |
KEY PERFORMANCE METRICS | ||
2014 | 2015 1st | 2015 2nd | 2015 3rd | 2015 4th | 2015 | 2016 1st | 2016 2nd | 2016 3rd | 2016 YTD | |||||||||||
Property Statistics | ||||||||||||||||||||
Consolidated Operating Properties | 12 | 13 | 13 | 12 | 12 | 12 | 11 | 11 | 11 | 11 | ||||||||||
Consolidated Rentable Square Feet (in thousands) | 13,034 | 13,407 | 13,407 | 12,563 | 12,122 | 12,122 | 11,993 | 11,993 | 11,993 | 11,993 | ||||||||||
Unconsolidated Operating Properties | 5 | 5 | 5 | 6 | 6 | 6 | 6 | 6 | 6 | 6 | ||||||||||
Unconsolidated Rentable Square Feet (in thousands) | 3,129 | 3,129 | 3,129 | 3,431 | 3,434 | 3,434 | 3,435 | 3,435 | 3,435 | 3,435 | ||||||||||
Total Operating Properties | 17 | 18 | 18 | 18 | 18 | 18 | 17 | 17 | 17 | 17 | ||||||||||
Total Rentable Square Feet (in thousands) | 16,163 | 16,536 | 16,536 | 15,994 | 15,556 | 15,556 | 15,428 | 15,428 | 15,428 | 15,428 | ||||||||||
Office Leasing Activity (1) | ||||||||||||||||||||
Net Leased during the period (square feet in thousands) | 1,874 | 441 | 521 | 770 | 1,240 | 2,972 | 220 | 402 | 971 | 1,593 | ||||||||||
Net Rent (per square foot) | $22.88 | $18.93 | $23.23 | $23.42 | $15.13 | $18.30 | $23.55 | $22.73 | $23.51 | $23.22 | ||||||||||
Total Leasing Costs (per square foot) | (5.71) | (4.62) | (6.27) | (5.83) | (1.66) | (3.64) | (6.31) | (7.08) | (6.18) | (6.55) | ||||||||||
Net Effective Rent (per square foot) | $17.17 | $14.31 | $16.96 | $17.59 | $13.47 | $14.66 | $17.24 | $15.65 | $17.33 | $16.67 | ||||||||||
Change in Second Generation Net Rent | 38.0 | % | 33.6 | % | 43.8 | % | 28.1 | % | 38.5 | % | 36.7 | % | 18.9 | % | 17.2 | % | 27.9 | % | 21.6 | % |
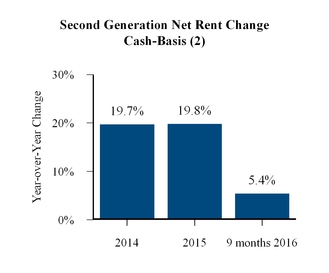
Change in Cash-Basis Second Generation Net Rent | 19.7 | % | 8.0 | % | 32.8 | % | 14.1 | % | 23.8 | % | 19.8 | % | 1.8% | 4.3 | % | 9.1 | % | 5.4 | % | |
Same Property Information (2) | ||||||||||||||||||||
Percent Leased (period end) | 91.2 | % | 91.7 | % | 91.7 | % | 91.8 | % | 91.6 | % | 91.6 | % | 90.3 | % | 90.7 | % | 91.2 | % | 91.2 | % |
Weighted Average Occupancy | 89.7 | % | 91.5 | % | 90.4 | % | 90.6 | % | 90.7 | % | 90.7 | % | 89.4 | % | 89.2 | % | 89.5 | % | 89.4 | % |
Change in Net Operating Income (over prior year period) | 3.6 | % | 5.2 | % | 1.6 | % | 1.1 | % | 6.2 | % | 3.3 | % | 4.3 | % | 1.4 | % | 3.6 | % | 3.1 | % |
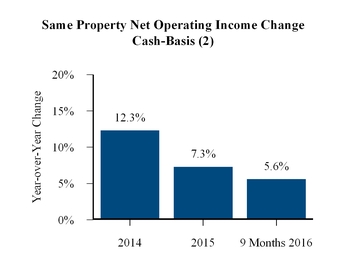
Change in Cash-Basis Net Operating Income (over prior year period) | 12.3 | % | 15.9 | % | 5.2 | % | 1.2 | % | 8.2 | % | 7.3 | % | 8.6 | % | 3.9 | % | 4.3 | % | 5.6 | % |
Development Pipeline | ||||||||||||||||||||
Estimated Project Costs (in thousands) (3) | $226,575 | $100,475 | $161,975 | $306,500 | $261,500 | $261,500 | $326,300 | $340,200 | $506,200 | $506,200 | ||||||||||
Estimated Project Costs (3) / Total Undepreciated Assets | 7.0 | % | 3.0 | % | 4.7 | % | 8.6 | % | 7.6 | % | 7.6 | % | 9.5 | % | 9.6 | % | 13.7 | % | 13.7 | % |
Market Capitalization (4) | ||||||||||||||||||||
Common Stock Price (period end) | $11.42 | $10.60 | $10.38 | $9.22 | $9.43 | $9.43 | $10.38 | $10.40 | $10.44 | $10.44 | ||||||||||
Common Shares Outstanding (period end in thousands) | 216,513 | 216,470 | 216,686 | 214,671 | 211,513 | 211,513 | 210,107 | 210,171 | 210,170 | 210,170 | ||||||||||
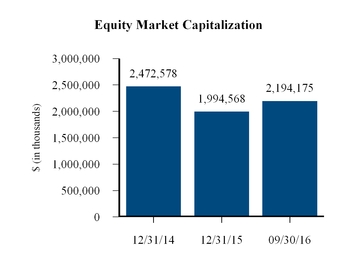
Equity Market Capitalization (in thousands) | $2,472,578 | $2,294,582 | $2,249,201 | $1,979,267 | $1,994,568 | $1,994,568 | $2,180,911 | $2,185,778 | $2,194,175 | $2,194,175 | ||||||||||
Debt (in thousands) | 1,007,502 | 1,067,376 | 1,075,013 | 1,006,764 | 947,017 | 947,017 | 992,241 | 999,999 | 1,112,322 | 1,112,322 | ||||||||||
Total Market Capitalization (in thousands) | $3,480,080 | $3,361,958 | $3,324,214 | $2,986,031 | $2,941,585 | $2,941,585 | $3,173,152 | $3,185,777 | $3,306,497 | $3,306,497 | ||||||||||
Credit Ratios (4) | ||||||||||||||||||||
Debt/Total Market Capitalization | 29.0 | % | 31.7 | % | 32.3 | % | 33.7 | % | 32.2 | % | 32.2 | % | 31.3 | % | 31.4 | % | 33.6 | % | 33.6 | % |
Debt/Total Undepreciated Assets | 29.5 | % | 30.7 | % | 30.6 | % | 28.3 | % | 27.5 | % | 27.5 | % | 28.8 | % | 28.3 | % | 30.1 | % | 30.1 | % |
Fixed Charges Coverage | 4.27 | 4.67 | 4.54 | 5.19 | 4.98 | 4.84 | 4.49 | 4.43 | 4.46 | 4.46 | ||||||||||
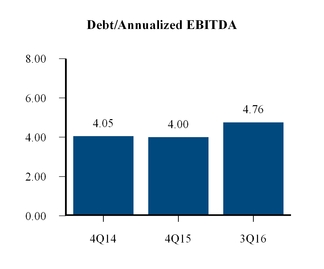
Debt/Annualized EBITDA | 4.05 | 4.77 | 4.86 | 4.02 | 4.00 | 4.00 | 4.66 | 4.51 | 4.76 | 4.76 | ||||||||||
Cousins Properties Incorporated | 4 | Q3 2016 Supplemental Information |
KEY PERFORMANCE METRICS | ||
2014 | 2015 1st | 2015 2nd | 2015 3rd | 2015 4th | 2015 | 2016 1st | 2016 2nd | 2016 3rd | 2016 YTD | |||||||||||
Dividend Information (4) | ||||||||||||||||||||
Common Dividend per Share | $0.30 | $0.08 | $0.08 | $0.08 | $0.08 | $0.32 | $0.08 | $0.08 | $0.08 | $0.24 | ||||||||||
FFO Payout Ratio | 37.3 | % | 37.8 | % | 38.3 | % | 33.0 | % | 35.0 | % | 35.9 | % | 38.9 | % | 38.8 | % | 36.2 | % | 38.0 | % |
FAD Payout Ratio | 61.6 | % | 68.1 | % | 71.5 | % | 54.8 | % | 58.9 | % | 62.6 | % | 56.7 | % | 69.0 | % | 63.4 | % | 62.6 | % |
Operations Ratios (4) | ||||||||||||||||||||
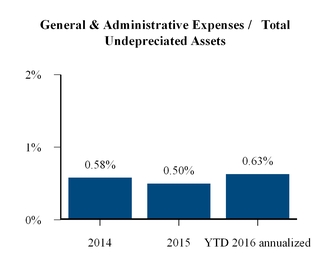
Annualized General and Administrative Expenses/Total Undepreciated Assets | 0.58 | % | 0.41 | % | 0.67 | % | 0.33 | % | 0.53 | % | 0.50 | % | 0.99 | % | 0.53 | % | 0.47 | % | 0.63 | % |
Additional Information (4) | ||||||||||||||||||||
Straight Line Rental Revenue | $22,093 | $6,285 | $5,786 | $4,623 | $3,315 | $20,009 | $3,595 | $3,434 | $3,449 | $10,478 | ||||||||||
Above and Below Market Rents Amortization | $8,047 | $2,030 | $1,973 | $2,030 | $1,948 | $7,981 | $1,834 | $1,854 | $1,907 | $5,595 | ||||||||||
Second Generation Capital Expenditures | $35,054 | $12,139 | $13,259 | $14,208 | $14,608 | $54,214 | $7,904 | $13,166 | $13,968 | $35,038 | ||||||||||
(1) See Office Leasing Activity on page 14 for additional detail and explanations.
(2) Same Property Information is derived from the pool of office properties, as defined, in the period originally reported. See Same Property Performance on page 13 and Non-GAAP Financial Measures - Calculations and Reconciliations on page 25 for additional information.
(3) Cousins' share of development expenditures.
(4) See Non-GAAP Financial Measures - Calculations and Reconciliations.
Cousins Properties Incorporated | 5 | Q3 2016 Supplemental Information |
KEY PERFORMANCE METRICS | ||
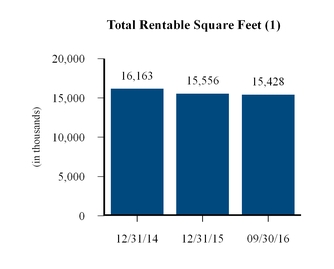
(1) Total rentable square feet is based on the total portfolio.
(2) Office properties only.
Note: See additional information included herein for calculations, definitions, and reconciliations to GAAP financial measures.
Cousins Properties Incorporated | 6 | Q3 2016 Supplemental Information |
FUNDS FROM OPERATIONS - SUMMARY | ||
2014 | 2015 1st | 2015 2nd | 2015 3rd | 2015 4th | 2015 | 2016 1st | 2016 2nd | 2016 3rd | 2016 YTD | |||||||||||||||||||||
Net Operating Income | ||||||||||||||||||||||||||||||
Office | $ | 206,551 | $ | 56,734 | $ | 59,269 | $ | 59,329 | $ | 59,878 | $ | 235,210 | $ | 57,894 | $ | 57,275 | $ | 59,873 | $ | 175,042 | ||||||||||
Other | 9,122 | 1,319 | 1,505 | 1,487 | 1,711 | 6,022 | 1,619 | 1,733 | 1,748 | 5,100 | ||||||||||||||||||||
Total Net Operating Income | 215,673 | 58,053 | 60,774 | 60,816 | 61,589 | 241,232 | 59,513 | 59,008 | 61,621 | 180,142 | ||||||||||||||||||||
Sales Less Cost of Sales | 3,910 | 810 | (324 | ) | 3,016 | 403 | 3,905 | — | — | — | — | |||||||||||||||||||
Fee Income | 12,520 | 1,816 | 1,704 | 1,686 | 2,091 | 7,297 | 2,199 | 1,824 | 1,945 | 5,968 | ||||||||||||||||||||
Other Income | 5,401 | 407 | 238 | 845 | 961 | 2,451 | 1,121 | 280 | 287 | 1,688 | ||||||||||||||||||||
Reimbursed Expenses | (3,652 | ) | (1,111 | ) | (717 | ) | (686 | ) | (916 | ) | (3,430 | ) | (870 | ) | (798 | ) | (795 | ) | (2,463 | ) | ||||||||||
General and Administrative Expenses | (19,787 | ) | (3,493 | ) | (5,936 | ) | (2,976 | ) | (4,513 | ) | (16,918 | ) | (8,242 | ) | (4,691 | ) | (4,368 | ) | (17,301 | ) | ||||||||||
Interest Expense | (36,474 | ) | (9,498 | ) | (9,696 | ) | (9,518 | ) | (9,466 | ) | (38,178 | ) | (9,421 | ) | (9,360 | ) | (9,748 | ) | (28,529 | ) | ||||||||||
Other Expenses | (5,009 | ) | (578 | ) | (431 | ) | (302 | ) | (630 | ) | (1,941 | ) | (466 | ) | (2,640 | ) | (2,175 | ) | (5,281 | ) | ||||||||||
Income Tax Benefit (Provision) | 20 | — | — | — | — | — | — | — | — | — | ||||||||||||||||||||
Depreciation and Amortization of Non-Real Estate Assets | (913 | ) | (471 | ) | (374 | ) | (414 | ) | (410 | ) | (1,669 | ) | (377 | ) | (335 | ) | (328 | ) | (1,040 | ) | ||||||||||
Preferred Stock Dividends and Original Issuance Costs | (6,485 | ) | — | — | — | — | — | — | — | — | — | |||||||||||||||||||
FFO | $ | 165,204 | $ | 45,935 | $ | 45,238 | $ | 52,467 | $ | 49,109 | $ | 192,749 | $ | 43,457 | $ | 43,288 | $ | 46,439 | $ | 133,184 | ||||||||||
Weighted Average Shares - Basic | 204,216 | 216,568 | 216,630 | 216,261 | 213,872 | 215,827 | 210,904 | 210,129 | 210,170 | 210,400 | ||||||||||||||||||||
Weighted Average Shares - Diluted | 204,460 | 216,754 | 216,766 | 216,374 | 213,978 | 215,979 | 210,974 | 210,362 | 210,326 | 210,528 | ||||||||||||||||||||
FFO per Share - Basic and Diluted | 0.81 | 0.21 | 0.21 | 0.24 | 0.23 | 0.89 | 0.21 | 0.21 | 0.22 | 0.63 | ||||||||||||||||||||
Cousins Properties Incorporated | 7 | Q3 2016 Supplemental Information |
FUNDS FROM OPERATIONS - DETAIL | ||
2014 | 2015 1st | 2015 2nd | 2015 3rd | 2015 4th | 2015 | 2016 1st | 2016 2nd | 2016 3rd | 2016 YTD | |||||||||||||||||||||
Net Operating Income | ||||||||||||||||||||||||||||||
Office Consolidated Properties | ||||||||||||||||||||||||||||||
Greenway Plaza | $ | 77,379 | $ | 18,403 | $ | 18,916 | $ | 19,544 | $ | 19,688 | $ | 76,551 | $ | 18,692 | $ | 18,990 | $ | 20,195 | $ | 57,877 | ||||||||||
Post Oak Central | 23,437 | 6,675 | 6,516 | 6,495 | 6,973 | 26,659 | 6,626 | 6,135 | 6,213 | 18,974 | ||||||||||||||||||||
Northpark Town Center | 5,794 | 5,825 | 5,651 | 5,127 | 5,797 | 22,400 | 5,607 | 5,097 | 5,599 | 16,303 | ||||||||||||||||||||
191 Peachtree Tower | 17,009 | 4,082 | 4,060 | 4,173 | 4,706 | 17,021 | 4,516 | 4,306 | 4,445 | 13,267 | ||||||||||||||||||||
Fifth Third Center | 5,631 | 3,641 | 3,709 | 3,770 | 3,836 | 14,956 | 4,238 | 4,349 | 4,451 | 13,038 | ||||||||||||||||||||
Promenade | 11,435 | 3,542 | 3,581 | 3,623 | 3,239 | 13,985 | 3,740 | 3,419 | 3,839 | 10,998 | ||||||||||||||||||||
The American Cancer Society Center | 12,373 | 3,114 | 3,206 | 3,039 | 3,073 | 12,432 | 3,310 | 3,151 | 3,198 | 9,659 | ||||||||||||||||||||
Colorado Tower | — | 328 | 1,797 | 2,156 | 2,487 | 6,768 | 2,724 | 3,064 | 3,221 | 9,009 | ||||||||||||||||||||
816 Congress Avenue | 6,992 | 1,858 | 2,117 | 2,268 | 2,283 | 8,526 | 2,468 | 2,555 | 2,514 | 7,537 | ||||||||||||||||||||
Meridian Mark Plaza | 3,728 | 918 | 954 | 946 | 959 | 3,777 | 908 | 857 | 954 | 2,719 | ||||||||||||||||||||
Research Park V | — | — | — | — | — | — | — | 144 | 288 | 432 | ||||||||||||||||||||
Other (1) | 22,815 | 3,717 | 4,273 | 3,544 | 2,111 | 13,645 | 15 | (5 | ) | (57 | ) | (47 | ) | |||||||||||||||||
Subtotal - Office Consolidated | 186,593 | 52,103 | 54,780 | 54,685 | 55,152 | 216,720 | 52,844 | 52,062 | 54,860 | 159,766 | ||||||||||||||||||||
Office Unconsolidated Properties (2) | ||||||||||||||||||||||||||||||
Terminus 100 | 7,555 | 1,922 | 1,754 | 1,780 | 1,812 | 7,268 | 1,872 | 1,978 | 1,899 | 5,749 | ||||||||||||||||||||
Terminus 200 | 5,504 | 1,436 | 1,442 | 1,575 | 1,616 | 6,069 | 1,658 | 1,770 | 1,678 | 5,106 | ||||||||||||||||||||
Emory University Hospital Midtown Medical Office Tower | 3,960 | 987 | 996 | 992 | 999 | 3,974 | 987 | 1,000 | 975 | 2,962 | ||||||||||||||||||||
Gateway Village (3) | 1,208 | 302 | 302 | 302 | 302 | 1,208 | 536 | 451 | 460 | 1,447 | ||||||||||||||||||||
Other (1) | (51 | ) | (5 | ) | (5 | ) | (5 | ) | (3 | ) | (18 | ) | (3 | ) | 14 | 1 | 12 | |||||||||||||
Subtotal - Office Unconsolidated | 18,176 | 4,642 | 4,489 | 4,644 | 4,726 | 18,501 | 5,050 | 5,213 | 5,013 | 15,276 | ||||||||||||||||||||
Discontinued Operations | 1,782 | (11 | ) | — | — | — | (11 | ) | — | — | — | — | ||||||||||||||||||
Total Office Net Operating Income | 206,551 | 56,734 | 59,269 | 59,329 | 59,878 | 235,210 | 57,894 | 57,275 | 59,873 | 175,042 | ||||||||||||||||||||
Other | ||||||||||||||||||||||||||||||
Consolidated Properties (1) | 1,383 | (24 | ) | 10 | — | 205 | 191 | 23 | (8 | ) | 1 | 16 | ||||||||||||||||||
Unconsolidated Properties (2) | ||||||||||||||||||||||||||||||
Emory Point Apartments (Phase I) | 4,647 | 1,071 | 1,244 | 1,213 | 1,171 | 4,699 | 1,185 | 1,250 | 1,014 | 3,449 | ||||||||||||||||||||
Emory Point Retail (Phase I) | 1,080 | 281 | 255 | 222 | 136 | 894 | 248 | 218 | 247 | 713 | ||||||||||||||||||||
Emory Point Apartments (Phase II) | — | — | — | 1 | 180 | 181 | 96 | 204 | 408 | 708 | ||||||||||||||||||||
Emory Point Retail (Phase II) | — | — | — | 56 | 24 | 80 | 72 | 75 | 84 | 231 | ||||||||||||||||||||
Other (1) | 1,993 | (6 | ) | (4 | ) | (5 | ) | (5 | ) | (20 | ) | (5 | ) | (6 | ) | (6 | ) | (17 | ) | |||||||||||
Subtotal - Other | 7,720 | 1,346 | 1,495 | 1,487 | 1,506 | 5,834 | 1,596 | 1,741 | 1,747 | 5,084 | ||||||||||||||||||||
Discontinued Operations | 19 | (3 | ) | — | — | — | (3 | ) | — | — | — | — | ||||||||||||||||||
Total Other Net Operating Income | 9,122 | 1,319 | 1,505 | 1,487 | 1,711 | 6,022 | 1,619 | 1,733 | 1,748 | 5,100 | ||||||||||||||||||||
Total Net Operating Income | 215,673 | 58,053 | 60,774 | 60,816 | 61,589 | 241,232 | 59,513 | 59,008 | 61,621 | 180,142 | ||||||||||||||||||||
Cousins Properties Incorporated | 8 | Q3 2016 Supplemental Information |
FUNDS FROM OPERATIONS - DETAIL | ||
2014 | 2015 1st | 2015 2nd | 2015 3rd | 2015 4th | 2015 | 2016 1st | 2016 2nd | 2016 3rd | 2016 YTD | |||||||||||||||||||||
Sales Less Cost of Sales | ||||||||||||||||||||||||||||||
Land Sales Less Cost of Sales - Consolidated | 1,703 | 810 | (566 | ) | 978 | 403 | 1,625 | — | — | — | — | |||||||||||||||||||
Land Sales Less Cost of Sales - Unconsolidated (2) | 2,207 | — | 242 | 2,038 | — | 2,280 | — | — | — | — | ||||||||||||||||||||
Total Sales Less Cost of Sales | 3,910 | 810 | (324 | ) | 3,016 | 403 | 3,905 | — | — | — | — | |||||||||||||||||||
Fee Income | ||||||||||||||||||||||||||||||
Development Fees | 7,265 | 308 | 461 | 531 | 478 | 1,778 | 608 | 486 | 549 | 1,643 | ||||||||||||||||||||
Management Fees (4) | 5,082 | 1,503 | 1,184 | 1,128 | 1,373 | 5,188 | 1,325 | 1,263 | 1,253 | 3,841 | ||||||||||||||||||||
Leasing & Other Fees | 173 | 5 | 59 | 27 | 240 | 331 | 266 | 75 | 143 | 484 | ||||||||||||||||||||
Total Fee Income | 12,520 | 1,816 | 1,704 | 1,686 | 2,091 | 7,297 | 2,199 | 1,824 | 1,945 | 5,968 | ||||||||||||||||||||
Other Income | ||||||||||||||||||||||||||||||
Termination Fees | 4,573 | 193 | 28 | 499 | 547 | 1,267 | 186 | 102 | — | 288 | ||||||||||||||||||||
Termination Fees - Discontinued Operations | 2 | — | — | — | — | — | — | — | — | — | ||||||||||||||||||||
Interest and Other Income | 261 | 55 | 22 | 222 | 138 | 437 | 389 | 27 | 153 | 569 | ||||||||||||||||||||
Interest and Other Income - Discontinued Operations | 4 | — | — | — | — | — | — | — | — | — | ||||||||||||||||||||
Other - Unconsolidated (2) | 561 | 159 | 188 | 124 | 276 | 747 | 546 | 151 | 134 | 831 | ||||||||||||||||||||
Total Other Income | 5,401 | 407 | 238 | 845 | 961 | 2,451 | 1,121 | 280 | 287 | 1,688 | ||||||||||||||||||||
Reimbursed Expenses | (3,652 | ) | (1,111 | ) | (717 | ) | (686 | ) | (916 | ) | (3,430 | ) | (870 | ) | (798 | ) | (795 | ) | (2,463 | ) | ||||||||||
General and Administrative Expenses | (19,787 | ) | (3,493 | ) | (5,936 | ) | (2,976 | ) | (4,513 | ) | (16,918 | ) | (8,242 | ) | (4,691 | ) | (4,368 | ) | (17,301 | ) | ||||||||||
Interest Expense | ||||||||||||||||||||||||||||||
Consolidated Debt | ||||||||||||||||||||||||||||||
The American Cancer Society Center | (8,710 | ) | (2,131 | ) | (2,147 | ) | (2,164 | ) | (2,157 | ) | (8,599 | ) | (2,126 | ) | (2,119 | ) | (2,134 | ) | (6,379 | ) | ||||||||||
Post Oak Central | (8,127 | ) | (2,010 | ) | (2,001 | ) | (1,992 | ) | (1,983 | ) | (7,986 | ) | (1,974 | ) | (1,965 | ) | (1,956 | ) | (5,895 | ) | ||||||||||
Promenade | (4,850 | ) | (1,194 | ) | (1,187 | ) | (1,180 | ) | (1,173 | ) | (4,734 | ) | (1,165 | ) | (1,157 | ) | (1,150 | ) | (3,472 | ) | ||||||||||
Unsecured Credit Facility | (3,354 | ) | (966 | ) | (1,072 | ) | (1,089 | ) | (962 | ) | (4,089 | ) | (832 | ) | (1,053 | ) | (870 | ) | (2,755 | ) | ||||||||||
191 Peachtree Tower | (3,444 | ) | (861 | ) | (861 | ) | (861 | ) | (861 | ) | (3,444 | ) | (861 | ) | (860 | ) | (856 | ) | (2,577 | ) | ||||||||||
816 Congress Avenue | (709 | ) | (817 | ) | (818 | ) | (817 | ) | (817 | ) | (3,269 | ) | (817 | ) | (817 | ) | (817 | ) | (2,451 | ) | ||||||||||
Fifth Third Center | — | — | — | — | — | — | — | — | (427 | ) | (427 | ) | ||||||||||||||||||
Meridian Mark Plaza | (1,562 | ) | (387 | ) | (385 | ) | (384 | ) | (382 | ) | (1,538 | ) | (381 | ) | (379 | ) | (377 | ) | (1,137 | ) | ||||||||||
Colorado Tower | — | — | — | — | — | — | — | — | (353 | ) | (353 | ) | ||||||||||||||||||
The Points at Waterview | (872 | ) | (213 | ) | (211 | ) | (209 | ) | (8 | ) | (641 | ) | — | — | — | — | ||||||||||||||
Other | (234 | ) | — | — | — | — | — | — | — | — | — | |||||||||||||||||||
Capitalized | 2,752 | 902 | 813 | 1,023 | 839 | 3,577 | 742 | 1,016 | 1,230 | 2,988 | ||||||||||||||||||||
Subtotal - Consolidated | (29,110 | ) | (7,677 | ) | (7,869 | ) | (7,673 | ) | (7,504 | ) | (30,723 | ) | (7,414 | ) | (7,334 | ) | (7,710 | ) | (22,458 | ) | ||||||||||
Unconsolidated Debt (2) | ||||||||||||||||||||||||||||||
Terminus 100 | (3,494 | ) | (865 | ) | (861 | ) | (857 | ) | (853 | ) | (3,436 | ) | (848 | ) | (844 | ) | (840 | ) | (2,532 | ) | ||||||||||
Terminus 200 | (1,560 | ) | (390 | ) | (390 | ) | (390 | ) | (390 | ) | (1,560 | ) | (390 | ) | (389 | ) | (387 | ) | (1,166 | ) | ||||||||||
Emory University Hospital Midtown Medical Office Tower | (1,336 | ) | (334 | ) | (334 | ) | (333 | ) | (332 | ) | (1,333 | ) | (330 | ) | (329 | ) | (327 | ) | (986 | ) | ||||||||||
Emory Point | (974 | ) | (232 | ) | (242 | ) | (265 | ) | (387 | ) | (1,126 | ) | (439 | ) | (464 | ) | (484 | ) | (1,387 | ) | ||||||||||
Other | — | — | — | — | — | — | — | — | — | — | ||||||||||||||||||||
Subtotal - Unconsolidated | (7,364 | ) | (1,821 | ) | (1,827 | ) | (1,845 | ) | (1,962 | ) | (7,455 | ) | (2,007 | ) | (2,026 | ) | (2,038 | ) | (6,071 | ) | ||||||||||
Total Interest Expense | (36,474 | ) | (9,498 | ) | (9,696 | ) | (9,518 | ) | (9,466 | ) | (38,178 | ) | (9,421 | ) | (9,360 | ) | (9,748 | ) | (28,529 | ) | ||||||||||
Cousins Properties Incorporated | 9 | Q3 2016 Supplemental Information |
FUNDS FROM OPERATIONS - DETAIL | ||
2014 | 2015 1st | 2015 2nd | 2015 3rd | 2015 4th | 2015 | 2016 1st | 2016 2nd | 2016 3rd | 2016 YTD | |||||||||||||||||||||
Other Expenses | ||||||||||||||||||||||||||||||
Noncontrolling Interests | (424 | ) | — | — | — | (111 | ) | (111 | ) | — | — | — | — | |||||||||||||||||
Property Taxes and Other Holding Costs | (1,223 | ) | (287 | ) | (242 | ) | (141 | ) | (158 | ) | (828 | ) | (89 | ) | (98 | ) | (95 | ) | (282 | ) | ||||||||||
Predevelopment & Other | (2,047 | ) | (106 | ) | (187 | ) | (147 | ) | (82 | ) | (522 | ) | (108 | ) | (118 | ) | (140 | ) | (366 | ) | ||||||||||
Severance | (185 | ) | (102 | ) | — | 5 | (84 | ) | (181 | ) | (250 | ) | — | — | (250 | ) | ||||||||||||||
Acquisition Costs | (1,130 | ) | (83 | ) | (2 | ) | (19 | ) | (195 | ) | (299 | ) | — | — | — | — | ||||||||||||||
Merger Costs | — | — | — | — | — | — | (19 | ) | (2,424 | ) | (1,940 | ) | (4,383 | ) | ||||||||||||||||
Total Other Expenses | (5,009 | ) | (578 | ) | (431 | ) | (302 | ) | (630 | ) | (1,941 | ) | (466 | ) | (2,640 | ) | (2,175 | ) | (5,281 | ) | ||||||||||
Income Tax Provision (Benefit) | 20 | — | — | — | — | — | — | — | — | — | ||||||||||||||||||||
Depreciation and Amortization of Non-Real Estate Assets | ||||||||||||||||||||||||||||||
Consolidated | (867 | ) | (423 | ) | (374 | ) | (414 | ) | (410 | ) | (1,621 | ) | (377 | ) | (335 | ) | (328 | ) | (1,040 | ) | ||||||||||
Unconsolidated | (46 | ) | (48 | ) | — | — | — | (48 | ) | — | — | — | — | |||||||||||||||||
Total Non-Real Estate Depreciation and Amortization | (913 | ) | (471 | ) | (374 | ) | (414 | ) | (410 | ) | (1,669 | ) | (377 | ) | (335 | ) | (328 | ) | (1,040 | ) | ||||||||||
Preferred Stock Dividends and Original Issuance Costs | (6,485 | ) | — | — | — | — | — | — | — | — | — | |||||||||||||||||||
FFO | 165,204 | 45,935 | 45,238 | 52,467 | 49,109 | 192,749 | 43,457 | 43,288 | 46,439 | 133,184 | ||||||||||||||||||||
Weighted Average Shares - Basic | 204,216 | 216,568 | 216,630 | 216,261 | 213,872 | 215,827 | 210,904 | 210,129 | 210,170 | 210,400 | ||||||||||||||||||||
Weighted Average Shares - Diluted | 204,460 | 216,754 | 216,766 | 216,374 | 213,978 | 215,979 | 210,974 | 210,362 | 210,326 | 210,528 | ||||||||||||||||||||
FFO per Share - Basic and Diluted | 0.81 | 0.21 | 0.21 | 0.24 | 0.23 | 0.89 | 0.21 | 0.21 | 0.22 | 0.63 | ||||||||||||||||||||
Note: Amounts may differ slightly from other schedules contained herein due to rounding. | |||||||||||||||||
(1) Represents NOI for properties sold prior to September 30, 2016. | |||||||||||||||||
(2) Unconsolidated amounts include amounts recorded in unconsolidated joint ventures for the respective category multiplied by the Company's ownership interest. The Company does not control the operations of the unconsolidated joint ventures, but believes including these amounts in the categories indicated is meaningful to investors and analysts. | |||||||||||||||||
(3) The Company receives an 11.46% current return on its $11.1 million investment in Gateway Village and, when certain other revenue criteria are met, receives additional returns. The Company recognizes these amount as NOI from this venture. After December 1, 2016, net income and cash flows will be allocated 50% to each joint venture member. | |||||||||||||||||
(4) Management Fees include reimbursement of expenses that are included in the "Reimbursed Expenses" line item. | |||||||||||||||||
Cousins Properties Incorporated | 10 | Q3 2016 Supplemental Information |
PORTFOLIO STATISTICS | ||
Property Description | Metropolitan Area | Rentable Square Feet | Financial Statement Presentation | Company's Ownership Interest | End of Period Leased 3Q16 | End of Period Leased 2Q16 | Weighted Average Occupancy 3Q16 | Weighted Average Occupancy 2Q16 | % of Total Net Operating Income (1) | Property Level Debt ($000) (2) | ||||||||||||||||||||
Office | ||||||||||||||||||||||||||||||
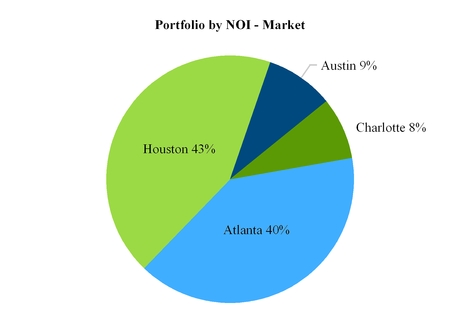
Greenway Plaza (3) | Houston | 4,348,000 | Consolidated | 100 | % | 89.9 | % | 88.9 | % | 88.7 | % | 88.2 | % | 33 | % | $ | — | |||||||||||||
Post Oak Central (3) | Houston | 1,280,000 | Consolidated | 100 | % | 92.6 | % | 92.8 | % | 93.2 | % | 93.2 | % | 10 | % | 179,170 | ||||||||||||||
Colorado Tower | Austin | 373,000 | Consolidated | 100 | % | 100.0 | % | 100.0 | % | 99.2 | % | 98.8 | % | 5 | % | 120,000 | ||||||||||||||
816 Congress | Austin | 435,000 | Consolidated | 100 | % | 94.6 | % | 94.6 | % | 91.3 | % | 93.4 | % | 4 | % | 85,000 | ||||||||||||||
Research Park V | Austin | 173,000 | Consolidated | 100 | % | 97.1 | % | 57.6 | % | 33.5 | % | 19.9 | % | — | % | — | ||||||||||||||
Texas | 6,609,000 | 52 | % | 384,170 | ||||||||||||||||||||||||||
Northpark Town Center (3) | Atlanta | 1,528,000 | Consolidated | 100 | % | 87.8 | % | 85.8 | % | 84.7 | % | 84.2 | % | 9 | % | — | ||||||||||||||
191 Peachtree Tower (4) | Atlanta | 1,225,000 | Consolidated | 100 | % | 92.5 | % | 92.5 | % | 89.6 | % | 88.2 | % | 7 | % | 99,188 | ||||||||||||||
Promenade | Atlanta | 777,000 | Consolidated | 100 | % | 94.6 | % | 93.7 | % | 90.0 | % | 89.9 | % | 6 | % | 106,068 | ||||||||||||||
The American Cancer Society Center | Atlanta | 996,000 | Consolidated | 100 | % | 87.3 | % | 87.3 | % | 83.4 | % | 83.4 | % | 5 | % | 127,989 | ||||||||||||||
Terminus 100 | Atlanta | 660,000 | Unconsolidated | 50 | % | 90.6 | % | 90.6 | % | 89.6 | % | 92.1 | % | 3 | % | 63,656 | ||||||||||||||
Terminus 200 | Atlanta | 566,000 | Unconsolidated | 50 | % | 91.9 | % | 91.3 | % | 91.3 | % | 91.3 | % | 3 | % | 40,629 | ||||||||||||||
Meridian Mark Plaza | Atlanta | 160,000 | Consolidated | 100 | % | 100.0 | % | 100.0 | % | 99.4 | % | 93.3 | % | 2 | % | 24,639 | ||||||||||||||
Emory University Hospital Midtown Medical Office Tower | Atlanta | 358,000 | Unconsolidated | 50 | % | 96.2 | % | 96.4 | % | 96.3 | % | 96.4 | % | 2 | % | 36,594 | ||||||||||||||
Georgia | 6,270,000 | 37 | % | 498,763 | ||||||||||||||||||||||||||
Fifth Third Center | Charlotte | 698,000 | Consolidated | 100 | % | 96.7 | % | 96.3 | % | 91.1 | % | 90.2 | % | 7 | % | 150,000 | ||||||||||||||
Gateway Village | Charlotte | 1,065,000 | Unconsolidated | 50 | % | 100.0 | % | 100.0 | % | 100.0 | % | 100.0 | % | 1 | % | 1,633 | ||||||||||||||
North Carolina | 1,763,000 | 8 | % | 151,633 | ||||||||||||||||||||||||||
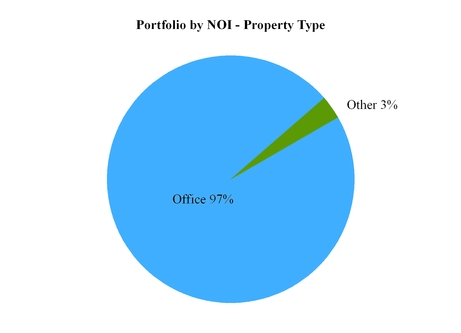
Total Office Properties | 14,642,000 | 97 | % | $ | 1,034,566 | |||||||||||||||||||||||||
Other | ||||||||||||||||||||||||||||||
Emory Point Apartments (Phase I) (5) | Atlanta | 404,000 | Unconsolidated | 75 | % | 96.2 | % | 88.0 | % | 92.0 | % | 89.4 | % | 2 | % | 36,123 | ||||||||||||||
Emory Point Retail (Phase I) | Atlanta | 80,000 | Unconsolidated | 75 | % | 84.3 | % | 84.7 | % | 84.7 | % | 84.7 | % | — | % | 7,399 | ||||||||||||||
Emory Point Apartments (Phase II) (5) | Atlanta | 257,000 | Unconsolidated | 75 | % | 87.0 | % | 75.9 | % | 79.0 | % | 59.5 | % | 1 | % | 28,519 | ||||||||||||||
Emory Point Retail (Phase II) | Atlanta | 45,000 | Unconsolidated | 75 | % | 78.8 | % | 75.7 | % | 69.1 | % | 68.3 | % | — | % | 5,033 | ||||||||||||||
Total Other | 786,000 | 3 | % | $ | 77,074 | |||||||||||||||||||||||||
Total Portfolio | 15,428,000 | 100 | % | $ | 1,111,640 | |||||||||||||||||||||||||
(1) | Net Operating Income represents the Company's share of rental property revenues less rental property operating expenses. Calculation is based on amounts for the three months ended September 30, 2016. | |||||||||||||||||||||||||||||
(2) | Property level debt represents the Company's share of total debt as of September 30, 2016. | |||||||||||||||||||||||||||||
(3) | Contains multiple buildings that are grouped together for reporting purposes. | |||||||||||||||||||||||||||||
(4) | On October 25, 2016, the Company sold 191 Peachtree Tower. | |||||||||||||||||||||||||||||
(5) | Phase I consists of 443 units and Phase II consists of 307 units. | |||||||||||||||||||||||||||||
Cousins Properties Incorporated | 11 | Q3 2016 Supplemental Information |
PORTFOLIO STATISTICS | ||
Cousins Properties Incorporated | 12 | Q3 2016 Supplemental Information |
SAME PROPERTY PERFORMANCE (1) | ||
Net Operating Income ($ in thousands) | |||||||||||||||||
Three Months Ended | |||||||||||||||||
September 30, 2016 | September 30, 2015 | June 30, 2016 | 3Q16 vs. 3Q15 % Change | 3Q16 vs. 2Q16% Change | |||||||||||||
Property Revenues (2) | $ | 79,141 | $ | 77,637 | $ | 76,561 | 1.9 | % | 3.4 | % | |||||||
Property Operating Expenses (2) | 33,233 | 33,315 | 32,400 | (0.2 | )% | 2.6 | % | ||||||||||
Property Net Operating Income | $ | 45,908 | $ | 44,322 | $ | 44,161 | 3.6 | % | 4.0 | % | |||||||
Cash Basis Property Revenues (3) | $ | 75,524 | $ | 73,831 | $ | 73,368 | 2.3 | % | 2.9 | % | |||||||
Cash Basis Property Operating Expenses (4) | 33,248 | 33,313 | 32,415 | (0.2 | )% | 2.6 | % | ||||||||||
Cash Basis Property Net Operating Income | $ | 42,276 | $ | 40,518 | $ | 40,953 | 4.3 | % | 3.2 | % | |||||||
End of Period Leased | 91.2 | % | 91.5 | % | 90.7 | % | |||||||||||
Weighted Average Occupancy | 89.5 | % | 89.7 | % | 89.2 | % | |||||||||||
Nine Months Ended | |||||||||||||||||
September 30, 2016 | September 30, 2015 | % Change | |||||||||||||||
Property Revenues (2) | $ | 231,078 | $ | 227,781 | 1.4 | % | |||||||||||
Property Operating Expenses (2) | 96,231 | 96,981 | (0.8 | )% | |||||||||||||
Property Net Operating Income | $ | 134,847 | $ | 130,800 | 3.1 | % | |||||||||||
Cash Basis Property Revenues (3) | $ | 221,117 | $ | 215,253 | 2.7 | % | |||||||||||
Cash Basis Property Operating Expenses (4) | 96,272 | 97,012 | (0.8 | )% | |||||||||||||
Cash Basis Property Net Operating Income | $ | 124,845 | $ | 118,241 | 5.6 | % | |||||||||||
(1) | Same Properties include those office properties that were operational and stabilized on January 1, 2015, excluding properties subsequently sold. See Non-GAAP Financial Measures - Calculation and Reconciliations. Properties included in this reporting period are as follows: | ||
Greenway Plaza | The American Cancer Society Center | Promenade | |
Post Oak Central | Terminus 100 | Meridian Mark Plaza | |
191 Peachtree Tower | Terminus 200 | Emory University Hospital Midtown Medical Office Tower | |
816 Congress | |||
(2) | Property Revenues and Expenses include results for the Company and its share of unconsolidated joint ventures. Net operating income for unconsolidated joint ventures is calculated as property revenue less property expenses at the joint ventures multiplied by the Company's ownership interest. The Company does not control the operations of the unconsolidated joint ventures, but believes that including these amounts with consolidated net operating income is meaningful to investors and analysts. | ||
(3) | Cash Basis Same Property Revenues include that of the Company and its share of unconsolidated joint ventures. It represents Property Revenues, excluding straight-line rents, amortization of lease inducements and amortization of acquired above and below market rents. | ||
(4) | Cash Basis Same Property Operating Expenses include that of the Company and its share of unconsolidated joint ventures. It represents Property Operating Expenses, excluding straight-line ground rent expense and amortization of above and below market ground rent expense. | ||
Cousins Properties Incorporated | 13 | Q3 2016 Supplemental Information |
OFFICE LEASING ACTIVITY(1) | ||
Three Months Ended September 30, 2016 | Nine Months Ended September 30, 2016 | ||||||||||||||||||||||||||||||
New | Renewal | Expansion | Total | New | Renewal | Expansion | Total | ||||||||||||||||||||||||
Gross leased (square feet) | 1,017,442 | 1,728,712 | |||||||||||||||||||||||||||||
Less: Leases one year or less, amenity leases, percentage rent leases, storage leases, intercompany leases, and license agreements | (46,735) | (135,560) | |||||||||||||||||||||||||||||
Net leased (square feet) | 682,381 | 238,151 | 50,175 | 970,707 | 958,879 | 518,137 | 116,136 | 1,593,152 | |||||||||||||||||||||||
Number of transactions | 17 | 27 | 8 | 52 | 43 | 60 | 18 | 121 | |||||||||||||||||||||||
Lease term (years) (2) | 14.2 | 7.2 | 6.4 | 12.1 | 12.6 | 6.6 | 6.4 | 10.2 | |||||||||||||||||||||||
Net rent (per square foot) (2)(3)(4) | $ | 23.27 | $ | 23.14 | $ | 25.95 | $ | 23.51 | $ | 23.50 | $ | 22.94 | $ | 23.46 | $ | 23.22 | |||||||||||||||
Total leasing costs (per square foot) (2)(3)(5) | (8.12 | ) | (4.76 | ) | (7.54 | ) | (6.18 | ) | (8.04 | ) | (5.12 | ) | (7.60 | ) | (6.55 | ) | |||||||||||||||
Net effective rent (per square foot) (2)(3) | $ | 15.15 | $ | 18.38 | $ | 18.41 | $ | 17.33 | $ | 15.46 | $ | 17.82 | $ | 15.86 | $ | 16.67 | |||||||||||||||
Second generation leased square feet (2)(6) | 243,680 | 643,376 | |||||||||||||||||||||||||||||
Increase in second generation net rent (2)(4)(6) | 27.9 | % | 21.6 | % | |||||||||||||||||||||||||||
Increase in cash basis second generation net rent (2)(6)(7) | 9.1 | % | 5.4 | % | |||||||||||||||||||||||||||
(1) Excludes apartment and retail leasing at our mixed-use projects. | |||||||||||||||||||||||||||||||
(2) Weighted average. | |||||||||||||||||||||||||||||||
(3) Excludes NCR Phase II lease of 260,000 square feet and Dimensional Fund Advisors lease of 282,000 square feet due to final financial terms not being determined until construction completion. The Company previously disclosed the Dimensional Fund Advisors lease in a press release on March 30, 2016. The size of the lease increased and has now been finalized. This lease was previously not included in the Company's Office Leasing Activity. | |||||||||||||||||||||||||||||||
(4) Represents straight-lined net rent per square foot (operating expenses deducted from gross leases) over the lease term. | |||||||||||||||||||||||||||||||
(5) Includes tenant improvements, external leasing commissions, and free rent. | |||||||||||||||||||||||||||||||
(6) Excludes leases executed for spaces that were vacant upon acquisition, new leases in development properties, and leases for spaces that have been vacant for one year or more. | |||||||||||||||||||||||||||||||
(7) Represents increase in net rent at the end of term paid by the prior tenant compared to net rent at beginning of term paid by the current tenant. For early renewals, represents increase in net rent at the end of the term of the original lease compared to net rent at the beginning of the extended term of the lease. | |||||||||||||||||||||||||||||||
Cousins Properties Incorporated | 14 | Q3 2016 Supplemental Information |
OFFICE LEASE EXPIRATIONS | ||
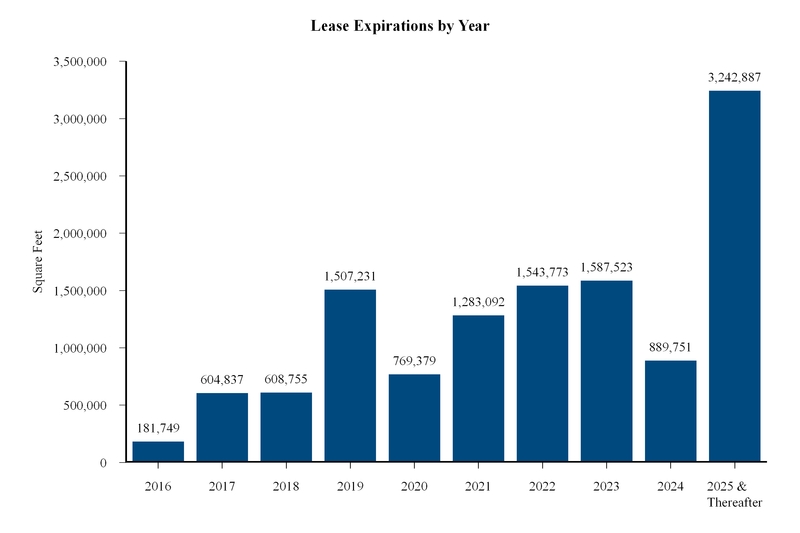
Lease Expirations by Year
Year of Expiration | Square Feet Expiring (1) | % of Leased Space | Annual Contractual Rents ($000's) (1)(2) | % of Total Annual Contractual Rents | Annual Contractual Rent/Sq. Ft. (2) | ||||||||||||
2016 | 181,749 | 1.5 | % | $ | 2,943 | 1.0 | % | $ | 16.19 | ||||||||
2017 | 604,837 | 5.0 | % | 13,446 | 4.5 | % | 22.23 | ||||||||||
2018 | 608,755 | 5.0 | % | 14,082 | 4.7 | % | 23.13 | ||||||||||
2019 | 1,507,231 | 12.3 | % | 33,683 | 11.3 | % | 22.35 | ||||||||||
2020 | 769,379 | 6.3 | % | 17,969 | 6.0 | % | 23.36 | ||||||||||
2021 | 1,283,092 | 10.5 | % | 32,002 | 10.7 | % | 24.94 | ||||||||||
2022 | 1,543,773 | 12.6 | % | 37,602 | 12.6 | % | 24.36 | ||||||||||
2023 | 1,587,523 | 13.0 | % | 36,499 | 12.2 | % | 22.99 | ||||||||||
2024 | 889,751 | 7.3 | % | 24,783 | 8.3 | % | 27.85 | ||||||||||
2025 &Thereafter | 3,242,887 | 26.5 | % | 85,442 | 28.7 | % | 26.35 | ||||||||||
Total | 12,218,977 | 100.0 | % | $ | 298,451 | 100.0 | % | $ | 24.43 | ||||||||
Lease Expirations Greater than 100,000 Square Feet Through Year End 2019
Expiration Date | Tenant | Market | Building | Square Feet Expiring (1) | |||||
January 2019 | National Union Fire Insurance Company | Atlanta | Northpark Town Center | 105,362 | |||||
September 2019 | Stewart Information Services | Houston | Post Oak Central | 182,915 | |||||
December 2019 | Apache Corporation | Houston | Post Oak Central | 524,342 | |||||
(1) Company's share. | |||
(2) Annual Contractual Rent shown is the rate in the year of expiration. It includes the minimum contractual rent paid by the tenant which may or may not include a base year of operating expenses depending upon the terms of the lease. | |||
Cousins Properties Incorporated | 15 | Q3 2016 Supplemental Information |
OFFICE LEASE EXPIRATIONS | ||
Note: Company's share
Cousins Properties Incorporated | 16 | Q3 2016 Supplemental Information |
TOP 20 OFFICE TENANTS | ||
Tenant (1) | Company's Share of Square Footage | Company's Share of Annualized Base Rent | Percentage of Total Company's Share of Annualized Base Rent (2) | Average Remaining Lease Term (Years) (3) | |||||||||
1 | Occidental Oil & Gas Corp. | 961,491 | $ | 18,578,926 | 8% | 10 | |||||||
2 | Apache Corporation | 524,342 | 9,335,895 | 4% | 3 | ||||||||
3 | Invesco Management Group, Inc. | 400,332 | 6,792,682 | 3% | 7 | ||||||||
4 | Bank of America (4) | 829,923 | 6,005,290 | 2% | 6 | ||||||||
5 | McGuireWoods LLP | 198,648 | 5,743,205 | 2% | 9 | ||||||||
6 | Deloitte, LLP | 259,998 | 5,556,157 | 2% | 8 | ||||||||
7 | Transocean Offshore Deepwater | 255,413 | 5,096,491 | 2% | 6 | ||||||||
8 | Smith, Gambrell & Russell, LLP | 159,136 | 4,863,347 | 2% | 5 | ||||||||
9 | American Cancer Society, Inc. | 275,160 | 4,830,511 | 2% | 4 | ||||||||
10 | Parsley Energy, L.P. | 135,107 | 4,016,731 | 2% | 8 | ||||||||
11 | US South Communications | 196,223 | 3,895,888 | 2% | 5 | ||||||||
12 | CO Space Properties, LLC | 120,298 | 3,610,496 | 2% | 4 | ||||||||
13 | Stewart Information Services Corporation | 189,474 | 3,375,634 | 1% | 3 | ||||||||
14 | Direct Energy | 201,554 | 3,259,583 | 1% | 7 | ||||||||
15 | National Union Fire Insurance Company | 106,472 | 2,983,164 | 1% | 2 | ||||||||
16 | Gulf South Pipeline Company LP | 98,616 | 2,366,784 | 1% | 8 | ||||||||
17 | Emory University | 90,093 | 2,254,945 | 1% | 10 | ||||||||
18 | GDF SUEZ Energy North America | 134,602 | 2,158,312 | 1% | 4 | ||||||||
19 | Thompson, Ventulett, Stainback & Assoc | 67,418 | 2,157,376 | 1% | 8 | ||||||||
20 | Veritiv Corporation | 68,315 | 2,110,934 | 1% | 10 | ||||||||
Total Top 20 | 5,272,615 | $ | 98,992,351 | 41% | 6 | ||||||||
(1) | In some cases, the actual tenant may be an affiliate of the entity shown. | ||||||||||||
(2) | Annualized Base Rent represents the annualized minimum rent paid by the tenant as of the date of this report. If the tenant is in a free rent period as of the date of this report, Annualized Base Rent represents the annualized minimum contractual rent the tenant will pay in the first month it is required to pay rent which may or may not include a base year of operating expenses depending upon the terms of the lease. | ||||||||||||
(3) | Weighted average. | ||||||||||||
(4) | A portion of the Company's economic exposure for this tenant is limited to a fixed return through a joint venture arrangement. | ||||||||||||
Note: | This schedule includes tenants whose leases have commenced and/or have taken occupancy. Leases that have been signed but have not commenced are excluded from this schedule. | ||||||||||||
Cousins Properties Incorporated | 17 | Q3 2016 Supplemental Information |
TENANT INDUSTRY DIVERSIFICATION | ||
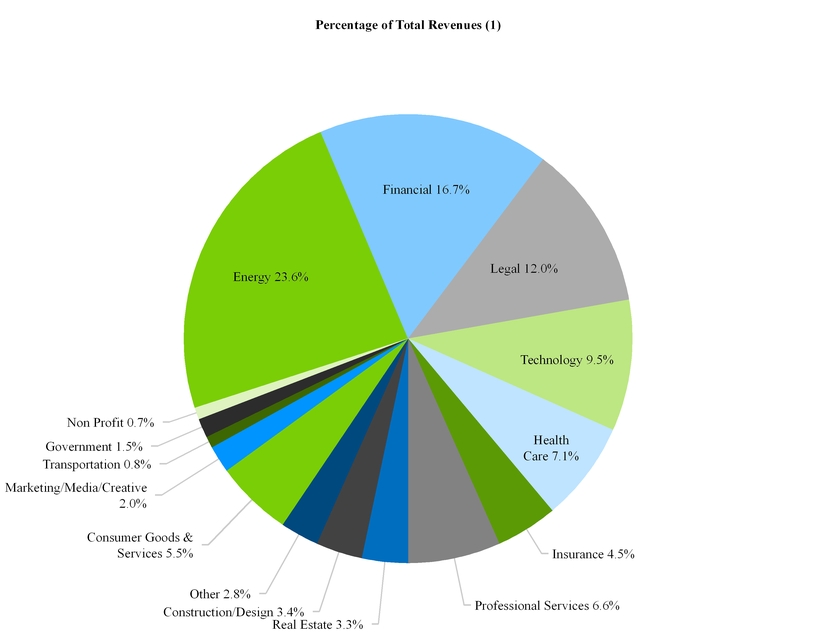
(1) Based on total portfolio holdings.
Cousins Properties Incorporated | 18 | Q3 2016 Supplemental Information |
INVESTMENT ACTIVITY | ||
Completed Property Acquisitions
Property | Type | Metropolitan Area | Company's Ownership Interest | Timing | Square Feet | Gross Purchase Price ($ in thousands) | ||||||||||
2014 | ||||||||||||||||
Fifth Third Center | Office | Charlotte | 100.0 | % | 3Q | 698,000 | $ | 215,000 | ||||||||
Northpark Town Center | Office | Atlanta | 100.0 | % | 4Q | 1,528,000 | 348,000 | |||||||||
2013 | ||||||||||||||||
Post Oak Central | Office | Houston | 100.0 | % | 1Q | 1,280,000 | 230,900 | |||||||||
Terminus 200 | Office | Atlanta | 50.0 | % | 1Q | 566,000 | 164,000 | |||||||||
816 Congress | Office | Austin | 100.0 | % | 2Q | 435,000 | 102,400 | |||||||||
Greenway Plaza | Office | Houston | 100.0 | % | 3Q | 4,348,000 | 950,000 | |||||||||
777 Main | Office | Fort Worth | 100.0 | % | 3Q | 980,000 | 160,000 | |||||||||
2012 | ||||||||||||||||
2100 Ross | Office | Dallas | 100.0 | % | 3Q | 844,000 | 59,200 | |||||||||
10,679,000 | $ | 2,229,500 | ||||||||||||||
Completed Property Developments
Project | Type | Metropolitan Area | Company's Ownership Interest | Timing | Square Feet | Total Project Cost ($ in thousands) | ||||||||||
2015 | ||||||||||||||||
Colorado Tower | Office | Austin | 100.0 | % | 1Q | 373,000 | $ | 126,100 | ||||||||
Emory Point - Phase II | Mixed | Atlanta | 75.0 | % | 3Q | 302,000 | 75,400 | |||||||||
Research Park V | Office | Austin | 100.0 | % | 4Q | 173,000 | 45,000 | |||||||||
2013 | ||||||||||||||||
Emory Point - Phase I | Mixed | Atlanta | 75.0 | % | 4Q | 484,000 | 102,300 | |||||||||
2012 | ||||||||||||||||
Mahan Village | Retail | Tallahassee | 50.5 | % | 4Q | 147,000 | 25,800 | |||||||||
1,479,000 | $ | 374,600 | ||||||||||||||
Cousins Properties Incorporated | 19 | Q3 2016 Supplemental Information |
INVESTMENT ACTIVITY | ||
Completed Property Dispositions
Property | Type | Metropolitan Area | Company's Ownership Interest | Timing | Square Feet | Gross Sales Price ($ in thousands) | ||||||||||
2016 | ||||||||||||||||
100 North Point Center East | Office | Atlanta | 100.0 | % | 1Q | 129,000 | $ | 22,000 | ||||||||
2015 | ||||||||||||||||
2100 Ross | Office | Dallas | 100.0 | % | 3Q | 844,000 | 131,000 | |||||||||
200, 333, and 555 North Point Center East | Office | Atlanta | 100.0 | % | 4Q | 411,000 | 70,300 | |||||||||
The Points at Waterview | Office | Dallas | 100.0 | % | 4Q | 203,000 | 26,800 | |||||||||
2014 | ||||||||||||||||
600 University Park Place | Office | Birmingham | 100.0 | % | 1Q | 123,000 | 19,700 | |||||||||
Lakeshore Park Plaza | Office | Birmingham | 100.0 | % | 3Q | 197,000 | 25,000 | |||||||||
Mahan Village | Retail | Florida | 50.5 | % | 4Q | 147,000 | 29,500 | |||||||||
Cousins Watkins LLC | Retail | Other | 50.5 | % | 4Q | 339,000 | 79,500 | |||||||||
777 Main | Office | Fort Worth | 100.0 | % | 4Q | 980,000 | 167,000 | |||||||||
2013 | ||||||||||||||||
Terminus 100 | Office | Atlanta | 100.0 | % | 1Q | 656,000 | 209,200 | |||||||||
Tiffany Springs MarketCenter | Retail | Kansas City | 88.5 | % | 3Q | 238,000 | 53,500 | |||||||||
The Avenue Murfreesboro | Retail | Nashville | 50.0 | % | 3Q | 752,000 | 164,000 | |||||||||
CP Venture Two LLC | Retail | Other | 10.3 | % | 3Q | 934,000 | 226,100 | |||||||||
CP Venture Five LLC | Retail | Other | 11.5 | % | 3Q | 1,179,000 | 296,200 | |||||||||
Inhibitex | Office | Atlanta | 100.0 | % | 4Q | 51,000 | 8,300 | |||||||||
2012 | ||||||||||||||||
The Avenue Collierville | Retail | Memphis | 100.0 | % | 2Q | 511,000 | 55,000 | |||||||||
Galleria 75 | Office | Atlanta | 100.0 | % | 2Q | 111,000 | 9,200 | |||||||||
Ten Peachtree Place | Office | Atlanta | 50.0 | % | 2Q | 260,000 | 45,300 | |||||||||
The Avenue Webb Gin | Retail | Atlanta | 100.0 | % | 4Q | 322,000 | 59,600 | |||||||||
The Avenue Forsyth | Retail | Atlanta | 88.5 | % | 4Q | 524,000 | 119,000 | |||||||||
Cosmopolitan Center | Office | Atlanta | 100.0 | % | 4Q | 51,000 | 7,000 | |||||||||
Palisades West | Office | Austin | 50.0 | % | 4Q | 373,000 | 64,800 | |||||||||
Presbyterian Medical Plaza | Office | Charlotte | 11.5 | % | 4Q | 69,000 | 4,500 | |||||||||
9,404,000 | $ | 1,892,500 | ||||||||||||||
Cousins Properties Incorporated | 20 | Q3 2016 Supplemental Information |
DEVELOPMENT PIPELINE (1) | ||
Project | Type | Metropolitan Area | Company's Ownership Interest | Project Start Date | Number of Square Feet /Apartment Units | Estimated Project Cost (2) ($ in thousands) | Project Cost Incurred to Date (2) ($ in thousands) | Percent Leased | Initial Occupancy (3) | Estimated Stabilization (4) | |||||||||||||||||
Carolina Square | Mixed | Chapel Hill, NC | 50 | % | 2Q15 | $ | 123,000 | $ | 51,449 | ||||||||||||||||||
Office | 158,000 | 65 | % | 3Q17 | 3Q18 | ||||||||||||||||||||||
Retail | 44,000 | 61 | % | 3Q17 | 3Q18 | ||||||||||||||||||||||
Apartments | 246 | — | % | 3Q17 | 3Q18 | ||||||||||||||||||||||
864 Spring Street (NCR Phase I) | Office | Atlanta, GA | 100 | % | 3Q15 | 494,000 | 213,000 | 72,392 | 100 | % | 1Q18 | 1Q18 | |||||||||||||||
8000 Avalon | Office | Atlanta, GA | 90 | % | 1Q16 | 224,000 | 73,000 | 25,760 | 19 | % | 2Q17 | 2Q18 | |||||||||||||||
858 Spring Street (NCR Phase II) | Office | Atlanta, GA | 100 | % | 4Q16 | 260,000 | 119,000 | 13,616 | 100 | % | 4Q18 | 4Q18 | |||||||||||||||
Dimensional Place | Office | Charlotte, NC | 50 | % | 4Q16 | 282,000 | 94,000 | 15,168 | 100 | % | 4Q18 | 4Q18 | |||||||||||||||
Total | $ | 622,000 | $ | 178,385 | |||||||||||||||||||||||
(1) | This schedule shows projects currently under active development and/or projects with a contractual obligation through the substantial completion of construction. Amounts included in the estimated project cost column represent the estimated costs of the project through stabilization. Significant estimation is required to derive these costs, and the final costs may differ from these estimates. The projected stabilization dates are also estimates and are subject to change as the project proceeds through the development process. | ||||
(2) | Amount represents 100% of the estimated project cost. Carolina Square is expected to be funded with a combination of equity from the partners and up to $79.8 million from a construction loan, which has $9.3 million outstanding as of September 30, 2016. | ||||
(3) | Represents the quarter which the Company estimates the first tenant occupies space. | ||||
(4) | Stabilization represents the earlier of the quarter in which the Company estimates it will achieve 90% economic occupancy or one year from initial occupancy. | ||||
Cousins Properties Incorporated | 21 | Q3 2016 Supplemental Information |
LAND INVENTORY | ||
Metropolitan Area | Company's Ownership Interest | Total Developable Land (Acres) | Company's Share | |||||||||
Commercial | ||||||||||||
North Point | Atlanta | 100.0% | 32 | |||||||||
Wildwood Office Park | Atlanta | 50.0% | 22 | |||||||||
The Avenue Forsyth-Adjacent Land | Atlanta | 100.0% | 10 | |||||||||
120 West Trinity | Atlanta | 20.0% | 5 | |||||||||
Georgia | 69 | |||||||||||
Victory Center | Dallas | 75.0% | 3 | |||||||||
Texas | 3 | |||||||||||
Commercial Land Held (Acres) | 72 | 56 | ||||||||||
Cost Basis of Commercial Land Held | $ | 37,817 | $ | 12,478 | ||||||||
Residential (1) | ||||||||||||
Paulding County | Atlanta | 50.0% | 478 | |||||||||
Callaway Gardens (2) | Atlanta | 100.0% | 217 | |||||||||
Georgia | 695 | |||||||||||
Padre Island | Corpus Christi | 50.0% | 15 | |||||||||
Texas | 15 | |||||||||||
Residential Land Held (Acres) | 710 | 464 | ||||||||||
Cost Basis of Residential Land Held | $ | 11,834 | $ | 8,297 | ||||||||
Grand Total Land Held (Acres) | 782 | 520 | ||||||||||
Grand Total Cost Basis of Land Held | $ | 49,651 | $ | 20,775 | ||||||||
(1) | Residential represents land that may be sold to third parties as lots or in large tracts for residential development. | ||||
(2) | Company's ownership interest is shown at 100% as Callaway Gardens is owned in a joint venture which is consolidated with the Company. | ||||
Cousins Properties Incorporated | 22 | Q3 2016 Supplemental Information |
DEBT SCHEDULE | ||
Company's Share of Debt Maturities and Principal Payments | |||||||||||||||||||||||||||||||||||||||||||||||
Description (Interest Rate Base, if not fixed) | Company's Ownership Interest | Rate at End of Quarter | Maturity Date | 2016 | 2017 | 2018 | 2019 | 2020 | Thereafter | Total Principal | Deferred Loan Costs (1) | Total | Company's Share Recourse (2) | ||||||||||||||||||||||||||||||||||
Consolidated Debt | |||||||||||||||||||||||||||||||||||||||||||||||
Floating Rate Debt | |||||||||||||||||||||||||||||||||||||||||||||||
Credit Facility, Unsecured (LIBOR + 1.10%-1.45%; $500mm facility)(3) | 100.0 | % | 1.63 | % | 5/28/19 | $ | — | $ | — | $ | — | $ | — | $ | — | $ | — | $ | — | $ | — | $ | — | $ | — | ||||||||||||||||||||||
Total Floating Rate Debt | — | — | — | — | — | — | — | — | — | — | |||||||||||||||||||||||||||||||||||||
Fixed Rate Debt | |||||||||||||||||||||||||||||||||||||||||||||||
The American Cancer Society Center (4) | 100.0 | % | 6.45 | % | 9/1/17 | 481 | 127,508 | — | — | — | — | 127,989 | (79 | ) | 127,910 | — | |||||||||||||||||||||||||||||||
191 Peachtree Tower | 100.0 | % | 3.35 | % | 10/1/18 | 493 | 2,013 | 96,682 | — | — | — | 99,188 | (188 | ) | 99,000 | — | |||||||||||||||||||||||||||||||
Meridian Mark Plaza | 100.0 | % | 6.00 | % | 8/1/20 | 117 | 484 | 514 | 546 | 22,978 | — | 24,639 | (102 | ) | 24,537 | — | |||||||||||||||||||||||||||||||
Post Oak Central (5) | 100.0 | % | 4.26 | % | 10/1/20 | 885 | 3,636 | 3,794 | 3,959 | 166,896 | — | 179,170 | (699 | ) | 178,471 | — | |||||||||||||||||||||||||||||||
Promenade | 100.0 | % | 4.27 | % | 10/1/22 | 727 | 2,986 | 3,116 | 3,252 | 3,394 | 92,593 | 106,068 | (353 | ) | 105,715 | — | |||||||||||||||||||||||||||||||
816 Congress | 100.0 | % | 3.75 | % | 11/1/24 | 128 | 1,568 | 1,628 | 1,690 | 1,754 | 78,232 | 85,000 | (665 | ) | 84,335 | — | |||||||||||||||||||||||||||||||
Colorado Tower | 100.00 | % | 3.45 | % | 9/1/26 | — | — | 573 | 2,343 | 2,425 | 114,659 | 120,000 | (955 | ) | 119,045 | — | |||||||||||||||||||||||||||||||
Fifth Third Center | 100.00 | % | 3.37 | % | 10/1/26 | 484 | 2,959 | 3,061 | 3,166 | 3,274 | 137,056 | 150,000 | (635 | ) | 149,365 | — | |||||||||||||||||||||||||||||||
Total Fixed Rate Debt | 3,315 | 141,154 | 109,368 | 14,956 | 200,721 | 422,540 | 892,054 | (3,676 | ) | 888,378 | — | ||||||||||||||||||||||||||||||||||||
Total Consolidated Debt | 3,315 | 141,154 | 109,368 | 14,956 | 200,721 | 422,540 | 892,054 | (3,676 | ) | 888,378 | — | ||||||||||||||||||||||||||||||||||||
Unconsolidated Debt (6) | |||||||||||||||||||||||||||||||||||||||||||||||
Floating Rate Debt | |||||||||||||||||||||||||||||||||||||||||||||||
Emory Point I (LIBOR + 1.75%) (7) | 75.0 | % | 2.28 | % | 4/9/17 | — | 43,522 | — | — | — | — | 43,522 | (12 | ) | 43,510 | — | |||||||||||||||||||||||||||||||
Emory Point II (LIBOR + 1.85%, $46mm facility) (7) | 75.0 | % | 2.38 | % | 4/9/17 | — | 33,552 | — | — | — | — | 33,552 | — | 33,552 | 3,355 | ||||||||||||||||||||||||||||||||
Carolina Square (LIBOR + 1.90%, $79.755mm facility) | 50.0 | % | 2.43 | % | 5/1/18 | — | — | 4,644 | — | — | — | 4,644 | — | 4,644 | 1,161 | ||||||||||||||||||||||||||||||||
Total Floating Rate Debt | — | 77,074 | 4,644 | — | — | — | 81,718 | (12 | ) | 81,706 | 4,516 | ||||||||||||||||||||||||||||||||||||
Fixed Rate Debt | |||||||||||||||||||||||||||||||||||||||||||||||
Gateway Village (8) | 50.0 | % | 6.41 | % | 12/1/16 | 1,633 | — | — | — | — | — | 1,633 | — | 1,633 | — | ||||||||||||||||||||||||||||||||
Terminus 100 | 50.0 | % | 5.25 | % | 1/1/23 | 326 | 1,346 | 1,418 | 1,494 | 1,575 | 57,498 | 63,656 | (80 | ) | 63,576 | — | |||||||||||||||||||||||||||||||
Terminus 200 | 50.0 | % | 3.79 | % | 1/1/23 | 188 | 770 | 800 | 831 | 863 | 37,177 | 40,629 | (35 | ) | 40,594 | — | |||||||||||||||||||||||||||||||
Emory University Hospital Midtown Medical Office Tower | 50.0 | % | 3.50 | % | 6/1/23 | 185 | 758 | 785 | 813 | 842 | 33,211 | 36,594 | (159 | ) | 36,435 | — | |||||||||||||||||||||||||||||||
Total Fixed Rate Debt | 2,332 | 2,874 | 3,003 | 3,138 | 3,280 | 127,886 | 142,512 | (274 | ) | 142,238 | — | ||||||||||||||||||||||||||||||||||||
Total Unconsolidated Debt | 2,332 | 79,948 | 7,647 | 3,138 | 3,280 | 127,886 | 224,230 | (286 | ) | 223,944 | 4,516 | ||||||||||||||||||||||||||||||||||||
Total Debt | $ | 5,647 | $ | 221,102 | $ | 117,015 | $ | 18,094 | $ | 204,001 | $ | 550,426 | $ | 1,116,284 | $ | (3,962 | ) | $ | 1,112,322 | $ | 4,516 | ||||||||||||||||||||||||||
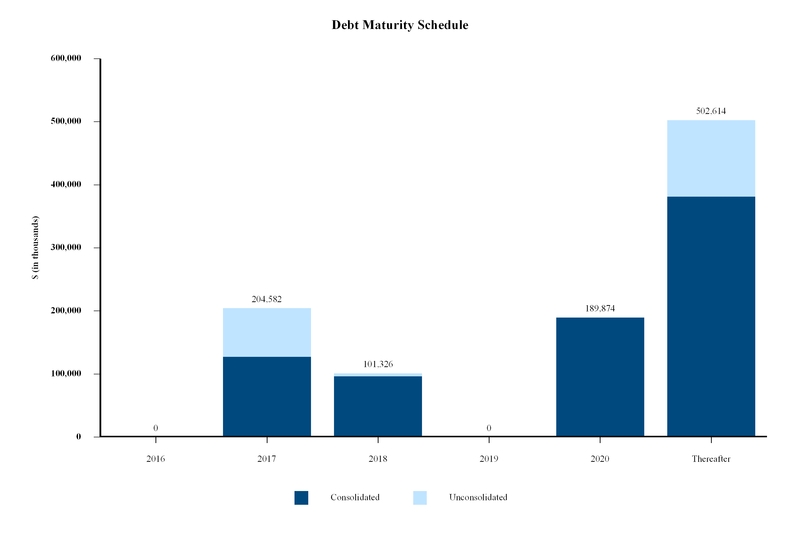
Total Maturities (9) | $ | — | $ | 204,582 | $ | 101,326 | $ | — | $ | 189,874 | $ | 502,614 | $ | 998,396 | |||||||||||||||||||||||||||||||||
% of Maturities | —% | 21% | 10% | —% | 19% | 50% | 100% | ||||||||||||||||||||||||||||||||||||||||
Floating and Fixed Rate Debt Analysis
Total Debt ($) | Total Debt (%) | Weighted Average Interest Rate | Weighted Average Maturity (Yrs.) | ||||||||||
Floating Rate Debt | $ | 81,718 | 7 | % | 2.33 | % | 0.4 | ||||||
Fixed Rate Debt | 1,034,566 | 93 | % | 4.24 | % | 6.1 | |||||||
Total Debt | $ | 1,116,284 | 100 | % | 4.10 | % | 5.7 | ||||||
(1) A new accounting standard was adopted in the first quarter of 2016 that requires deferred loan costs of mortgage debt to be recorded as a reduction from notes payable on the balance sheet. This standard does not apply to revolving credit facilities and such costs related to credit facilities continue to be recorded in other assets on the balance sheet.
(2) Non-recourse loans are subject to customary carve-outs.
(3) The spread over LIBOR at September 30, 2016 was 1.10%.
(4) The real estate and other assets of this property are restricted under a loan agreement such that these assets are not available to settle other debts of the Company.
(5) In connection with the Spin-Off, the Company distributed the Post Oak Central loan to Parkway, Inc. on October 7, 2016.
(6) Unconsolidated debt represents debt at the unconsolidated joint ventures indicated multiplied by the Company's ownership interest. The Company does not control the operations of these joint ventures, but believes that presenting the Company's share of unconsolidated joint venture debt is meaningful to investors and analysts.
(7) The Emory Point I and Emory Point II loans each have a six month extension option followed by a one year extension option, if certain conditions are met.
(8) Based on the structure of the venture and the nature of the related debt, the Company excludes the Gateway Village debt in certain of its leverage calculations.
(9) Maturities include lump sum principal payments due at the maturity date. Maturities do not include scheduled principal payments due prior to the maturity date.
Cousins Properties Incorporated | 23 | Q3 2016 Supplemental Information |
DEBT SCHEDULE | ||
Cousins Properties Incorporated | 24 | Q3 2016 Supplemental Information |
NON-GAAP FINANCIAL MEASURES - CALCULATIONS AND RECONCILIATIONS | ||
2014 | 2015 1st | 2015 2nd | 2015 3rd | 2015 4th | 2015 | 2016 1st | 2016 2nd | 2016 3rd | 2016 YTD | |||||||||||
Net Operating Income | ||||||||||||||||||||
Office Consolidated Properties | 186,593 | 52,103 | 54,780 | 54,685 | 55,152 | 216,720 | 52,844 | 52,062 | 54,860 | 159,766 | ||||||||||
Other Consolidated Properties | 1,385 | (24 | ) | 10 | — | 205 | 191 | 23 | (8 | ) | 1 | 16 | ||||||||
Net Operating Income - Consolidated | 187,978 | 52,079 | 54,790 | 54,685 | 55,357 | 216,911 | 52,867 | 52,054 | 54,861 | 159,782 | ||||||||||
Rental Property Revenues | 343,910 | 90,033 | 96,177 | 96,016 | 90,842 | 373,068 | 88,476 | 90,735 | 92,621 | 271,832 | ||||||||||
Rental Property Operating Expenses | (155,934 | ) | (37,954 | ) | (41,387 | ) | (41,331 | ) | (35,485 | ) | (156,157 | ) | (35,609 | ) | (38,681 | ) | (37,760 | ) | (112,050 | ) |
Net Operating Income - Consolidated | 187,976 | 52,079 | 54,790 | 54,685 | 55,357 | 216,911 | 52,867 | 52,054 | 54,861 | 159,782 | ||||||||||
Income from Discontinued Operations | ||||||||||||||||||||
Rental Property Revenues | 2,927 | 4 | — | — | — | 4 | — | — | — | — | ||||||||||
Rental Property Operating Expenses | (1,128 | ) | (18 | ) | — | — | — | (18 | ) | — | — | — | — | |||||||
Net Operating Income | 1,799 | (14 | ) | — | — | — | (14 | ) | — | — | — | — | ||||||||
Termination Fees | 2 | — | — | — | — | — | — | — | — | — | ||||||||||
Interest and Other Income (Expense) | 3 | — | (6 | ) | 6 | (21 | ) | (21 | ) | — | — | — | — | |||||||
FFO from Discontinued Operations | 1,804 | (14 | ) | (6 | ) | 6 | (21 | ) | (35 | ) | — | — | — | — | ||||||
Third Party Management and Leasing Revenues | — | — | — | — | — | — | — | — | — | — | ||||||||||
Third Party Management and Leasing Expenses | (2 | ) | — | — | — | — | — | — | — | — | — | |||||||||
FFO from Third Party Management and Leasing | (2 | ) | — | — | — | — | — | — | — | — | — | |||||||||
FFO from Discontinued Operations | 1,802 | (14 | ) | (6 | ) | 6 | (21 | ) | (35 | ) | — | — | — | — | ||||||
Depreciation and Amortization of Real Estate | — | — | — | — | — | — | — | — | — | — | ||||||||||
Income from Discontinued Operations | 1,802 | (14 | ) | (6 | ) | 6 | (21 | ) | (35 | ) | — | — | — | — | ||||||
FFO and EBITDA | ||||||||||||||||||||
Net income | 45,519 | 7,203 | 7,951 | 53,620 | 56,744 | 125,518 | 22,796 | 7,765 | 11,657 | 42,218 | ||||||||||
Depreciation and amortization of real estate assets: | ||||||||||||||||||||
Consolidated properties | 139,151 | 35,724 | 34,505 | 32,123 | 31,442 | 133,796 | 31,592 | 32,046 | 31,514 | 95,152 | ||||||||||
Share of unconsolidated joint ventures | 11,915 | 2,743 | 2,772 | 2,891 | 3,239 | 11,645 | 3,259 | 3,231 | 3,268 | 9,758 | ||||||||||
(Gain) loss on sale of depreciated properties: | ||||||||||||||||||||
Consolidated properties | (30,188 | ) | (286 | ) | 10 | (36,167 | ) | (42,316 | ) | (78,210 | ) | (14,190 | ) | 246 | — | (13,944 | ) | |||
Discontinued properties | (1,767 | ) | 551 | — | — | — | — | — | — | — | — | |||||||||
Non-controlling interest related to the sale of depreciated properties | 574 | — | — | — | — | — | — | — | — | — | ||||||||||
FFO | 165,204 | 45,935 | 45,238 | 52,467 | 49,109 | 192,749 | 43,457 | 43,288 | 46,439 | 133,184 | ||||||||||
Interest Expense | 36,474 | 9,498 | 9,696 | 9,518 | 9,466 | 38,178 | 9,421 | 9,359 | 9,748 | 28,528 | ||||||||||
Non-Real Estate Depreciation and Amortization | 913 | 423 | 374 | 414 | 410 | 1,621 | 377 | 335 | 328 | 1,040 | ||||||||||
Income Tax Provision (Benefit) | (20 | ) | — | — | — | — | — | — | — | — | — | |||||||||
Gain on Sale of Third Party Management & Leasing Business | 3 | — | — | — | — | — | — | — | — | — | ||||||||||
Acquisition and Merger Costs | 1,130 | 83 | 2 | 19 | 195 | 299 | 19 | 2,424 | 1,940 | 4,383 | ||||||||||
Preferred Stock Dividends and Original Issuance Costs | 6,485 | — | — | — | — | — | — | — | — | — | ||||||||||
EBITDA (2) | 210,189 | 55,939 | 55,310 | 62,418 | 59,180 | 232,847 | 53,274 | 55,406 | 58,455 | 167,135 | ||||||||||
Cousins Properties Incorporated | 25 | Q3 2016 Supplemental Information |
NON-GAAP FINANCIAL MEASURES - CALCULATIONS AND RECONCILIATIONS | ||
2014 | 2015 1st | 2015 2nd | 2015 3rd | 2015 4th | 2015 | 2016 1st | 2016 2nd | 2016 3rd | 2016 YTD | |||||||||||
Income (Loss) from Unconsolidated Joint Ventures | ||||||||||||||||||||
Net Operating Income | ||||||||||||||||||||
Office Properties | 18,176 | 4,642 | 4,489 | 4,644 | 4,726 | 18,501 | 5,049 | 5,213 | 5,013 | 15,275 | ||||||||||
Other Properties | 7,720 | 1,346 | 1,495 | 1,487 | 1,506 | 5,834 | 1,597 | 1,741 | 1,747 | 5,085 | ||||||||||
Net Operating Income | 25,896 | 5,988 | 5,984 | 6,131 | 6,232 | 24,335 | 6,646 | 6,954 | 6,760 | 20,360 | ||||||||||
Sales Less Cost of Sales | 2,207 | — | 242 | 2,038 | — | 2,280 | — | — | — | — | ||||||||||
Termination Fees | 185 | 120 | 28 | 271 | — | 419 | — | — | — | — | ||||||||||
Interest Expense | (7,364 | ) | (1,822 | ) | (1,827 | ) | (1,845 | ) | (1,961 | ) | (7,455 | ) | (2,007 | ) | (2,026 | ) | (2,038 | ) | (6,071 | ) |
Other Income/(Expense) | 536 | 68 | 106 | 12 | 182 | 368 | 454 | 87 | 72 | 613 | ||||||||||
Depreciation and Amortization of Non-Real Estate Assets | (46 | ) | — | — | — | — | — | — | — | — | — | |||||||||
Funds from Operations - Unconsolidated Joint Ventures | 21,414 | 4,354 | 4,533 | 6,607 | 4,453 | 19,947 | 5,093 | 5,015 | 4,794 | 14,902 | ||||||||||
Gain on Sale of Depreciated Investment Properties, net | 1,767 | — | — | — | — | — | — | — | — | — | ||||||||||
Depreciation and Amortization of Real Estate | (11,913 | ) | (2,743 | ) | (2,772 | ) | (2,891 | ) | (3,239 | ) | (11,645 | ) | (3,259 | ) | (3,231 | ) | (3,268 | ) | (9,758 | ) |
Net Income from Unconsolidated Joint Ventures | 11,268 | 1,611 | 1,761 | 3,716 | 1,214 | 8,302 | 1,834 | 1,784 | 1,526 | 5,144 | ||||||||||
Market Capitalization | ||||||||||||||||||||
Common Stock price at Period End | 11.42 | 10.60 | 10.38 | 9.22 | 9.43 | 9.43 | 10.38 | 10.40 | 10.44 | 10.44 | ||||||||||
Number of Common Shares Outstanding at Period End | 216,513 | 216,470 | 216,686 | 214,671 | 211,513 | 211,513 | 210,107 | 210,171 | 210,170 | 210,170 | ||||||||||
Common Stock Capitalization | 2,472,578 | 2,294,582 | 2,249,201 | 1,979,267 | 1,994,568 | 1,994,568 | 2,180,911 | 2,185,778 | 2,194,175 | 2,194,175 | ||||||||||
Preferred Stock Series B Price at Liquidation Value | — | — | — | — | — | — | — | — | — | — | ||||||||||
Preferred Stock at Liquidation Value | — | — | — | — | — | — | — | — | — | — | ||||||||||
Debt | 792,344 | 847,948 | 849,772 | 779,570 | 721,293 | 721,293 | 767,811 | 777,485 | 888,378 | 888,378 | ||||||||||
Share of Unconsolidated Debt | 215,158 | 219,428 | 225,241 | 227,194 | 225,724 | 225,724 | 224,430 | 222,514 | 223,944 | 223,944 | ||||||||||
Debt (2) | 1,007,502 | 1,067,376 | 1,075,013 | 1,006,764 | 947,017 | 947,017 | 992,241 | 999,999 | 1,112,322 | 1,112,322 | ||||||||||
Total Market Capitalization | 3,480,080 | 3,361,958 | 3,324,214 | 2,986,031 | 2,941,585 | 2,941,585 | 3,173,152 | 3,185,777 | 3,306,497 | 3,306,497 | ||||||||||
Credit Ratios | ||||||||||||||||||||
Debt (2) | 1,007,502 | 1,067,376 | 1,075,013 | 1,006,764 | 947,017 | 947,017 | 992,241 | 999,999 | 1,112,322 | 1,112,322 | ||||||||||
Total Market Capitalization | 3,480,080 | 3,361,958 | 3,324,214 | 2,986,031 | 2,941,585 | 2,941,585 | 3,173,152 | 3,185,777 | 3,306,497 | 3,306,497 | ||||||||||
Debt (2) / Total Market Capitalization | 29.0 | % | 31.7 | % | 32.3 | % | 33.7 | % | 32.2 | % | 32.2 | % | 31.3 | % | 31.4 | % | 33.6 | % | 33.6 | % |
Total Assets - Consolidated | 2,667,330 | 2,684,661 | 2,685,466 | 2,635,397 | 2,597,803 | 2,597,803 | 2,610,408 | 2,622,995 | 2,760,734 | 2,760,734 | ||||||||||
Accumulated Depreciation - Consolidated | 400,593 | 435,939 | 470,360 | 542,084 | 463,008 | 463,008 | 486,747 | 519,075 | 539,719 | 539,719 | ||||||||||
Undepreciated Assets - Unconsolidated (2) | 450,535 | 454,835 | 466,438 | 482,606 | 486,941 | 486,941 | 460,516 | 504,408 | 507,611 | 507,611 | ||||||||||
Less: Investment in Unconsolidated Joint Ventures | (100,498 | ) | (100,821 | ) | (103,665 | ) | (103,470 | ) | (102,577 | ) | (102,577 | ) | (110,138 | ) | (114,455 | ) | (116,933 | ) | (116,933 | ) |
Total Undepreciated Assets (2) | 3,417,960 | 3,474,614 | 3,518,599 | 3,556,617 | 3,445,175 | 3,445,175 | 3,447,533 | 3,532,023 | 3,691,131 | 3,691,131 | ||||||||||
Debt (2) | 1,007,502 | 1,067,376 | 1,075,013 | 1,006,764 | 947,017 | 947,017 | 992,241 | 999,999 | 1,112,322 | 1,112,322 | ||||||||||
Undepreciated Assets (2) | 3,417,960 | 3,474,614 | 3,518,599 | 3,556,617 | 3,445,175 | 3,445,175 | 3,447,533 | 3,532,023 | 3,691,131 | 3,691,131 | ||||||||||
Debt (2) / Total Undepreciated Assets (2) | 29.5 | % | 30.7 | % | 30.6 | % | 28.3 | % | 27.5 | % | 27.5 | % | 28.8 | % | 28.3 | % | 30.1 | % | 30.1 | % |
Cousins Properties Incorporated | 26 | Q3 2016 Supplemental Information |
NON-GAAP FINANCIAL MEASURES - CALCULATIONS AND RECONCILIATIONS | ||
2014 | 2015 1st | 2015 2nd | 2015 3rd | 2015 4th | 2015 | 2016 1st | 2016 2nd | 2016 3rd | 2016 YTD | |||||||||||
Coverage Ratios (2) | ||||||||||||||||||||
Interest Expense | 36,474 | 9,498 | 9,696 | 9,518 | 9,466 | 38,178 | 9,421 | 9,359 | 9,748 | 28,528 | ||||||||||
Scheduled Principal Payments | 9,836 | 2,493 | 2,477 | 2,507 | 2,415 | 9,892 | 2,444 | 3,143 | 3,344 | 8,931 | ||||||||||
Preferred Stock Dividends | 2,955 | — | — | — | — | — | — | — | — | — | ||||||||||
Fixed Charges | 49,265 | 11,991 | 12,173 | 12,025 | 11,881 | 48,070 | 11,865 | 12,502 | 13,092 | 37,459 | ||||||||||
EBITDA | 210,189 | 55,939 | 55,310 | 62,418 | 59,180 | 232,847 | 53,274 | 55,406 | 58,455 | 167,135 | ||||||||||
Fixed Charges Coverage Ratio (2) | 4.27 | 4.67 | 4.54 | 5.19 | 4.98 | 4.84 | 4.49 | 4.43 | 4.46 | 4.46 | ||||||||||
Debt (2) | 1,007,502 | 1,067,376 | 1,075,013 | 1,006,764 | 947,017 | 947,017 | 992,241 | 999,999 | 1,112,322 | 1,112,322 | ||||||||||
Annualized EBITDA (3) | 248,556 | 223,756 | 221,240 | 250,260 | 236,720 | 236,720 | 213,096 | 221,624 | 233,820 | 233,820 | ||||||||||
Debt (2) / Annualized EBITDA (3) | 4.05 | 4.77 | 4.86 | 4.02 | 4.00 | 4.00 | 4.66 | 4.51 | 4.76 | 4.76 | ||||||||||
Dividend Information | ||||||||||||||||||||
Cash Common Dividends | 61,563 | 17,349 | 17,328 | 17,334 | 17,185 | 69,196 | 16,918 | 16,810 | 16,821 | 50,549 | ||||||||||
FFO | 165,204 | 45,935 | 45,238 | 52,467 | 49,109 | 192,749 | 43,457 | 43,288 | 46,439 | 133,184 | ||||||||||
FFO Payout Ratio | 37.3 | % | 37.8 | % | 38.3 | % | 33.0 | % | 35.0 | % | 35.9 | % | 38.9 | % | 38.8 | % | 36.2 | % | 38.0 | % |
FFO | 165,204 | 45,935 | 45,238 | 52,467 | 49,109 | 192,749 | 43,457 | 43,288 | 46,439 | 133,184 | ||||||||||
Straight Line Rental Revenue | (22,093 | ) | (6,285 | ) | (5,786 | ) | (4,623 | ) | (3,315 | ) | (20,009 | ) | (3,595 | ) | (3,434 | ) | (3,449 | ) | (10,478 | ) |
Above and Below Market Rents | (8,047 | ) | (2,030 | ) | (1,973 | ) | (2,030 | ) | (1,948 | ) | (7,981 | ) | (1,834 | ) | (1,854 | ) | (1,907 | ) | (5,595 | ) |
Second Generation CAPEX | (35,054 | ) | (12,139 | ) | (13,259 | ) | (14,208 | ) | (14,608 | ) | (54,214 | ) | (7,904 | ) | (13,166 | ) | (13,968 | ) | (35,038 | ) |
Deferred Income - Tenant Improvements | — | — | — | — | (48 | ) | (48 | ) | (280 | ) | (488 | ) | (564 | ) | (1,332 | ) | ||||
FAD (2) | 100,010 | 25,481 | 24,220 | 31,606 | 29,190 | 110,497 | 29,844 | 24,346 | 26,551 | 80,741 | ||||||||||
Common Dividends | 61,563 | 17,349 | 17,328 | 17,334 | 17,185 | 69,196 | 16,918 | 16,810 | 16,821 | 50,549 | ||||||||||
FAD Payout Ratio (2) | 61.6 | % | 68.1 | % | 71.5 | % | 54.8 | % | 58.9 | % | 62.6 | % | 56.7 | % | 69.0 | % | 63.4 | % | 62.6 | % |
Operations Ratios | ||||||||||||||||||||
Total Undepreciated Assets (2) | 3,417,960 | 3,474,614 | 3,518,599 | 3,556,617 | 3,445,175 | 3,445,175 | 3,447,533 | 3,532,023 | 3,691,131 | 3,691,131 | ||||||||||
General and Administrative Expenses | 19,787 | 3,595 | 5,936 | 2,971 | 4,597 | 17,099 | 8,492 | 4,691 | 4,368 | 17,551 | ||||||||||
Annualized General and Administrative Expenses (4) / Total Undepreciated Assets | 0.58 | % | 0.41 | % | 0.67 | % | 0.33 | % | 0.53 | % | 0.50 | % | 0.99 | % | 0.53 | % | 0.47 | % | 0.63 | % |
2nd Generation TI & Leasing Costs & Building CAPEX | ||||||||||||||||||||
Second Generation Leasing Related Costs | 31,187 | 11,632 | 12,294 | 10,941 | 11,954 | 46,821 | 4,867 | 10,356 | 7,992 | 23,215 | ||||||||||
Second Generation Building Improvements | 3,867 | 507 | 965 | 3,267 | 2,654 | 7,393 | 3,037 | 2,810 | 5,976 | 11,823 | ||||||||||
35,054 | 12,139 | 13,259 | 14,208 | 14,608 | 54,214 | 7,904 | 13,166 | 13,968 | 35,038 | |||||||||||
Cousins Properties Incorporated | 27 | Q3 2016 Supplemental Information |
NON-GAAP FINANCIAL MEASURES - CALCULATIONS AND RECONCILIATIONS | ||
(in thousands) | Three Months Ended | Nine Months Ended | ||||||||||||||||||
September 30, 2016 | September 30, 2015 | June 30, 2016 | September 30, 2016 | September 30, 2015 | ||||||||||||||||
Rental Property Revenues | ||||||||||||||||||||
Same Property | $ | 79,141 | $ | 77,637 | $ | 76,561 | $ | 231,078 | $ | 227,781 | ||||||||||
Non-Same Property | 24,005 | 28,119 | 24,421 | 71,790 | 82,203 | |||||||||||||||
$ | 103,146 | $ | 105,756 | $ | 100,982 | $ | 302,868 | $ | 309,984 | |||||||||||
Rental Property Operating Expenses | ||||||||||||||||||||
Same Property | $ | 33,233 | $ | 33,315 | $ | 32,400 | $ | 96,231 | $ | 96,981 | ||||||||||
Non-Same Property | 8,292 | 11,625 | 9,574 | 26,495 | 33,360 | |||||||||||||||
$ | 41,525 | $ | 44,940 | $ | 41,974 | $ | 122,726 | $ | 130,341 | |||||||||||
Rental Property Revenues | ||||||||||||||||||||
Consolidated Properties | $ | 92,621 | $ | 96,016 | $ | 90,735 | $ | 271,832 | $ | 282,226 | ||||||||||
Discontinued Operations | — | — | — | — | 4 | |||||||||||||||
Share of Unconsolidated Joint Ventures | 10,525 | 9,740 | 10,247 | 31,036 | 27,754 | |||||||||||||||
$ | 103,146 | $ | 105,756 | $ | 100,982 | $ | 302,868 | $ | 309,984 | |||||||||||
Rental Property Operating Expenses | ||||||||||||||||||||
Consolidated Properties | $ | 37,760 | $ | 41,331 | $ | 38,681 | $ | 112,050 | $ | 120,672 | ||||||||||
Discontinued Operations | — | — | — | — | 17 | |||||||||||||||
Share of Unconsolidated Joint Ventures | 3,765 | 3,609 | 3,293 | 10,676 | 9,652 | |||||||||||||||
$ | 41,525 | $ | 44,940 | $ | 41,974 | $ | 122,726 | $ | 130,341 | |||||||||||
Cash Basis Rental Property Revenues | ||||||||||||||||||||
Rental Property Revenues | $ | 103,147 | $ | 105,756 | $ | 100,981 | $ | 302,869 | $ | 309,984 | ||||||||||
Less: Straight Line Rent | 3,449 | 4,623 | 3,434 | 16,694 | 10,479 | |||||||||||||||
Less: Non-cash Income | 2,097 | 1,526 | 1,843 | 4,518 | 5,613 | |||||||||||||||
$ | 97,601 | $ | 99,607 | $ | 95,704 | $ | 281,657 | $ | 293,892 | |||||||||||
Cash Basis Rental Property Revenues | ||||||||||||||||||||
Same Property | $ | 75,524 | $ | 73,831 | $ | 73,368 | $ | 221,117 | $ | 215,253 | ||||||||||
Non-Same Property | 22,077 | 25,776 | 22,336 | 60,540 | 78,639 | |||||||||||||||
$ | 97,601 | $ | 99,607 | $ | 95,704 | $ | 281,657 | $ | 293,892 | |||||||||||
Cash Basis Rental Property Operating Expenses | ||||||||||||||||||||
Rental Property Operating Expenses | $ | 41,525 | $ | 44,940 | $ | 41,974 | $ | 122,726 | $ | 130,341 | ||||||||||
Non-Cash Expense | 16 | — | 16 | 46 | (59 | ) | ||||||||||||||
$ | 41,541 | $ | 44,940 | $ | 41,990 | $ | 122,772 | $ | 130,282 | |||||||||||
Cash Basis Rental Property Operating Expenses | ||||||||||||||||||||
Same Property | $ | 33,248 | $ | 33,313 | $ | 32,415 | $ | 96,272 | $ | 97,012 | ||||||||||
Non-Same Property | 8,293 | 11,627 | 9,575 | 26,500 | 33,270 | |||||||||||||||
$ | 41,541 | $ | 44,940 | $ | 41,990 | $ | 122,772 | $ | 130,282 | |||||||||||
Cousins Properties Incorporated | 28 | Q3 2016 Supplemental Information |
NON-GAAP FINANCIAL MEASURES - CALCULATIONS AND RECONCILIATIONS | ||
Three Months Ended | Nine Months Ended | |||||||||||||||||||
September 30, 2016 | September 30, 2015 | June 30, 2016 | September 30, 2016 | September 30, 2015 | ||||||||||||||||
Net Income | $ | 11,657 | $ | 53,620 | $ | 7,765 | $ | 42,218 | $ | 68,774 | ||||||||||
Net operating income from unconsolidated joint ventures | 6,760 | 6,131 | 6,954 | 20,361 | 18,103 | |||||||||||||||
Net operating loss from discontinued operations | — | — | — | — | (14 | ) | ||||||||||||||
Fee income | (1,945 | ) | (1,686 | ) | (1,824 | ) | (5,968 | ) | (5,206 | ) | ||||||||||
Other income | (153 | ) | (444 | ) | (129 | ) | (858 | ) | (593 | ) | ||||||||||
Reimbursed expenses | 795 | 686 | 798 | 2,463 | 2,514 | |||||||||||||||
General and administrative expenses | 4,368 | 2,976 | 4,691 | 17,301 | 12,405 | |||||||||||||||
Interest expense | 7,710 | 7,673 | 7,334 | 22,457 | 23,219 | |||||||||||||||
Depreciation and amortization | 31,843 | 32,538 | 32,381 | 96,192 | 103,564 | |||||||||||||||
Acquisition and merger costs | 1,940 | 19 | 2,424 | 4,383 | 104 | |||||||||||||||
Other expenses | 173 | 170 | 152 | 681 | 970 | |||||||||||||||
Income from unconsolidated joint ventures | (1,527 | ) | (3,716 | ) | (1,784 | ) | (5,144 | ) | (7,088 | ) | ||||||||||
Gain on sale of investment properties | — | (37,145 | ) | — | (13,944 | ) | (37,674 | ) | ||||||||||||
Income (loss) from discontinued operations | — | (6 | ) | 246 | — | 565 | ||||||||||||||
Net Operating Income | $ | 61,621 | $ | 60,816 | $ | 59,008 | $ | 180,142 | $ | 179,643 | ||||||||||
Net Operating Income | ||||||||||||||||||||
Same Property | $ | 45,908 | $ | 44,322 | $ | 44,161 | $ | 134,847 | $ | 130,800 | ||||||||||
Non-Same Property | 15,713 | 16,494 | 14,847 | 45,295 | 48,843 | |||||||||||||||
$ | 61,621 | $ | 60,816 | $ | 59,008 | $ | 180,142 | $ | 179,643 | |||||||||||
(1) Amounts may differ slightly from other schedules contained herein due to rounding. | ||||||||||||||||||||
(2) Includes Company share of unconsolidated joint ventures. These amounts are derived from the amounts in the categories indicated that are recorded at the joint venture multiplied by the Company's ownership interest. The Company does not control the operations of the unconsolidated joint ventures, but believes that including these amounts in the categories indicated is meaningful to investors and analysts. | ||||||||||||||||||||
(3) Annualized equals quarter amount annualized. | ||||||||||||||||||||
(4) Quarter amount represents quarter annualized, year-to-date represents year-to-date actual. | ||||||||||||||||||||
Cousins Properties Incorporated | 29 | Q3 2016 Supplemental Information |
NON-GAAP FINANCIAL MEASURES - DISCUSSION | ||
The Company uses non-GAAP financial measures in its filings and other public disclosures. The following is a list of non-GAAP financial measures that the Company commonly uses and a description for each measure of (1) the reasons that management believes the measure is useful to investors and (2) if material, any additional uses of the measure by management of the Company. “2nd Generation Tenant Improvements and Leasing Costs and Building Capital Expenditures” is used in the valuation and analysis of real estate. Because the Company develops and acquires properties, in addition to operating existing properties, its property acquisition and development expenditures included in the Statements of Cash Flows includes both initial costs associated with developing and acquiring investment assets and those expenditures necessary for operating and maintaining existing properties at historic performance levels. The latter costs are referred to as second generation costs and are useful in evaluating the economic performance of the asset and in valuing the asset. Accordingly, the Company discloses the portion of its property acquisition and development expenditures that pertain to second generation space in its operating properties. The Company excludes from second generation costs amounts incurred to lease vacant space and other building improvements associated with properties acquired for redevelopment or repositioning. “Cash Basis Net Operating Income” represents Net Operating Income excluding straight-line rents, amortization of lease inducements, amortization of acquired above and below market rents, and non-cash ground lease expense. “EBITDA” represents FFO plus consolidated and Company share of unconsolidated interest expense, non-real estate depreciation and amortization, income taxes, impairment losses, predevelopment charges, loss on debt extinguishment, gain on sale of third party business, participation interest income, acquisition and merger costs, and preferred stock dividends and original issuance costs. Management believes that EBITDA provides analysts and investors with appropriate information to use in various ratios that evaluate the Company's level of debt. "Funds Available for Distribution” (“FAD”) represents FFO adjusted to exclude the effect of straight-line rent and above and below market lease amortization less 2nd Generation Tenant Improvements and Leasing Costs and Building Capital Expenditures. Management believes that FAD provides analysts and investors with information that assists in the comparability of the Company's dividend policy with other real estate companies. “FAD Before Certain Charges” represents FAD before preferred share issuance costs write off, non-depreciable impairment losses, predevelopment and other charges, loss on debt extinguishment, acquisition and merger costs, gain on sale of third party business, participation interest income and separation charges. Management believes that FAD Before Certain Charges provides analysts and investors with appropriate information related to the Company's core operations and for comparability of the results of its operations and dividend policy with other real estate companies. “Funds From Operations Available to Common Stockholders” (“FFO”) is a supplemental operating performance measure used in the real estate industry. The Company calculates FFO in accordance with the National Association of Real Estate Investment Trusts' (“NAREIT”) definition, which is net income (loss) available to common | stockholders (computed in accordance with accounting principles generally accepted in the United States (“GAAP”)), excluding extraordinary items, cumulative effect of change in accounting principle and gains or losses from sales of depreciable real property, plus depreciation and amortization of real estate assets, impairment losses on depreciable investment property and after adjustments for unconsolidated partnerships and joint ventures to reflect FFO on the same basis. FFO is used by industry analysts and investors as a supplemental measure of an equity REIT's operating performance. Historical cost accounting for real estate assets implicitly assumes that the value of real estate assets diminishes predictably over time. Since real estate values instead have historically risen or fallen with market conditions, many industry investors and analysts have considered presentation of operating results for real estate companies that use historical cost accounting to be insufficient by themselves. Thus, NAREIT created FFO as a supplemental measure of REIT operating performance that excludes historical cost depreciation, among other items, from GAAP net income. Management believes that the use of FFO, combined with the required primary GAAP presentations, has been fundamentally beneficial, improving the understanding of operating results of REITs among the investing public and making comparisons of REIT operating results more meaningful. Company management evaluates operating performance in part based on FFO. Additionally, the Company uses FFO and FFO per share, along with other measures, as a performance measure for incentive compensation to its officers and other key employees. “FFO Before Certain Charges” represents FFO before preferred share issuance costs write off, non-depreciable impairment losses, predevelopment and other charges, loss on debt extinguishment, acquisition and merger costs, gain on sale of third party business, participation interest income and separation charges. Management believes that FFO Before Certain Charges provides analysts and investors with appropriate information related to the Company's core operations and for comparability of the results of its operations with other real estate companies. “Net Operating Income” is used by industry analysts, investors and Company management to measure operating performance of the Company's properties. Net Operating Income, which is rental property revenues less rental property operating expenses, excludes certain components from net income in order to provide results that are more closely related to a property's results of operations. Certain items, such as interest expense, while included in FFO and net income, do not affect the operating performance of a real estate asset and are often incurred at the corporate level as opposed to the property level. As a result, management uses only those income and expense items that are incurred at the property level to evaluate a property's performance. Depreciation and amortization are also excluded from Net Operating Income for the reasons described under FFO above. “Same Property Net Operating Income” represents Net Operating Income or Cash Basis Net Operating Income for those office properties that have been fully operational in each of the comparable reporting periods. A fully operational property is one that achieved 90% economic occupancy for each of the two periods presented or has been substantially complete and owned by the Company for each of the two periods presented and the preceding year. Same-Property Net Operating Income or Cash Basis Same Property Net Operating Income allows analysts, investors and management to analyze continuing operations and evaluate the growth trend of the Company's portfolio. | |
Cousins Properties Incorporated | 30 | Q3 2016 Supplemental Information |
LEGACY PARKWAY PROPERTIES, INC. PORTFOLIO STATISTICS (1) |
Property Description | Metropolitan Area | Rentable Square Feet | Financial Statement Presentation | Company's Ownership Interest | End of Period Leased 3Q16 | End of Period Occupied 3Q16 | Property Level Debt ($000) (2) | |||||||||||||
Office | ||||||||||||||||||||
Corporate Center (3) | Tampa | 1,224,000 | Consolidated | 100 | % | 84.7 | % | 81.4 | % | 34,629 | ||||||||||
Bank of America Center | Orlando | 421,000 | Consolidated | 100 | % | 90.5 | % | 90.5 | % | — | ||||||||||
One Orlando Centre | Orlando | 356,000 | Consolidated | 100 | % | 76.0 | % | 73.1 | % | — | ||||||||||
Courvoisier Centre (3) | Miami | 343,000 | Unconsolidated | 20 | % | 85.4 | % | 84.2 | % | 21,300 | ||||||||||
Citrus Center | Orlando | 261,000 | Consolidated | 100 | % | 94.4 | % | 91.7 | % | 20,213 | ||||||||||
The Pointe | Tampa | 253,000 | Consolidated | 100 | % | 98.9 | % | 96.4 | % | 23,057 | ||||||||||
Harborview Plaza | Tampa | 205,000 | Consolidated | 100 | % | 98.0 | % | 98.0 | % | — | ||||||||||
Lincoln Place | Miami | 140,000 | Consolidated | 100 | % | 100.0 | % | 100.0 | % | — | ||||||||||
Florida | 3,203,000 | 99,199 | ||||||||||||||||||
3344 Peachtree | Atlanta | 485,000 | Consolidated | 33 | % | 99.0 | % | 96.3 | % | 26,174 | ||||||||||
One Buckhead Plaza | Atlanta | 464,000 | Consolidated | 100 | % | 96.0 | % | 94.8 | % | — | ||||||||||
3350 Peachtree | Atlanta | 413,000 | Consolidated | 100 | % | 93.2 | % | 93.2 | % | — | ||||||||||
3348 Peachtree | Atlanta | 260,000 | Consolidated | 100 | % | 93.7 | % | 93.7 | % | — | ||||||||||
The Forum | Atlanta | 220,000 | Consolidated | 100 | % | 95.8 | % | 93.3 | % | — | ||||||||||
Two Buckhead Plaza | Atlanta | 210,000 | Consolidated | 100 | % | 91.0 | % | 86.8 | % | 52,000 | ||||||||||
Georgia | 2,052,000 | 78,174 | ||||||||||||||||||
Hearst Tower | Charlotte | 963,000 | Consolidated | 100 | % | 98.3 | % | 97.1 | % | — | ||||||||||
NASCAR Plaza | Charlotte | 394,000 | Consolidated | 100 | % | 98.2 | % | 98.2 | % | — | ||||||||||
North Carolina | 1,357,000 | — | ||||||||||||||||||
Hayden Ferry (3) | Tempe | 789,000 | Consolidated | (4 | ) | 94.7 | % | 92.5 | % | 45,994 | ||||||||||
Tempe Gateway | Tempe | 264,000 | Consolidated | 100 | % | 98.7 | % | 98.7 | % | — | ||||||||||
111 West Rio (US Airways Building) | Tempe | 229,000 | Unconsolidated | 75 | % | 100.0 | % | 100.0 | % | — | ||||||||||
Arizona | 1,282,000 | 45,994 | ||||||||||||||||||
One Eleven Congress | Austin | 519,000 | Consolidated | 100 | % | 94.4 | % | 84.0 | % | 128,000 | ||||||||||
San Jacinto Center | Austin | 406,000 | Consolidated | 100 | % | 100.0 | % | 99.5 | % | 101,000 | ||||||||||
Texas | 925,000 | 229,000 | ||||||||||||||||||
Total | 8,819,000 | 452,367 | ||||||||||||||||||
(1) | Information presented includes all properties that the Company owned on November 1, 2016 as a result of the merger with Parkway Properties, Inc. | |||||||||||||||||||
(2) | Property level debt represents the Company's share of total debt as of October 6, 2016, the date of the merger with Parkway Properties, Inc. | |||||||||||||||||||
(3) | Contains multiple buildings that are grouped together for reporting purposes. | |||||||||||||||||||
(4) | The Company's ownership interest in the Hayden Ferry buildings is 30%, with the exception of Hayden Ferry III, for which the Company's ownership interest is 70%. | |||||||||||||||||||
Cousins Properties Incorporated | 31 | Q3 2016 Supplemental Information |