Attached files
| file | filename |
|---|---|
| EX-99.1 - EX-99.1 - PUBLIC SERVICE ENTERPRISE GROUP INC | d268519dex991.htm |
| 8-K - FORM 8-K - PUBLIC SERVICE ENTERPRISE GROUP INC | d268519d8k.htm |
EXHIBIT 99

| For further information, contact: |
||
|
• Kathleen A. Lally, Vice President – Investor Relations |
Phone: 973-430-6565 | |
| • Carlotta Chan, Manager - Investor Relations |
Phone: 973-430-6596 | |
PSEG ANNOUNCES 2016 THIRD QUARTER RESULTS
$0.64 Per Share of Net Income
Non-GAAP Operating Earnings of $0.88 Per Share
PSE&G Settlement Supports Expanded Investment in Solar
Full Year 2016 Non-GAAP Operating Earnings Guidance Adjusted to $2.80 - $2.95 Per Share
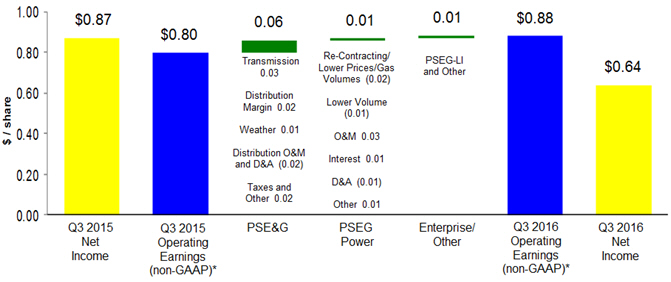
October 31, 2016 (Newark, NJ) (NYSE – PEG) Public Service Enterprise Group (PSEG) reported third quarter 2016 Net Income of $327 million or $0.64 per share as compared to Net Income of $439 million or $0.87 per share reported for the third quarter of 2015. Non-GAAP Operating Earnings for the third quarter of 2016 were $444 million or $0.88 per share as compared to non-GAAP Operating Earnings for the third quarter of 2015 of $403 million or $0.80 per share.
Ralph Izzo, chairman, president and chief executive officer said “PSEG’s performance for the third quarter continues to demonstrate the benefits from our expanded investment program. A focus on controlling costs supported results as demand was aided by the warmer than normal weather experienced this past summer. Net Income was also impacted by our decision to retire the Hudson and Mercer coal-fired generating stations in 2017. Retirement of these units continues the evolution of PSEG Power’s assets into a portfolio of reliable, low-cost, flexible assets capable of competing in today’s energy market. This decision will allow us to meet market conditions and aids PSEG Power’s future cash flow and return profile.”
Management uses non-GAAP Operating Earnings in its internal analysis, and in communications with investors and analysts, as a consistent measure for comparing PSEG’s financial performance to previous financial results. Non-GAAP Operating Earnings exclude the impact of returns (losses) associated with the Nuclear Decommissioning Trust (NDT), Mark-to-Market (MTM) accounting and material one-time items. The table below provides a reconciliation of PSEG’s Net Income to non-GAAP Operating Earnings for the third quarter. See Attachment 11 for a complete list of items excluded from Net Income in the determination of non-GAAP Operating Earnings. The presentation of non-GAAP Operating Earnings is intended to complement, and should not be considered an alternative to, the presentation of Net Income, which is an indicator of financial performance determined in accordance with GAAP. In addition, non-GAAP Operating Earnings as presented in this release may not be comparable to similarly titled measures used by other companies.
PSEG CONSOLIDATED RESULTS (unaudited)
Third Quarter Comparative Results
2016 and 2015
| Income | Diluted Earnings | |||||||||||||||
| ($ millions) | Per Share | |||||||||||||||
| 2016 | 2015 | 2016 | 2015 | |||||||||||||
| Net Income |
$ | 327 | $ | 439 | $ | 0.64 | $ | 0.87 | ||||||||
| Reconciling Items* |
117 | (36 | ) | 0.24 | (0.07 | ) | ||||||||||
|
|
|
|
|
|
|
|
|
|||||||||
| Non-GAAP Operating Earnings |
$ | 444 | $ | 403 | $ | 0.88 | $ | 0.80 | ||||||||
|
|
|
|
|
|
|
|
|
|||||||||
| Avg. Shares | 508M | 508M |
| * | See Attachment 11 |
Ralph Izzo went on to say, “We are making a slight adjustment to the upper end of our guidance. Strong third quarter results weren’t sufficient to offset the lack of a winter, and we are adjusting our guidance for 2016’s non-GAAP Operating Earnings to $2.80 - $2.95 per share from $2.80 - $3.00 per share.”
Non-GAAP Operating Earnings guidance by company for the full year is as follows:
2016 Non-GAAP Operating Earnings Guidance
($ millions, except EPS)
| 2016 Estimate | ||
| PSE&G |
$900 - $935 | |
| PSEG Power |
$460 - $500 | |
| PSEG Enterprise/Other |
$65 - $65 | |
| Non-GAAP Operating Earnings |
$1,425 - $1,500 | |
| Non-GAAP EPS |
$2.80 - $2.95 | |
Due to the forward looking nature of non-GAAP Operating Earnings guidance, PSEG is unable to reconcile this non-GAAP financial measure to the most directly comparable GAAP financial measure. Management is unable to project certain reconciling items, in particular MTM and NDT gains (losses), for future periods due to market volatility.
Non-GAAP Operating Earnings Review and Outlook by Operating Subsidiary
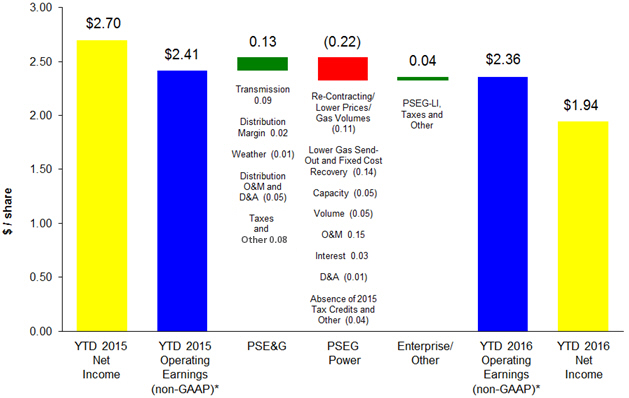
See Attachment 5 for detail regarding the quarter-over-quarter reconciliations for each of PSEG’s businesses.
PSE&G
PSE&G reported Net Income of $255 million ($0.50 per share) for the third quarter of 2016 compared with Net Income of $222 million ($0.44 per share) for the third quarter of 2015.
The improvement in Net Income for the third quarter reflects growth from expanded investment in electric and gas transmission and distribution facilities.
Returns on PSE&G’s expanded investment in transmission added $0.03 per share to Net Income in the quarter. Incremental revenue associated with PSE&G’s Energy Strong investment infrastructure program added $0.02 per share to Net Income in the quarter. Third quarter Net Income comparisons also benefited by an increase in electric demand associated with weather conditions which were approximately 30% warmer than normal and 9% warmer than conditions experienced during the 2015 third quarter. The increase in demand associated with the warmer than normal weather added $0.01 per share to third quarter Net Income. An increase in depreciation and O&M and other items was offset by a decline in taxes and other items.
Electric demand in the third quarter was influenced by weather which was hotter than normal, and warmer than the weather conditions experienced in the year-ago period. Weather normalized sales for the third quarter – led by an increase in the residential sector – are estimated to have increased 0.1% for the quarter.
PSE&G’s capital program remains on schedule. PSE&G invested approximately $2.1 billion through September 30 as part of its planned capital investment for 2016 of $3.0 billion in upgrades to the electric and gas distribution and transmission system.
PSE&G has reached a settlement with key parties providing for an extension of its existing landfill/brownfield solar program. The settlement provides for an investment of approximately $80 million to construct 33MWs of grid-connected solar facilities over three years. The settlement is subject to review/approval by the NJ Board of Public Utilities (BPU). PSE&G is also requesting approval from the BPU to partner with NJ Transit in the development of a new $270 million substation that both would utilize, and would enhance the reliability and resilience of facilities damaged by Superstorm Sandy. It is estimated that the new substation would enter service by the end of 2020.
PSE&G filed an update of its Formula Rate for transmission at the Federal Energy Regulatory Commission in October 2016. The update, which reflects an increase in the level of PSE&G’s investment in transmission, would provide for a $121 million increase in annual transmission revenues effective January 1, 2017.
The forecast of PSE&G’s Net Income for 2016 remains at $900 - $935 million.
PSEG Power
PSEG Power reported Net Income of $139 million ($0.27 per share) for the third quarter of 2016 and non-GAAP Adjusted EBITDA of $397 million compared with Net Income of $206 million ($0.40 per share) and non-GAAP Adjusted EBITDA of $401 million for the third quarter of 2015. Non-GAAP Operating Earnings for the third quarter of 2016 was $170 million ($0.34 per share) compared with non-GAAP Operating Earnings for the third quarter of 2015 of $170 million ($0.33 per share).
Management believes non-GAAP Adjusted EBITDA is useful to investors and other users of our financial statements in evaluating operating performance because it provides them with an additional tool to compare business performance across companies and across periods. Management also believes that non-GAAP Adjusted EBITDA is widely used by investors to measure operating performance without regard to items such as income tax expense, interest expense, depreciation and amortization and major maintenance at Power’s fossil generation facilities, which can vary substantially from company to company depending upon, among other things, the book value of assets, capital structure, whether assets were constructed or acquired and accounting methods. Non-GAAP Adjusted EBITDA also allows investors and other users to assess the underlying financial performance of our fleet before management’s decision to deploy capital. Non-GAAP Adjusted EBITDA excludes the same items as our Operating Earnings measure as well as income tax expense, interest expense, depreciation and amortization and major maintenance expense. See Attachment 12 for a complete list of items excluded from Net Income in the determination of non-GAAP Adjusted EBITDA. The presentation of non-GAAP Adjusted EBITDA is intended to complement, and should not be considered an alternative to, the presentation of Net Income, which is an indicator of financial performance determined in accordance with GAAP.
Power’s Net Income in the third quarter includes one-time charges amounting to $67 million ($0.13 per share) related to the early retirement of the Hudson and Mercer generation stations. Power’s operating results for the third quarter reflect the impact of the known decline in average prices on energy hedges and a decline in operating costs.
A decline in the average price on energy hedges partially offset by a lower cost to serve load combined to reduce quarter-over-quarter Net Income by $0.02 per share. A decline in output during the quarter reduced Net Income by $0.01 per share. A reduction in O&M expense improved Net Income comparisons by $0.03 per share. An increase in depreciation associated with Power’s capital program was more than offset by a decline in interest expense and other items which combined to improve quarter-over-quarter Net Income by $0.01 per share.
Output at Power’s generation facilities declined 4% in the quarter. The average capacity factor for the nuclear fleet was 80% in the third quarter versus an average capacity factor of 95% in the year-ago quarter, as output from the nuclear fleet declined 12% to 6.9 TWh from 7.8 TWh. An extension of the Salem 1 refueling outage through the month of July to repair degraded baffle bolts and an unplanned outage at Salem 2 due to transformer issues were the primary causes for the reduction in nuclear output in the third quarter. Output from the gas-fired combined cycle fleet declined slightly to 5.2 TWh from 5.4 TWh. The warmer than normal weather conditions spurred an increase in demand for Power’s coal-fired generating stations and peaking fleet, which together experienced an increase in output during the quarter to 2.0 TWh from 1.6 TWh.
Power is maintaining its forecast of output for 2016 of 50 – 52 TWh. The forecast for output in 2017 and 2018 has been reduced by approximately 3 – 4%. The revised forecast takes into account the impact of low gas prices on the dispatch of the Keystone/Conemaugh coal-fired generation stations, and the retirement of the Hudson and Mercer coal-fired generation stations in mid-2017. Approximately 75% – 80% of anticipated production in the fourth
quarter of 2016 of 11 – 12 TWh is hedged at an average price of $48 per MWh. For 2017, Power has hedged 65% – 70% of its revised forecast of 51 – 53 TWh of output at an average price of $47 per MWh. For 2018, Power has hedged approximately 25% – 30% of its revised forecast of 56 – 58 TWh of output at an average price of $45 per MWh. The hedge data continues to assume BGS hedges will cover 11 – 12 TWh of output.
The forecast of Power’s non-GAAP Operating Earnings for 2016 is now $460 – $500 million. The forecast represents non-GAAP Adjusted EBITDA for the full year of $1,270 – $1,335 million.
PSEG Enterprise/Other
PSEG Enterprise/Other reported a Net Loss of $67 million ($0.13 per share) for the third quarter of 2016 compared to Net Income of $11 million ($0.03 per share) for the third quarter of 2015.
Non-GAAP Operating Earnings for the third quarter of 2016 were $19 million ($0.04 per share) compared with non-GAAP Operating Earnings of $11 million ($0.03 per share) during the third quarter of 2015.
During the third quarter of 2016, Energy Holdings completed its review of estimated residual values embedded in the NRG REMA, LLC leveraged leases. As a result of current and expected future market conditions, an impairment of $86 million, after-tax, related to the residual value of these leases was recorded in Net Income. The increase in non-GAAP Operating Earnings quarter-over-quarter reflects certain tax items at PSEG Energy Holdings and contractual payments associated with the operation of PSEG Long Island.
The forecast of PSEG Enterprise/Other full year non-GAAP Operating Earnings remains $65 million.
Financing
PSEG closed the quarter ended September 30, 2016 with $450 million of cash on its balance sheet with debt at the end of the quarter representing approximately 45% of consolidated capital. PSEG Power had debt at the end of the quarter representing 28% of capital.
Forward-Looking Statement
Certain of the matters discussed in this report about our and our subsidiaries’ future performance, including, without limitation, future revenues, earnings, strategies, prospects, consequences and all other statements that are not purely historical constitute “forward-looking statements” within the meaning of the Private Securities Litigation Reform Act of 1995. Such forward-looking statements are subject to risks and uncertainties, which could cause actual results to differ materially from those anticipated. Such statements are based on management’s beliefs as well as assumptions made by and information currently available to management. When used herein, the words “anticipate,” “intend,” “estimate,” “believe,” “expect,” “plan,” “should,” “hypothetical,” “potential,” “forecast,” “project,” variations of such words and similar expressions are intended to identify forward-looking statements. Factors that may cause actual results to differ are often presented with the forward-looking statements themselves. Other factors that could cause actual results to differ materially from those contemplated in any forward-looking statements made by us herein are discussed in filings we make with the United States Securities and Exchange Commission (SEC) including our
Annual Report on Form 10-K and subsequent reports on Form 10-Q and Form 8-K and available on our website: http://www.pseg.com. These factors include, but are not limited to:
| • | adverse changes in the demand for or ongoing low pricing of the capacity and energy that we sell into wholesale electricity markets, |
| • | adverse changes in energy industry law, policies and regulations, including market structures and transmission planning, |
| • | any inability of our transmission and distribution businesses to obtain adequate and timely rate relief and regulatory approvals from federal and state regulators, including prudency reviews, disallowances and changes in authorized returns, |
| • | any deterioration in our credit quality or the credit quality of our counterparties, |
| • | changes in federal and state environmental regulations and enforcement that could increase our costs or limit our operations, |
| • | adverse outcomes of any legal, regulatory or other proceeding, settlement, investigation or claim applicable to us and/or the energy industry, |
| • | changes in nuclear regulation and/or general developments in the nuclear power industry, including various impacts from any accidents or incidents experienced at our facilities or by others in the industry, that could limit operations or increase the cost of our nuclear generating units, |
| • | actions or activities at one of our nuclear units located on a multi-unit site that might adversely affect our ability to continue to operate that unit or other units located at the same site, |
| • | any inability to manage our energy obligations, available supply and risks, |
| • | delays or unforeseen cost escalations in our construction and development activities, or the inability to recover the carrying amount of our assets, |
| • | availability of capital and credit at commercially reasonable terms and conditions and our ability to meet cash needs, |
| • | increases in competition in energy supply markets as well as for transmission projects, |
| • | changes in technology, such as distributed generation, storage and micro grids, and greater reliance on these technologies, |
| • | changes in customer behaviors, including increases in energy efficiency, net-metering and demand response, |
| • | adverse performance of our decommissioning and defined benefit plan trust fund investments and changes in funding requirements, |
| • | any equipment failures, accidents, severe weather events or other incidents that impact our ability to provide safe and reliable service to our customers, and any inability to obtain sufficient insurance coverage or recover insurance proceeds with respect to such events, |
| • | acts of terrorism, cybersecurity attacks or intrusions that could adversely impact our businesses, |
| • | delays in receipt of necessary permits and approvals for our construction and development activities, |
| • | any inability to achieve, or continue to sustain, our expected levels of operating performance, |
| • | changes in the cost of, or interruption in the supply of, fuel and other commodities necessary to the operation of our generating units, |
| • | economic recessions, |
| • | an inability to realize anticipated tax benefits or retain tax credits, |
| • | challenges associated with recruitment and/or retention of a qualified workforce, and |
| • | changes in the credit quality and the ability of lessees to meet their obligations under our domestic leveraged leases. |
All of the forward-looking statements made in this report are qualified by these cautionary statements and we cannot assure you that the results or developments anticipated by management will be realized or even if realized, will have the expected consequences to, or effects on, us or our business prospects, financial condition or results of operations. Readers are cautioned not to place undue reliance on these forward-looking statements in making any investment decision. Forward-looking statements made in this report apply only as of the date of this report. While we may elect to update forward-looking statements from time to time, we specifically disclaim any obligation to do so, even if internal estimates change, unless otherwise required by applicable securities laws.
The forward-looking statements contained in this report are intended to qualify for the safe harbor provisions of Section 27A of the Securities Act of 1933, as amended, and Section 21E of the Securities Exchange Act of 1934, as amended.
From time to time, PSEG, PSE&G and PSEG Power release important information via postings on their corporate website at http://investor.pseg.com. Investors and other interested parties are encouraged to visit the corporate website to review new postings. The “Email Alerts” link at http://investor.pseg.com may be used to enroll to receive automatic email alerts and/or Really Simple Syndication (RSS) feeds regarding new postings.
Attachment 1
PUBLIC SERVICE ENTERPRISE GROUP INCORPORATED
Consolidating Statements of Operations
(Unaudited, $ millions)
| Three Months Ended September 30, 2016 | ||||||||||||||||
| PSEG | PSEG Enterprise/ Other (a) |
PSE&G | PSEG Power |
|||||||||||||
| OPERATING REVENUES |
$ | 2,450 | $ | (309 | ) | $ | 1,684 | $ | 1,075 | |||||||
| OPERATING EXPENSES |
||||||||||||||||
| Energy Costs |
866 | (317 | ) | 721 | 462 | |||||||||||
| Operation and Maintenance |
776 | 111 | 376 | 289 | ||||||||||||
| Depreciation and Amortization |
231 | 8 | 137 | 86 | ||||||||||||
|
|
|
|
|
|
|
|
|
|||||||||
| Total Operating Expenses |
1,873 | (198 | ) | 1,234 | 837 | |||||||||||
|
|
|
|
|
|
|
|
|
|||||||||
| OPERATING INCOME (LOSS) |
577 | (111 | ) | 450 | 238 | |||||||||||
| Income from Equity Method Investments |
3 | — | — | 3 | ||||||||||||
| Other Income and (Deductions) |
39 | 1 | 21 | 17 | ||||||||||||
| Other-Than-Temporary Impairments |
(5 | ) | — | — | (5 | ) | ||||||||||
| Interest Expense |
(99 | ) | (3 | ) | (72 | ) | (24 | ) | ||||||||
|
|
|
|
|
|
|
|
|
|||||||||
| INCOME (LOSS) BEFORE INCOME TAXES |
515 | (113 | ) | 399 | 229 | |||||||||||
| Income Tax Benefit (Expense) |
(188 | ) | 46 | (144 | ) | (90 | ) | |||||||||
|
|
|
|
|
|
|
|
|
|||||||||
| NET INCOME (LOSS) |
$ | 327 | $ | (67 | ) | $ | 255 | $ | 139 | |||||||
|
|
|
|
|
|
|
|
|
|||||||||
| Reconciling Items Excluded from Net Income (Loss) (b) |
117 | 86 | — | 31 | ||||||||||||
|
|
|
|
|
|
|
|
|
|||||||||
| OPERATING EARNINGS (non-GAAP) |
$ | 444 | $ | 19 | $ | 255 | $ | 170 | ||||||||
|
|
|
|
|
|
|
|
|
|||||||||
| Earnings Per Share |
||||||||||||||||
| NET INCOME (LOSS) |
$ | 0.64 | $ | (0.13 | ) | $ | 0.50 | $ | 0.27 | |||||||
|
|
|
|
|
|
|
|
|
|||||||||
| Reconciling Items Excluded from Net Income (Loss) (b) |
0.24 | 0.17 | — | 0.07 | ||||||||||||
|
|
|
|
|
|
|
|
|
|||||||||
| OPERATING EARNINGS (non-GAAP) |
$ | 0.88 | $ | 0.04 | $ | 0.50 | $ | 0.34 | ||||||||
|
|
|
|
|
|
|
|
|
|||||||||
| Three Months Ended September 30, 2015 | ||||||||||||||||
| PSEG | PSEG Enterprise/ Other (a) |
PSE&G | PSEG Power |
|||||||||||||
| OPERATING REVENUES |
$ | 2,688 | $ | (174 | ) | $ | 1,766 | $ | 1,096 | |||||||
| OPERATING EXPENSES |
||||||||||||||||
| Energy Costs |
815 | (292 | ) | 740 | 367 | |||||||||||
| Operation and Maintenance |
746 | 92 | 391 | 263 | ||||||||||||
| Depreciation and Amortization |
313 | 7 | 231 | 75 | ||||||||||||
|
|
|
|
|
|
|
|
|
|||||||||
| Total Operating Expenses |
1,874 | (193 | ) | 1,362 | 705 | |||||||||||
|
|
|
|
|
|
|
|
|
|||||||||
| OPERATING INCOME |
814 | 19 | 404 | 391 | ||||||||||||
| Income from Equity Method Investments |
3 | — | — | 3 | ||||||||||||
| Other Income and (Deductions) |
33 | — | 22 | 11 | ||||||||||||
| Other-Than-Temporary Impairments |
(30 | ) | — | — | (30 | ) | ||||||||||
| Interest Expense |
(96 | ) | 1 | (67 | ) | (30 | ) | |||||||||
|
|
|
|
|
|
|
|
|
|||||||||
| INCOME BEFORE INCOME TAXES |
724 | 20 | 359 | 345 | ||||||||||||
| Income Tax Benefit (Expense) |
(285 | ) | (9 | ) | (137 | ) | (139 | ) | ||||||||
|
|
|
|
|
|
|
|
|
|||||||||
| NET INCOME |
$ | 439 | $ | 11 | $ | 222 | $ | 206 | ||||||||
|
|
|
|
|
|
|
|
|
|||||||||
| Reconciling Items Excluded from Net Income (b) |
(36 | ) | — | — | (36 | ) | ||||||||||
|
|
|
|
|
|
|
|
|
|||||||||
| OPERATING EARNINGS (non-GAAP) |
$ | 403 | $ | 11 | $ | 222 | $ | 170 | ||||||||
|
|
|
|
|
|
|
|
|
|||||||||
| Earnings Per Share |
||||||||||||||||
| NET INCOME |
$ | 0.87 | $ | 0.03 | $ | 0.44 | $ | 0.40 | ||||||||
|
|
|
|
|
|
|
|
|
|||||||||
| Reconciling Items Excluded from Net Income (b) |
(0.07 | ) | — | — | (0.07 | ) | ||||||||||
|
|
|
|
|
|
|
|
|
|||||||||
| OPERATING EARNINGS (non-GAAP) |
$ | 0.80 | $ | 0.03 | $ | 0.44 | $ | 0.33 | ||||||||
|
|
|
|
|
|
|
|
|
|||||||||
| (a) | Includes activities at Energy Holdings, PSEG Long Island and the Parent as well as intercompany eliminations. |
| (b) | See Attachment 11 and 12 for details of items excluded from Net Income to compute Operating Earnings (non-GAAP). |
Attachment 2
PUBLIC SERVICE ENTERPRISE GROUP INCORPORATED
Consolidating Statements of Operations
(Unaudited, $ millions)
| Nine Months Ended September 30, 2016 | ||||||||||||||||
| PSEG | PSEG Enterprise/ Other (a) |
PSE&G | PSEG Power |
|||||||||||||
| OPERATING REVENUES |
$ | 6,971 | $ | (877 | ) | $ | 4,746 | $ | 3,102 | |||||||
| OPERATING EXPENSES |
||||||||||||||||
| Energy Costs |
2,326 | (1,134 | ) | 1,979 | 1,481 | |||||||||||
| Operation and Maintenance |
2,215 | 298 | 1,110 | 807 | ||||||||||||
| Depreciation and Amortization |
679 | 22 | 412 | 245 | ||||||||||||
|
|
|
|
|
|
|
|
|
|||||||||
| Total Operating Expenses |
5,220 | (814 | ) | 3,501 | 2,533 | |||||||||||
|
|
|
|
|
|
|
|
|
|||||||||
| OPERATING INCOME |
1,751 | (63 | ) | 1,245 | 569 | |||||||||||
| Income from Equity Method Investments |
9 | — | — | 9 | ||||||||||||
| Other Income and (Deductions) |
100 | 1 | 58 | 41 | ||||||||||||
| Other-Than-Temporary Impairments |
(25 | ) | — | — | (25 | ) | ||||||||||
| Interest Expense |
(288 | ) | (8 | ) | (214 | ) | (66 | ) | ||||||||
|
|
|
|
|
|
|
|
|
|||||||||
| INCOME BEFORE INCOME TAXES |
1,547 | (70 | ) | 1,089 | 528 | |||||||||||
| Income Tax Benefit (Expense) |
(562 | ) | 39 | (393 | ) | (208 | ) | |||||||||
|
|
|
|
|
|
|
|
|
|||||||||
| NET INCOME (LOSS) |
$ | 985 | $ | (31 | ) | $ | 696 | $ | 320 | |||||||
|
|
|
|
|
|
|
|
|
|||||||||
| Reconciling Items Excluded from Net Income (Loss) (b) |
211 | 86 | — | 125 | ||||||||||||
|
|
|
|
|
|
|
|
|
|||||||||
| OPERATING EARNINGS (non-GAAP) |
$ | 1,196 | $ | 55 | $ | 696 | $ | 445 | ||||||||
|
|
|
|
|
|
|
|
|
|||||||||
| Earnings Per Share |
||||||||||||||||
| NET INCOME (LOSS) |
$ | 1.94 | $ | (0.06 | ) | $ | 1.37 | $ | 0.63 | |||||||
|
|
|
|
|
|
|
|
|
|||||||||
| Reconciling Items Excluded from Net Income (Loss) (b) |
0.42 | 0.17 | — | 0.25 | ||||||||||||
|
|
|
|
|
|
|
|
|
|||||||||
| OPERATING EARNINGS (non-GAAP) |
$ | 2.36 | $ | 0.11 | $ | 1.37 | $ | 0.88 | ||||||||
|
|
|
|
|
|
|
|
|
|||||||||
| Nine Months Ended September 30, 2015 | ||||||||||||||||
| PSEG | PSEG Enterprise/ Other (a) |
PSE&G | PSEG Power |
|||||||||||||
| OPERATING REVENUES |
$ | 8,137 | $ | (943 | ) | $ | 5,234 | $ | 3,846 | |||||||
| OPERATING EXPENSES |
||||||||||||||||
| Energy Costs |
2,577 | (1,268 | ) | 2,176 | 1,669 | |||||||||||
| Operation and Maintenance |
2,170 | 251 | 1,171 | 748 | ||||||||||||
| Depreciation and Amortization |
960 | 22 | 712 | 226 | ||||||||||||
|
|
|
|
|
|
|
|
|
|||||||||
| Total Operating Expenses |
5,707 | (995 | ) | 4,059 | 2,643 | |||||||||||
|
|
|
|
|
|
|
|
|
|||||||||
| OPERATING INCOME |
2,430 | 52 | 1,175 | 1,203 | ||||||||||||
| Income from Equity Method Investments |
10 | (1 | ) | — | 11 | |||||||||||
| Other Income and (Deductions) |
135 | 1 | 57 | 77 | ||||||||||||
| Other-Than-Temporary Impairments |
(45 | ) | — | — | (45 | ) | ||||||||||
| Interest Expense |
(291 | ) | 6 | (203 | ) | (94 | ) | |||||||||
|
|
|
|
|
|
|
|
|
|||||||||
| INCOME BEFORE INCOME TAXES |
2,239 | 58 | 1,029 | 1,152 | ||||||||||||
| Income Tax Benefit (Expense) |
(869 | ) | (26 | ) | (398 | ) | (445 | ) | ||||||||
|
|
|
|
|
|
|
|
|
|||||||||
| NET INCOME |
$ | 1,370 | $ | 32 | $ | 631 | $ | 707 | ||||||||
|
|
|
|
|
|
|
|
|
|||||||||
| Reconciling Items Excluded from Net Income (b) |
(149 | ) | — | — | (149 | ) | ||||||||||
|
|
|
|
|
|
|
|
|
|||||||||
| OPERATING EARNINGS (non-GAAP) |
$ | 1,221 | $ | 32 | $ | 631 | $ | 558 | ||||||||
|
|
|
|
|
|
|
|
|
|||||||||
| Earnings Per Share |
||||||||||||||||
| NET INCOME |
$ | 2.70 | $ | 0.07 | $ | 1.24 | $ | 1.39 | ||||||||
|
|
|
|
|
|
|
|
|
|||||||||
| Reconciling Items Excluded from Net Income (b) |
(0.29 | ) | — | — | (0.29 | ) | ||||||||||
|
|
|
|
|
|
|
|
|
|||||||||
| OPERATING EARNINGS (non-GAAP) |
$ | 2.41 | $ | 0.07 | $ | 1.24 | $ | 1.10 | ||||||||
|
|
|
|
|
|
|
|
|
|||||||||
| (a) | Includes activities at Energy Holdings, PSEG Long Island and the Parent as well as intercompany eliminations. |
| (b) | See Attachment 11 and 12 for details of items excluded from Net Income to compute Operating Earnings (non-GAAP). |
Attachment 3
PUBLIC SERVICE ENTERPRISE GROUP INCORPORATED
Capitalization Schedule
(Unaudited, $ millions)
| September 30, | December 31, | |||||||
| 2016 | 2015 | |||||||
| DEBT |
||||||||
| Long-Term Debt* |
$ | 10,697 | $ | 9,561 | ||||
| Project Level, Non-Recourse Debt |
— | 7 | ||||||
|
|
|
|
|
|||||
| Total Debt |
10,697 | 9,568 | ||||||
| STOCKHOLDERS’ EQUITY |
||||||||
| Common Stock |
4,928 | 4,915 | ||||||
| Treasury Stock |
(714 | ) | (671 | ) | ||||
| Retained Earnings |
9,480 | 9,117 | ||||||
| Accumulated Other Comprehensive Loss |
(218 | ) | (295 | ) | ||||
|
|
|
|
|
|||||
| Total Common Stockholders’ Equity |
13,476 | 13,066 | ||||||
| Noncontrolling Interests - Equity Investments |
— | 1 | ||||||
|
|
|
|
|
|||||
| Total Equity |
13,476 | 13,067 | ||||||
|
|
|
|
|
|||||
| Total Capitalization |
$ | 24,173 | $ | 22,635 | ||||
|
|
|
|
|
|||||
| * | Includes current portion of Long-Term Debt |
Attachment 4
PUBLIC SERVICE ENTERPRISE GROUP INCORPORATED
CONDENSED CONSOLIDATED STATEMENTS OF CASH FLOWS
(Unaudited, $ millions)
| Nine Months Ended September 30, | ||||||||
| 2016 | 2015 | |||||||
| CASH FLOWS FROM OPERATING ACTIVITIES |
||||||||
| Net Income |
$ | 985 | $ | 1,370 | ||||
| Adjustments to Reconcile Net Income to Net Cash Flows From Operating Activities |
1,776 | 1,858 | ||||||
|
|
|
|
|
|||||
| NET CASH PROVIDED BY OPERATING ACTIVITIES |
2,761 | 3,228 | ||||||
|
|
|
|
|
|||||
| NET CASH USED IN INVESTING ACTIVITIES |
(3,054 | ) | (2,841 | ) | ||||
|
|
|
|
|
|||||
| NET CASH PROVIDED BY (USED IN) FINANCING ACTIVITIES |
349 | (518 | ) | |||||
|
|
|
|
|
|||||
| Net Change in Cash and Cash Equivalents |
56 | (131 | ) | |||||
| Cash and Cash Equivalents at Beginning of Period |
394 | 402 | ||||||
|
|
|
|
|
|||||
| Cash and Cash Equivalents at End of Period |
$ | 450 | $ | 271 | ||||
|
|
|
|
|
|||||
Attachment 5
PUBLIC SERVICE ENTERPRISE GROUP INCORPORATED
Quarter-over-Quarter EPS Reconciliation
September 30, 2016 vs. September 30, 2015
(Unaudited)
| * | See Attachment 11 and 12 for Items excluded from Net Income to reconcile to Operating Earnings (non-GAAP). |
Attachment 6
PUBLIC SERVICE ENTERPRISE GROUP INCORPORATED
Year-over-Year EPS Reconciliation
September 30, 2016 vs. September 30, 2015
(Unaudited)
| * | See Attachment 11 and 12 for Items excluded from Net Income to reconcile to Operating Earnings (non-GAAP). |
Attachment 7
PUBLIC SERVICE ELECTRIC & GAS COMPANY
Retail Sales and Revenues
(Unaudited)
September 30, 2016
Electric Sales and Revenues
| Three Months Ended |
Change vs. 2015 |
Nine Months Ended |
Change vs. 2015 |
|||||||||||||
| Sales (millions kWh) |
||||||||||||||||
| Residential |
4,924 | 7.2 | % | 10,919 | -0.9 | % | ||||||||||
| Commercial & Industrial |
7,795 | 1.5 | % | 21,022 | -1.5 | % | ||||||||||
| Street Lighting |
70 | 1.3 | % | 237 | 1.3 | % | ||||||||||
| Interdepartmental |
3 | 4.8 | % | 7 | -1.2 | % | ||||||||||
|
|
|
|
|
|||||||||||||
| Total |
12,792 | 3.6 | % | 32,185 | -1.3 | % | ||||||||||
|
|
|
|
|
|||||||||||||
| Revenue ($ millions) |
||||||||||||||||
| Residential |
$ | 771 | 2.0 | % | $ | 1,682 | -5.4 | % | ||||||||
| Commercial & Industrial |
543 | -13.8 | % | 1,319 | -18.8 | % | ||||||||||
| Street Lighting |
16 | -5.8 | % | 50 | -4.1 | % | ||||||||||
| Other Operating Revenues* |
166 | 5.1 | % | 503 | 9.9 | % | ||||||||||
|
|
|
|
|
|||||||||||||
| Total |
$ | 1,496 | -4.2 | % | $ | 3,554 | -9.2 | % | ||||||||
|
|
|
|
|
|||||||||||||
| Three Months Ended |
Change vs. 2015 |
Nine Months Ended |
Change vs. 2015 |
|||||||||||||
| Weather Data |
||||||||||||||||
| THI Hours - Actual |
15,140 | 9.0 | % | 18,998 | 1.5 | % | ||||||||||
| THI Hours - Normal |
11,602 | 15,599 | ||||||||||||||
| * | Primarily sales of Non-Utility Generator energy to PJM and Transmission related revenues. |
Attachment 8
PUBLIC SERVICE ELECTRIC & GAS COMPANY
Retail Sales and Revenues
(Unaudited)
September 30, 2016
Gas Sold and Transported
| Three Months Ended |
Change vs. 2015 |
Nine Months Ended |
Change vs. 2015 |
|||||||||||||
| Sales (millions therms)* |
||||||||||||||||
| Firm Sales |
||||||||||||||||
| Residential Sales |
88 | -8.4 | % | 953 | -18.4 | % | ||||||||||
| Commercial & Industrial |
94 | -6.5 | % | 682 | -15.2 | % | ||||||||||
|
|
|
|
|
|||||||||||||
| Total Firm Sales |
182 | -7.5 | % | 1,635 | -17.1 | % | ||||||||||
|
|
|
|
|
|||||||||||||
| Non-Firm Sales |
||||||||||||||||
| Commercial & Industrial |
679 | 1.5 | % | 1,566 | -3.7 | % | ||||||||||
|
|
|
|
|
|||||||||||||
| Total Non-Firm Sales |
679 | 1,566 | ||||||||||||||
|
|
|
|
|
|||||||||||||
| Total Sales |
861 | -0.5 | % | 3,201 | -11.0 | % | ||||||||||
|
|
|
|
|
|||||||||||||
| Revenue ($ millions) |
||||||||||||||||
| Residential Sales - Firm |
$ | 31 | -20.1 | % | $ | 228 | 2.1 | % | ||||||||
| Commercial & Industrial - Firm Sales |
15 | 4.2 | % | 128 | -35.2 | % | ||||||||||
| Non-Firm Sales |
6 | -37.1 | % | 19 | -34.7 | % | ||||||||||
| Other Operating Revenues** |
43 | 2.0 | % | 130 | 0.6 | % | ||||||||||
|
|
|
|
|
|||||||||||||
| Total |
$ | 95 | -9.3 | % | $ | 505 | -12.8 | % | ||||||||
|
|
|
|
|
|||||||||||||
| Gas Transported |
$ | 93 | -6.8 | % | $ | 687 | -7.5 | % | ||||||||
| Three Months Ended |
Change vs. 2015 |
Nine Months Ended |
Change vs. 2015 |
|||||||||||||
| Weather Data |
||||||||||||||||
| Degree Days - Actual |
17 | NA | 2,838 | -20.2 | % | |||||||||||
| Degree Days - Normal |
30 | 3,065 | ||||||||||||||
| * | CSG rate included in non-firm sales |
| ** | Primarily Appliance Service. |
Attachment 9
PSEG POWER LLC
Generation Measures*
(Unaudited)
| GWhr Breakdown | GWhr Breakdown | |||||||||||||||
| Three Months Ended | Nine Months Ended | |||||||||||||||
| September 30, | September 30, | |||||||||||||||
| 2016 | 2015 | 2016 | 2015 | |||||||||||||
| Nuclear - NJ |
4,151 | 5,393 | 13,878 | 15,249 | ||||||||||||
| Nuclear - PA |
2,712 | 2,394 | 8,387 | 7,499 | ||||||||||||
|
|
|
|
|
|
|
|
|
|||||||||
| Total Nuclear |
6,863 | 7,787 | 22,265 | 22,748 | ||||||||||||
| Fossil - Coal/Natural Gas - NJ** |
257 | 72 | 198 | 542 | ||||||||||||
| Fossil - Coal - PA |
1,190 | 1,108 | 3,138 | 3,853 | ||||||||||||
| Fossil - Coal - CT |
46 | 12 | 96 | 600 | ||||||||||||
|
|
|
|
|
|
|
|
|
|||||||||
| Total Coal |
1,493 | 1,192 | 3,432 | 4,995 | ||||||||||||
| Fossil - Oil & Natural Gas - NJ |
4,234 | 4,160 | 10,089 | 10,932 | ||||||||||||
| Fossil - Oil & Natural Gas - NY |
1,482 | 1,547 | 3,940 | 3,691 | ||||||||||||
| Fossil - Oil & Natural Gas - CT |
38 | 32 | 30 | 122 | ||||||||||||
|
|
|
|
|
|
|
|
|
|||||||||
| Total Oil & Natural Gas |
5,754 | 5,739 | 14,059 | 14,745 | ||||||||||||
|
|
|
|
|
|
|
|
|
|||||||||
| 14,110 | 14,718 | 39,756 | 42,488 | |||||||||||||
| % Generation by Fuel Type | % Generation by Fuel Type | |||||||||||||||
| Three Months Ended | Nine Months Ended | |||||||||||||||
| September 30, | September 30, | |||||||||||||||
| 2016 | 2015 | 2016 | 2015 | |||||||||||||
| Nuclear - NJ |
29 | % | 37 | % | 35 | % | 36 | % | ||||||||
| Nuclear - PA |
19 | % | 16 | % | 21 | % | 18 | % | ||||||||
|
|
|
|
|
|
|
|
|
|||||||||
| Total Nuclear |
48 | % | 53 | % | 56 | % | 54 | % | ||||||||
| Fossil - Coal/Natural Gas - NJ** |
2 | % | 0 | % | 1 | % | 1 | % | ||||||||
| Fossil - Coal - PA |
9 | % | 8 | % | 8 | % | 9 | % | ||||||||
| Fossil - Coal - CT |
0 | % | 0 | % | 0 | % | 1 | % | ||||||||
|
|
|
|
|
|
|
|
|
|||||||||
| Total Coal |
11 | % | 8 | % | 9 | % | 11 | % | ||||||||
| Fossil - Oil & Natural Gas - NJ |
30 | % | 28 | % | 25 | % | 26 | % | ||||||||
| Fossil - Oil & Natural Gas - NY |
11 | % | 11 | % | 10 | % | 9 | % | ||||||||
| Fossil - Oil & Natural Gas - CT |
0 | % | 0 | % | 0 | % | 0 | % | ||||||||
|
|
|
|
|
|
|
|
|
|||||||||
| Total Oil & Natural Gas |
41 | % | 39 | % | 35 | % | 35 | % | ||||||||
|
|
|
|
|
|
|
|
|
|||||||||
| 100 | % | 100 | % | 100 | % | 100 | % | |||||||||
| * | Excludes Solar and Kalaeloa |
| ** | Includes Pumped Storage. Pumped Storage accounted for <1% of total generation for the three and nine months ended September 30, 2016 and 2015. Generation includes natural gas fuel switching intervals. |
Attachment 10
PUBLIC SERVICE ENTERPRISE GROUP INCORPORATED
Statistical Measures
(Unaudited)
| Three Months Ended | Nine Months Ended | |||||||||||||||
| September 30, | September 30, | |||||||||||||||
| 2016 | 2015 | 2016 | 2015 | |||||||||||||
| Weighted Average Common Shares Outstanding (millions) |
|
|||||||||||||||
| Basic |
505 | 505 | 505 | 505 | ||||||||||||
| Diluted |
508 | 508 | 508 | 508 | ||||||||||||
| Stock Price at End of Period |
$ | 41.87 | $ | 42.16 | ||||||||||||
| Dividends Paid per Share of Common Stock |
$ | 0.41 | $ | 0.39 | $ | 1.23 | $ | 1.17 | ||||||||
| Dividend Yield |
3.9 | % | 3.7 | % | ||||||||||||
| Book Value per Common Share |
$ | 26.69 | $ | 25.90 | ||||||||||||
| Market Price as a Percent of Book Value |
157 | % | 165 | % | ||||||||||||
| Total Shareholder Return |
-9.3 | % | 8.4 | % | 11.3 | % | 4.9 | % | ||||||||
Attachment 11
PUBLIC SERVICE ENTERPRISE GROUP INCORPORATED
Consolidated Operating Earnings (non-GAAP) Reconciliation
| Three Months Ended | Nine Months Ended | |||||||||||||||
| Reconciling Items | September 30, | September 30, | ||||||||||||||
| 2016 | 2015 | 2016 | 2015 | |||||||||||||
| ($ millions, Unaudited) | ||||||||||||||||
| Net Income |
$ | 327 | $ | 439 | $ | 985 | $ | 1,370 | ||||||||
| (Gain) Loss on Nuclear Decommissioning Trust (NDT) Fund Related Activity, pre-tax (PSEG Power) |
(4 | ) | 24 | 4 | 14 | |||||||||||
| (Gain) Loss on Mark-to-Market (MTM), pre-tax(a) (PSEG Power) |
(58 | ) | (84 | ) | 91 | (98 | ) | |||||||||
| Storm O&M, net of insurance recoveries, pre-tax (PSEG Power) |
— | — | — | (172 | ) | |||||||||||
| Hudson/Mercer Early Retirement, pre-tax (PSEG Power) |
114 | — | 114 | — | ||||||||||||
| Lease Related Activity, pre-tax (PSEG Enterprise/Other) |
137 | — | 137 | — | ||||||||||||
| Income Taxes related to Operating Earnings (non-GAAP) reconciling items(b) |
(72 | ) | 24 | (135 | ) | 107 | ||||||||||
|
|
|
|
|
|
|
|
|
|||||||||
| Operating Earnings (non-GAAP) |
$ | 444 | $ | 403 | $ | 1,196 | $ | 1,221 | ||||||||
|
|
|
|
|
|
|
|
|
|||||||||
| Fully Diluted Average Shares Outstanding (in millions) |
508 | 508 | 508 | 508 | ||||||||||||
|
|
|
|
|
|
|
|
|
|||||||||
| ($ Per Share Impact - Diluted, Unaudited) | ||||||||||||||||
| Net Income |
$ | 0.64 | $ | 0.87 | $ | 1.94 | $ | 2.70 | ||||||||
| (Gain) Loss on NDT Fund Related Activity, pre-tax (PSEG Power) |
— | 0.05 | 0.01 | 0.03 | ||||||||||||
| (Gain) Loss on MTM, pre-tax(a) (PSEG Power) |
(0.11 | ) | (0.17 | ) | 0.18 | (0.19 | ) | |||||||||
| Storm O&M, net of insurance recoveries, pre-tax (PSEG Power) |
— | — | — | (0.34 | ) | |||||||||||
| Hudson/Mercer Early Retirement, pre-tax (PSEG Power) |
0.22 | — | 0.22 | — | ||||||||||||
| Lease Related Activity, pre-tax (PSEG Enterprise/Other) |
0.27 | — | 0.27 | — | ||||||||||||
| Income Taxes related to Operating Earnings (non-GAAP) reconciling items(b) |
(0.14 | ) | 0.05 | (0.26 | ) | 0.21 | ||||||||||
|
|
|
|
|
|
|
|
|
|||||||||
| Operating Earnings (non-GAAP) |
$ | 0.88 | $ | 0.80 | $ | 2.36 | $ | 2.41 | ||||||||
|
|
|
|
|
|
|
|
|
|||||||||
| (a) | Includes the financial impact from positions with forward delivery months. |
| (b) | Income tax effect calculated at 40.85% statutory rate, except for lease related activity which is calculated at a combined leveraged lease effective tax rate of 37% and NDT related activity which is calculated at the 40.85% statutory rate plus a 20% tax on income (losses) from qualified NDT funds. |
Attachment 12
PSEG Power Adjusted EBITDA (non-GAAP) Reconciliation
| Three Months Ended | Nine Months Ended | |||||||||||||||
| Reconciling Items | September 30, | September 30, | ||||||||||||||
| 2016 | 2015 | 2016 | 2015 | |||||||||||||
| ($ millions, Unaudited) | ||||||||||||||||
| Net Income (Loss) |
$ | 139 | $ | 206 | $ | 320 | $ | 707 | ||||||||
| (Gain) Loss on NDT Fund Related Activity, pre-tax |
(4 | ) | 24 | 4 | 14 | |||||||||||
| (Gain) Loss on MTM, pre-tax (a) |
(58 | ) | (84 | ) | 91 | (98 | ) | |||||||||
| Storm O&M, net of insurance recoveries, pre-tax |
— | — | — | (172 | ) | |||||||||||
| Hudson/Mercer Early Retirement, pre-tax |
114 | — | 114 | — | ||||||||||||
| Income Taxes related to Operating Earnings (non-GAAP) reconciling items(b) |
(21 | ) | 24 | (84 | ) | 107 | ||||||||||
|
|
|
|
|
|
|
|
|
|||||||||
| Operating Earnings (non-GAAP) |
$ | 170 | $ | 170 | $ | 445 | $ | 558 | ||||||||
| Fossil Major Maintenance, pre-tax |
10 | 10 | 39 | 111 | ||||||||||||
| Depreciation and Amortization, pre-tax (c) |
83 | 76 | 244 | 228 | ||||||||||||
| Interest Expense, pre-tax (c) (d) |
23 | 30 | 65 | 93 | ||||||||||||
| Income Taxes (c) |
111 | 115 | 292 | 338 | ||||||||||||
|
|
|
|
|
|
|
|
|
|||||||||
| Adjusted EBITDA (non-GAAP) |
$ | 397 | $ | 401 | $ | 1,085 | $ | 1,328 | ||||||||
|
|
|
|
|
|
|
|
|
|||||||||
| (a) | Includes the financial impact from positions with forward delivery months. |
| (b) | Income tax effect calculated at 40.85% statutory rate, except for lease related activity which is calculated at a combined leveraged lease effective tax rate of 37% and NDT related activity which is calculated at the 40.85% statutory rate plus a 20% tax on income (losses) from qualified NDT funds. |
| (c) | Excludes amounts related to Operating Earnings (non-GAAP) reconciling items. |
| (d) | Net of capitalized interest. |
| PSEG Power Adjusted EBITDA (non-GAAP) Guidance - 2016 Adjustments |
Full-Year 2016 | |
| ($ millions, unaudited) | ||
| Fossil Major Maintenance, pre-tax, estimate |
~ $80 | |
| Depreciation and Amortization, pre-tax, estimate |
~ $340 | |
| Interest Expense, pre-tax, estimate |
~ $80 | |
| Income Taxes, estimate |
$310 to $335 |
PSEG Enterprise/Other
Operating Earnings (non-GAAP) Reconciliation
| Three Months Ended | Nine Months Ended | |||||||||||||||
| Reconciling Items | September 30, | September 30, | ||||||||||||||
| 2016 | 2015 | 2016 | 2015 | |||||||||||||
| ($ millions, Unaudited) | ||||||||||||||||
| Net Income (Loss) |
$ | (67 | ) | $ | 11 | $ | (31 | ) | $ | 32 | ||||||
| Lease Related Activity, pre-tax |
137 | — | 137 | — | ||||||||||||
| Income Taxes related to Operating Earnings (non-GAAP) reconciling items(a) |
(51 | ) | — | (51 | ) | — | ||||||||||
|
|
|
|
|
|
|
|
|
|||||||||
| Operating Earnings (non-GAAP) |
$ | 19 | $ | 11 | $ | 55 | $ | 32 | ||||||||
|
|
|
|
|
|
|
|
|
|||||||||
| (a) | Income tax effect calculated at a combined leveraged lease effective tax rate of 37%. |