Attached files
| file | filename |
|---|---|
| EX-99.1 - EXHIBIT 99.1 - Hi-Crush Inc. | exhibit991-earningsrelease.htm |
| 8-K - 8-K - Hi-Crush Inc. | q316-earningsrelease8xk.htm |
INVESTOR PRESENTATION
NOVEMBER 2016
Forward Looking Statements
Some of the information included herein may contain forward-looking statements within the meaning of the federal securities laws. Forward-
looking statements give our current expectations and may contain projections of results of operations or of financial condition, or forecasts of
future events. Words such as “may,” “assume,” “forecast,” “position,” “predict,” “strategy,” “expect,” “intend,” “plan,” “estimate,” “anticipate,”
“could,” “believe,” “project,” “budget,” “potential,” or “continue,” and similar expressions are used to identify forward-looking statements. They
can be affected by assumptions used or by known or unknown risks or uncertainties. Consequently, no expected results of operations or
financial condition or other forward-looking statements can be guaranteed. When considering these forward-looking statements, you should
keep in mind the risk factors and other cautionary statements in Hi-Crush Partners LP’s (“Hi-Crush”) reports filed with the Securities and
Exchange Commission (“SEC”), including those described under Item 1A, “Risk Factors” of Hi-Crush’s Annual Report on Form 10-K for the
fiscal year ended December 31, 2015 and any subsequently filed Quarterly Report on Form 10-Q. Actual results may vary materially. You are
cautioned not to place undue reliance on any forward-looking statements. You should also understand that it is not possible to predict or
identify all such factors and should not consider the risk factors in our reports filed with the SEC or the following list to be a complete
statement of all potential risks and uncertainties. Factors that could cause our actual results to differ materially from the results contemplated
by such forward-looking statements include: whether we are able to complete the Blair acquisition, the volume of frac sand we are able to sell;
the price at which we are able to sell frac sand; the outcome of any litigation, claims or assessments, including unasserted claims; changes in
the price and availability of natural gas or electricity; changes in prevailing economic conditions; and difficulty collecting receivables. All
forward-looking statements are expressly qualified in their entirety by the foregoing cautionary statements. Hi-Crush’s forward-looking
statements speak only as of the date made and Hi-Crush undertakes no obligation to update or revise its forward-looking statements, whether
as a result of new information, future events or otherwise.
2
Taking Steps to Capture Value During the Recovery
3
Positioning and
Strategically Investing
for the Recovery
• Augusta restart: Announced
restart of our Augusta facility to
meet increased customer
demand and strategically serve
volumes in high-activity areas
• Blair drop down: Completed
accretive acquisition of low-
cost Blair facility at attractive
price from sponsor (Hi-Crush
Proppants); allows HCLP to
fully participate in the recovery
• Developed last-mile solution:
Announced PropStream™
integrated delivery solution,
expanding logistics capabilities
all the way to the well site
Focusing on Profit while
Partnering with Long-Term
Customers
• Cost management: Taken
actions to ensure a lean cost
structure across our business
and entire sand supply chain
• Fleet & system management:
Pushed out railcar deliveries
and reduced lease rates;
Optimizing origin / destination
pairings to minimize freight
costs and efficiently manage
our railcar fleet
• Contract amendments:
Amended contracts with major
customers signaling
commitment to relationship
Enhancing Liquidity &
Maintaining Capital
Flexibility
• Blair financing: Primary
common unit offering financed
cash portion of Blair acquisition
with no new debt; $90mm+ net
liquidity remaining
• ~$190mm of proceeds in
2016: Completed three primary
common unit offerings raising
~$190mm of net proceeds;
strengthened capital position;
executed revolver amendment
to improve flexibility
• Flexible capex: Capex budget
remains flexible for highly
strategic investments; low
maintenance capex
requirement of $3-5mm per
year
PropStream – Streamlining the Supply Chain
4
Strategic Overview
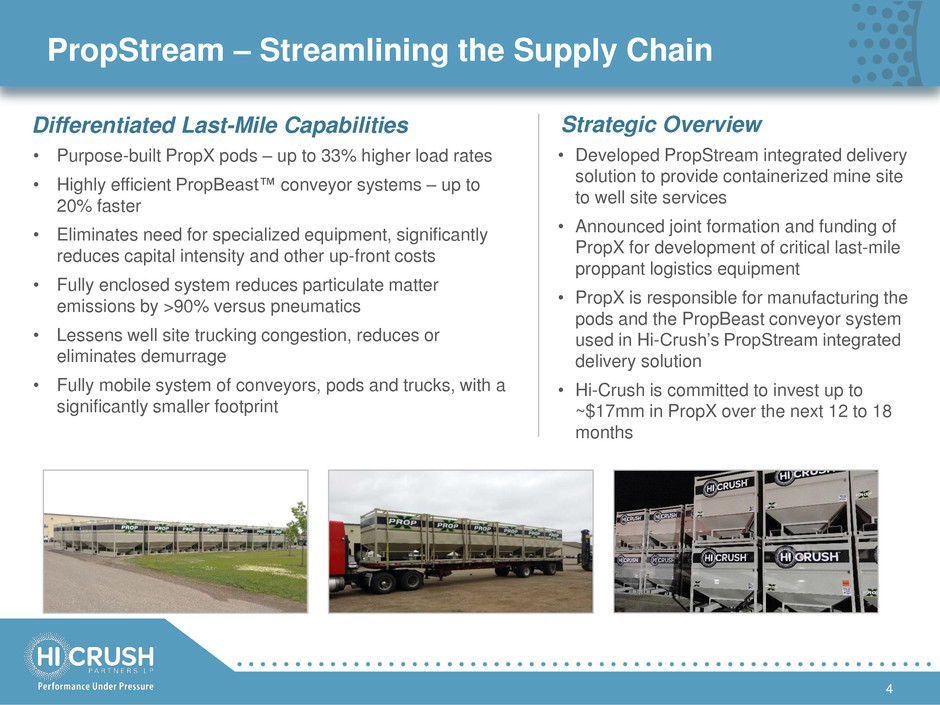
• Developed PropStream integrated delivery
solution to provide containerized mine site
to well site services
• Announced joint formation and funding of
PropX for development of critical last-mile
proppant logistics equipment
• PropX is responsible for manufacturing the
pods and the PropBeast conveyor system
used in Hi-Crush’s PropStream integrated
delivery solution
• Hi-Crush is committed to invest up to
~$17mm in PropX over the next 12 to 18
months
Differentiated Last-Mile Capabilities
• Purpose-built PropX pods – up to 33% higher load rates
• Highly efficient PropBeast™ conveyor systems – up to
20% faster
• Eliminates need for specialized equipment, significantly
reduces capital intensity and other up-front costs
• Fully enclosed system reduces particulate matter
emissions by >90% versus pneumatics
• Lessens well site trucking congestion, reduces or
eliminates demurrage
• Fully mobile system of conveyors, pods and trucks, with a
significantly smaller footprint
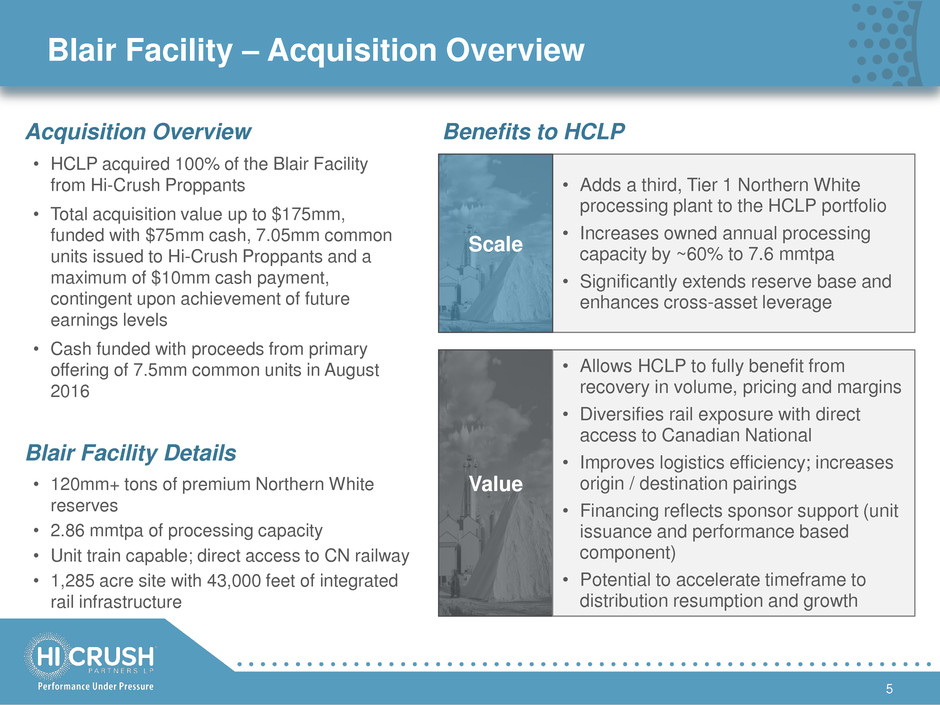
• Adds a third, Tier 1 Northern White
processing plant to the HCLP portfolio
• Increases owned annual processing
capacity by ~60% to 7.6 mmtpa
• Significantly extends reserve base and
enhances cross-asset leverage
Blair Facility – Acquisition Overview
5
Scale
Value
• Allows HCLP to fully benefit from
recovery in volume, pricing and margins
• Diversifies rail exposure with direct
access to Canadian National
• Improves logistics efficiency; increases
origin / destination pairings
• Financing reflects sponsor support (unit
issuance and performance based
component)
• Potential to accelerate timeframe to
distribution resumption and growth
Acquisition Overview Benefits to HCLP
• HCLP acquired 100% of the Blair Facility
from Hi-Crush Proppants
• Total acquisition value up to $175mm,
funded with $75mm cash, 7.05mm common
units issued to Hi-Crush Proppants and a
maximum of $10mm cash payment,
contingent upon achievement of future
earnings levels
• Cash funded with proceeds from primary
offering of 7.5mm common units in August
2016
Blair Facility Details
• 120mm+ tons of premium Northern White
reserves
• 2.86 mmtpa of processing capacity
• Unit train capable; direct access to CN railway
• 1,285 acre site with 43,000 feet of integrated
rail infrastructure
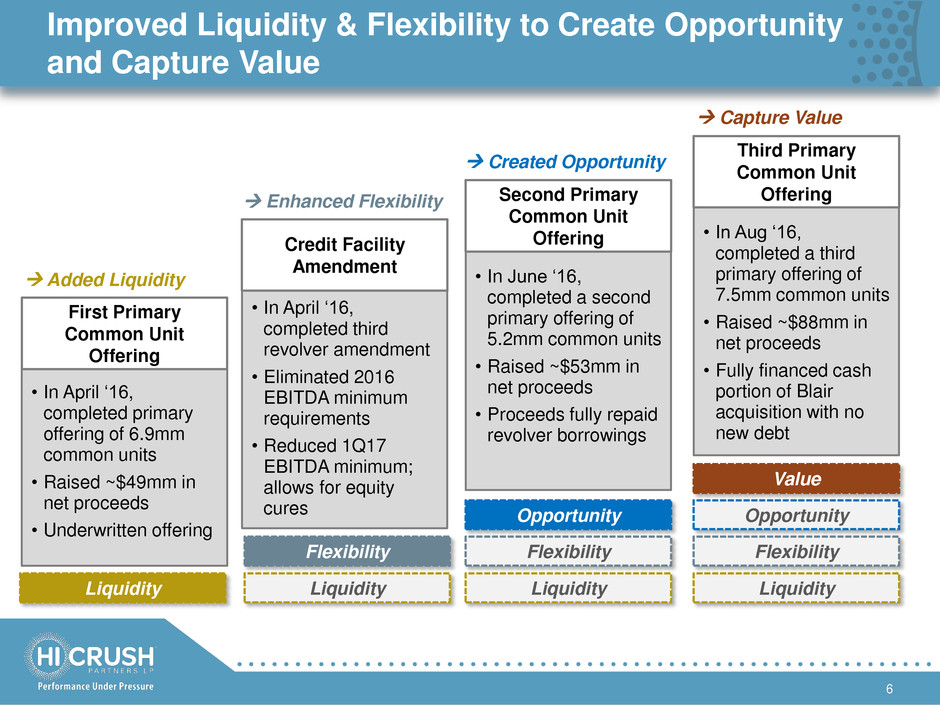
Improved Liquidity & Flexibility to Create Opportunity
and Capture Value
6
• In April ‘16,
completed primary
offering of 6.9mm
common units
• Raised ~$49mm in
net proceeds
• Underwritten offering
• In April ‘16,
completed third
revolver amendment
• Eliminated 2016
EBITDA minimum
requirements
• Reduced 1Q17
EBITDA minimum;
allows for equity
cures
• In June ‘16,
completed a second
primary offering of
5.2mm common units
• Raised ~$53mm in
net proceeds
• Proceeds fully repaid
revolver borrowings
First Primary
Common Unit
Offering
Credit Facility
Amendment
Second Primary
Common Unit
Offering
Liquidity Liquidity Liquidity
Flexibility Flexibility
Opportunity
Added Liquidity
Enhanced Flexibility
Created Opportunity
• In Aug ‘16,
completed a third
primary offering of
7.5mm common units
• Raised ~$88mm in
net proceeds
• Fully financed cash
portion of Blair
acquisition with no
new debt
Third Primary
Common Unit
Offering
Liquidity
Flexibility
Opportunity
Capture Value
Value
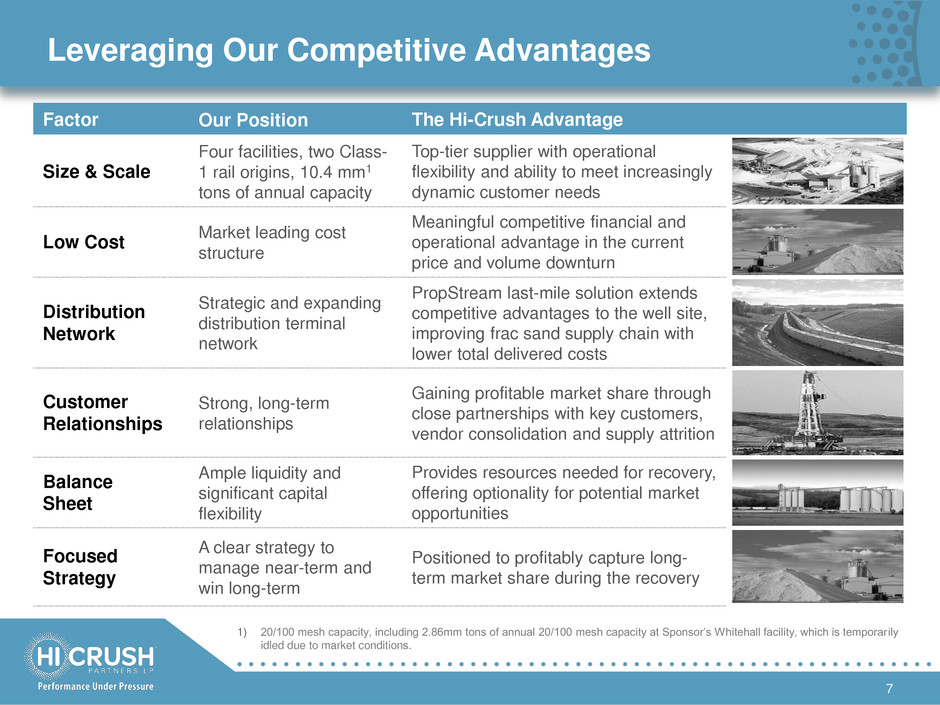
Leveraging Our Competitive Advantages
7
1) 20/100 mesh capacity, including 2.86mm tons of annual 20/100 mesh capacity at Sponsor’s Whitehall facility, which is temporar ily
idled due to market conditions.
Factor Our Position The Hi-Crush Advantage
Size & Scale
Four facilities, two Class-
1 rail origins, 10.4 mm1
tons of annual capacity
Top-tier supplier with operational
flexibility and ability to meet increasingly
dynamic customer needs
Low Cost
Market leading cost
structure
Meaningful competitive financial and
operational advantage in the current
price and volume downturn
Distribution
Network
Strategic and expanding
distribution terminal
network
PropStream last-mile solution extends
competitive advantages to the well site,
improving frac sand supply chain with
lower total delivered costs
Customer
Relationships
Strong, long-term
relationships
Gaining profitable market share through
close partnerships with key customers,
vendor consolidation and supply attrition
Balance
Sheet
Ample liquidity and
significant capital
flexibility
Provides resources needed for recovery,
offering optionality for potential market
opportunities
Focused
Strategy
A clear strategy to
manage near-term and
win long-term
Positioned to profitably capture long-
term market share during the recovery
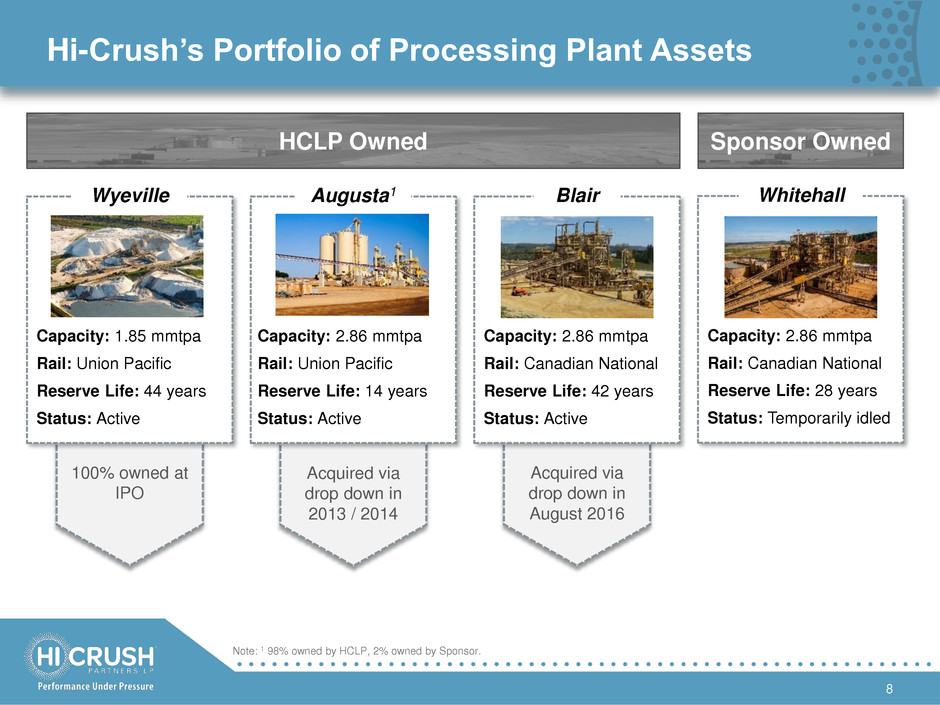
Acquired via
drop down in
August 2016
100% owned at
IPO
Acquired via
drop down in
2013 / 2014
Hi-Crush’s Portfolio of Processing Plant Assets
8
Wyeville
Capacity: 1.85 mmtpa
Rail: Union Pacific
Reserve Life: 44 years
Status: Active
Augusta1
Capacity: 2.86 mmtpa
Rail: Union Pacific
Reserve Life: 14 years
Status: Active
Blair
Capacity: 2.86 mmtpa
Rail: Canadian National
Reserve Life: 42 years
Status: Active
Whitehall
Capacity: 2.86 mmtpa
Rail: Canadian National
Reserve Life: 28 years
Status: Temporarily idled
HCLP Owned Sponsor Owned
Note: 1 98% owned by HCLP, 2% owned by Sponsor.
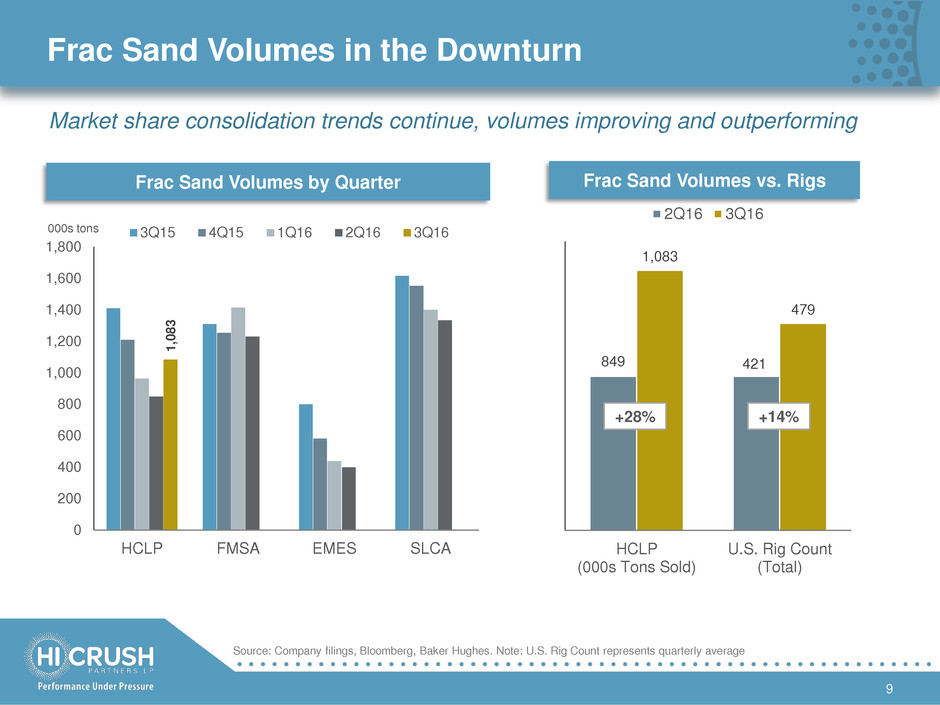
Frac Sand Volumes in the Downturn
9
Source: Company filings, Bloomberg, Baker Hughes. Note: U.S. Rig Count represents quarterly average
1
,0
8
3
0
200
400
600
800
1,000
1,200
1,400
1,600
1,800
HCLP FMSA EMES SLCA
000s tons 3Q15 4Q15 1Q16 2Q16 3Q16
849 421
1,083
479
1
1
1
1
1
1
1
1
HCLP
(000s Tons Sold)
U.S. Rig Count
(Total)
2Q16 3Q16
+28%
Frac Sand Volumes by Quarter Frac Sand Volumes vs. Rigs
Market share consolidation trends continue, volumes improving and outperforming
+14%
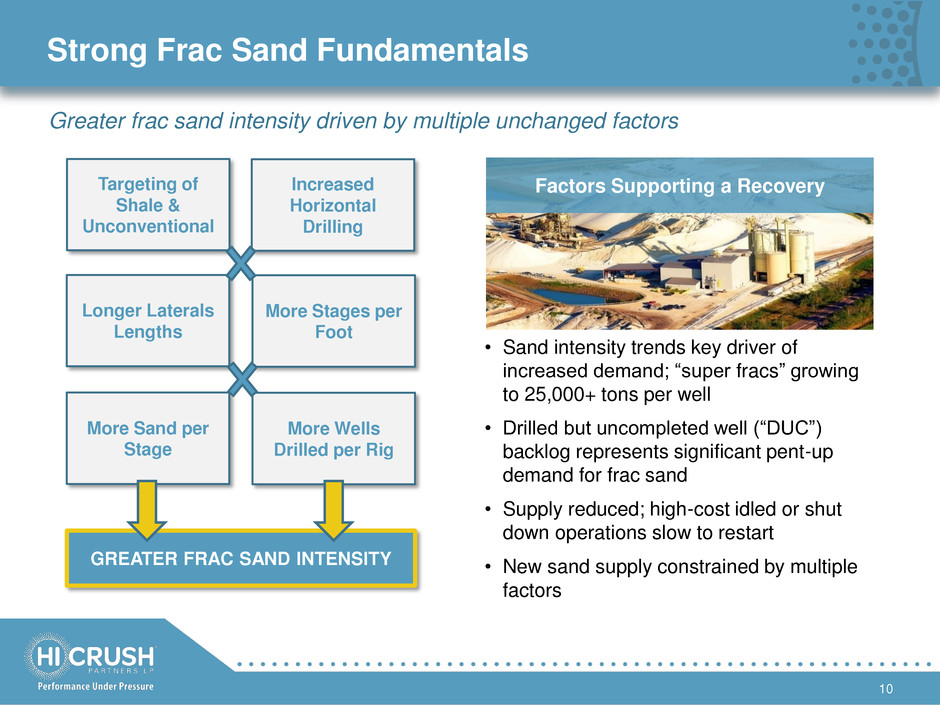
Strong Frac Sand Fundamentals
10
Factors Supporting a Recovery
• Sand intensity trends key driver of
increased demand; “super fracs” growing
to 25,000+ tons per well
• Drilled but uncompleted well (“DUC”)
backlog represents significant pent-up
demand for frac sand
• Supply reduced; high-cost idled or shut
down operations slow to restart
• New sand supply constrained by multiple
factors
Targeting of
Shale &
Unconventional
Increased
Horizontal
Drilling
Longer Laterals
Lengths
More Stages per
Foot
More Sand per
Stage
More Wells
Drilled per Rig
GREATER FRAC SAND INTENSITY
Greater frac sand intensity driven by multiple unchanged factors

Rig & Completion Rate Impact on Sand Demand1
11
10 rigs
20 days
18 wells
18 wells
200 wells
2,500 tons
450,000
tons
Rig Count
# of rigs
Rig Efficiency
Days/well drilled
Rig Productivity
Wells drilled/year/rig
Completions
Well completions/year/rig
Wells Completed
Well completions/year
Sand Usage
Tons/well
Company XYZ Demand
Tons/year
5 rigs
17 days
22 wells
17 wells
85 wells
4,500 tons
382,500
tons
-50%
+18%
Calculated
-6%
Calculated
+80%
-15%
Before Downturn Company XYZ
1) Hypothetical example for illustrative purposes only; some results rounded
6 rigs
17 days
22 wells
24 wells
144 wells
4,500 tons
648,000
tons
Recovery
+20%
-
Calculated
+41%
Calculated
-
+70%
- DUC Inventory Drawdown
DUCs completed/year
- 2 wells
- DUC Inventory Build
DUCs added/year
5 wells -

Incentivized Management Team
12
39% 61%
100%
100%
98%
100% 100%
67.5% LP 32.5% LP, IDRs
Note: 1 Blair facility acquired by HCLP from Sponsor on August 31, 2016.
2 2% of Augusta owned by Sponsor.
Wyeville Augusta2
Whitehall
Hi-Crush Proppants
LLC (Sponsor)
Avista Capital Parters
and Co-Investors
Management &
Directors
Hi-Crush
Partners LP
(NYSE: HCLP)
Public
Unitholders
Operating
Subsidiaries
Hi-Crush GP
LLC (General
Partner)
Blair1
100%
Hi-Crush Operations
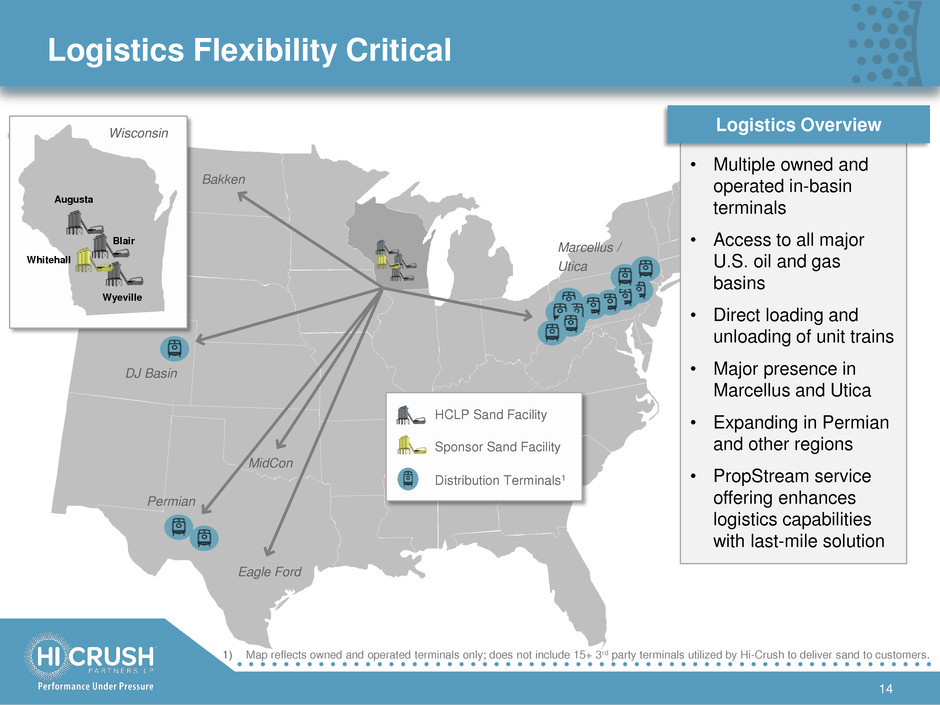
Logistics Flexibility Critical
14
1) Map reflects owned and operated terminals only; does not include 15+ 3rd party terminals utilized by Hi-Crush to deliver sand to customers.
• Multiple owned and
operated in-basin
terminals
• Access to all major
U.S. oil and gas
basins
• Direct loading and
unloading of unit trains
• Major presence in
Marcellus and Utica
• Expanding in Permian
and other regions
• PropStream service
offering enhances
logistics capabilities
with last-mile solution
HCLP Sand Facility
Sponsor Sand Facility
Distribution Terminals1
Bakken
DJ Basin
Permian
MidCon
Eagle Ford
Marcellus /
Utica
Wisconsin
Augusta
Wyeville
Whitehall
Blair
Logistics Overview
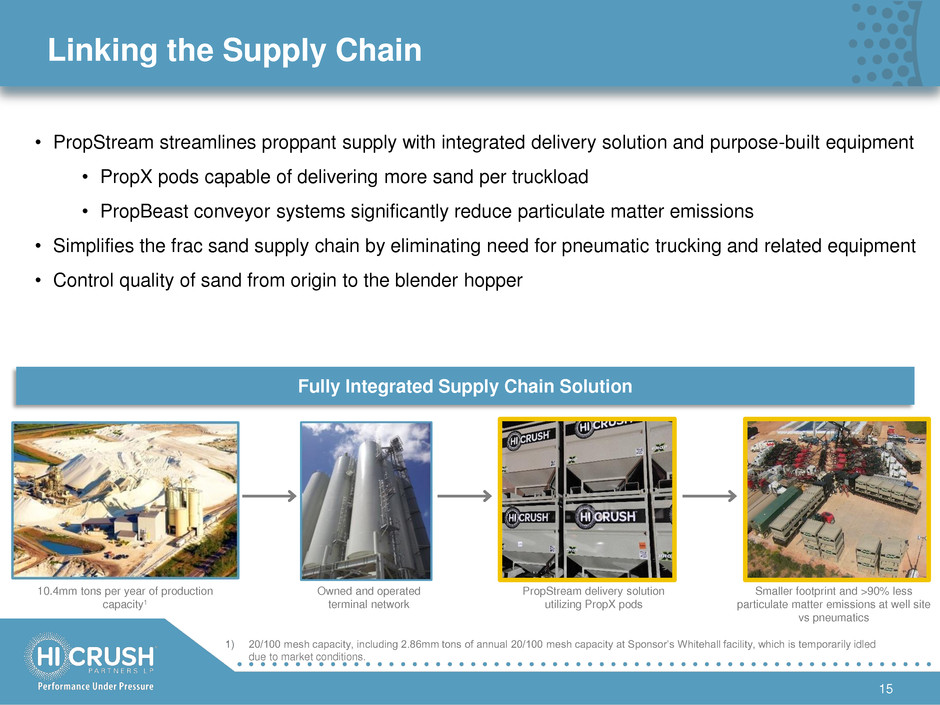
Linking the Supply Chain
15
Fully Integrated Supply Chain Solution
• PropStream streamlines proppant supply with integrated delivery solution and purpose-built equipment
• PropX pods capable of delivering more sand per truckload
• PropBeast conveyor systems significantly reduce particulate matter emissions
• Simplifies the frac sand supply chain by eliminating need for pneumatic trucking and related equipment
• Control quality of sand from origin to the blender hopper
10.4mm tons per year of production
capacity1
Owned and operated
terminal network
PropStream delivery solution
utilizing PropX pods
Smaller footprint and >90% less
particulate matter emissions at well site
vs pneumatics
1) 20/100 mesh capacity, including 2.86mm tons of annual 20/100 mesh capacity at Sponsor’s Whitehall facility, which is temporarily idled
due to market conditions.
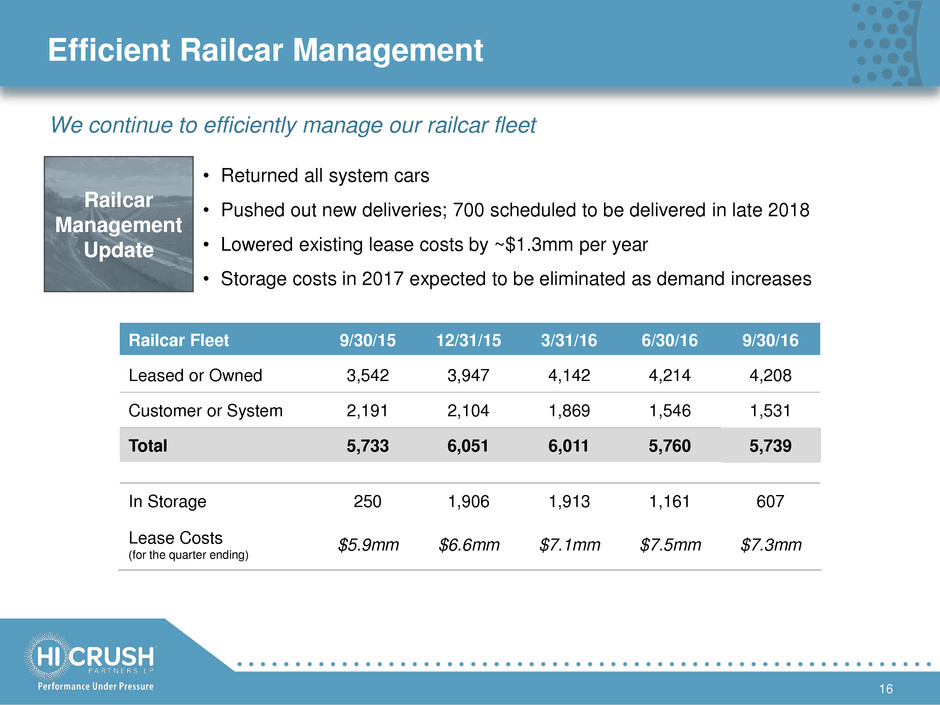
Efficient Railcar Management
16
Railcar Fleet 9/30/15 12/31/15 3/31/16 6/30/16 9/30/16
Leased or Owned 3,542 3,947 4,142 4,214 4,208
Customer or System 2,191 2,104 1,869 1,546 1,531
Total 5,733 6,051 6,011 5,760 5,739
In Storage 250 1,906 1,913 1,161 607
Lease Costs
(for the quarter ending)
$5.9mm $6.6mm $7.1mm $7.5mm $7.3mm
• Returned all system cars
• Pushed out new deliveries; 700 scheduled to be delivered in late 2018
• Lowered existing lease costs by ~$1.3mm per year
• Storage costs in 2017 expected to be eliminated as demand increases
Railcar
Management
Update
We continue to efficiently manage our railcar fleet
Financial Results
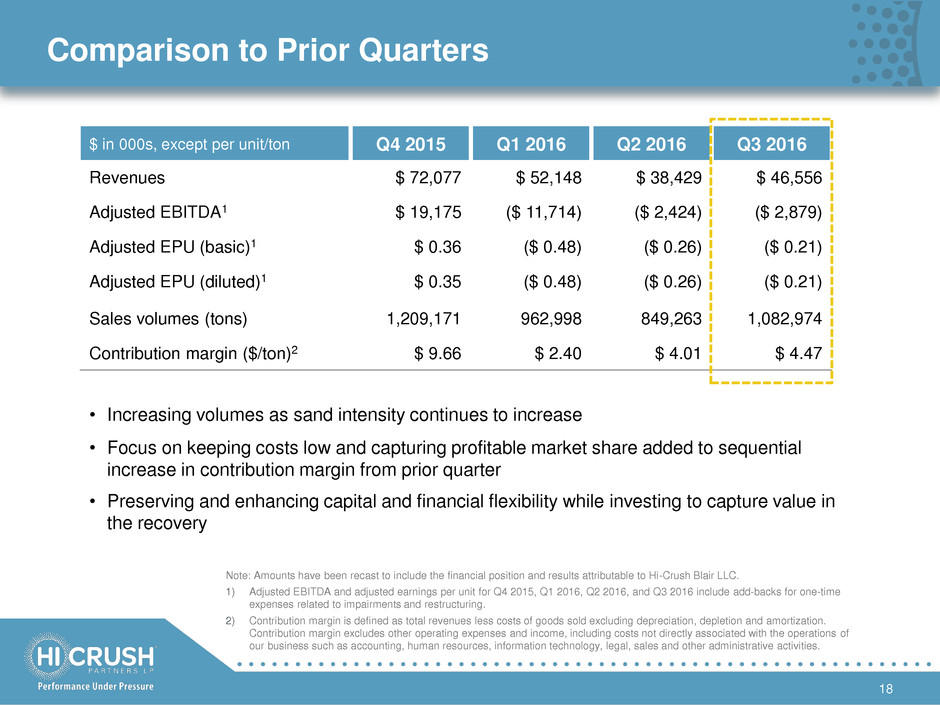
Comparison to Prior Quarters
18
$ in 000s, except per unit/ton Q4 2015 Q1 2016 Q2 2016 Q3 2016
Revenues $ 72,077 $ 52,148 $ 38,429 $ 46,556
Adjusted EBITDA1 $ 19,175 ($ 11,714) ($ 2,424) ($ 2,879)
Adjusted EPU (basic)1 $ 0.36 ($ 0.48) ($ 0.26) ($ 0.21)
Adjusted EPU (diluted)1 $ 0.35 ($ 0.48) ($ 0.26) ($ 0.21)
Sales volumes (tons) 1,209,171 962,998 849,263 1,082,974
Contribution margin ($/ton)2 $ 9.66 $ 2.40 $ 4.01 $ 4.47
Note: Amounts have been recast to include the financial position and results attributable to Hi-Crush Blair LLC.
1) Adjusted EBITDA and adjusted earnings per unit for Q4 2015, Q1 2016, Q2 2016, and Q3 2016 include add-backs for one-time
expenses related to impairments and restructuring.
2) Contribution margin is defined as total revenues less costs of goods sold excluding depreciation, depletion and amortization.
Contribution margin excludes other operating expenses and income, including costs not directly associated with the operations of
our business such as accounting, human resources, information technology, legal, sales and other administrative activities.
• Increasing volumes as sand intensity continues to increase
• Focus on keeping costs low and capturing profitable market share added to sequential
increase in contribution margin from prior quarter
• Preserving and enhancing capital and financial flexibility while investing to capture value in
the recovery
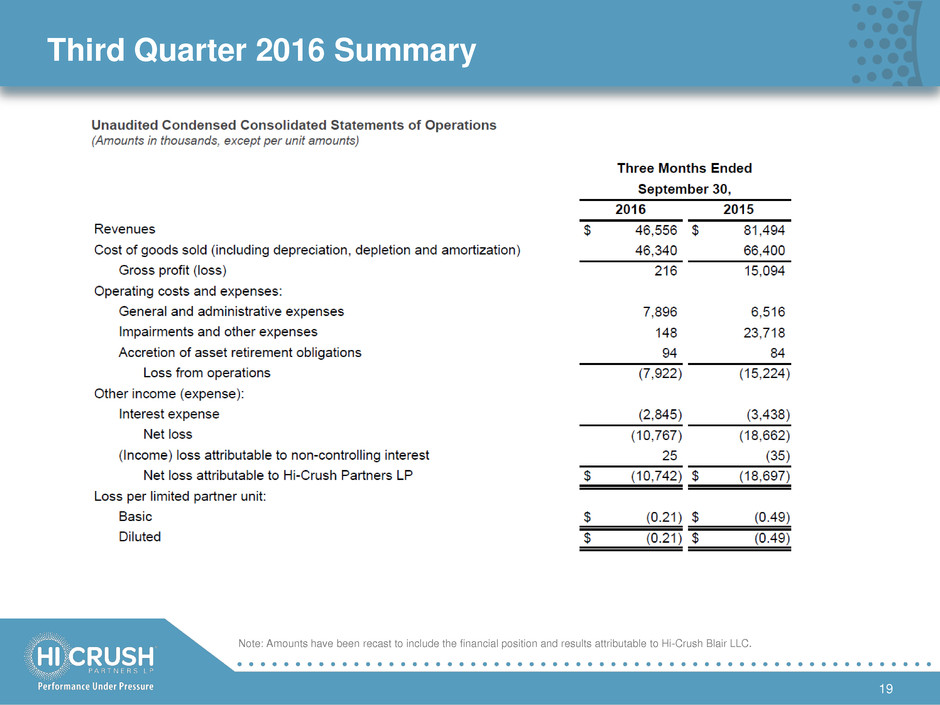
Third Quarter 2016 Summary
19
Note: Amounts have been recast to include the financial position and results attributable to Hi-Crush Blair LLC.
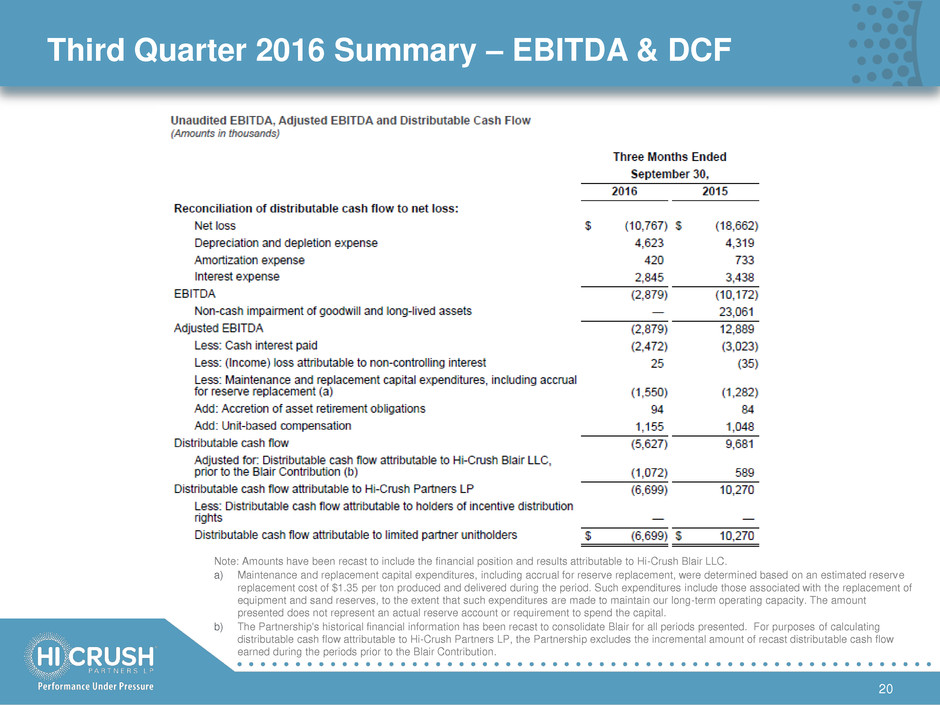
Third Quarter 2016 Summary – EBITDA & DCF
20
Note: Amounts have been recast to include the financial position and results attributable to Hi-Crush Blair LLC.
a) Maintenance and replacement capital expenditures, including accrual for reserve replacement, were determined based on an estimated reserve
replacement cost of $1.35 per ton produced and delivered during the period. Such expenditures include those associated with the replacement of
equipment and sand reserves, to the extent that such expenditures are made to maintain our long-term operating capacity. The amount
presented does not represent an actual reserve account or requirement to spend the capital.
b) The Partnership's historical financial information has been recast to consolidate Blair for all periods presented. For purposes of calculating
distributable cash flow attributable to Hi-Crush Partners LP, the Partnership excludes the incremental amount of recast distributable cash flow
earned during the periods prior to the Blair Contribution.
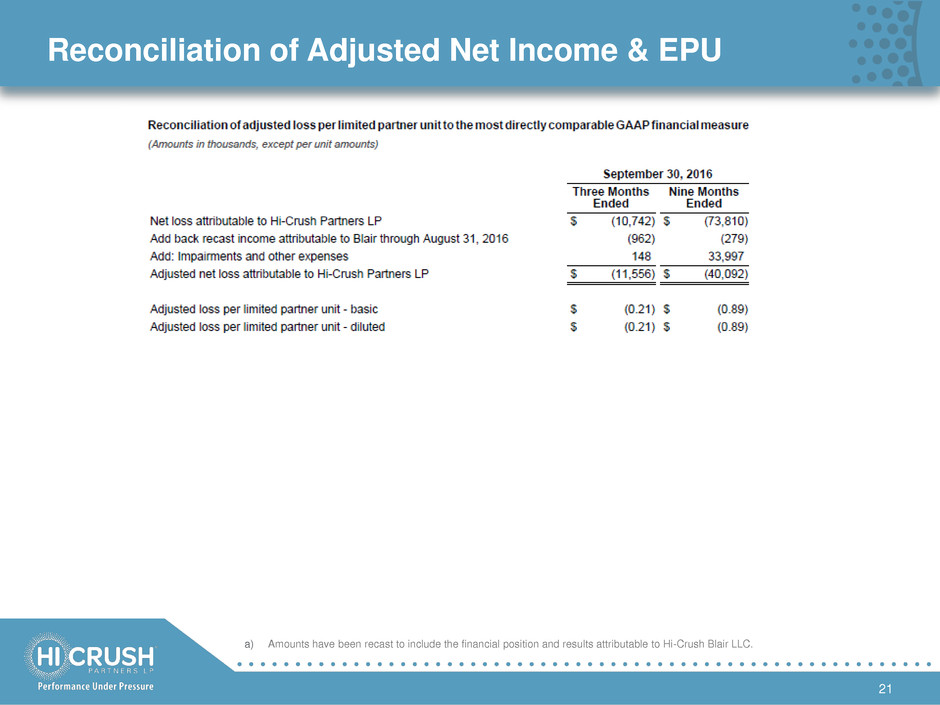
Reconciliation of Adjusted Net Income & EPU
21
a) Amounts have been recast to include the financial position and results attributable to Hi-Crush Blair LLC.
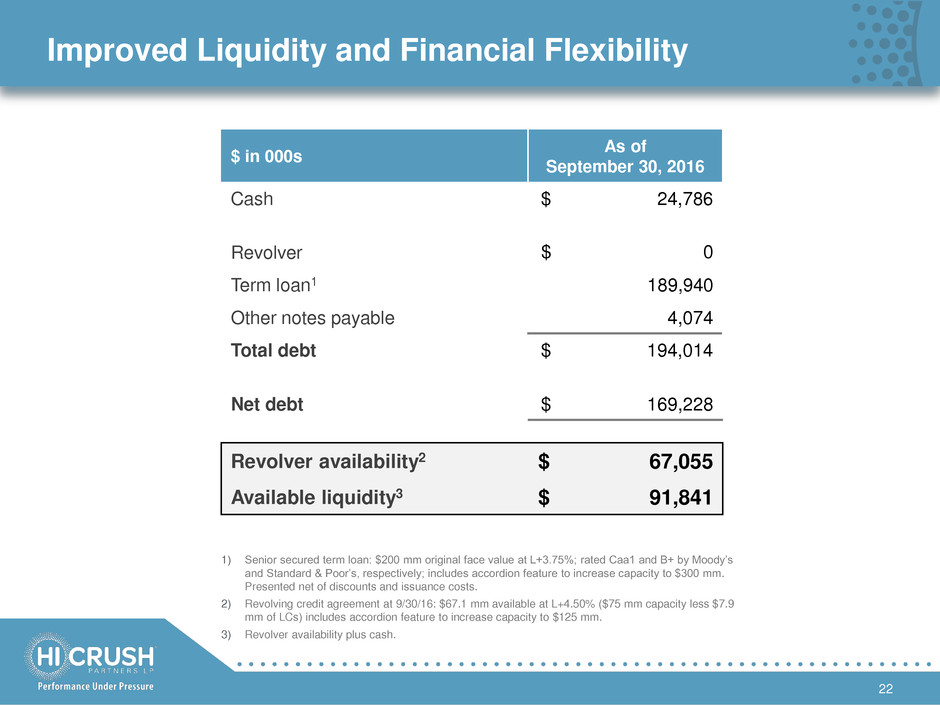
Improved Liquidity and Financial Flexibility
22
$ in 000s
As of
September 30, 2016
Cash $ 24,786
Revolver $ 0
Term loan1 189,940
Other notes payable 4,074
Total debt $ 194,014
Net debt $ 169,228
Revolver availability2 $ 67,055
Available liquidity3 $ 91,841
1) Senior secured term loan: $200 mm original face value at L+3.75%; rated Caa1 and B+ by Moody’s
and Standard & Poor’s, respectively; includes accordion feature to increase capacity to $300 mm.
Presented net of discounts and issuance costs.
2) Revolving credit agreement at 9/30/16: $67.1 mm available at L+4.50% ($75 mm capacity less $7.9
mm of LCs) includes accordion feature to increase capacity to $125 mm.
3) Revolver availability plus cash.
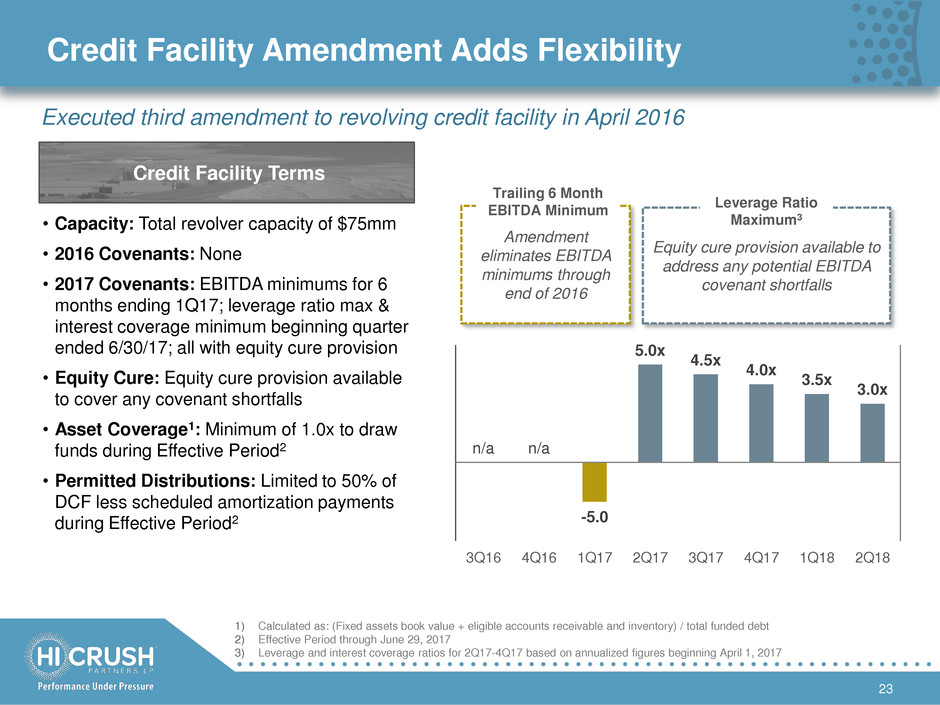
Credit Facility Amendment Adds Flexibility
23
1) Calculated as: (Fixed assets book value + eligible accounts receivable and inventory) / total funded debt
2) Effective Period through June 29, 2017
3) Leverage and interest coverage ratios for 2Q17-4Q17 based on annualized figures beginning April 1, 2017
• Capacity: Total revolver capacity of $75mm
• 2016 Covenants: None
• 2017 Covenants: EBITDA minimums for 6
months ending 1Q17; leverage ratio max &
interest coverage minimum beginning quarter
ended 6/30/17; all with equity cure provision
• Equity Cure: Equity cure provision available
to cover any covenant shortfalls
• Asset Coverage1: Minimum of 1.0x to draw
funds during Effective Period2
• Permitted Distributions: Limited to 50% of
DCF less scheduled amortization payments
during Effective Period2
Credit Facility Terms
Executed third amendment to revolving credit facility in April 2016
n/a n/a
-5.0
5.0x
4.5x
4.0x
3.5x
3.0x
-4.0x
-3.0x
-2.0x
-1.0x
0.0x
1.0x
2.0x
3.0x
4.0x
5.0x
6.0x
-10.0
-5.0
0.0
5.0
10.0
15.0
3Q16 4Q16 1Q17 2Q17 3Q17 4Q17 1Q18 2Q18
$mm
Amendment
eliminates EBITDA
minimums through
end of 2016
Equity cure provision available to
address any potential EBITDA
covenant shortfalls
Trailing 6 Month
EBITDA Minimum
Leverage Ratio
Maximum3
