Attached files
| file | filename |
|---|---|
| EX-99.1 - PRESS RELEASE - Allied World Assurance Co Holdings, AG | awh-20161031x8kexhibit991.htm |
| 8-K - 8-K - Allied World Assurance Co Holdings, AG | form_8-kxxx3qx2016xearning.htm |
Exhibit 99.2


ALLIED WORLD ASSURANCE COMPANY HOLDINGS, AG
3rd Quarter Ended September 30, 2016
Investor Contact: This report is for informational purposes only. It should be read in conjunction with documents filed by
Giuseppe Montefinese Allied World Assurance Company Holdings, AG with the U.S. Securities and Exchange Commission.
Phone: (646)794-0690
Email: Giuseppe.Montefinese@awac.com
CAUTIONARY STATEMENT REGARDING FORWARD-LOOKING STATEMENTS
Any forward-looking statements made in this report reflect our current views with respect to future events and financial performance and are made pursuant to the safe harbor provisions of the Private Securities Litigation Reform Act of 1995. Such statements involve risks and uncertainties, which may cause actual results to differ materially from those set forth in these statements. For example, our forward-looking statements could be affected by pricing and policy term trends; increased competition; the adequacy of our loss reserves; negative rating agency actions; greater frequency or severity of unpredictable catastrophic events; the impact of acts of terrorism and acts of war; the company or its subsidiaries becoming subject to significant income taxes in the United States or elsewhere; changes in regulations or tax laws; changes in the availability, cost or quality of reinsurance or retrocessional coverage; adverse general economic conditions; and judicial, legislative, political and other governmental developments, as well as management's response to these factors, and other factors identified in our filings with the U.S. Securities and Exchange Commission. You are cautioned not to place undue reliance on these forward-looking statements, which speak only as of the date on which they are made. We are under no obligation (and expressly disclaim any such obligation) to update or revise any forward-looking statement that may be made from time to time, whether as a result of new information, future developments or otherwise.
ALLIED WORLD ASSURANCE COMPANY HOLDINGS, AG | |||
FINANCIAL SUPPLEMENT TABLE OF CONTENTS | |||
Page | |||
Basis of Presentation | 4 | ||
I. | Financial Highlights | ||
- Consolidated Financial Highlights | 5 | ||
II. | Consolidated Financial Statements | ||
- Consolidated Statements of Operations | 6 | ||
- Consolidated Balance Sheets | 7 | ||
- Consolidated Statement of Cash Flows | 8 | ||
III. | Segment Results | ||
- Consolidated Segment Results - Current Quarter | 9 | ||
- Consolidated Segment Results - Prior Year Quarter | 10 | ||
- Consolidated Segment Results - Current Year to Date | 11 | ||
- Consolidated Segment Results - Prior Year to Date | 12 | ||
- Gross Premiums Written by Line of Business | 13 | ||
IV. | Incurred Losses, Loss Reserves and PMLs | ||
- Consolidated Incurred Loss Analysis by Segment | 14 | ||
- Net Loss Reserve Development by Loss Year - Current Quarter | 15 | ||
- Net Loss Reserve Development by Loss Year - Prior Year Quarter | 16 | ||
- Net Loss Reserve Development by Loss Year - Current Year to Date | 17 | ||
- Net Loss Reserve Development by Loss Year - Prior Year to Date | 18 | ||
- Reinsurance Recoverable | 19 | ||
- Probable Maximum Losses | 20 | ||
V. | Investment Portfolio | ||
- Consolidated Total Investment Portfolio | 21 | ||
- Investment Income, Book Yield and Portfolio Return | 22 | ||
- Additional Investment Detail | 23 | ||
VI. | Capital Structure | ||
- Share Repurchase Detail | 24 | ||
- Capital Structure and Leverage Ratios | 25 | ||
VII. | Non-GAAP Reconciliations | ||
- Operating Income Reconciliation and Basic and Diluted Earnings per Share | 26 | ||
- Return on Average Shareholders' Equity and Average Tangible Shareholders' Equity and Reconciliation of Average Shareholders' Equity | 27 | ||
- Reconciliation of Diluted Book Value per Share and Tangible Book Value per Share | 28 | ||
- Regulation G | 29 | ||
ALLIED WORLD ASSURANCE COMPANY HOLDINGS, AG
BASIS OF PRESENTATION
DEFINITIONS AND PRESENTATION
• | All financial information contained herein is unaudited. |
• | Unless otherwise noted, all data is in thousands of U.S. dollars, except for share, per share, percentage and ratio information. |
• | Allied World Assurance Company Holdings, AG, along with others in the industry, use underwriting ratios as measures of performance. The loss and loss expense ratio is calculated by dividing net losses and loss expenses by net premiums earned. The acquisition cost ratio is calculated by dividing acquisition costs by net premiums earned. The general and administrative expense ratio is calculated by dividing general and administrative expenses by net premiums earned. The expense ratio is calculated by combining the acquisition cost ratio and the general and administrative expense ratio. The combined ratio is calculated by combining the loss and loss expense ratios, the acquisition cost ratio and the general and administrative expense ratio. These ratios are relative measurements that describe for every $100 of net premiums earned, the costs of losses and expenses, respectively. The combined ratio presents the total cost per $100 of earned premium. A combined ratio below 100% demonstrates underwriting profit; a combined ratio above 100% demonstrates underwriting loss. |
• | In presenting the company’s results, management has included and discussed certain non-generally accepted accounting principles (“non-GAAP”) financial measures, as such term is defined in Regulation G promulgated by the SEC. Management believes that these non-GAAP measures, which may be defined differently by other companies, better explain the company’s results of operations in a manner that allows for a more complete understanding of the underlying trends in the company’s business. However, these measures should not be viewed as a substitute for those determined in accordance with generally accepted accounting principles (“GAAP”). The reconciliation of such non-GAAP financial measures to their respective most directly comparable GAAP financial measures in accordance with Regulation G is included in this financial supplement. See page 29 for further details. |
Page 4
ALLIED WORLD ASSURANCE COMPANY HOLDINGS, AG
CONSOLIDATED FINANCIAL HIGHLIGHTS
Three Months Ended | Nine Months Ended | |||||||||||||||||||||||||||||
September 30, | $ | % | September 30, | $ | % | |||||||||||||||||||||||||
2016 | 2015 | Difference | Difference | 2016 | 2015 | Difference | Difference | |||||||||||||||||||||||
HIGHLIGHTS | ||||||||||||||||||||||||||||||
Gross premiums written | $ | 730,224 | $ | 754,062 | $ | (23,838) | (3.2 | )% | $ | 2,394,063 | $ | 2,460,646 | $ | (66,583) | (2.7 | )% | ||||||||||||||
Net premiums written | 528,325 | 606,992 | (78,667) | (13.0 | )% | 1,810,508 | 1,983,189 | (172,681) | (8.7 | )% | ||||||||||||||||||||
Net premiums earned | 584,051 | 650,653 | (66,602) | (10.2 | )% | 1,767,141 | 1,865,577 | (98,436) | (5.3 | )% | ||||||||||||||||||||
Underwriting income | 21,520 | 27,873 | (6,353) | (22.8 | )% | 90,009 | 101,282 | (11,273) | (11.1 | )% | ||||||||||||||||||||
Operating income | 55,224 | 51,439 | 3,785 | 7.4 | % | 196,913 | 168,958 | 27,955 | 16.5 | % | ||||||||||||||||||||
Net income (loss) | 68,613 | (51,630) | 120,243 | 232.9 | % | 296,121 | 82,184 | 213,937 | 260.3 | % | ||||||||||||||||||||
Total shareholders' equity | 3,615,869 | 3,555,405 | 60,464 | 1.7 | % | 3,615,869 | 3,555,405 | 60,464 | 1.7 | % | ||||||||||||||||||||
Cash flows provided by operating activities | 119,634 | 163,984 | (44,350) | (27.0 | )% | 619,663 | 591,386 | 28,277 | 4.8 | % | ||||||||||||||||||||
PER SHARE AND SHARE DATA | ||||||||||||||||||||||||||||||
Diluted earnings per share | ||||||||||||||||||||||||||||||
Net income (loss) | $ | 0.77 | $ | (0.56)* | $ | 1.33 | 237.5 | % | $ | 3.29 | $ | 0.87 | $ | 2.42 | 278.2 | % | ||||||||||||||
Operating income | $ | 0.62 | $ | 0.55 | $ | 0.07 | 12.7 | % | $ | 2.19 | $ | 1.79 | $ | 0.40 | 22.3 | % | ||||||||||||||
Basic book value per share | $ | 41.57 | $ | 39.11 | $ | 2.46 | 6.3 | % | $ | 41.57 | $ | 39.11 | ||||||||||||||||||
Diluted book value per share | $ | 40.29 | $ | 38.03 | $ | 2.26 | 5.9 | % | $ | 40.29 | $ | 38.03 | ||||||||||||||||||
Diluted tangible book value per share | $ | 34.67 | $ | 32.84 | $ | 1.83 | 5.6 | % | $ | 34.67 | $ | 32.84 | ||||||||||||||||||
FINANCIAL RATIOS | ||||||||||||||||||||||||||||||
Annualized return on average equity (ROAE), net income (loss) | 7.6 | % | (5.7 | )% | 13.3 pts | 11.0 | % | 3.0 | % | 8.0 pts | ||||||||||||||||||||
Annualized ROAE, operating income | 6.1 | % | 5.7 | % | 0.4 pts | 7.3 | % | 6.1 | % | 1.2 pts | ||||||||||||||||||||
Annualized return on average tangible equity (ROATE), net income (loss) | 8.9 | % | (6.7 | )% | 15.6 pts | 12.8 | % | 3.4 | % | 9.4 pts | ||||||||||||||||||||
Annualized ROATE, operating income | 7.1 | % | 6.6 | % | 0.5 pts | 8.5 | % | 6.9 | % | 1.6 pts | ||||||||||||||||||||
Financial statement portfolio return | 0.7 | % | (0.8 | )% | 1.5 pts | 2.9 | % | 0.5 | % | 2.4 pts | ||||||||||||||||||||
GAAP Ratios | ||||||||||||||||||||||||||||||
Loss and loss expense ratio | 64.4 | % | 64.1 | % | (0.3) pts | 63.0 | % | 62.9 | % | (0.1) pts | ||||||||||||||||||||
Acquisition cost ratio | 14.0 | % | 15.4 | % | 1.4 pts | 14.6 | % | 15.0 | % | 0.4 pts | ||||||||||||||||||||
General and administrative expense ratio | 17.8 | % | 16.3 | % | (1.5) pts | 17.3 | % | 16.7 | % | (0.6) pts | ||||||||||||||||||||
Expense ratio | 31.8 | % | 31.7 | % | (0.1) pts | 31.9 | % | 31.7 | % | (0.2) pts | ||||||||||||||||||||
Combined ratio | 96.2 | % | 95.8 | % | (0.4) pts | 94.9 | % | 94.6 | % | (0.3) pts | ||||||||||||||||||||
* Diluted weighted average common shares outstanding were only used in the calculation of diluted operating income per share, and not in the calculation of diluted earnings per share, | ||||||||||||||||||||||||||||||
as there was a net loss during the three months ended September 30, 2015. | ||||||||||||||||||||||||||||||
Page 5
ALLIED WORLD ASSURANCE COMPANY HOLDINGS, AG
CONSOLIDATED STATEMENTS OF OPERATIONS
Three Months Ended | Nine Months Ended | |||||||||||||||||||||||||||||
September 30, | June 30, | March 31, | December 31, | September 30, | September 30, | September 30, | ||||||||||||||||||||||||
2016 | 2016 | 2016 | 2015 | 2015 | 2016 | 2015 | ||||||||||||||||||||||||
Revenues | ||||||||||||||||||||||||||||||
Gross premiums written | $ | 730,224 | $ | 800,294 | $ | 863,545 | $ | 632,357 | $ | 754,062 | $ | 2,394,063 | $ | 2,460,646 | ||||||||||||||||
Net premiums written | $ | 528,325 | $ | 578,137 | $ | 704,046 | $ | 464,818 | $ | 606,992 | $ | 1,810,508 | $ | 1,983,189 | ||||||||||||||||
Net premiums earned | $ | 584,051 | $ | 602,968 | $ | 580,122 | $ | 622,809 | $ | 650,653 | $ | 1,767,141 | $ | 1,865,577 | ||||||||||||||||
Net investment income | 50,564 | 55,839 | 53,253 | 49,099 | 45,667 | 159,655 | 132,978 | |||||||||||||||||||||||
Net realized investment gains (losses) | 10,663 | 74,493 | 18,858 | (38,849) | (113,626) | 104,014 | (88,783) | |||||||||||||||||||||||
Other income | 1,878 | 5,177 | 565 | 982 | 735 | 7,620 | 2,513 | |||||||||||||||||||||||
Total revenues | $ | 647,156 | $ | 738,477 | $ | 652,798 | $ | 634,041 | $ | 583,429 | $ | 2,038,430 | $ | 1,912,285 | ||||||||||||||||
Expenses | ||||||||||||||||||||||||||||||
Net losses and loss expenses | $ | 376,262 | $ | 365,443 | $ | 372,366 | $ | 412,756 | $ | 416,881 | $ | 1,114,070 | $ | 1,173,578 | ||||||||||||||||
Acquisition costs | 82,033 | 87,403 | 88,308 | 95,938 | 100,101 | 257,744 | 279,418 | |||||||||||||||||||||||
General and administrative expenses | 104,236 | 104,729 | 96,352 | 95,025 | 105,798 | 305,318 | 311,299 | |||||||||||||||||||||||
Other expense | 2,192 | 1,682 | 1,134 | 1,907 | 1,245 | 5,008 | 4,303 | |||||||||||||||||||||||
Amortization of intangible assets | 2,501 | 2,501 | 2,500 | 3,668 | 2,639 | 7,502 | 6,091 | |||||||||||||||||||||||
Interest expense | 13,462 | 19,879 | 19,949 | 18,126 | 14,469 | 53,290 | 43,272 | |||||||||||||||||||||||
Foreign exchange loss (gain) | 1,007 | (2,887) | (3,011) | 920 | (793) | (4,891) | 10,369 | |||||||||||||||||||||||
Total expenses | $ | 581,693 | $ | 578,750 | $ | 577,598 | $ | 628,340 | $ | 640,340 | $ | 1,738,041 | $ | 1,828,330 | ||||||||||||||||
Income (loss) before income taxes | $ | 65,463 | $ | 159,727 | $ | 75,200 | $ | 5,701 | $ | (56,911) | $ | 300,389 | $ | 83,955 | ||||||||||||||||
Income tax (benefit) expense | (3,150) | 6,317 | 1,101 | 3,994 | (5,281) | 4,268 | 1,771 | |||||||||||||||||||||||
Net income (loss) | $ | 68,613 | $ | 153,410 | $ | 74,099 | $ | 1,707 | $ | (51,630) | $ | 296,121 | $ | 82,184 | ||||||||||||||||
GAAP Ratios | ||||||||||||||||||||||||||||||
Loss and loss expense ratio | 64.4 | % | 60.6 | % | 64.2 | % | 66.3 | % | 64.1 | % | 63.0 | % | 62.9 | % | ||||||||||||||||
Acquisition cost ratio | 14.0 | % | 14.5 | % | 15.2 | % | 15.4 | % | 15.4 | % | 14.6 | % | 15.0 | % | ||||||||||||||||
General and administrative expense ratio | 17.8 | % | 17.4 | % | 16.6 | % | 15.3 | % | 16.3 | % | 17.3 | % | 16.7 | % | ||||||||||||||||
Expense ratio | 31.8 | % | 31.9 | % | 31.8 | % | 30.7 | % | 31.7 | % | 31.9 | % | 31.7 | % | ||||||||||||||||
Combined ratio | 96.2 | % | 92.5 | % | 96.0 | % | 97.0 | % | 95.8 | % | 94.9 | % | 94.6 | % | ||||||||||||||||
Per Share Data | ||||||||||||||||||||||||||||||
Diluted earnings per share | ||||||||||||||||||||||||||||||
Net income (loss) | $ | 0.77 | $ | 1.70 | $ | 0.81 | $ | 0.02 | $ | (0.56)* | $ | 3.29 | $ | 0.87 | ||||||||||||||||
Operating income | $ | 0.62 | $ | 0.91 | $ | 0.65 | $ | 0.47 | $ | 0.55 | $ | 2.19 | $ | 1.79 | ||||||||||||||||
* Diluted weighted average common shares outstanding were only used in the calculation of diluted operating income per share, and not in the calculation of diluted earnings per share, | ||||||||||||||||||||||||||||||
as there was a net loss during the three months ended September 30, 2015. | ||||||||||||||||||||||||||||||
Page 6
ALLIED WORLD ASSURANCE COMPANY HOLDINGS, AG
CONSOLIDATED BALANCE SHEETS
As of | As of | |||||
September 30, 2016 | December 31, 2015 | |||||
ASSETS | ||||||
Fixed maturity investments trading, at fair value | $ | 7,327,301 | $ | 7,201,538 | ||
Equity securities trading, at fair value | 216,141 | 403,022 | ||||
Other invested assets | 941,653 | 966,709 | ||||
Total investments | 8,485,095 | 8,571,269 | ||||
Cash and cash equivalents | 773,839 | 607,983 | ||||
Restricted cash | 98,851 | 60,629 | ||||
Insurance balances receivable | 893,300 | 745,888 | ||||
Funds held | 263,926 | 640,819 | ||||
Prepaid reinsurance | 448,722 | 392,265 | ||||
Reinsurance recoverable | 1,550,659 | 1,479,959 | ||||
Reinsurance recoverable on paid losses | 129,061 | 96,437 | ||||
Accrued investment income | 37,248 | 38,304 | ||||
Net deferred acquisition costs | 157,720 | 165,206 | ||||
Goodwill | 392,768 | 388,127 | ||||
Intangible assets | 111,100 | 116,623 | ||||
Balances receivable on sale of investments | 20,266 | 36,889 | ||||
Net deferred tax assets | 26,281 | 24,401 | ||||
Other assets | 153,467 | 147,149 | ||||
TOTAL ASSETS | $ | 13,542,303 | $ | 13,511,948 | ||
LIABILITIES | ||||||
Reserve for losses and loss expenses | $ | 6,665,796 | $ | 6,456,156 | ||
Unearned premiums | 1,785,232 | 1,683,274 | ||||
Reinsurance balances payable | 258,444 | 214,369 | ||||
Balances due on purchases of investments | 242,350 | 125,126 | ||||
Senior notes | 793,973 | 1,292,907 | ||||
Other long-term debt | 23,306 | 23,033 | ||||
Accounts payable and accrued liabilities | 157,333 | 184,541 | ||||
TOTAL LIABILITIES | $ | 9,926,434 | $ | 9,979,406 | ||
SHAREHOLDERS' EQUITY | ||||||
Common shares: 2016 and 2015: par value CHF 4.10 per share (2016: 93,586,418; 2015: 95,523,230 shares issued and 2016: 86,974,284; 2015: 90,959,635 shares outstanding) | $ | 378,840 | $ | 386,702 | ||
Treasury shares, at cost (2016: 6,612,134; 2015: 4,563,595) | (237,048) | (155,072) | ||||
Accumulated other comprehensive loss | (5,421) | (9,297) | ||||
Retained earnings | 3,479,498 | 3,310,209 | ||||
TOTAL SHAREHOLDERS' EQUITY | $ | 3,615,869 | $ | 3,532,542 | ||
TOTAL LIABILITIES AND SHAREHOLDERS' EQUITY | $ | 13,542,303 | $ | 13,511,948 | ||
Book value per share | $ | 41.57 | $ | 38.84 | ||
Diluted book value per share | $ | 40.29 | $ | 37.78 | ||
Diluted tangible book value per share | $ | 34.67 | $ | 32.38 | ||
Page 7
ALLIED WORLD ASSURANCE COMPANY HOLDINGS, AG
CONSOLIDATED STATEMENTS OF CASH FLOWS
Three Months Ended | Nine Months Ended | ||||||||||||||||||||||||||||
September 30, | June 30, | March 31, | December 31, | September 30, | September 30, | September 30, | |||||||||||||||||||||||
2016 | 2016 | 2016 | 2015 | 2015 | 2016 | 2015 | |||||||||||||||||||||||
CASH FLOWS PROVIDED BY (USED IN) OPERATING ACTIVITIES: | |||||||||||||||||||||||||||||
Net income (loss) | $ | 68,656 | $ | 153,410 | $ | 74,099 | $ | 1,708 | $ | (51,630) | $ | 296,165 | $ | 82,184 | |||||||||||||||
Adjustments to reconcile net income (loss) to cash | |||||||||||||||||||||||||||||
provided by operating activities: | |||||||||||||||||||||||||||||
Net realized (gains) losses on sales of investments | (6,492) | (19,174) | (12,025) | (32,710) | 17,039 | (37,691) | (41,185) | ||||||||||||||||||||||
Mark to market adjustments | (1,816) | (62,210) | (27,088) | 77,340 | 76,829 | (91,114) | 112,421 | ||||||||||||||||||||||
Stock compensation expense | 4,785 | 4,757 | 3,881 | 3,949 | 3,934 | 13,423 | 11,805 | ||||||||||||||||||||||
Undistributed loss of equity method investments | 7,045 | 5,993 | 9,207 | 3,365 | 3,257 | 22,245 | 19,244 | ||||||||||||||||||||||
Changes in: | |||||||||||||||||||||||||||||
Reserve for losses and loss expenses, net of reinsurance recoverables | 8,725 | 43,293 | 86,922 | (12,907) | 55,908 | 138,940 | 188,835 | ||||||||||||||||||||||
Unearned premiums, net of prepaid reinsurance | (55,494) | (24,538) | 125,533 | (157,271) | (47,057) | 45,501 | 113,380 | ||||||||||||||||||||||
Insurance balances receivable | 67,679 | (76,919) | (139,527) | 160,141 | 39,138 | (148,767) | (123,175) | ||||||||||||||||||||||
Reinsurance recoverable on paid losses | (55,252) | 8,853 | 13,775 | 20,673 | (28,689) | (32,624) | (31,035) | ||||||||||||||||||||||
Funds held | 15,210 | 74,020 | 287,663 | (197,149) | 18,823 | 376,893 | 280,351 | ||||||||||||||||||||||
Reinsurance balances payable | 30,751 | 6,060 | 7,264 | (45,917) | 28,875 | 44,075 | 40,354 | ||||||||||||||||||||||
Net deferred acquisition costs | 11,198 | 17,960 | (21,672) | 27,913 | 6,721 | 7,486 | (10,901) | ||||||||||||||||||||||
Net deferred tax assets | (5,073) | 3,764 | (571) | 7,399 | (7,450) | (1,880) | (10,141) | ||||||||||||||||||||||
Accounts payable and accrued liabilities | 19,722 | 2,220 | (50,128) | 28,914 | 15,557 | (28,186) | (39,046) | ||||||||||||||||||||||
Other items, net | 9,990 | 15,131 | (9,924) | 35,904 | 32,729 | 15,197 | (1,705) | ||||||||||||||||||||||
Net cash provided by (used in) operating activities | 119,634 | 152,620 | 347,409 | (78,648) | 163,984 | 619,663 | 591,386 | ||||||||||||||||||||||
CASH FLOWS PROVIDED BY (USED IN) INVESTING ACTIVITIES: | |||||||||||||||||||||||||||||
Net sales (purchases) of investments | 635,425 | (236,688) | (84,779) | (475,234) | (135,672) | 313,958 | (24,465) | ||||||||||||||||||||||
Purchases of fixed assets | (1,219) | (1,351) | (560) | (8,041) | (5,814) | (3,130) | (23,798) | ||||||||||||||||||||||
Change in restricted cash | (20,641) | 9,216 | (26,797) | 99,234 | (52,794) | (38,222) | (78,892) | ||||||||||||||||||||||
Net cash paid for acquisitions | — | (1,244) | — | 17,083 | — | (1,244) | (141,503) | ||||||||||||||||||||||
Net cash provided by (used in) investing activities | 613,565 | (230,067) | (112,136) | (366,958) | (194,280) | 271,362 | (268,658) | ||||||||||||||||||||||
CASH FLOWS USED IN FINANCING ACTIVITIES: | |||||||||||||||||||||||||||||
Dividends paid | (22,649) | (22,839) | (23,359) | (47,287) | (23,593) | (68,847) | (66,784 | ) | |||||||||||||||||||||
Proceeds from the exercise of stock options | 4,543 | 2,757 | 358 | 954 | 1,795 | 7,658 | 9,184 | ||||||||||||||||||||||
Share repurchases | (26,231) | (89,491) | (50,000) | — | — | (165,722) | (246,443) | ||||||||||||||||||||||
(Repayment) proceeds from senior notes | (500,000) | — | — | 496,705 | — | (500,000) | — | ||||||||||||||||||||||
(Repayment) proceeds from other long-term debt | (1) | (75) | (76) | (72) | (79) | (152) | 3,849 | ||||||||||||||||||||||
Net cash used in financing activities | (544,338) | (109,648) | (73,077) | 450,300 | (21,877) | (727,063) | (300,194) | ||||||||||||||||||||||
Effect of exchange rate changes on foreign currency cash | 474 | (433) | 1,852 | (521) | (5,864) | 1,893 | (8,063) | ||||||||||||||||||||||
NET INCREASE (DECREASE) IN CASH AND CASH EQUIVALENTS | 189,335 | (187,528) | 164,048 | 4,173 | (58,037) | 165,855 | 14,471 | ||||||||||||||||||||||
CASH AND CASH EQUIVALENTS, BEGINNING OF PERIOD | 584,503 | 772,031 | 607,983 | 603,810 | 661,847 | 607,983 | 589,339 | ||||||||||||||||||||||
CASH AND CASH EQUIVALENTS, END OF PERIOD | $ | 773,838 | $ | 584,503 | $ | 772,031 | $ | 607,983 | $ | 603,810 | $ | 773,838 | $ | 603,810 | |||||||||||||||
Page 8
ALLIED WORLD ASSURANCE COMPANY HOLDINGS, AG
CONSOLIDATED SEGMENT RESULTS – CURRENT QUARTER
Three Months Ended September 30, 2016 | |||||||||||||||||
North American | Global Markets | Consolidated | |||||||||||||||
Insurance | Insurance | Reinsurance | Totals | ||||||||||||||
Revenues | |||||||||||||||||
Gross premiums written | $ | 466,535 | $ | 126,663 | $ | 137,026 | $ | 730,224 | |||||||||
Net premiums written | $ | 307,922 | $ | 91,293 | $ | 129,110 | $ | 528,325 | |||||||||
Net premiums earned | $ | 312,840 | $ | 96,771 | $ | 174,440 | $ | 584,051 | |||||||||
Total revenues | $ | 312,840 | $ | 96,771 | $ | 174,440 | $ | 584,051 | |||||||||
Expenses | |||||||||||||||||
Net losses and loss expenses | $ | (215,897) | $ | (74,527) | $ | (85,838) | $ | (376,262) | |||||||||
Acquisition costs | (31,517) | (16,449) | (34,067) | (82,033) | |||||||||||||
General and administrative expenses | (55,111) | (32,640) | (16,485) | (104,236) | |||||||||||||
Total expenses | $ | (302,525) | $ | (123,616) | $ | (136,390) | $ | (562,531) | |||||||||
Underwriting income (loss) | $ | 10,315 | $ | (26,845) | $ | 38,050 | $ | 21,520 | |||||||||
Other insurance-related income | 1,136 | 742 | — | 1,878 | |||||||||||||
Other insurance-related expenses | (570) | (328) | (1,294 | ) | (2,192) | ||||||||||||
Segment income (loss) | $ | 10,881 | $ | (26,431) | $ | 36,756 | $ | 21,206 | |||||||||
Net investment income | 50,564 | ||||||||||||||||
Net realized investment gains | 10,663 | ||||||||||||||||
Amortization of intangible assets | (2,501) | ||||||||||||||||
Interest expense | (13,462) | ||||||||||||||||
Foreign exchange loss | (1,007) | ||||||||||||||||
Income before income taxes | $ | 65,463 | |||||||||||||||
GAAP Ratios | |||||||||||||||||
Loss and loss expense ratio | 69.0 | % | 77.0 | % | 49.3 | % | 64.4 | % | |||||||||
Acquisition cost ratio | 10.1 | % | 17.0 | % | 19.5 | % | 14.0 | % | |||||||||
General and administrative expense ratio | 17.6 | % | 33.7 | % | 9.5 | % | 17.8 | % | |||||||||
Expense ratio | 27.7 | % | 50.7 | % | 29.0 | % | 31.8 | % | |||||||||
Combined ratio | 96.7 | % | 127.7 | % | 78.3 | % | 96.2 | % | |||||||||
Page 9
ALLIED WORLD ASSURANCE COMPANY HOLDINGS, AG
CONSOLIDATED SEGMENT RESULTS – PRIOR YEAR QUARTER
Three Months Ended September 30, 2015 | |||||||||||||||||
North American | Global Markets | Consolidated | |||||||||||||||
Insurance | Insurance | Reinsurance | Totals | ||||||||||||||
Revenues | |||||||||||||||||
Gross premiums written | $ | 460,386 | $ | 132,664 | $ | 161,012 | $ | 754,062 | |||||||||
Net premiums written | $ | 350,791 | $ | 104,075 | $ | 152,126 | $ | 606,992 | |||||||||
Net premiums earned | $ | 332,722 | $ | 110,327 | $ | 207,604 | $ | 650,653 | |||||||||
Total revenues | $ | 332,722 | $ | 110,327 | $ | 207,604 | $ | 650,653 | |||||||||
Expenses | |||||||||||||||||
Net losses and loss expenses | $ | (222,250) | $ | (70,935) | $ | (123,696) | $ | (416,881) | |||||||||
Acquisition costs | (35,585) | (22,731) | (41,785) | (100,101) | |||||||||||||
General and administrative expenses | (58,301) | (29,344) | (18,153) | (105,798) | |||||||||||||
Total expenses | $ | (316,136) | $ | (123,010) | $ | (183,634) | $ | (622,780) | |||||||||
Underwriting income (loss) | $ | 16,586 | $ | (12,683) | $ | 23,970 | $ | 27,873 | |||||||||
Other insurance-related income | 735 | — | — | 735 | |||||||||||||
Other insurance-related expenses | (631) | (614) | — | (1,245) | |||||||||||||
Segment income (loss) | $ | 16,690 | $ | (13,297) | $ | 23,970 | $ | 27,363 | |||||||||
Net investment income | 45,667 | ||||||||||||||||
Net realized investment losses | (113,626) | ||||||||||||||||
Amortization of intangible assets | (2,639) | ||||||||||||||||
Interest expense | (14,469) | ||||||||||||||||
Foreign exchange gain | 793 | ||||||||||||||||
Loss before income taxes | $ | (56,911) | |||||||||||||||
GAAP Ratios | |||||||||||||||||
Loss and loss expense ratio | 66.8 | % | 64.3 | % | 59.6 | % | 64.1 | % | |||||||||
Acquisition cost ratio | 10.7 | % | 20.6 | % | 20.1 | % | 15.4 | % | |||||||||
General and administrative expense ratio | 17.5 | % | 26.6 | % | 8.7 | % | 16.3 | % | |||||||||
Expense ratio | 28.2 | % | 47.2 | % | 28.8 | % | 31.7 | % | |||||||||
Combined ratio | 95.0 | % | 111.5 | % | 88.4 | % | 95.8 | % | |||||||||
Page 10
ALLIED WORLD ASSURANCE COMPANY HOLDINGS, AG
CONSOLIDATED SEGMENT RESULTS – CURRENT YEAR TO DATE
Nine Months Ended September 30, 2016 | |||||||||||||||||
North American | Global Markets | Consolidated | |||||||||||||||
Insurance | Insurance | Reinsurance | Totals | ||||||||||||||
Revenues | |||||||||||||||||
Gross premiums written | $ | 1,354,101 | $ | 367,627 | $ | 672,335 | $ | 2,394,063 | |||||||||
Net premiums written | $ | 904,935 | $ | 267,127 | $ | 638,446 | $ | 1,810,508 | |||||||||
Net premiums earned | $ | 958,752 | $ | 285,134 | $ | 523,255 | $ | 1,767,141 | |||||||||
Total revenues | $ | 958,752 | $ | 285,134 | $ | 523,255 | $ | 1,767,141 | |||||||||
Expenses | |||||||||||||||||
Net losses and loss expenses | $ | (642,058) | $ | (203,418) | $ | (268,594) | $ | (1,114,070) | |||||||||
Acquisition costs | (102,834) | (50,625) | (104,285) | (257,744) | |||||||||||||
General and administrative expenses | (164,120) | (93,198) | (48,000) | (305,318) | |||||||||||||
Total expenses | $ | (909,012) | $ | (347,241) | $ | (420,879) | $ | (1,677,132) | |||||||||
Underwriting income (loss) | $ | 49,740 | $ | (62,107) | $ | 102,376 | $ | 90,009 | |||||||||
Other insurance-related income | 2,615 | 742 | 4,263 | 7,620 | |||||||||||||
Other insurance-related expenses | (1,875) | (333) | (2,800 | ) | (5,008) | ||||||||||||
Segment income (loss) | $ | 50,480 | $ | (61,698) | $ | 103,839 | $ | 92,621 | |||||||||
Net investment income | 159,655 | ||||||||||||||||
Net realized investment gains | 104,014 | ||||||||||||||||
Amortization of intangible assets | (7,502) | ||||||||||||||||
Interest expense | (53,290) | ||||||||||||||||
Foreign exchange gain | 4,891 | ||||||||||||||||
Income before income taxes | $ | 300,389 | |||||||||||||||
GAAP Ratios | |||||||||||||||||
Loss and loss expense ratio | 67.0 | % | 71.3 | % | 51.3 | % | 63.0 | % | |||||||||
Acquisition cost ratio | 10.7 | % | 17.8 | % | 19.9 | % | 14.6 | % | |||||||||
General and administrative expense ratio | 17.1 | % | 32.7 | % | 9.2 | % | 17.3 | % | |||||||||
Expense ratio | 27.8 | % | 50.5 | % | 29.1 | % | 31.9 | % | |||||||||
Combined ratio | 94.8 | % | 121.8 | % | 80.4 | % | 94.9 | % | |||||||||
Page 11
ALLIED WORLD ASSURANCE COMPANY HOLDINGS, AG
CONSOLIDATED SEGMENT RESULTS – PRIOR YEAR TO DATE
Nine Months Ended September 30, 2015 | |||||||||||||||||
North American | Global Markets | Consolidated | |||||||||||||||
Insurance | Insurance | Reinsurance | Totals | ||||||||||||||
Revenues | |||||||||||||||||
Gross premiums written | $ | 1,358,636 | $ | 328,223 | $ | 773,787 | $ | 2,460,646 | |||||||||
Net premiums written | $ | 1,019,866 | $ | 216,230 | $ | 747,093 | $ | 1,983,189 | |||||||||
Net premiums earned | $ | 974,232 | $ | 262,993 | $ | 628,352 | $ | 1,865,577 | |||||||||
Total revenues | $ | 974,232 | $ | 262,993 | $ | 628,352 | $ | 1,865,577 | |||||||||
Expenses | |||||||||||||||||
Net losses and loss expenses | $ | (655,475) | $ | (157,200) | $ | (360,903) | $ | (1,173,578) | |||||||||
Acquisition costs | (100,818) | (54,076) | (124,524) | (279,418) | |||||||||||||
General and administrative expenses | (175,732) | (78,093) | (57,474) | (311,299) | |||||||||||||
Total expenses | $ | (932,025) | $ | (289,369) | $ | (542,901) | $ | (1,764,295) | |||||||||
Underwriting income (loss) | $ | 42,207 | $ | (26,376) | $ | 85,451 | $ | 101,282 | |||||||||
Other insurance-related income | 2,513 | — | — | 2,513 | |||||||||||||
Other insurance-related expenses | (2,076) | (2,227) | — | (4,303 | ) | ||||||||||||
Segment income (loss) | $ | 42,644 | $ | (28,603) | $ | 85,451 | $ | 99,492 | |||||||||
Net investment income | 132,978 | ||||||||||||||||
Net realized investment losses | (88,783) | ||||||||||||||||
Amortization of intangible assets | (6,091) | ||||||||||||||||
Interest expense | (43,272) | ||||||||||||||||
Foreign exchange loss | (10,369) | ||||||||||||||||
Income before income taxes | $ | 83,955 | |||||||||||||||
GAAP Ratios | |||||||||||||||||
Loss and loss expense ratio | 67.3 | % | 59.8 | % | 57.4 | % | 62.9 | % | |||||||||
Acquisition cost ratio | 10.3 | % | 20.6 | % | 19.8 | % | 15.0 | % | |||||||||
General and administrative expense ratio | 18.0 | % | 29.7 | % | 9.1 | % | 16.7 | % | |||||||||
Expense ratio | 28.3 | % | 50.3 | % | 28.9 | % | 31.7 | % | |||||||||
Combined ratio | 95.6 | % | 110.1 | % | 86.3 | % | 94.6 | % | |||||||||
Page 12
ALLIED WORLD ASSURANCE COMPANY HOLDINGS, AG
GROSS PREMIUMS WRITTEN BY LINE OF BUSINESS
Three Months Ended | Nine Months Ended | |||||||||||||||||||||||
September 30, 2016 | September 30, 2015 | September 30, 2016 | September 30, 2015 | |||||||||||||||||||||
Amount | % of Total | Amount | % of Total | Amount | % of Total | Amount | % of Total | |||||||||||||||||
North American Insurance | ||||||||||||||||||||||||
Casualty | $ | 164,381 | 35.2 | % | $ | 165,481 | 35.9 | % | $ | 436,356 | 32.2 | % | $ | 470,517 | 34.6 | % | ||||||||
Professional liability | 106,414 | 22.8 | % | 113,074 | 24.6 | % | 321,381 | 23.7 | % | 329,890 | 24.3 | % | ||||||||||||
Programs | 69,131 | 14.8 | % | 56,748 | 12.3 | % | 169,290 | 12.5 | % | 137,359 | 10.1 | % | ||||||||||||
Other specialty(1) | 50,533 | 10.9 | % | 35,562 | 7.7 | % | 138,769 | 10.3 | % | 97,079 | 7.1 | % | ||||||||||||
Property | 46,619 | 10.0 | % | 53,557 | 11.6 | % | 192,551 | 14.2 | % | 219,848 | 16.2 | % | ||||||||||||
Healthcare(2) | 29,457 | 6.3 | % | 35,964 | 7.9 | % | 95,754 | 7.1 | % | 103,943 | 7.7 | % | ||||||||||||
Total | $ | 466,535 | 100.0 | % | $ | 460,386 | 100.0 | % | $ | 1,354,101 | 100.0 | % | $ | 1,358,636 | 100.0 | % | ||||||||
Global Markets Insurance | ||||||||||||||||||||||||
Other specialty(3) | $ | 41,788 | 33.0 | % | $ | 35,975 | 27.1 | % | $ | 115,727 | 31.5 | % | $ | 94,970 | 28.9 | % | ||||||||
Professional liability | 40,223 | 31.8 | % | 35,914 | 27.1 | % | 108,203 | 29.4 | % | 98,966 | 30.3 | % | ||||||||||||
Casualty | 23,870 | 18.8 | % | 36,043 | 27.2 | % | 80,082 | 21.8 | % | 75,295 | 22.9 | % | ||||||||||||
Property | 20,782 | 16.4 | % | 24,732 | 18.7 | % | 63,615 | 17.3 | % | 58,992 | 18.0 | % | ||||||||||||
Total | $ | 126,663 | 100.0 | % | $ | 132,664 | 100.0 | % | $ | 367,627 | 100.0 | % | $ | 328,223 | 100.0 | % | ||||||||
Reinsurance | ||||||||||||||||||||||||
Casualty(4) | $ | 74,988 | 54.7 | % | $ | 84,344 | 52.3 | % | $ | 156,941 | 23.3 | % | $ | 181,497 | 23.5 | % | ||||||||
Property | 54,372 | 39.7 | % | 70,939 | 44.1 | % | 345,425 | 51.4 | % | 414,760 | 53.6 | % | ||||||||||||
Specialty | 7,666 | 5.6 | % | 5,729 | 3.6 | % | 169,969 | 25.3 | % | 177,530 | 22.9 | % | ||||||||||||
Total | $ | 137,026 | 100.0 | % | $ | 161,012 | 100.0 | % | $ | 672,335 | 100.0 | % | $ | 773,787 | 100.0 | % | ||||||||
Consolidated gross premiums written | $ | 730,224 | $ | 754,062 | $ | 2,394,063 | $ | 2,460,646 | ||||||||||||||||
(1) Includes the construction, environmental, surety and trade credit lines of businesses. | ||||||||||||||||||||||||
(2) Includes the medical malpractice line of business. The healthcare management liability line of business previously included in the healthcare line of business is | ||||||||||||||||||||||||
included in the professional liability line of business. The comparative period was updated to reflect the current presentation. | ||||||||||||||||||||||||
(3) Includes the accident and health, aviation, construction, marine and trade credit lines of businesses. | ||||||||||||||||||||||||
(4) Includes the professional liability reinsurance line of business. | ||||||||||||||||||||||||
Page 13
ALLIED WORLD ASSURANCE COMPANY HOLDINGS, AG
CONSOLIDATED INCURRED LOSS ANALYSIS BY SEGMENT
Three Months Ended | Nine Months Ended | |||||||||||||||||||||||||||
September 30, 2016 | September 30, 2015 | September 30, 2016 | September 30, 2015 | |||||||||||||||||||||||||
Amount | % of NPE(1) | Amount | % of NPE(1) | Amount | % of NPE(1) | Amount | % of NPE(1) | |||||||||||||||||||||
North American Insurance | ||||||||||||||||||||||||||||
Current year - non-catastrophe | $ | 232,047 | 74.2 | % | $ | 221,021 | 66.5 | % | $ | 669,778 | 69.9 | % | $ | 668,699 | 68.6 | % | ||||||||||||
Current year - property catastrophe | — | 0.0 | % | 2,750 | 0.8 | % | 4,600 | 0.5 | % | 2,750 | 0.3 | % | ||||||||||||||||
Prior year - increase (decrease) | (16,150) | (5.2 | )% | (1,521) | (0.5 | )% | (32,320) | (3.4 | )% | (15,974) | (1.6 | )% | ||||||||||||||||
Net losses and loss expenses | $ | 215,897 | 69.0 | % | $ | 222,250 | 66.8 | % | $ | 642,058 | 67.0 | % | $ | 655,475 | 67.3 | % | ||||||||||||
Global Markets Insurance | ||||||||||||||||||||||||||||
Current year - non-catastrophe | $ | 70,476 | 72.8 | % | $ | 73,039 | 66.2 | % | $ | 209,634 | 73.5 | % | $ | 172,746 | 65.7 | % | ||||||||||||
Current year - property catastrophe | — | 0.0 | % | 250 | 0.2 | % | — | 0.0 | % | 4,250 | 1.6 | % | ||||||||||||||||
Prior year - increase (decrease) | 4,051 | 4.2 | % | (2,354) | (2.1 | )% | (6,216) | (2.2 | )% | (19,796) | (7.5 | )% | ||||||||||||||||
Net losses and loss expenses | $ | 74,527 | 77.0 | % | $ | 70,935 | 64.3 | % | $ | 203,418 | 71.3 | % | $ | 157,200 | 59.8 | % | ||||||||||||
Reinsurance | ||||||||||||||||||||||||||||
Current year - non-catastrophe | $ | 98,610 | 56.6 | % | $ | 95,912 | 46.2 | % | $ | 301,876 | 57.7 | % | $ | 365,704 | 58.2 | % | ||||||||||||
Current year - property catastrophe | 4,850 | 2.8 | % | 32,500 | 15.7 | % | 21,125 | 4.0 | % | 53,500 | 8.5 | % | ||||||||||||||||
Prior year - increase (decrease) | (17,622) | (10.1 | )% | (4,716) | (2.3 | )% | (54,407) | (10.4 | )% | (58,301) | (9.3 | )% | ||||||||||||||||
Net losses and loss expenses | $ | 85,838 | 49.3 | % | $ | 123,696 | 59.6 | % | $ | 268,594 | 51.3 | % | $ | 360,903 | 57.4 | % | ||||||||||||
Consolidated | ||||||||||||||||||||||||||||
Current year - non-catastrophe | $ | 401,133 | 68.7 | % | $ | 389,972 | 59.9 | % | $ | 1,181,288 | 66.8 | % | $ | 1,207,149 | 64.7 | % | ||||||||||||
Current year - property catastrophe | 4,850 | 0.8 | % | 35,500 | 5.5 | % | 25,725 | 1.5 | % | 60,500 | 3.2 | % | ||||||||||||||||
Prior year - increase (decrease) | (29,721) | (5.1 | )% | (8,591) | (1.3 | )% | (92,943) | (5.3 | )% | (94,071 | ) | (5.0 | )% | |||||||||||||||
Net losses and loss expenses | $ | 376,262 | 64.4 | % | $ | 416,881 | 64.1 | % | $ | 1,114,070 | 63.0 | % | $ | 1,173,578 | 62.9 | % | ||||||||||||
(1) "NPE" means net premiums earned. | ||||||||||||||||||||||||||||
Page 14
ALLIED WORLD ASSURANCE COMPANY HOLDINGS, AG
NET LOSS RESERVE DEVELOPMENT BY LOSS YEAR – CURRENT QUARTER
Three Months Ended September 30, 2016 | |||||||||||||||||||||
(Favorable) Unfavorable Development ($ in millions) | 2010 and Prior | 2011 | 2012 | 2013 | 2014 | 2015 | Total | ||||||||||||||
North American Insurance | |||||||||||||||||||||
Casualty | $ | (3.4) | $ | (0.4) | $ | 0.1 | $ | 2.1 | $ | 0.1 | $ | (0.1) | $ | (1.6) | |||||||
Professional liability | (15.4) | 0.1 | (0.7) | 8.1 | 0.1 | 0.0 | (7.8) | ||||||||||||||
Property | (0.2) | (2.0) | 0.0 | (0.8) | (1.0) | 0.1 | (3.9) | ||||||||||||||
Programs | 0.6 | (0.3) | (0.3) | (1.4) | (1.3) | (0.2) | (2.9) | ||||||||||||||
Healthcare | 0.0 | 0.0 | 0.0 | 0.0 | 0.0 | 0.0 | 0.0 | ||||||||||||||
Other specialty | 0.0 | 0.0 | 0.0 | 0.3 | (0.2) | 0.0 | 0.1 | ||||||||||||||
Total | $ | (18.4) | $ | (2.6) | $ | (0.9) | $ | 8.3 | $ | (2.3) | $ | (0.2) | $ | (16.1) | |||||||
Global Markets Insurance | |||||||||||||||||||||
Casualty | $ | (2.4) | $ | 0.0 | $ | (1.4) | $ | (0.5) | $ | (0.3) | $ | 0.0 | $ | (4.6) | |||||||
Professional liability | 4.6 | (0.8) | (0.1) | (0.6) | (0.5) | 0.0 | 2.6 | ||||||||||||||
Property | 0.1 | (0.5) | 0.3 | (0.5) | (0.4) | (2.5) | (3.5) | ||||||||||||||
Other specialty | (0.3) | 0.2 | 0.0 | (2.3) | 10.8 | 1.2 | 9.6 | ||||||||||||||
Total | $ | 2.0 | $ | (1.1) | $ | (1.2) | $ | (3.9) | $ | 9.6 | $ | (1.3) | $ | 4.1 | |||||||
Reinsurance | |||||||||||||||||||||
Property | $ | (0.1) | $ | 0.6 | $ | (0.9) | $ | (1.8) | $ | (6.1) | $ | (3.3) | $ | (11.6) | |||||||
Casualty | (3.1) | (1.8) | (4.4) | 3.3 | 0.2 | 1.3 | (4.5) | ||||||||||||||
Specialty | (0.4) | (0.1) | (0.2) | (0.4) | (0.7) | 0.3 | (1.5) | ||||||||||||||
Total | $ | (3.6) | $ | (1.3) | $ | (5.5) | $ | 1.1 | $ | (6.6) | $ | (1.7) | $ | (17.6) | |||||||
Consolidated | |||||||||||||||||||||
North American Insurance | $ | (18.4) | $ | (2.6) | $ | (0.9) | $ | 8.3 | $ | (2.3) | $ | (0.2) | $ | (16.1) | |||||||
Global Markets Insurance | 2.0 | (1.1) | (1.2) | (3.9) | 9.6 | (1.3) | 4.1 | ||||||||||||||
Reinsurance | (3.6) | (1.3) | (5.5) | 1.1 | (6.6) | (1.7) | (17.6) | ||||||||||||||
Total | $ | (20.0) | $ | (5.0) | $ | (7.6) | $ | 5.5 | $ | 0.7 | $ | (3.2) | $ | (29.6) | |||||||
Page 15
ALLIED WORLD ASSURANCE COMPANY HOLDINGS, AG
NET LOSS RESERVE DEVELOPMENT BY LOSS YEAR – PRIOR YEAR QUARTER
Three Months Ended September 30, 2015 | |||||||||||||||||||||
(Favorable) Unfavorable Development ($ in millions) | 2009 and Prior | 2010 | 2011 | 2012 | 2013 | 2014 | Total | ||||||||||||||
North American Insurance | |||||||||||||||||||||
Casualty | $ | (4.5) | $ | (2.2) | $ | 1.1 | $ | 6.5 | $ | 9.5 | $ | 1.9 | $ | 12.3 | |||||||
Professional liability | (6.1) | (1.9) | (3.7) | (3.9) | (0.6) | 3.3 | (12.9) | ||||||||||||||
Property | (1.4) | 0.2 | 0.2 | 0.5 | (1.6) | 2.0 | (0.1) | ||||||||||||||
Programs | 0.4 | (0.3) | (0.5) | (0.3) | (1.2) | 0.1 | (1.8) | ||||||||||||||
Healthcare | 0.0 | 0.0 | 0.0 | 0.0 | 0.0 | 0.0 | 0.0 | ||||||||||||||
Other specialty | 0.0 | 0.0 | 0.0 | 0.0 | 0.0 | 1.0 | 1.0 | ||||||||||||||
Total | $ | (11.6) | $ | (4.2) | $ | (2.9) | $ | 2.8 | $ | 6.1 | $ | 8.3 | $ | (1.5) | |||||||
Global Markets Insurance | |||||||||||||||||||||
Casualty | $ | (1.2) | $ | (1.0) | $ | 0.2 | $ | (0.4) | $ | 2.8 | $ | 0.5 | $ | 0.9 | |||||||
Professional liability | (1.1) | (1.0) | (1.1) | (1.0) | (1.0) | (0.3) | (5.5) | ||||||||||||||
Property | 0.4 | (0.5) | (0.1) | 0.5 | (0.1) | (1.4) | (1.2) | ||||||||||||||
Other specialty | (0.1) | 0.0 | (0.1) | 0.3 | 4.0 | (0.7) | 3.4 | ||||||||||||||
Total | $ | (2.0) | $ | (2.5) | $ | (1.1) | $ | (0.6) | $ | 5.7 | $ | (1.9) | $ | (2.4) | |||||||
Reinsurance | |||||||||||||||||||||
Property | $ | (0.6) | $ | 0.3 | $ | (0.8) | $ | (0.7) | $ | (1.0) | $ | (0.5) | $ | (3.3) | |||||||
Casualty | (4.5) | (1.4) | 0.8 | 1.8 | 0.1 | 1.1 | (2.1) | ||||||||||||||
Specialty | (0.4) | (0.1) | (0.2) | 0.9 | 0.0 | 0.5 | 0.7 | ||||||||||||||
Total | $ | (5.5) | $ | (1.2) | $ | (0.2) | $ | 2.0 | $ | (0.9) | $ | 1.1 | $ | (4.7) | |||||||
Consolidated | |||||||||||||||||||||
North American Insurance | $ | (11.6) | $ | (4.2) | $ | (2.9) | $ | 2.8 | $ | 6.1 | $ | 8.3 | $ | (1.5) | |||||||
Global Markets Insurance | (2.0) | (2.5) | (1.1) | (0.6) | 5.7 | (1.9) | (2.4) | ||||||||||||||
Reinsurance | (5.5) | (1.2) | (0.2) | 2.0 | (0.9) | 1.1 | (4.7) | ||||||||||||||
Total | $ | (19.1) | $ | (7.9) | $ | (4.2) | $ | 4.2 | $ | 10.9 | $ | 7.5 | $ | (8.6) | |||||||
Page 16
ALLIED WORLD ASSURANCE COMPANY HOLDINGS, AG
NET LOSS RESERVE DEVELOPMENT BY LOSS YEAR – CURRENT YEAR TO DATE
Nine Months Ended September 30, 2016 | |||||||||||||||||||||
(Favorable) Unfavorable Development ($ in millions) | 2010 and Prior | 2011 | 2012 | 2013 | 2014 | 2015 | Total | ||||||||||||||
North American Insurance | |||||||||||||||||||||
Casualty | $ | (30.7) | $ | (0.5) | $ | 13.3 | $ | 8.4 | $ | 6.5 | $ | 0.3 | $ | (2.7) | |||||||
Professional liability | (32.2) | (3.2) | (5.5) | 15.1 | 3.8 | 0.1 | (21.9) | ||||||||||||||
Property | (0.9) | (2.1) | 0.1 | (0.7) | (5.9) | 5.9 | (3.6) | ||||||||||||||
Programs | 1.7 | 0.9 | 4.2 | (4.9) | (4.6) | (0.7) | (3.4) | ||||||||||||||
Healthcare | 0.2 | (0.2) | 0.0 | 0.0 | 0.0 | 0.0 | 0.0 | ||||||||||||||
Other specialty | 0.0 | 0.0 | 0.0 | 0.3 | 0.2 | (1.2) | (0.7) | ||||||||||||||
Total | $ | (61.9) | $ | (5.1) | $ | 12.1 | $ | 18.2 | $ | 0.0 | $ | 4.4 | $ | (32.3) | |||||||
Global Markets Insurance | |||||||||||||||||||||
Casualty | $ | (5.7) | $ | (0.3) | $ | (2.2) | $ | (0.7) | $ | 0.2 | $ | 2.7 | $ | (6.0) | |||||||
Professional liability | 5.9 | (0.3) | (1.2) | 0.1 | 0.3 | 0.4 | 5.2 | ||||||||||||||
Property | (6.9) | 0.0 | 1.0 | (0.4) | (3.6) | 2.3 | (7.6) | ||||||||||||||
Other specialty | (0.5) | 0.6 | 0.0 | (1.5) | 10.8 | (7.2) | 2.2 | ||||||||||||||
Total | $ | (7.2) | $ | 0.0 | $ | (2.4) | $ | (2.5) | $ | 7.7 | $ | (1.8) | $ | (6.2) | |||||||
Reinsurance | |||||||||||||||||||||
Property | $ | 0.7 | $ | 3.6 | $ | (4.7) | $ | (11.3) | $ | (10.5) | $ | (26.6) | $ | (48.8) | |||||||
Casualty | (12.5) | (5.2) | 7.6 | 13.8 | 4.6 | (4.8) | 3.5 | ||||||||||||||
Specialty | (0.8) | (1.4) | 0.0 | 2.1 | (7.3) | (1.7) | (9.1) | ||||||||||||||
Total | $ | (12.6) | $ | (3.0) | $ | 2.9 | $ | 4.6 | $ | (13.2) | $ | (33.1) | $ | (54.4) | |||||||
Consolidated | |||||||||||||||||||||
North American Insurance | $ | (61.9) | $ | (5.1) | $ | 12.1 | $ | 18.2 | $ | 0.0 | $ | 4.4 | $ | (32.3) | |||||||
Global Markets Insurance | (7.2) | 0.0 | (2.4) | (2.5) | 7.7 | (1.8) | (6.2) | ||||||||||||||
Reinsurance | (12.6) | (3.0) | 2.9 | 4.6 | (13.2) | (33.1) | (54.4) | ||||||||||||||
Total | $ | (81.7) | $ | (8.1) | $ | 12.6 | $ | 20.3 | $ | (5.5) | $ | (30.5) | $ | (92.9) | |||||||
Page 17
ALLIED WORLD ASSURANCE COMPANY HOLDINGS, AG
NET LOSS RESERVE DEVELOPMENT BY LOSS YEAR – PRIOR YEAR TO DATE
Nine Months Ended September 30, 2015 | ||||||||||||||||||||||
(Favorable) Unfavorable Development ($ in millions) | 2009 and Prior | 2010 | 2011 | 2012 | 2013 | 2014 | Total | |||||||||||||||
North American Insurance | ||||||||||||||||||||||
Casualty | $ | (16.2) | $ | (4.5) | $ | (6.0) | $ | 12.7 | $ | 16.5 | $ | 2.2 | $ | 4.7 | ||||||||
Professional liability | 8.7 | (18.0) | (14.1) | (1.6) | (0.3) | 8.8 | (16.5) | |||||||||||||||
Property | (2.1) | 0.2 | (0.3) | (1.9) | (4.1) | 2.1 | (6.1) | |||||||||||||||
Programs | (2.5) | (3.5) | (2.7) | (2.8) | (0.5) | (0.3) | (12.3) | |||||||||||||||
Healthcare | (4.7) | (0.4) | 5.5 | 7.4 | 3.1 | 0.0 | 10.9 | |||||||||||||||
Other specialty | 0.0 | (0.1) | 0.0 | 0.5 | 0.0 | 2.9 | 3.3 | |||||||||||||||
Total | $ | (16.8) | $ | (26.3) | $ | (17.6) | $ | 14.3 | $ | 14.7 | $ | 15.7 | $ | (16.0) | ||||||||
Global Markets Insurance | ||||||||||||||||||||||
Casualty | $ | (7.7) | $ | (3.6) | $ | 0.3 | $ | 1.7 | $ | 2.3 | $ | (0.6) | $ | (7.6) | ||||||||
Professional liability | (0.8) | (5.8) | (2.0) | 3.3 | (1.5) | 0.1 | (6.7) | |||||||||||||||
Property | (1.3) | (0.3) | (0.5) | 0.3 | (4.4) | (5.2) | (11.4) | |||||||||||||||
Other specialty | (0.2) | (0.1) | (0.3) | (0.1) | 5.0 | 1.6 | 5.9 | |||||||||||||||
Total | $ | (10.0) | $ | (9.8) | $ | (2.5) | $ | 5.2 | $ | 1.4 | $ | (4.1) | $ | (19.8) | ||||||||
Reinsurance | ||||||||||||||||||||||
Property | $ | (2.1) | $ | 1.9 | $ | 3.2 | $ | (8.3) | $ | 7.9 | $ | (45.0) | $ | (42.4) | ||||||||
Casualty | (17.3) | (14.3) | 1.3 | 6.6 | 4.8 | 2.5 | (16.4) | |||||||||||||||
Specialty | (0.7) | (0.1) | (0.5) | 1.2 | (1.8) | 2.4 | 0.5 | |||||||||||||||
Total | $ | (20.1) | $ | (12.5) | $ | 4.0 | $ | (0.5) | $ | 10.9 | $ | (40.1) | $ | (58.3) | ||||||||
Consolidated | ||||||||||||||||||||||
North American Insurance | $ | (16.8) | $ | (26.3) | $ | (17.6) | $ | 14.3 | $ | 14.7 | $ | 15.7 | $ | (16.0) | ||||||||
Global Markets Insurance | (10.0) | (9.8) | (2.5) | 5.2 | 1.4 | (4.1) | (19.8) | |||||||||||||||
Reinsurance | (20.1) | (12.5) | 4.0 | (0.5) | 10.9 | (40.1) | (58.3) | |||||||||||||||
Total | $ | (46.9) | $ | (48.6) | $ | (16.1) | $ | 19.0 | $ | 27.0 | $ | (28.5) | $ | (94.1) | ||||||||
Page 18
ALLIED WORLD ASSURANCE COMPANY HOLDINGS, AG
REINSURANCE RECOVERABLE
As of September 30, 2016 | As of December 31, 2015 | |||||||||||||||||||||||||
A.M. Best | Reinsurance | A.M. Best | Reinsurance | |||||||||||||||||||||||
Top Ten Reinsurers | Rating | Recoverable | Percentage | Collateral | Rating | Recoverable | Percentage | Collateral | ||||||||||||||||||
Munich Re | A+ | $ | 312,525 | 20.1 | % | $ | 86,021 | A+ | $ | 307,865 | 20.8 | % | $ | 90,393 | ||||||||||||
Axis Capital | A+ | 154,696 | 10.0 | % | 7,122 | A+ | 150,832 | 10.2 | % | 7,122 | ||||||||||||||||
Swiss Re | A+ | 132,463 | 8.5 | % | 6,088 | A+ | 103,872 | 7.0 | % | 6,088 | ||||||||||||||||
Arch Re | A+ | 104,835 | 6.8 | % | 2,919 | A+ | 115,330 | 7.8 | % | 2,894 | ||||||||||||||||
Markel | A | 97,269 | 6.3 | % | 26,221 | A | 90,105 | 6.1 | % | 25,232 | ||||||||||||||||
RenaissanceRe | A+ | 89,495 | 5.8 | % | — | A+ | 93,991 | 6.4 | % | — | ||||||||||||||||
XL Group | A | 84,113 | 5.4 | % | 796 | A | 87,132 | 5.9 | % | 794 | ||||||||||||||||
Odyssey Reinsurance | A | 73,767 | 4.8 | % | — | A | 77,203 | 5.2 | % | — | ||||||||||||||||
Everest Re | A+ | 60,474 | 3.9 | % | 19,018 | A+ | 51,006 | 3.4 | % | 19,017 | ||||||||||||||||
Transatlantic | A | 53,597 | 3.5 | % | 807 | A | 55,336 | 3.7 | % | — | ||||||||||||||||
Top ten reinsurers | 1,163,234 | 75.1 | % | 148,992 | 1,132,672 | 76.5 | % | 151,540 | ||||||||||||||||||
Other reinsurers' balances | 387,425 | 24.9 | % | 30,172 | 347,287 | 23.5 | % | 27,183 | ||||||||||||||||||
Total reinsurance recoverable | $ | 1,550,659 | 100.0 | % | $ | 179,164 | $ | 1,479,959 | 100.0 | % | $ | 178,723 | ||||||||||||||
Reinsurance | Reinsurance | |||||||||||||||||||||||||
A.M Best Rating | Recoverable | Percentage | Collateral | Recoverable | Percentage | Collateral | ||||||||||||||||||||
A++ | $ | 92,010 | 5.9 | % | $ | 1,513 | $ | 81,374 | 5.5 | % | $ | 1,399 | ||||||||||||||
A+ | 919,531 | 59.3 | % | 121,167 | 896,981 | 60.6 | % | 125,514 | ||||||||||||||||||
A | 523,483 | 33.8 | % | 30,926 | 486,344 | 32.9 | % | 28,871 | ||||||||||||||||||
A- | 4,682 | 0.3 | % | — | 4,408 | 0.3 | % | — | ||||||||||||||||||
Total "A-" or higher | 1,539,706 | 99.3 | % | 153,606 | 1,469,107 | 99.3 | % | 155,784 | ||||||||||||||||||
B++ | — | 0.0 | % | — | 4 | 0.0 | % | — | ||||||||||||||||||
NR | 10,953 | 0.7 | % | 25,558 | 10,848 | 0.7 | % | 22,939 | ||||||||||||||||||
Total reinsurance recoverable | $ | 1,550,659 | 100.0 | % | $ | 179,164 | $ | 1,479,959 | 100.0 | % | $ | 178,723 | ||||||||||||||
Page 19
ALLIED WORLD ASSURANCE COMPANY HOLDINGS, AG
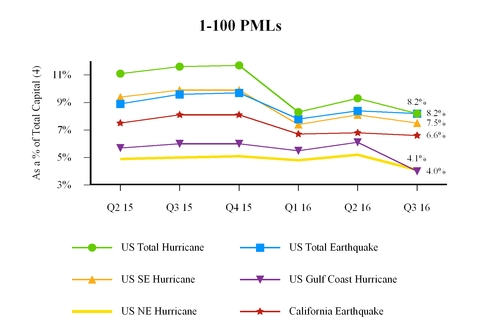
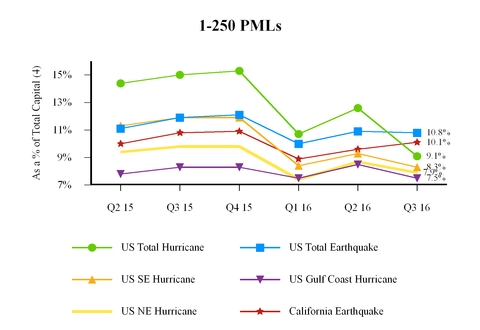
PROBABLE MAXIMUM LOSSES
Consolidated Estimated Net Loss as of September 1, 2016 | |||||||||||||||||||
1-in-100 Year | 1-in-250 Year | 1-in-100 Year | 1-in-250 Year | ||||||||||||||||
($ in millions) | ($ in millions) | ||||||||||||||||||
Zone | Peril | PML | PML | Zone | Peril | PML | PML | ||||||||||||
U.S. total | Hurricane | $ | 399 | $ | 443 | California | Earthquake | $ | 322 | $ | 492 | ||||||||
U.S. total | Earthquake | $ | 399 | $ | 526 | U.S. Southeast (1) | Hurricane | $ | 364 | $ | 403 | ||||||||
U.S. Gulf Coast (2) | Hurricane | $ | 192 | $ | 366 | ||||||||||||||
U.S. Northeast (3) | Hurricane | $ | 198 | $ | 384 | ||||||||||||||
PMLs Over the Most Recent Six Quarters as a % of Total Capital | |||||
(1) Florida, Georgia, North Carolina and South Carolina. | ||||||||||||||||||||
(2) Alabama, Louisiana, Mississippi and Texas. | ||||||||||||||||||||
(3) Connecticut, Maine, Massachusetts, New Hampshire, New York, Rhode Island and Vermont. | ||||||||||||||||||||
(4) Total capital combines shareholders' equity, other long-term debt and senior notes adjusted for the repayment at maturity of the senior notes in August 2016 with the proceeds from the senior notes issued in October 2015. | ||||||||||||||||||||
Note: We develop the estimates of losses expected from certain catastrophes for our portfolio of (re)insurance contracts using commercially available catastrophe models. The above tables show our largest Probable Maximum Losses ("PMLs") from a single catastrophic event (1) within a specific peril which corresponds to peak industry catastrophe exposures and (2) within a defined zone which corresponds to peak industry catastrophe exposures at September 1, 2016. A zone is a geographic area in which the insurance risks are considered to be correlated to a single catastrophic event. Net loss estimates and zonal aggregates are before income tax and net of reinsurance and retrocessional recoveries. The 1-in-100 year and 1-in-250 year return periods refer to the frequency with which losses of a given amount or greater are expected to occur. | ||||||||||||||||||||
Page 20
ALLIED WORLD ASSURANCE COMPANY HOLDINGS, AG
CONSOLIDATED TOTAL INVESTMENT PORTFOLIO
As of September 30, 2016 | As of December 31, 2015 | ||||||||||||||||||||||||||||||
Average | Portfolio | Investment | Non-Investment | ||||||||||||||||||||||||||||
Fair Value | Rating | Percentage | Grade | Grade | Total | Fair Value | |||||||||||||||||||||||||
Cash and cash equivalents | $ | 872,690 | AAA | 9.3 | % | $ | 872,690 | $ | — | $ | 872,690 | $ | 668,612 | ||||||||||||||||||
U.S. government and agency securities | 1,471,170 | AA+ | 15.8 | % | 1,471,170 | — | 1,471,170 | 1,434,048 | |||||||||||||||||||||||
Non-U.S. government and government agencies | 488,167 | AA | 5.2 | % | 460,819 | 27,348 | 488,167 | 556,758 | |||||||||||||||||||||||
State, municipalities and political subdivisions | 480,770 | AA | 5.1 | % | 449,752 | 31,018 | 480,770 | 413,473 | |||||||||||||||||||||||
Mortgage-backed securities: | |||||||||||||||||||||||||||||||
Agency MBS | 845,880 | AA+ | 9.0 | % | 845,880 | — | 845,880 | 751,838 | |||||||||||||||||||||||
Non-agency RMBS | 22,610 | BB | 0.2 | % | 11,021 | 11,589 | 22,610 | 34,015 | |||||||||||||||||||||||
CMBS | 631,770 | BB | 6.8 | % | 270,162 | 361,608 | 631,770 | 582,785 | |||||||||||||||||||||||
Total mortgage-backed securities | 1,500,260 | 16.0 | % | 1,127,063 | 373,197 | 1,500,260 | 1,368,638 | ||||||||||||||||||||||||
Corporate securities(1): | |||||||||||||||||||||||||||||||
Financials | 1,084,247 | A | 11.6 | % | 1,066,596 | 17,651 | 1,084,247 | 1,275,408 | |||||||||||||||||||||||
Industrials | 1,372,480 | A- | 14.7 | % | 1,256,571 | 115,909 | 1,372,480 | 1,308,093 | |||||||||||||||||||||||
Utilities | 138,397 | BBB+ | 1.5 | % | 135,815 | 2,582 | 138,397 | 118,945 | |||||||||||||||||||||||
Total corporate securities | 2,595,124 | 27.8 | % | 2,458,982 | 136,142 | 2,595,124 | 2,702,446 | ||||||||||||||||||||||||
Total asset-backed securities | 791,810 | AA | 8.5 | % | 749,496 | 42,314 | 791,810 | 726,175 | |||||||||||||||||||||||
Equities | 216,141 | N/A | 2.3 | % | — | 216,141 | 216,141 | 403,022 | |||||||||||||||||||||||
Other invested assets: | |||||||||||||||||||||||||||||||
Private equity | 495,531 | N/A | 5.3 | % | — | 495,531 | 495,531 | 447,455 | |||||||||||||||||||||||
Hedge funds | 331,567 | N/A | 3.5 | % | — | 331,567 | 331,567 | 378,988 | |||||||||||||||||||||||
Other private securities | 114,555 | N/A | 1.2 | % | — | 114,555 | 114,555 | 126,492 | |||||||||||||||||||||||
High yield loan fund | — | N/A | 0.0 | % | — | — | — | 13,774 | |||||||||||||||||||||||
Total other invested assets | 941,653 | 10.0 | % | — | 941,653 | 941,653 | 966,709 | ||||||||||||||||||||||||
Total investment portfolio | $ | 9,357,785 | 100.0 | % | $ | 7,589,972 | $ | 1,767,813 | $ | 9,357,785 | $ | 9,239,881 | |||||||||||||||||||
Annualized book yield, year to date | 2.3 | % | 2.1 | % | |||||||||||||||||||||||||||
Duration(2) | 2.9 years | 2.6 years | |||||||||||||||||||||||||||||
Average credit quality (S&P) | AA- | A+ | |||||||||||||||||||||||||||||
(1) Includes floating rate bank loans. | |||||||||||||||||||||||||||||||
(2) Includes only fixed maturity investments and cash and cash equivalents. | |||||||||||||||||||||||||||||||
Page 21
ALLIED WORLD ASSURANCE COMPANY HOLDINGS, AG
INVESTMENT INCOME, BOOK YIELD AND PORTFOLIO RETURN
Three Months Ended | Nine Months Ended | ||||||||||||||||
September 30, | September 30, | September 30, | September 30, | ||||||||||||||
2016 | 2015 | 2016 | 2015 | ||||||||||||||
NET INVESTMENT INCOME | |||||||||||||||||
Fixed maturity investments | $ | 46,414 | $ | 42,801 | $ | 143,301 | $ | 120,264 | |||||||||
Equity securities | 1,143 | 3,115 | 4,393 | 11,540 | |||||||||||||
Other invested assets: hedge funds and private equity | 5,867 | 3,342 | 18,140 | 16,305 | |||||||||||||
Other invested assets: other private securities | 973 | 1,804 | 5,698 | (1,119) | |||||||||||||
Cash and cash equivalents | 687 | 277 | 2,004 | 1,178 | |||||||||||||
Expenses | (4,520) | (5,672) | (13,881) | (15,190) | |||||||||||||
Net investment income | $ | 50,564 | $ | 45,667 | $ | 159,655 | $ | 132,978 | |||||||||
NET REALIZED INVESTMENT GAINS (LOSSES) | |||||||||||||||||
Net realized gains (losses) on sale: | |||||||||||||||||
Fixed maturity investments | $ | 1,351 | $ | (5,251) | $ | 18,170 | $ | 5,062 | |||||||||
Equity securities | 1,842 | (12,238) | 2,294 | 14,916 | |||||||||||||
Other invested assets: hedge funds and private equity | 3,493 | 1,448 | 17,614 | 22,286 | |||||||||||||
Derivatives | 2,162 | (19,793) | (25,178) | (17,557) | |||||||||||||
Mark-to-market gains (losses): | |||||||||||||||||
Fixed maturity investments | (9,452) | (15,271) | 108,267 | (42,442) | |||||||||||||
Equity securities | 11,119 | (62,852) | (3,064) | (57,762) | |||||||||||||
Other invested assets: hedge funds and private equity | 3,347 | 443 | (15,333) | (13,227) | |||||||||||||
Derivatives | (3,199) | (112) | 1,244 | (59) | |||||||||||||
Net realized investment gains (losses) | $ | 10,663 | $ | (113,626) | $ | 104,014 | $ | (88,783) | |||||||||
TOTAL FINANCIAL STATEMENT PORTFOLIO RETURN | $ | 61,227 | $ | (67,959) | $ | 263,669 | $ | 44,195 | |||||||||
ANNUALIZED INVESTMENT BOOK YIELD | |||||||||||||||||
Net investment income, recurring | $ | 50,564 | $ | 45,667 | $ | 159,655 | $ | 132,978 | |||||||||
Annualized net investment income | 202,256 | 182,668 | 212,873 | 177,304 | |||||||||||||
Average aggregate invested assets, at cost | $ | 9,269,293 | $ | 8,750,453 | $ | 9,109,465 | $ | 8,601,085 | |||||||||
Annualized investment book yield | 2.2 | % | 2.1 | % | 2.3 | % | 2.1 | % | |||||||||
FINANCIAL STATEMENT PORTFOLIO RETURN | |||||||||||||||||
Total financial statement portfolio return | $ | 61,227 | $ | (67,959) | $ | 263,669 | $ | 44,195 | |||||||||
Average aggregate invested assets, at fair value | $ | 9,347,150 | $ | 8,864,607 | $ | 9,143,673 | $ | 8,722,660 | |||||||||
Financial statement portfolio return | 0.7 | % | (0.8 | )% | 2.9 | % | 0.5 | % | |||||||||
Page 22
ALLIED WORLD ASSURANCE COMPANY HOLDINGS, AG
ADDITIONAL INVESTMENT DETAIL
Other Invested Assets: | Top 10 Corporate Fixed Income and Equity Exposures: | ||||||||||||||||||||||||
Carrying Value | Fair Value | ||||||||||||||||||||||||
Fund Details | September 30, 2016 | Unfunded Commitments | Corporate | September 30, 2016 | Portfolio Percentage | ||||||||||||||||||||
Private Equity: | Morgan Stanley | $ | 52,716 | 0.6 | % | ||||||||||||||||||||
Primary and secondary | $ | 248,067 | $ | 221,849 | JP Morgan Chase & Co | 52,251 | 0.6 | % | |||||||||||||||||
Mezzanine debt | 221,005 | 195,142 | Apple Inc | 50,670 | 0.5 | % | |||||||||||||||||||
Distressed | 5,086 | 3,807 | Bank of America Corp | 44,131 | 0.5 | % | |||||||||||||||||||
Real estate | 21,373 | 189,342 | Wells Fargo & Co | 41,841 | 0.5 | % | |||||||||||||||||||
Total private equity | 495,531 | 610,140 | US Bancorp | 37,220 | 0.4 | % | |||||||||||||||||||
Hedge Funds: | General Electric Co | 36,559 | 0.4 | % | |||||||||||||||||||||
Distressed | 173,913 | — | Oracle Corp | 35,919 | 0.4 | % | |||||||||||||||||||
Relative value credit | 82,602 | — | Microsoft Corp | 34,759 | 0.4 | % | |||||||||||||||||||
Equity long/short | 64,824 | — | PNC Financial Services Group | 34,686 | 0.4 | % | |||||||||||||||||||
Fund of funds | 10,227 | — | |||||||||||||||||||||||
Total hedge funds | 331,567 | — | |||||||||||||||||||||||
Other private securities | 114,555 | — | |||||||||||||||||||||||
Total other invested assets | $ | 941,653 | $ | 610,140 | |||||||||||||||||||||
Fixed Income Credit Quality: | September 30, 2016 | December 31, 2015 | |||||||||||||||||||||||
Rating | Fair Value | Percentage | Fair Value | Percentage | |||||||||||||||||||||
U.S. government and agencies | $ | 1,471,170 | 20.1 | % | $ | 1,434,049 | 19.9 | % | |||||||||||||||||
AAA/Aaa | 1,446,630 | 19.7 | % | 1,572,212 | 21.8 | % | |||||||||||||||||||
AA/Aa | 1,708,724 | 23.3 | % | 1,484,109 | 20.6 | % | |||||||||||||||||||
A/A | 1,141,276 | 15.6 | % | 1,083,257 | 15.0 | % | |||||||||||||||||||
BBB/Baa | 949,482 | 13.0 | % | 920,220 | 12.8 | % | |||||||||||||||||||
Total BBB/Baa and above | 6,717,282 | 91.7 | % | 6,493,847 | 90.1 | % | |||||||||||||||||||
BB/Bb | 62,551 | 0.9 | % | 88,708 | 1.2 | % | |||||||||||||||||||
B/B | 138,636 | 1.9 | % | 232,070 | 3.3 | % | |||||||||||||||||||
CCC+ and below | 408,832 | 5.5 | % | 386,913 | 5.4 | % | |||||||||||||||||||
Total | $ | 7,327,301 | 100.0 | % | $ | 7,201,538 | 100.0 | % | |||||||||||||||||
Page 23
ALLIED WORLD ASSURANCE COMPANY HOLDINGS, AG
SHARE REPURCHASE DETAIL
Average | Average | Remaining | ||||||||||||||||||
Aggregate Cost | Number of | Price paid | Average | Repurchase | Share | |||||||||||||||
of Shares | Shares | Per Share | Diluted Book | Price to Diluted | Repurchase | |||||||||||||||
Period | Repurchased | Repurchased | Repurchased | Value Per Share(1) | Book Value | Authorization | ||||||||||||||
Three Months Ended: | ||||||||||||||||||||
March 31, 2015 | $ | 50,949 | 1,271,213 | $ | 40.08 | $ | 38.63 | 103.8 | % | |||||||||||
June 30, 2015 | 194,352 | 4,776,224 | 40.69 | 39.45 | 103.1 | % | ||||||||||||||
September 30, 2015 | — | — | 0.00 | 38.97 | — | |||||||||||||||
December 31, 2015 | — | — | 0.00 | 37.90 | — | |||||||||||||||
Total - 2015 | $ | 245,301 | 6,047,437 | $ | 40.56 | $ | 38.03 | 106.7 | % | |||||||||||
Three Months Ended: | ||||||||||||||||||||
March 31, 2016 | $ | 50,000 | 1,460,888 | $ | 34.23 | $ | 37.96 | 90.2 | % | |||||||||||
June 30, 2016 | 90,022 | 2,491,355 | 36.13 | 38.92 | 92.8 | % | ||||||||||||||
September 30, 2016 | 26,231 | 716,970 | 36.59 | 39.95 | 91.6 | % | ||||||||||||||
Total - 2016 | $ | 166,253 | 4,669,213 | $ | 35.61 | $ | 38.99 | 91.3 | % | $ | 400,414 | |||||||||
(1) Average of beginning and ending diluted book value per share for each period presented and weighted average total. | ||||||||||||||||||||
Page 24
ALLIED WORLD ASSURANCE COMPANY HOLDINGS, AG
CAPITAL STRUCTURE AND LEVERAGE RATIOS
As of | As of | |||||||
September 30, 2016 | December 31, 2015 | |||||||
Senior notes | $ | 793,973 | $ | 1,292,907 | ||||
Other long-term debt | 23,306 | 23,033 | ||||||
Shareholders' equity | 3,615,869 | 3,532,542 | ||||||
Total capitalization | $ | 4,433,148 | $ | 4,848,482 | ||||
Leverage Ratios | ||||||||
Debt to total capitalization(1) | 18.4 | % | 27.1 | %* | ||||
Net premiums written (trailing 12 months) | $ | 2,275,326 | $ | 2,448,007 | ||||
Net premiums written (trailing 12 months) to shareholders' equity | 0.63 x | 0.69 x | ||||||
Total investments and cash & cash equivalents | $ | 9,357,785 | $ | 9,239,881 | ||||
Total investments and cash & cash equivalents to shareholders' equity | 2.59 x | 2.62 x | ||||||
Reserve for losses and loss expenses | $ | 6,665,796 | $ | 6,456,156 | ||||
Deduct: reinsurance recoverable | (1,550,659) | (1,479,959) | ||||||
Net reserve for losses and loss expenses | $ | 5,115,137 | 4,976,197 | |||||
Net reserve for losses and loss expenses to shareholders' equity | 1.41 x | 1.41 x | ||||||
* Includes $500 million 4.35% senior notes issued in October 2015, the proceeds of which were used to repay at maturity the $500 million 7.50% senior notes in August 2016. | ||||||||
Fixed Charge Coverage Ratio | Three Months Ended | Nine Months Ended | |||||||||||||||
September 30, | September 30, | September 30, | September 30, | ||||||||||||||
2016 | 2015 | 2016 | 2015 | ||||||||||||||
Interest expense | $ | 13,462 | $ | 14,469 | $ | 53,290 | $ | 43,272 | |||||||||
Income (loss) before income taxes | 65,463 | (56,911 | ) | 300,389 | 83,955 | ||||||||||||
Interest expense | 13,462 | 14,469 | 53,290 | 43,272 | |||||||||||||
Earnings for calculation of fixed coverage ratio | $ | 78,925 | $ | (42,442 | ) | $ | 353,679 | $ | 127,227 | ||||||||
Fixed charge coverage ratio | 5.9 | x | (2.9 | ) x | 6.6 | x | 2.9 | x | |||||||||
Page 25
ALLIED WORLD ASSURANCE COMPANY HOLDINGS, AG
OPERATING INCOME RECONCILIATION AND
BASIC AND DILUTED EARNINGS PER SHARE INFORMATION
Three Months Ended | Nine Months Ended | |||||||||||||||||||||
September 30, | June 30, | March 31, | December 31, | September 30, | September 30, | September 30, | ||||||||||||||||
2016 | 2016 | 2016 | 2015 | 2015 | 2016 | 2015 | ||||||||||||||||
Net income (loss) | $ | 68,613 | $ | 153,410 | $ | 74,099 | $ | 1,707 | $ | (51,630) | $ | 296,121 | $ | 82,184 | ||||||||
Add pre-tax effect of: | ||||||||||||||||||||||
Net realized investment (gains) losses | (10,663) | (74,493) | (18,858) | 38,849 | 113,626 | (104,014) | 88,783 | |||||||||||||||
Foreign exchange loss (gain) | 1,007 | (2,887) | (3,011) | 920 | (793) | (4,891) | 10,369 | |||||||||||||||
Income tax (benefit) expense(1) | (3,733) | 6,651 | 6,779 | 1,536 | (9,764) | 9,697 | (12,378) | |||||||||||||||
Operating income | $ | 55,224 | $ | 82,681 | $ | 59,009 | $ | 43,012 | $ | 51,439 | $ | 196,913 | $ | 168,958 | ||||||||
Weighted average common shares outstanding | ||||||||||||||||||||||
Basic | 87,102,290 | 88,742,484 | 90,254,512 | 90,934,107 | 90,882,511 | 88,691,983 | 93,068,088 | |||||||||||||||
Diluted | 88,603,101 | 90,040,509 | 91,559,225 | 92,422,422 | 92,440,277* | 90,113,606 | 94,724,980 | |||||||||||||||
Basic per share data | ||||||||||||||||||||||
Net income (loss) | $ | 0.79 | $ | 1.73 | $ | 0.82 | $ | 0.02 | $ | (0.57) | $ | 3.34 | $ | 0.88 | ||||||||
Add pre-tax effect of: | ||||||||||||||||||||||
Net realized investment (gains) losses | (0.12) | (0.84) | (0.21) | 0.43 | 1.25 | (1.17) | 0.95 | |||||||||||||||
Foreign exchange loss (gain) | 0.01 | (0.03) | (0.03) | 0.01 | (0.01) | (0.06) | 0.11 | |||||||||||||||
Income tax (benefit) expense(1) | (0.04) | 0.07 | 0.08 | 0.01 | (0.11) | 0.11 | (0.13) | |||||||||||||||
Operating income | $ | 0.64 | $ | 0.93 | $ | 0.66 | $ | 0.47 | $ | 0.56 | $ | 2.22 | $ | 1.81 | ||||||||
Diluted per share data | ||||||||||||||||||||||
Net income (loss) | $ | 0.77 | $ | 1.70 | $ | 0.81 | $ | 0.02 | $ | (0.56)* | $ | 3.29 | $ | 0.87 | ||||||||
Add pre-tax effect of: | ||||||||||||||||||||||
Net realized investment (gains) losses | (0.12) | (0.83) | (0.21) | 0.42 | 1.23 | (1.15) | 0.94 | |||||||||||||||
Foreign exchange loss (gain) | 0.01 | (0.03) | (0.03) | 0.01 | (0.01) | (0.05) | 0.11 | |||||||||||||||
Income tax (benefit) expense(1) | (0.04) | 0.07 | 0.08 | 0.02 | (0.11) | 0.11 | (0.13) | |||||||||||||||
Operating income | $ | 0.62 | $ | 0.91 | $ | 0.65 | $ | 0.47 | $ | 0.55 | $ | 2.19 | $ | 1.79 | ||||||||
(1) Represents the tax expense or benefit associated with the specific country to which the pre-tax adjustment related to. | ||||||||||||||||||||||
* Diluted weighted average common shares outstanding were only used in the calculation of diluted operating income per share, and not in the calculation of diluted earnings per share, | ||||||||||||||||||||||
as there was a net loss during the three months ended September 30, 2015. | ||||||||||||||||||||||
Page 26
ALLIED WORLD ASSURANCE COMPANY HOLDINGS, AG
RETURN ON AVERAGE SHAREHOLDERS’ EQUITY AND AVERAGE TANGIBLE SHAREHOLDERS' EQUITY AND RECONCILIATION OF AVERAGE SHAREHOLDERS’ EQUITY
Three Months Ended | Nine Months Ended | ||||||||||||||||||||||||||||
September 30, | June 30, | March 31, | December 31, | September 30, | September 30, | September 30, | |||||||||||||||||||||||
2016 | 2016 | 2016 | 2015 | 2015 | 2016 | 2015 | |||||||||||||||||||||||
Opening shareholders' equity | $ | 3,584,452 | $ | 3,535,463 | $ | 3,532,542 | $ | 3,555,405 | $ | 3,624,801 | $ | 3,532,542 | $ | 3,778,291 | |||||||||||||||
Add: accumulated other comprehensive loss | 6,024 | 6,168 | 9,297 | 4,265 | 3,272 | 9,297 | — | ||||||||||||||||||||||
Adjusted opening shareholders' equity | $ | 3,590,476 | $ | 3,541,631 | $ | 3,541,839 | $ | 3,559,670 | $ | 3,628,073 | $ | 3,541,839 | $ | 3,778,291 | |||||||||||||||
Adjusted opening tangible shareholders' equity(1) | 3,084,360 | 3,036,217 | 3,037,089 | 3,074,277 | 3,133,976 | 3,037,089 | 3,453,735 | ||||||||||||||||||||||
Closing shareholders' equity | $ | 3,615,869 | $ | 3,584,452 | $ | 3,535,463 | $ | 3,532,542 | $ | 3,555,405 | $ | 3,615,869 | $ | 3,555,405 | |||||||||||||||
Add: accumulated other comprehensive loss | 5,421 | 6,024 | 6,168 | 9,297 | 4,265 | 5,421 | 4,265 | ||||||||||||||||||||||
Adjusted closing shareholders' equity | $ | 3,621,290 | $ | 3,590,476 | $ | 3,541,631 | $ | 3,541,839 | $ | 3,559,670 | $ | 3,621,290 | $ | 3,559,670 | |||||||||||||||
Adjusted closing tangible shareholders' equity(1) | 3,117,422 | 3,084,360 | 3,036,217 | 3,037,089 | 3,074,277 | 3,117,422 | 3,074,277 | ||||||||||||||||||||||
Average adjusted shareholders' equity | $ | 3,605,883 | $ | 3,566,054 | $ | 3,541,735 | $ | 3,550,755 | $ | 3,593,872 | $ | 3,581,565 | $ | 3,668,981 | |||||||||||||||
Average adjusted tangible shareholders' equity | 3,100,891 | 3,060,289 | 3,036,653 | 3,055,683 | 3,104,127 | 3,077,256 | 3,264,006 | ||||||||||||||||||||||
Net income (loss) available to shareholders | $ | 68,613 | $ | 153,410 | $ | 74,099 | $ | 1,707 | $ | (51,630) | $ | 296,121 | $ | 82,184 | |||||||||||||||
Annualized net income (loss) available to shareholders | $ | 274,452 | $ | 613,640 | $ | 296,396 | $ | 6,828 | $ | (206,520) | $ | 394,828 | $ | 109,579 | |||||||||||||||
Annualized return on average shareholders' equity - net income (loss) available to shareholders | 7.6 | % | 17.2 | % | 8.4 | % | 0.2 | % | (5.7 | )% | 11.0 | % | 3.0 | % | |||||||||||||||
Annualized return on average tangible shareholders' equity - net income (loss) available to shareholders | 8.9 | % | 20.1 | % | 9.8 | % | 0.2 | % | (6.7 | )% | 12.8 | % | 3.4 | % | |||||||||||||||
Operating income available to shareholders | $ | 55,224 | $ | 82,681 | $ | 59,009 | $ | 43,012 | $ | 51,439 | $ | 196,913 | $ | 168,958 | |||||||||||||||
Annualized operating income available to shareholders | $ | 220,896 | $ | 330,724 | $ | 236,036 | $ | 172,048 | $ | 205,756 | $ | 262,551 | $ | 225,277 | |||||||||||||||
Annualized return on average shareholders' equity - operating income available to shareholders | 6.1 | % | 9.3 | % | 6.7 | % | 4.8 | % | 5.7 | % | 7.3 | % | 6.1 | % | |||||||||||||||
Annualized return on average tangible shareholders' equity - operating income available to shareholders | 7.1 | % | 10.8 | % | 7.8 | % | 5.6 | % | 6.6 | % | 8.5 | % | 6.9 | % | |||||||||||||||
(1) Represents adjusted shareholders' equity less goodwill and intangible assets for each period presented. | |||||||||||||||||||||||||||||
Page 27
ALLIED WORLD ASSURANCE COMPANY HOLDINGS, AG
RECONCILIATION OF DILUTED BOOK VALUE PER SHARE AND TANGIBLE BOOK VALUE PER SHARE
As of | As of | As of | As of | ||||||||||||
September 30, | June 30, | December 31, | September 30, | ||||||||||||
2016 | 2016 | 2015 | 2015 | ||||||||||||
Price per share at period end | $ | 40.42 | $ | 35.14 | $ | 37.19 | $ | 38.17 | |||||||
Total shareholders' equity | $ | 3,615,869 | $ | 3,584,452 | $ | 3,532,542 | $ | 3,555,405 | |||||||
Deduct: | |||||||||||||||
Goodwill | 392,768 | 392,643 | 388,127 | 354,781 | |||||||||||
Intangible assets | 111,100 | 113,473 | 116,623 | 130,612 | |||||||||||
Total tangible shareholders' equity | $ | 3,112,001 | $ | 3,078,336 | $ | 3,027,792 | $ | 3,070,012 | |||||||
Basic common shares outstanding | 86,974,284 | 87,463,950 | 90,959,635 | 90,911,888 | |||||||||||
Add: unvested restricted stock units | 1,194,576 | 1,215,116 | 819,309 | 823,635 | |||||||||||
Add: performance based equity awards | 588,537 | 594,240 | 591,683 | 591,683 | |||||||||||
Add: employee share purchase plan | 38,404 | 62,451 | 53,514 | 32,515 | |||||||||||
Add: dilutive stock options outstanding | 1,652,847 | 1,833,830 | 1,968,607 | 2,020,354 | |||||||||||
Weighted average exercise price per share | $ | 17.14 | $ | 16.96 | $ | 16.87 | $ | 16.70 | |||||||
Deduct: stock options bought back via treasury method | (700,903) | (885,060) | (892,993) | (883,846) | |||||||||||
Common shares and common share equivalents outstanding | 89,747,745 | 90,284,527 | 93,499,755 | 93,496,229 | |||||||||||
Basic book value per common share | $ | 41.57 | $ | 40.98 | $ | 38.84 | $ | 39.11 | |||||||
Year-to-date percentage change in basic book value per common share | 7.0 | % | 5.5 | % | (0.7 | )% | |||||||||
Diluted book value per common share | $ | 40.29 | $ | 39.70 | $ | 37.78 | $ | 38.03 | |||||||
Year-to-date percentage change in diluted book value per common share | 6.6 | % | 5.1 | % | (0.7 | )% | |||||||||
Basic tangible book value per common share | $ | 35.78 | $ | 35.20 | $ | 33.29 | $ | 33.77 | |||||||
Year-to-date percentage change in basic tangible book value per common share | 7.5 | % | 5.7 | % | (1.4 | )% | |||||||||
Diluted tangible book value per common share | $ | 34.67 | $ | 34.10 | $ | 32.38 | $ | 32.84 | |||||||
Year-to-date percentage change in diluted tangible book value per common share | 7.1 | % | 5.3 | % | (1.4 | )% | |||||||||
Page 28
ALLIED WORLD ASSURANCE COMPANY HOLDINGS, AG
REGULATION G
In presenting the company's results, management has included and discussed certain non-GAAP financial measures. Management believes that these non-GAAP measures, which may be defined differently by other companies, better explain the company's results of operations in a manner that allows for a more complete understanding of the underlying trends in the company's business. However, these measures should not be viewed as a substitute for those determined in accordance with GAAP.
OPERATING INCOME
Operating income is an internal performance measure used by the company in the management of its operations and represents after-tax operational results excluding, as applicable, net realized investment gains or losses, net foreign exchange gain or loss, impairment of intangible assets and other non-recurring items. The company excludes net realized investment gains or losses, net foreign exchange gain or loss and other non-recurring items from its calculation of operating income because these amounts are heavily influenced by and fluctuate in part according to the availability of market opportunities and other factors. In addition to presenting net income determined in accordance with GAAP, the company believes that showing operating income enables investors, analysts, rating agencies and other users of its financial information to more easily analyze the company's results of operations and the company's underlying business performance. Operating income should not be viewed as a substitute for GAAP net income. See page 26 for the reconciliation of net income to operating income.
ANNUALIZED RETURN ON AVERAGE SHAREHOLDERS' EQUITY ("ROAE") AND AVERAGE TANGIBLE SHAREHOLDERS' EQUITY ("ROATE")
Annualized return on average shareholders' equity is calculated using average shareholders’ equity, excluding the average after tax unrealized gains (losses) on investments and currency translation adjustment gains (losses). Unrealized gains (losses) on investments are primarily the result of interest rate and credit spread movements and the resultant impact on fixed income securities. These gains (losses) are not related to management actions or operational performance, nor are they likely to be realized. Therefore, the company believes that excluding these gains (losses) provides a more consistent and useful measurement of operating performance, which supplements GAAP information. In calculating ROAE, the net income (loss) available to shareholders for the period is multiplied by the number of such periods in a calendar year in order to arrive at annualized net income (loss) available to shareholders. The ROATE is the same calculation but reduces shareholders' equity for goodwill and intangible assets. The company presents ROAE and ROATE as measures that are commonly recognized as standards of performance by investors, analysts, rating agencies and other users of its financial information. See page 27 for the reconciliation of average shareholders’ equity and average tangible shareholders equity.
ANNUALIZED OPERATING RETURN ON AVERAGE SHAREHOLDERS' EQUITY AND AVERAGE TANGIBLE SHAREHOLDERS' EQUITY
Annualized operating return on average shareholders' equity is calculated using operating income (as defined above and annualized in the manner described for net income (loss) available to shareholders under ROAE above), and average shareholders' equity, excluding the average after tax unrealized gains (losses) on investments or currency translation adjustment gains (losses). The ROATE is the same calculation but reduces shareholders' equity for goodwill and intangible assets. Unrealized gains (losses) are excluded from equity for the reasons outlined in the annualized return on average shareholders' equity explanation above. See page 26 for the reconciliation of net income to operating income and page 27 for the reconciliation of average shareholders’ equity.
TANGIBLE SHAREHOLDERS' EQUITY AND DILUTED BOOK VALUE PER SHARE
The company has included tangible shareholders' equity, which is total shareholders' equity excluding goodwill and intangible assets, because it represents a more liquid measure of the company's net assets than total shareholders' equity. The company also has included diluted book value per share because it takes into account the effect of dilutive securities; therefore, the company believes it is an important measure of calculating shareholder returns. See page 28 for the reconciliation of diluted book value per share to basic book value per share.
ANNUALIZED INVESTMENT BOOK YIELD
Annualized investment book yield is calculated by dividing normalized net investment income by average aggregate invested assets at book value. In calculating annualized investment book yield, normalized net investment income for the period is multiplied by the number of such periods in a calendar year in order to arrive at annualized net investment income. Normalized net investment income is adjusted for known annual or non-recurring items. Aggregate invested assets includes cash and cash equivalents, fixed maturity securities, equity securities, other invested assets and the net balances receivable or payable on purchases and sales of investments. The company utilizes and presents the investment yield in order to better disclose the performance of the company's investments and to show the components of the company's ROAE. See page 22 for the calculation of annualized investment book yield.
Page 29