Attached files
| file | filename |
|---|---|
| EX-99.1 - EX-99.1 - ARMSTRONG WORLD INDUSTRIES INC | d222345dex991.htm |
| EX-10.1 - EX-10.1 - ARMSTRONG WORLD INDUSTRIES INC | d222345dex101.htm |
| 8-K - 8-K - ARMSTRONG WORLD INDUSTRIES INC | d222345d8k.htm |

October 31, 2016 Earnings Call Presentation 3rd Quarter 2016
Safe Harbor Statement 2 Our disclosures in this presentation, including without limitation, those relating to future financial results market conditions and guidance, and in our other public documents and comments contain forward-looking statements within the meaning of the Private Securities Litigation Reform Act. Those statements provide our future expectations or forecasts and can be identified by our use of words such as “anticipate,” “estimate,” “expect,” “project,” “intend,” “plan,” “believe,” “outlook,” “target,” “predict,” “may,” “will,” “would,” “could,” “should,” “seek,” and other words or phrases of similar meaning in connection with any discussion of future operating or financial performance or the separation of our businesses. Forward-looking statements, by their nature, address matters that are uncertain and involve risks because they relate to events and depend on circumstances that may or may not occur in the future. As a result, our actual results may differ materially from our expected results and from those expressed in our forward-looking statements. A more detailed discussion of the risks and uncertainties that may affect our ability to achieve the projected performance is included in the “Risk Factors” and “Management’s Discussion and Analysis” sections of our reports on Forms 10-K and 10-Q filed with the U.S. Securities and Exchange Commission. Forward-looking statements speak only as of the date they are made. We undertake no obligation to update any forward-looking statements beyond what is required under applicable securities law. In addition, we will be referring to non-GAAP financial measures within the meaning of SEC Regulation G. A reconciliation of the differences between these measures with the most directly comparable financial measures calculated in accordance with GAAP are included within this presentation and available on the Investor Relations page of our website at www.armstrongceilings.com. The guidance in this presentation is only effective as of the date given, October 31, 2016, and will not be updated or affirmed unless and until we publicly announce updated or affirmed guidance.
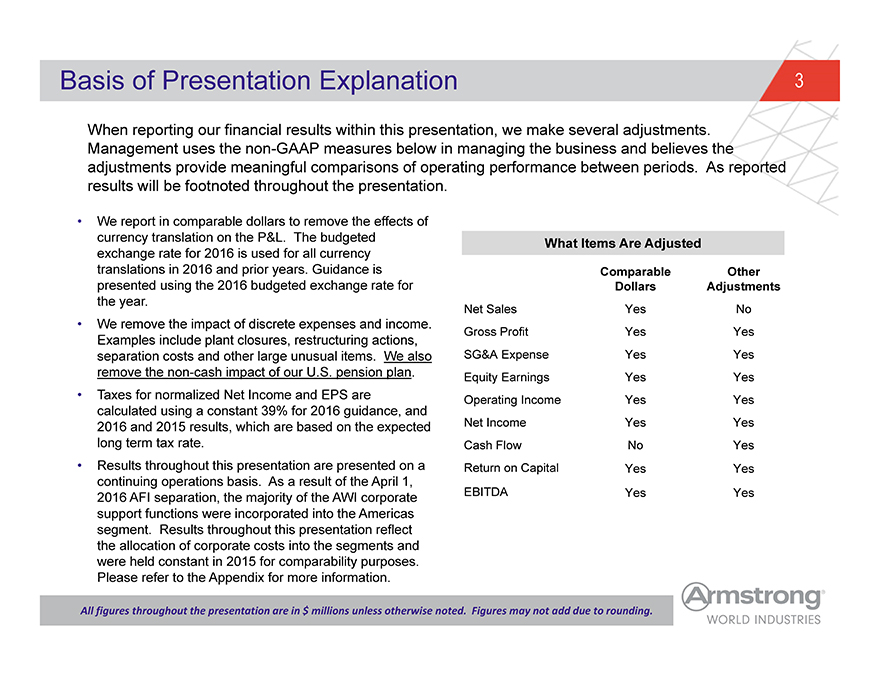
Basis of Presentation Explanation 3 When reporting our financial results within this presentation, we make several adjustments. Management uses the non-GAAP measures below in managing the business and believes the adjustments provide meaningful comparisons of operating performance between periods. As reported results will be footnoted throughout the presentation. • We report in comparable dollars to remove the effects of currency translation on the P&L. The budgeted exchange rate for 2016 is used for all currency translations in 2016 and prior years. Guidance is presented using the 2016 budgeted exchange rate for the year. • We remove the impact of discrete expenses and income. Examples include plant closures, restructuring actions, separation costs and other large unusual items. We also remove the non-cash impact of our U.S. pension plan. • Taxes for normalized Net Income and EPS are calculated using a constant 39% for 2016 guidance, and 2016 and 2015 results, which are based on the expected long term tax rate. • Results throughout this presentation are presented on a continuing operations basis. As a result of the April 1, 2016 AFI separation, the majority of the AWI corporate support functions were incorporated into the Americas segment. Results throughout this presentation reflect the allocation of corporate costs into the segments and were held constant in 2015 for comparability purposes. Please refer to the Appendix for more information. What Items Are Adjusted Comparable Other Dollars Adjustments Net Sales Yes No Gross Profit Yes Yes SG&A Expense Yes Yes Equity Earnings Yes Yes Operating Income Yes Yes Net Income Yes Yes Cash Flow No Yes Return on Capital Yes Yes EBITDA Yes Yes All figures throughout the presentation are in $ millions unless otherwise noted. Figures may not add due to rounding.
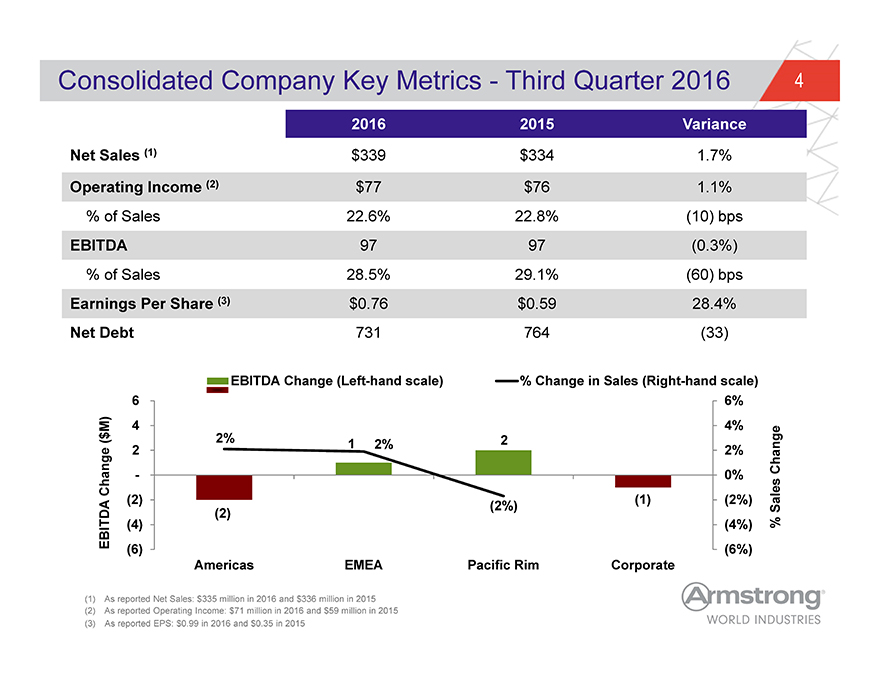
Consolidated Company Key Metrics—Third Quarter 2016 4 2016 2015 Variance Net Sales (1) $339 $334 1.7% Operating Income (2) $77 $76 1.1% % of Sales 22.6% 22.8% (10) bps EBITDA 97 97 (0.3%) % of Sales 28.5% 29.1% (60) bps Earnings Per Share (3) $0.76 $0.59 28.4% Net Debt 731 764 (33) EBITDA Change (Left-hand scale) % Change in Sales (Right-hand scale) 6 6% M) 4 4% ( $ 2% 2 2 1 2% 2% Change Change—0% (2) (2%) (1) (2%) Sales EBITDA (4) (2) (4%) % (6) (6%) Americas EMEA Pacific Rim Corporate (1) As reported Net Sales: $335 million in 2016 and $336 million in 2015 (2) As reported Operating Income: $71 million in 2016 and $59 million in 2015 (3) As reported EPS: $0.99 in 2016 and $0.35 in 2015
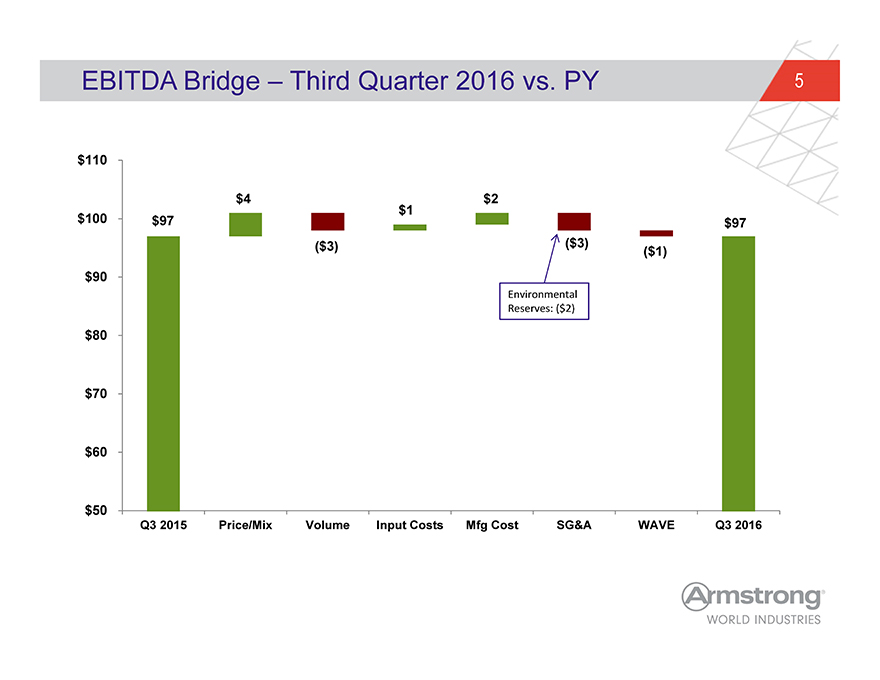
EBITDA Bridge – Third Quarter 2016 vs. PY 5 $110 $4 $2 $1 $100 $97 $97 ($3) ($3) ($1) $90 Environmental Reserves: ($2) $80 $70 $60 $50 Q3 2015 Price/Mix Volume Input Costs Mfg Cost SG&A WAVE Q3 2016
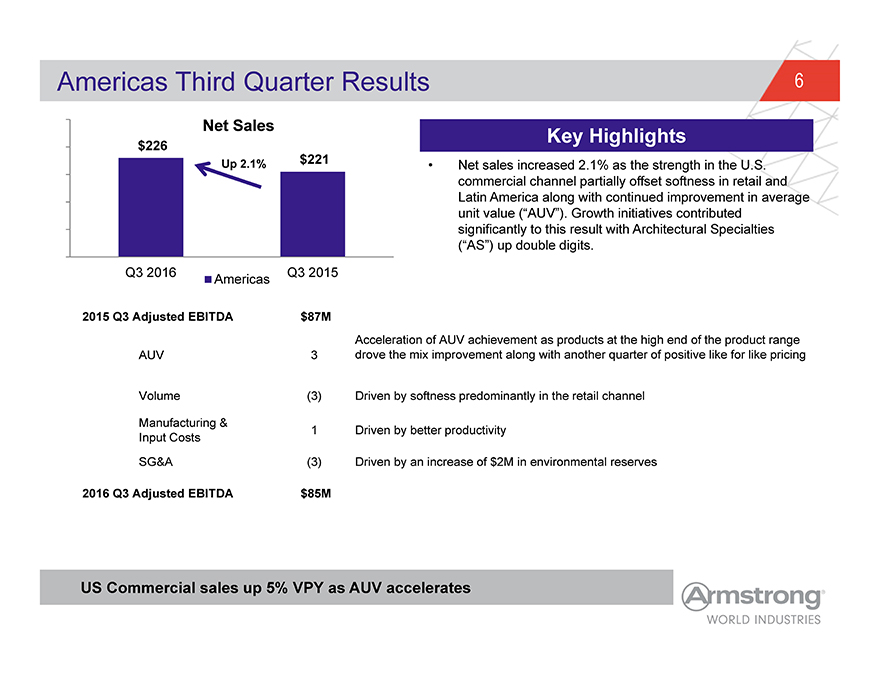
Americas Third Quarter Results 6 Net Sales Key Highlights $226 Up 2.1% $221 • Net sales increased 2.1% as the strength in the U.S. commercial channel partially offset softness in retail and Latin America along with continued improvement in average unit value (“AUV”). Growth initiatives contributed significantly to this result with Architectural Specialties (“AS”) up double digits. Q3 2016 Q3 2015 Americas 2015 Q3 Adjusted EBITDA $87M Acceleration of AUV achievement as products at the high end of the product range AUV 3 drove the mix improvement along with another quarter of positive like for like pricing Volume (3) Driven by softness predominantly in the retail channel Manufacturing & 1 Driven by better productivity Input Costs SG&A (3) Driven by an increase of $2M in environmental reserves 2016 Q3 Adjusted EBITDA $85M US Commercial sales up 5% VPY as AUV accelerates
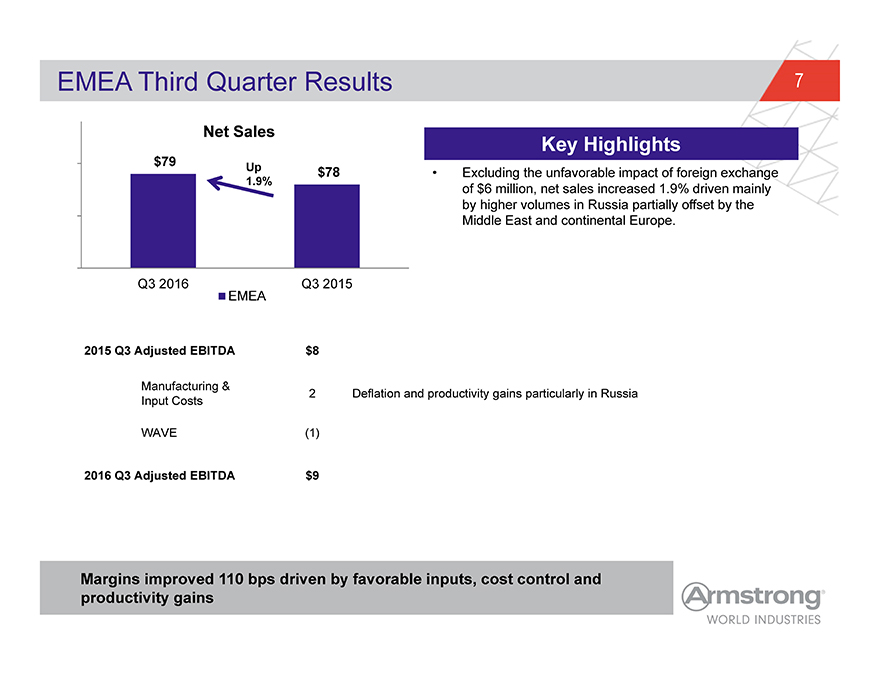
EMEA Third Quarter Results 7 Net Sales Key Highlights $79 Up $78 • Excluding the unfavorable impact of foreign exchange 1.9% of $6 million, net sales increased 1.9% driven mainly by higher volumes in Russia partially offset by the Middle East and continental Europe. Q3 2016 EMEA Q3 2015 2015 Q3 Adjusted EBITDA $8 Manufacturing & 2 Deflation and productivity gains particularly in Russia Input Costs WAVE (1) 2016 Q3 Adjusted EBITDA $9 Margins improved 110 bps driven by favorable inputs, cost control and productivity gains
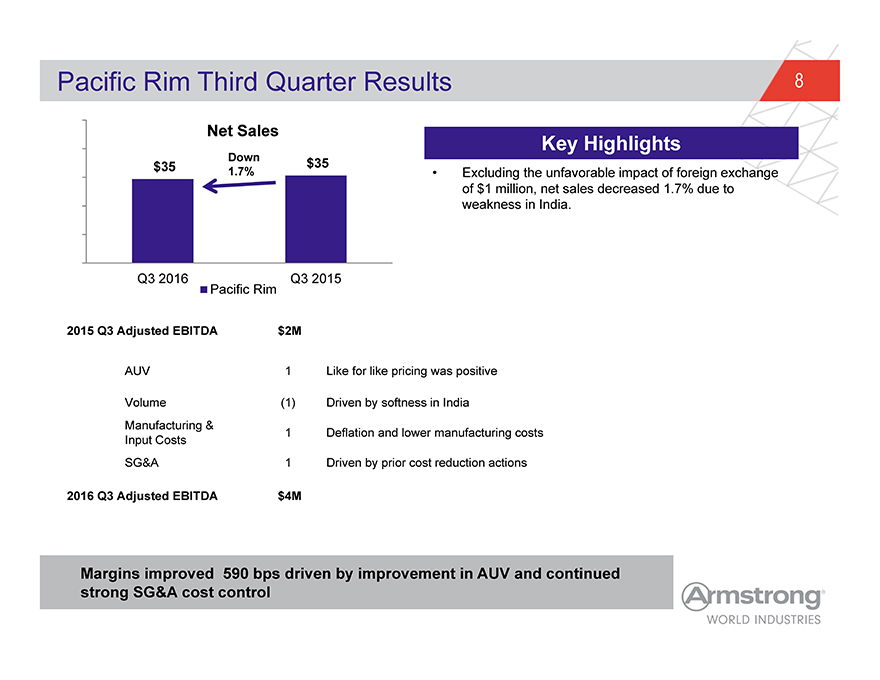
Pacific Rim Third Quarter Results 8 Net Sales Down Key Highlights $35 $35 1.7% • Excluding the unfavorable impact of foreign exchange of $1 million, net sales decreased 1.7% due to weakness in India. Q3 2016 Q3 2015 Pacific Rim 2015 Q3 Adjusted EBITDA $2M AUV 1 Like for like pricing was positive Volume (1) Driven by softness in India Manufacturing & 1 Deflation and lower manufacturing costs Input Costs SG&A 1 Driven by prior cost reduction actions 2016 Q3 Adjusted EBITDA $4M Margins improved 590 bps driven by improvement in AUV and continued strong SG&A cost control
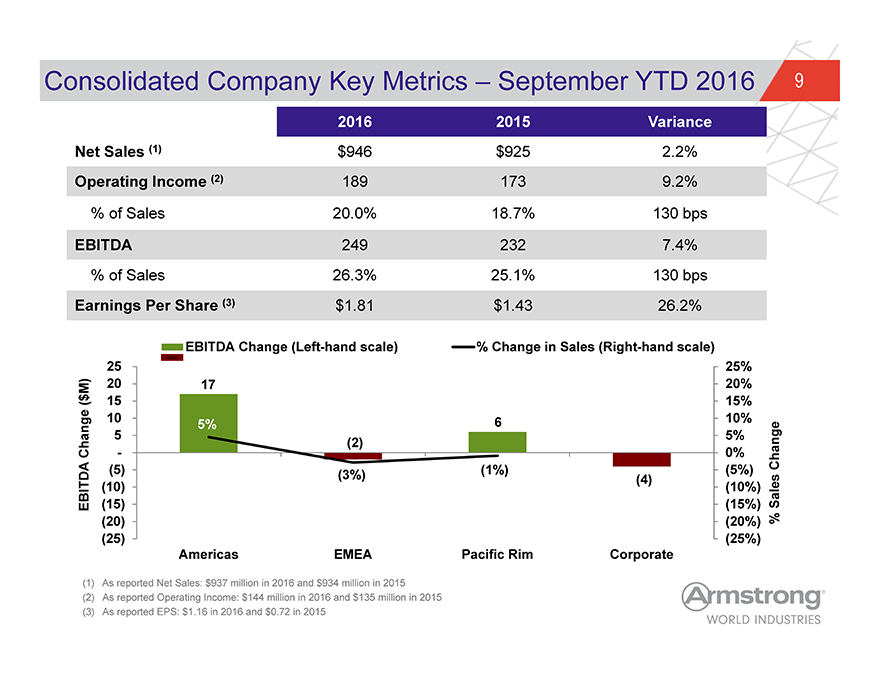
Consolidated Company Key Metrics – September YTD 2016 9 2016 2015 Variance Net Sales (1) $946 $925 2.2% Operating Income (2) 189 173 9.2% % of Sales 20.0% 18.7% 130 bps EBITDA 249 232 7.4% % of Sales 26.3% 25.1% 130 bps Earnings Per Share (3) $1.81 $1.43 26.2% EBITDA Change (Left-hand scale) % Change in Sales (Right-hand scale) 25 25% M) 20 17 20% ( $ 15 15% 10 6 10% 5% 5 5% (2) Change—0% Change (5) (3%) (1%) (4) (5%) (10) (10%) EBITDA (15) (15%)Sales (20) (20%) % (25) (25%) Americas EMEA Pacific Rim Corporate (1) As reported Net Sales: $937 million in 2016 and $934 million in 2015 (2) As reported Operating Income: $144 million in 2016 and $135 million in 2015 (3) As reported EPS: $1.16 in 2016 and $0.72 in 2015
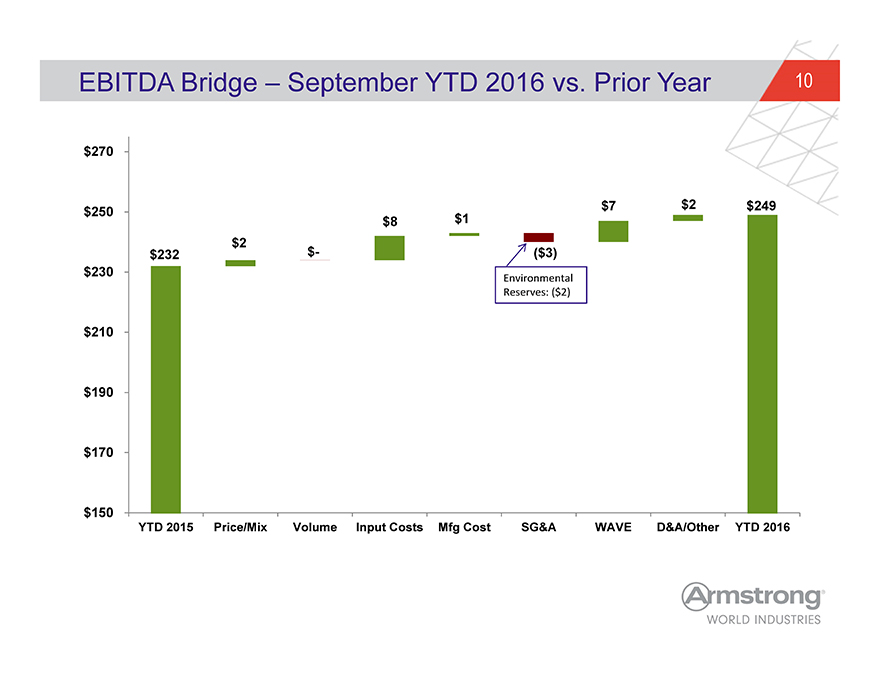
EBITDA Bridge – September YTD 2016 vs. Prior Year 10 $270 $7 $2 $249 $250 $8 $1 $2 $232 $- ($3) $230 Environmental Reserves: ($2) $210 $190 $170 $150 YTD 2015 Price/Mix Volume Input Costs Mfg Cost SG&A WAVE D&A/Other YTD 2016

2016 Guidance 11 2015 Constant 2016 Constant Currency Currency Results Guidance ? 2% – 4% North America volume growth Revenue(1) $1,224 $1,240 – $1,270 ? (3%) – (1%) lower International volume 1% – 4% YoY Growth ? 1% – 3% average unit value increase ? $42 million of standalone corporate costs Adjusted ? 1% – 2% cost savings over inflation $296 $315 – $325? Increased sales and marketing EBITDA(2) 7% – 10% YoY Growth investments to expand total solutions selling capabilities ? $35 million of interest expense Adjusted ? Normalized 39% effective tax rate $1.73 $2.20 – $2.30 EPS(3)? 56 million average diluted shares 27% – 33% YoY outstanding Growth ? Cash tax rate 30% – 35% Free Cash ? $180 million cash flow from operations $86(4) $80 – $100 Flow? $90 million of total capital expenditures Note: Dollars in millions except per share values (1) As-reported revenue of $1,231 million in 2015. 2016 As-reported sales will have (1%)—(3%) FX headwind (2) Includes pro forma standalone corporate expense of $42 million; excludes pension, separation costs and other extraordinary expenses (3) Excludes pension, separation costs, and other extraordinary expenses. As reported earnings per share of $1.45- $1.55 impacted by $34 million of separation expenses and an as reported effective tax rate of ~43%. Adjusted EPS excludes $11M of interest expense to settle interest rate swaps as a result of the refinancing; as reported EPS includes this impact. (4) No FX adjustment. Pro forma standalone free cash flow for AWI in 2015, excludes separation costs and other extraordinary expenses
12 Appendix
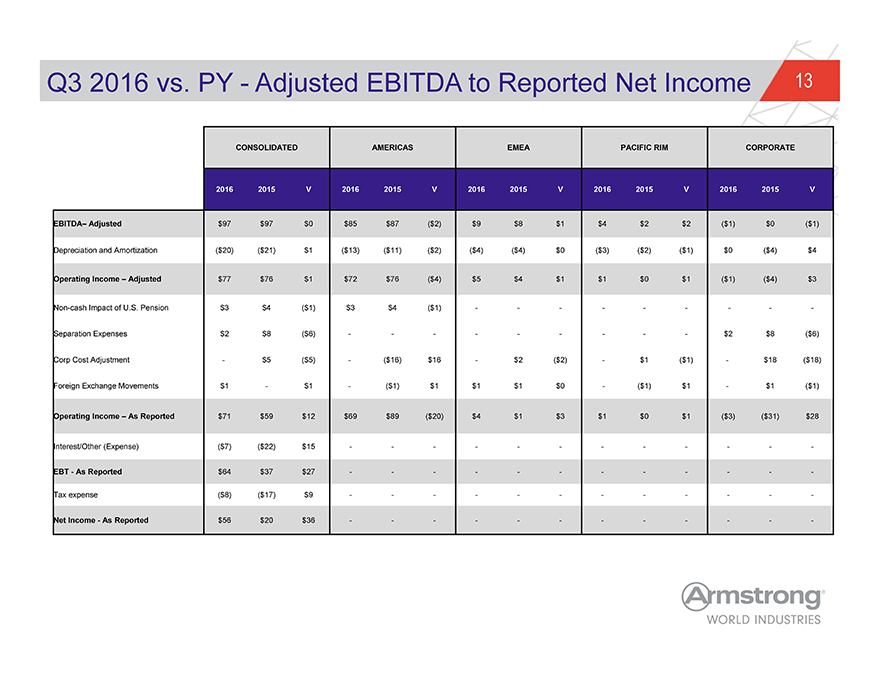
Q3 2016 vs. PY—Adjusted EBITDA to Reported Net Income 13 CONSOLIDATED AMERICAS EMEA PACIFIC RIM CORPORATE 2016 2015 V 2016 2015 V 2016 2015 V 2016 2015 V 2016 2015 V EBITDA– Adjusted $97 $97 $0 $85 $87 ($2) $9 $8 $1 $4 $2 $2 ($1) $0 ($1) Depreciation and Amortization ($20) ($21) $1 ($13) ($11) ($2) ($4) ($4) $0 ($3) ($2) ($1) $0 ($4) $4 Operating Income – Adjusted $77 $76 $1 $72 $76 ($4) $5 $4 $1 $1 $0 $1 ($1) ($4) $3 Non-cash Impact of U.S. Pension $3 $4 ($1) $3 $4 ($1) — — — — -Separation Expenses $2 $8 ($6) — — — ——$2 $8 ($6) Corp Cost Adjustment—$5 ($5)—($16) $16—$2 ($2)—$1 ($1)—$18 ($18) Foreign Exchange Movements $1—$1—($1) $1 $1 $1 $0—($1) $1—$1 ($1) Operating Income – As Reported $71 $59 $12 $69 $89 ($20) $4 $1 $3 $1 $0 $1 ($3) ($31) $28 Interest/Other (Expense) ($7) ($22) $15 — — — — — —EBT—As Reported $64 $37 $27 — — — — — —Tax expense ($8) ($17) $9 — — — — — —Net Income—As Reported $56 $20 $36 — — — — — —
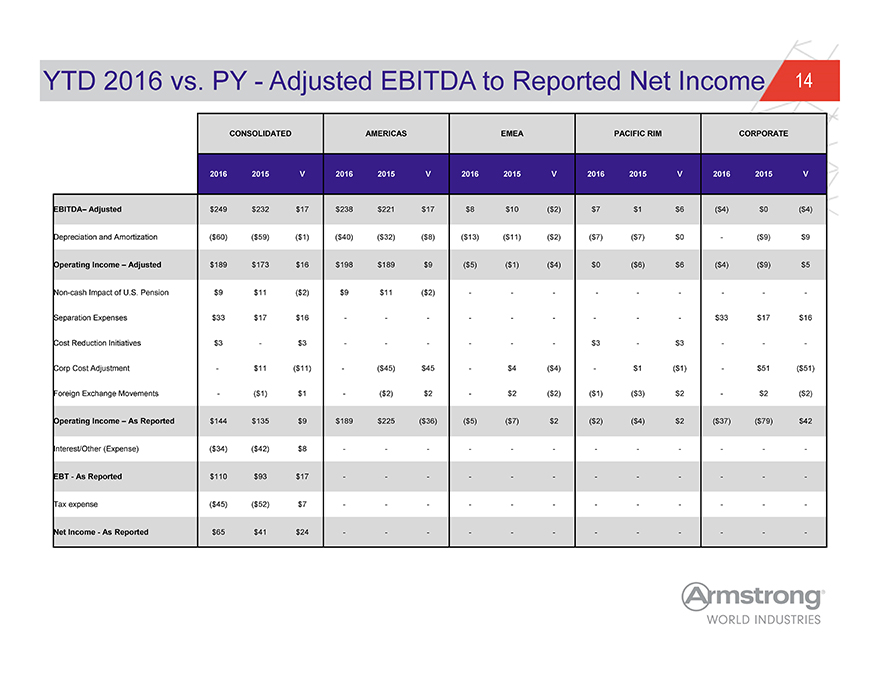
YTD 2016 vs. PY—Adjusted EBITDA to Reported Net Income 14 CONSOLIDATED AMERICAS EMEA PACIFIC RIM CORPORATE 2016 2015 V 2016 2015 V 2016 2015 V 2016 2015 V 2016 2015 V EBITDA– Adjusted $249 $232 $17 $238 $221 $17 $8 $10 ($2) $7 $1 $6 ($4) $0 ($4) Depreciation and Amortization ($60) ($59) ($1) ($40) ($32) ($8) ($13) ($11) ($2) ($7) ($7) $0—($9) $9 Operating Income – Adjusted $189 $173 $16 $198 $189 $9 ($5) ($1) ($4) $0 ($6) $6 ($4) ($9) $5 Non-cash Impact of U.S. Pension $9 $11 ($2) $9 $11 ($2) — — — — -Separation Expenses $33 $17 $16 — — — ——$33 $17 $16 Cost Reduction Initiatives $3—$3 — — — $3—$3 — -Corp Cost Adjustment—$11 ($11)—($45) $45—$4 ($4)—$1 ($1)—$51 ($51) Foreign Exchange Movements—($1) $1—($2) $2—$2 ($2) ($1) ($3) $2—$2 ($2) Operating Income – As Reported $144 $135 $9 $189 $225 ($36) ($5) ($7) $2 ($2) ($4) $2 ($37) ($79) $42 Interest/Other (Expense) ($34) ($42) $8 — — — — — —EBT—As Reported $110 $93 $17 — — — — — —Tax expense ($45) ($52) $7 — — — — — —Net Income—As Reported $65 $41 $24 — — — — — —
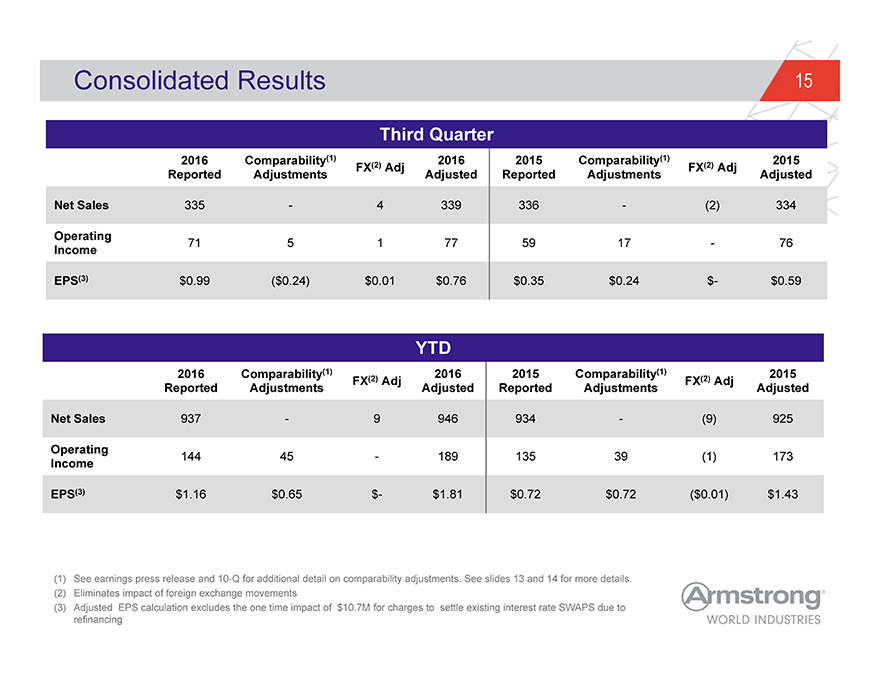
Consolidated Results 15 Third Quarter 2016 Comparability(1) FX(2) Adj 2016 2015 Comparability(1) FX(2) Adj 2015 Reported Adjustments Adjusted Reported Adjustments Adjusted Net Sales 335—4 339 336—(2) 334 Operating 71 5 1 77 59 17—76 Income EPS(3) $0.99 ($0.24) $0.01 $0.76 $0.35 $0.24 $- $0.59 YTD 2016 Comparability(1) FX(2) Adj 2016 2015 Comparability(1) FX(2) Adj 2015 Reported Adjustments Adjusted Reported Adjustments Adjusted Net Sales 937—9 946 934—(9) 925 Operating 144 45—189 135 39 (1) 173 Income EPS(3) $1.16 $0.65 $- $1.81 $0.72 $0.72 ($0.01) $1.43 (1) See earnings press release and 10-Q for additional detail on comparability adjustments. See slides 13 and 14 for more details. (2) Eliminates impact of foreign exchange movements (3) Adjusted EPS calculation excludes the one time impact of $10.7M for charges to settle existing interest rate SWAPS due to refinancing