Attached files
| file | filename |
|---|---|
| EX-99.1 - EXHIBIT 99.1 - ALBANY INTERNATIONAL CORP /DE/ | a51450243ex99_1.htm |
| 8-K - ALBANY INTERNATIONAL CORP. 8-K - ALBANY INTERNATIONAL CORP /DE/ | a51450243.htm |
Exhibit 99.2

Q3 Financial Performance October 31, 2016
‘Non-GAAP’ Items and Forward-Looking Statements This presentation contains the following non-GAAP measures: Percentage changes in net sales, excluding currency rate effects (for each segment, and the Company as a whole); Adjusted EBITDA (for each segment, and the Company as a whole); Net debt; and Net income per share attributable to the Company, excluding adjustments. We think such items provide useful information to investors regarding the Company’s core operational performance. See the Company’s earnings release (which accompanies this presentation) for additional information including reconciliations to GAAP measures. This presentation also may contain statements, estimates, or projections that constitute “forward-looking statements” as defined under U.S. federal securities laws. Forward-looking statements are subject to certain risks and uncertainties that could cause actual results to differ materially from the Company’s historical experience and our present expectations or projections. We disclaim any obligation to update any information in this presentation to reflect any changes or developments after the date on the cover page. Certain additional disclosures regarding our use of these ‘non-GAAP’ items and forward-looking statements are set forth in our third-quarter earnings press release dated October 31, 2016, and in our SEC filings, including our most recent quarterly reports and our annual reports for the years ended December 31, 2013, 2014, and 2015. Our use of such items in this presentation is subject to those additional disclosures, which we urge you to read. 2
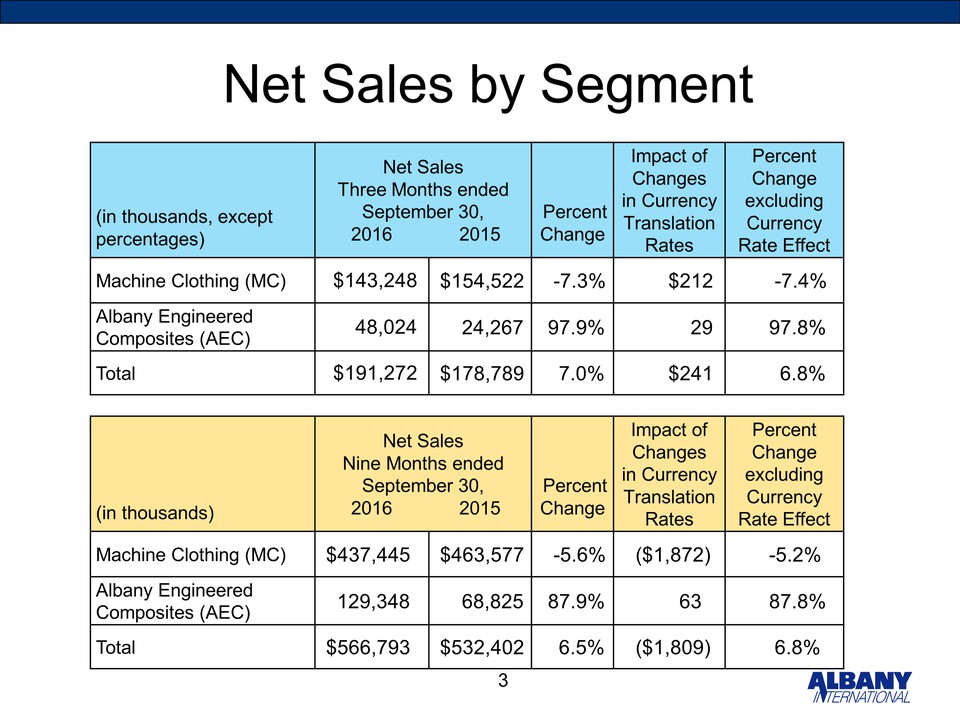
Net Sales by Segment 3 (in thousands, except percentages) Net Sales Three Months ended September 30, 2016 2015 Percent Change Impact of Changes in Currency Translation Rates Percent Change excluding Currency Rate Effect Machine Clothing (MC) $143,248 $154,522 -7.3% $212 -7.4% Albany Engineered Composites (AEC) 48,024 24,267 97.9% 29 97.8% Total $191,272 $178,789 7.0% $241 6.8% (in thousands) Net Sales Nine Months ended September 30, 2016 2015 Percent Change Impact of Changes in Currency Translation Rates Percent Change excluding Currency Rate Effect Machine Clothing (MC) $437,445 $463,577 -5.6% ($1,872) -5.2% Albany Engineered Composites (AEC) 129,348 68,825 87.9% 63 87.8% Total $566,793 $532,402 6.5% ($1,809) 6.8%
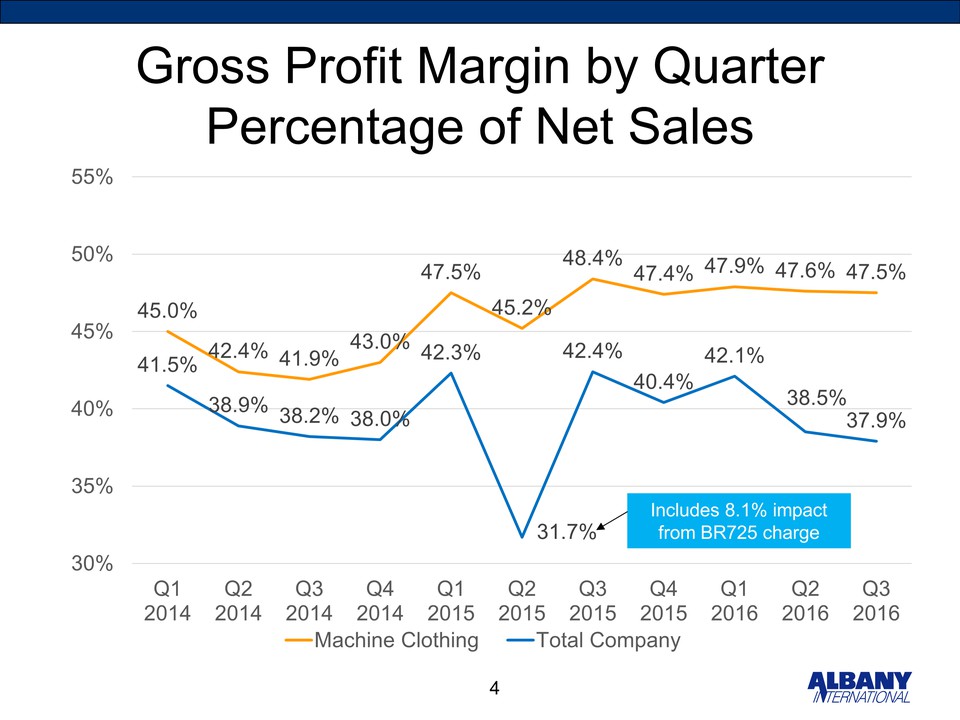
Gross Profit Margin by Quarter Percentage of Net Sales 45.0% 42.4% 41.9% 43.0% 47.5% 45.2% 48.4% 47.4% 47.9% 47.6% 47.5% 41.5% 38.9% 38.2% 38.0% 42.3% 31.7% 42.4% 40.4% 42.1% 38.5% 37.9% 30% 35% 40% 45% 50% 55% Q1 2014 Q2 2014 Q3 2014 Q4 2014 Q1 2015 Q2 2015 Q3 2015 Q4 2015 Q1 2016 Q2 2016 Q3 2016 Machine Clothing Total Company 4 Includes 8.1% impact from BR725 charge
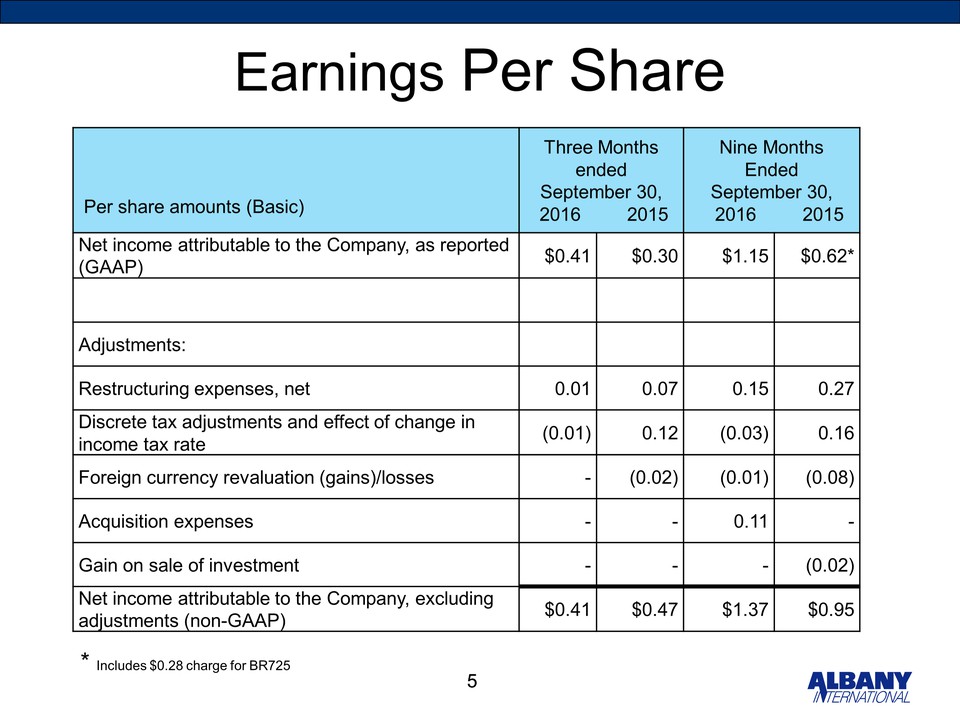
5 Earnings Per Share Per share amounts (Basic) Three Months ended September 30, 2016 2015 Nine Months Ended September 30, 2016 2015 Net income attributable to the Company, as reported (GAAP) $0.41 $0.30 $1.15 $0.62* Adjustments: Restructuring expenses, net 0.01 0.07 0.15 0.27 Discrete tax adjustments and effect of change in income tax rate (0.01) 0.12 (0.03) 0.16 Foreign currency revaluation (gains)/losses - (0.02) (0.01) (0.08) Acquisition expenses - - 0.11 - Gain on sale of investment - - - (0.02) Net income attributable to the Company, excluding adjustments (non-GAAP) $0.41 $0.47 $1.37 $0.95 * Includes $0.28 charge for BR725
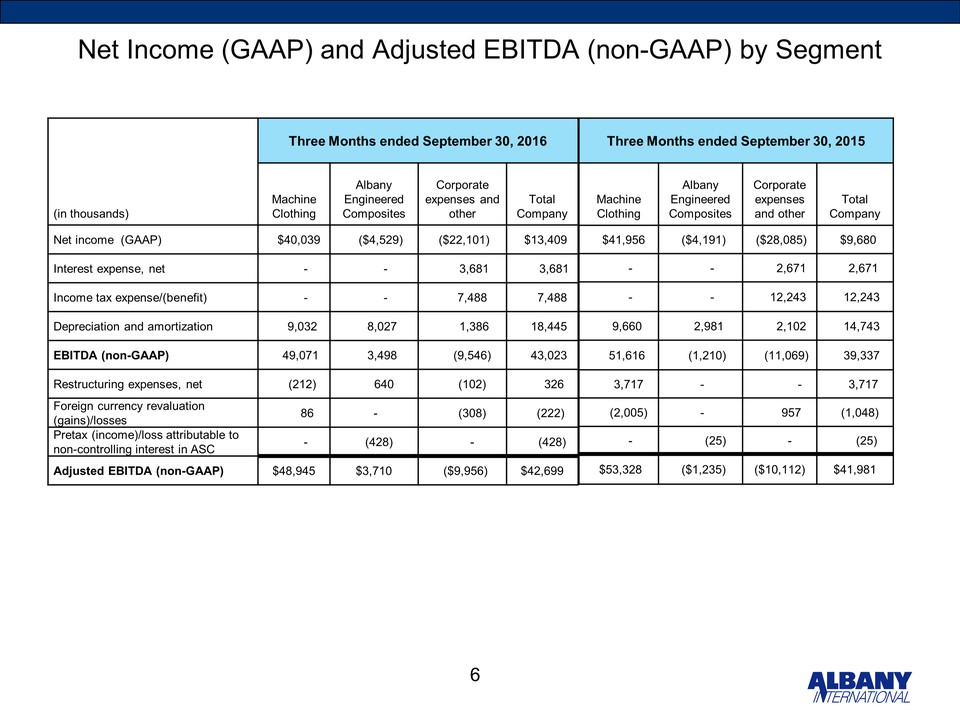
Net Income (GAAP) and Adjusted EBITDA (non-GAAP) by Segment 6 Three Months ended September 30, 2016 (in thousands) Machine Clothing Albany Engineered Composites Corporate expenses and other Total Company Net income (GAAP) $40,039 ($4,529) ($22,101) $13,409 Interest expense, net - - 3,681 3,681 Income tax expense/(benefit) - - 7,488 7,488 Depreciation and amortization 9,032 8,027 1,386 18,445 EBITDA (non-GAAP) 49,071 3,498 (9,546) 43,023 Restructuring expenses, net (212) 640 (102) 326 Foreign currency revaluation (gains)/losses 86 - (308) (222) Pretax (income)/loss attributable to non-controlling interest in ASC - (428) - (428) Adjusted EBITDA (non-GAAP) $48,945 $3,710 ($9,956) $42,699 Three Months ended September 30, 2015 Machine Clothing Albany Engineered Composites Corporate expenses and other Total Company $41,956 ($4,191) ($28,085) $9,680 - - 2,671 2,671 - - 12,243 12,243 9,660 2,981 2,102 14,743 51,616 (1,210) (11,069) 39,337 3,717 - - 3,717 (2,005) - 957 (1,048) - (25) - (25) $53,328 ($1,235) ($10,112) $41,981
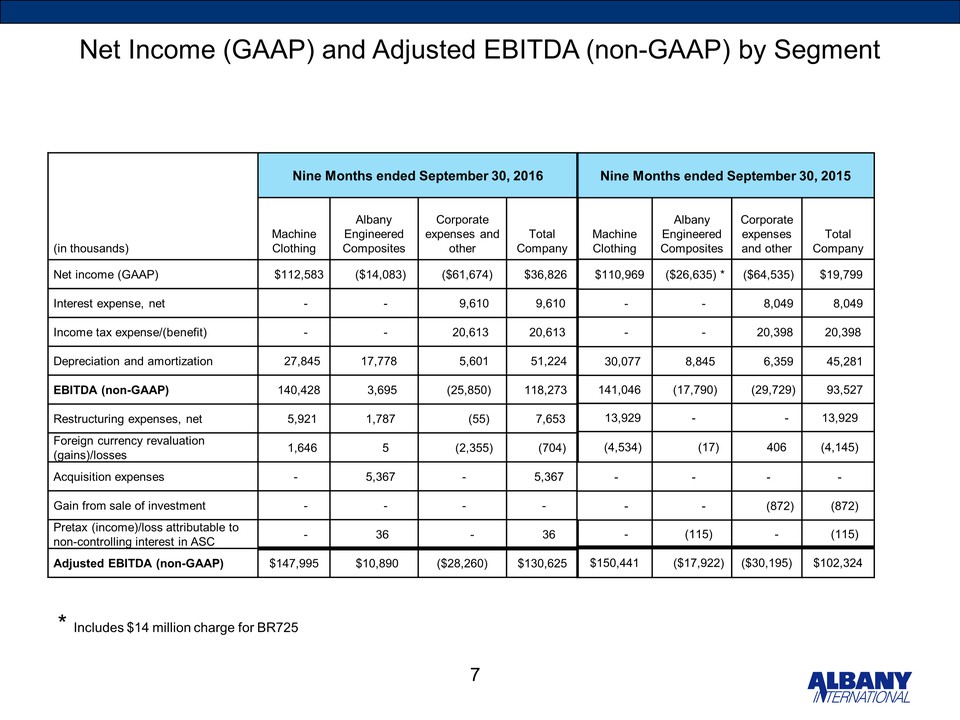
Net Income (GAAP) and Adjusted EBITDA (non-GAAP) by Segment 7 Nine Months ended September 30, 2016 (in thousands) Machine Clothing Albany Engineered Composites Corporate expenses and other Total Company Net income (GAAP) $112,583 ($14,083) ($61,674) $36,826 Interest expense, net - - 9,610 9,610 Income tax expense/(benefit) - - 20,613 20,613 Depreciation and amortization 27,845 17,778 5,601 51,224 EBITDA (non-GAAP) 140,428 3,695 (25,850) 118,273 Restructuring expenses, net 5,921 1,787 (55) 7,653 Foreign currency revaluation (gains)/losses 1,646 5 (2,355) (704) Acquisition expenses - 5,367 - 5,367 Gain from sale of investment - - - - Pretax (income)/loss attributable to non-controlling interest in ASC - 36 – 36 Adjusted EBITDA (non-GAAP) $147,995 $10,890 ($28,260) $130,625 Nine Months ended September 30, 2015 Machine Clothing Albany Engineered Composites Corporate expenses and other Total Company $110,969 ($26,635) * ($64,535) $19,799 - - 8,049 8,049 - - 20,398 20,398 30,077 8,845 6,359 45,281 141,046 (17,790) (29,729) 93,527 13,929 - - 13,929 (4,534) (17) 406 (4,145) - - - - - - (872) (872) - (115) - (115) $150,441 ($17,922) ($30,195) $102,324 * Includes $14 million charge for BR725
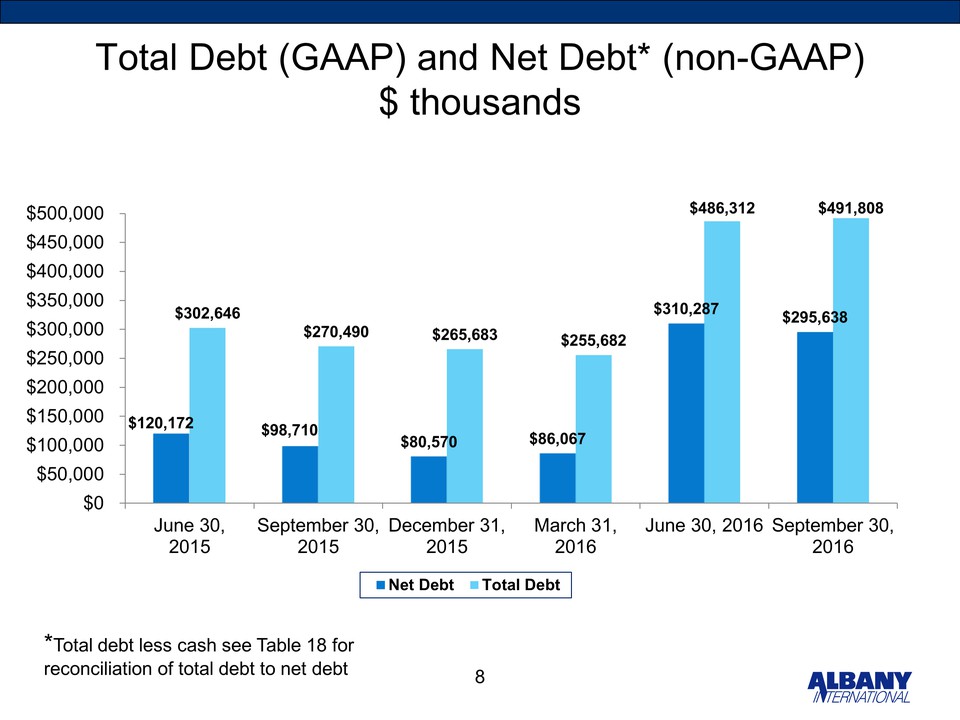
Total Debt (GAAP) and Net Debt* (non-GAAP) $ thousands $120,172 $98,710 $80,570 $86,067 $310,287 $302,646 $295,638 $270,490 $265,683 $255,682 $486,312 $491,808 $0 $50,000 $100,000 $150,000 $200,000 $250,000 $300,000 $350,000 $400,000 $450,000 $500,000 June 30, 2015 September 30, 2015 December 31, 2015 March 31, 2016 June 30, 2016 September 30, 2016 Net Debt Total Debt 8 *Total debt less cash see Table 18 for reconciliation of total debt to net debt