Attached files
| file | filename |
|---|---|
| EX-99.1 - EXHIBIT 99.1 - FB Financial Corp | a51448554ex99_1.htm |
| 8-K - FB FINANCIAL CORPORATION 8-K - FB Financial Corp | a51448554.htm |
Exhibit 99.2
FB Financial Corporation Third Quarter 2016 Earnings Presentation October 28,2016
This presentation contains “forward-looking statements” made pursuant to the safe harbor provisions of the Private Securities Litigation Reform Act of 1995. All statements other than statements of historical fact are forward-looking statements. You can identify these forward-looking statements through the Company’s use of words such as “believes,” “anticipates,” “expects,” “may,” “will,” “assumes,” “should,” “predicts,”“could,” “would,” “intends,” “targets,” “estimates,” “projects,” “plans,” “potential” and other similar words and expressions of the future or otherwise regarding the outlook for the Company’s future business and financial performance and/or the performance of the banking industry and economy in general. Investors are cautioned that any such forward-looking statements are not guarantees of future performance and involve known and unknown risks and uncertainties which may cause the actual results, performance or achievements of the Company to be materially different fromthe future results, performance or achievements expressed or implied by such forward-looking statements. Forward-looking statements are based on the information known to, and current beliefs and expectations of, the Company’s management and are subject to significant risks and uncertainties. Actual results may differ materially from those contemplated by such forward-looking statements. A number of factors could cause actual results to differ materially from those contemplated by the forward-looking statements in this presentation including, without limitation, the risks and other factors set forth in the Company’s final prospectus filed pursuant to Rule424(b)(4) under the Securities Act of 1933, as amended, filed with the U.S. Securities and Exchange Commission on September 19, 2016 (Registration No. 333-213210) under the captions “Cautionary note regarding forward-looking statements” and “Risk factors.” Many of these factors are beyond the Company’s ability to control or predict. The Company believes the forward-looking statements contained herein are reasonable; however, undue reliance should not be placed on any forward-looking statements, which are based on current expectations and speak only as of the date that theyare made. The Company does not assume any obligation to update any forward-looking statements as a result of new information, future developments or otherwise, except as otherwise may be required by law. Forward looking statements FB FirstBank 1
2 FB FirstBank Use of non-GAAP financial measures This presentation contains certain financial measures that are not measures recognized under U.S. generally accepted accounting principles (GAAP) and therefore are considered non-GAAP financial measures. These non-GAAP financial measures include, without limitation, core net income, core diluted earnings per share, core total revenues, core return on average assets, core return on average equity, core return onaverage tangible common equity and core efficiency ratio, in each case excluding certain income and expense items that the Company’s management considers to be non-core in nature.The Company refers to these non-GAAP measures as core measures.This presentation also uses tangible book value per common share and the tangible common equity to tangible assets ratio, which are non-GAAP measures that exclude the impact of goodwill and other intangibles, and core deposits, which is a non-GAAP measure that excludes jumbo time deposits (greater than $250,000) from total deposits. The Company’s management uses these non-GAAP financial measures in their analysis of the Company’s performance, financial condition and the efficiency ofits operations. Management believes that these non-GAAP financial measures provide a greater understanding of ongoing operations and enhance comparability of results with prior periods as well as demonstrating the effects of significant non-core gains and charges in the current period.The Company’s management also believes that investors find these non-GAAP financial measures useful.In addition, because intangible assets such as goodwill and other intangibles, and the other items excluded each vary extensively from company to company, the Company believes that the presentation of this information allows investors to more easily compare the Company’s results to the results of other companies.However, the non-GAAP financial measures discussed herein should not be considered in isolation or as a substitute for the most directly comparable or other financial measures calculated in accordance with GAAP. Moreover, the manner in which we calculate the non-GAAP financial measures discussed herein may differ from that of other companies reporting measures with similar names. You should understand how such other banking organizations calculate their financial measures similar or with names similar to the non-GAAP financial measures we have discussed herein when comparing such non-GAAP financial measures.A reconciliation of these non-GAAP financial measures to the most directly comparable GAAP measures are provided on the appendix to this presentation.
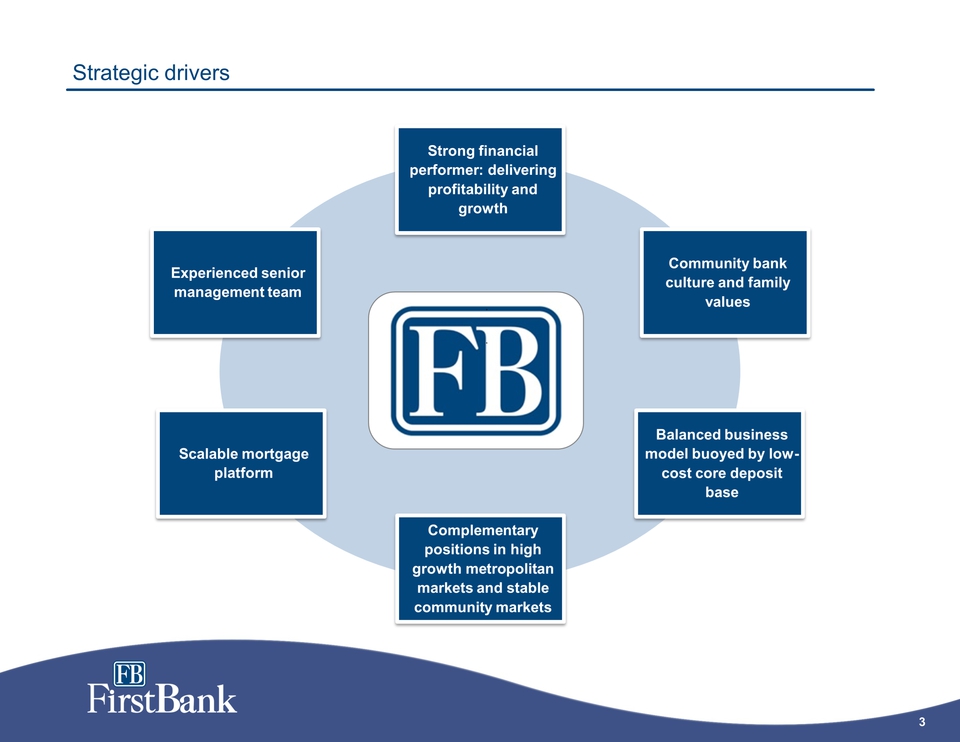
3 Strategic drivers Balanced business model buoyed by low-cost core deposit base Experienced senior management team Strong financial performer: delivering profitability and growth Community bank culture and family values Scalable mortgage platform Complementary positions in high growth metropolitan markets and stable community markets FB FirstBank
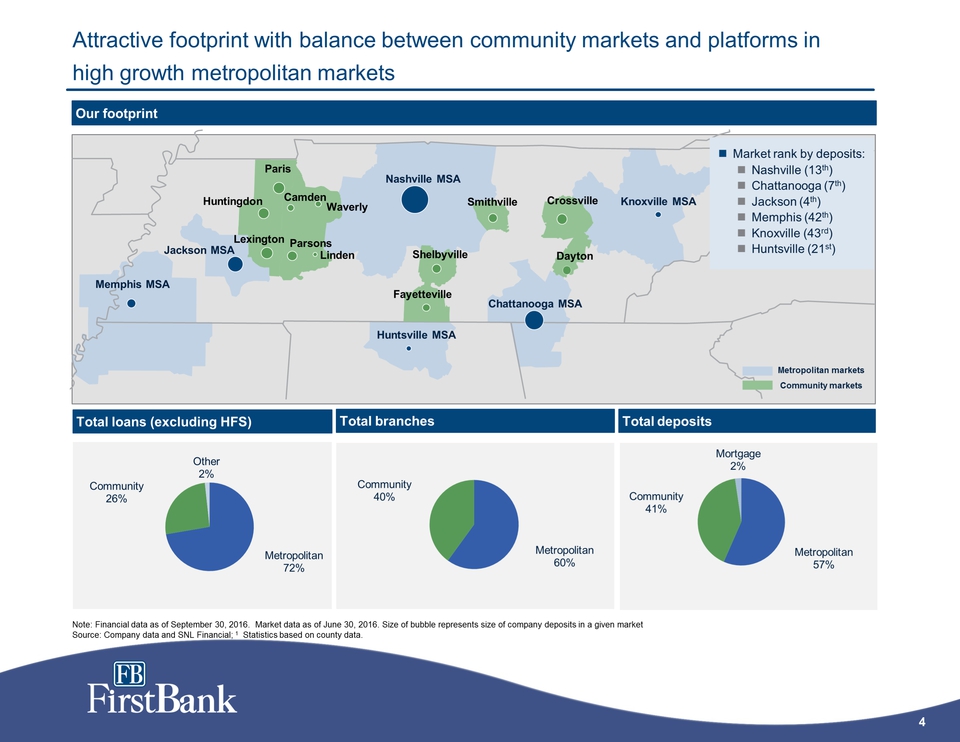
4 FB FirstBank Attractive footprint with balance between community markets and platforms in high growth metropolitan markets Note: Financial data as of September 30, 2016. Market data as of June 30, 2016. Size of bubble represents size of company deposits in a given market Source: Company data and SNL Financial; 1 Statistics based on county data. Nashville MSA Knoxville MSA Chattanooga MSA Huntsville MSA Memphis MSA Jackson MSA Metropolitan markets Community markets Our footprint Total loans (excluding HFS) Metropolitan 72% Community 26% Other 2% Total branches Metropolitan 60% Community 40% Total deposits Metropolitan 57% Community 41% Mortgage 2% Market rank by deposits: Nashville (13th) Chattanooga (7th) Jackson (4th) Memphis (42th) Knoxville (43rd) Huntsville (21st) Paris Crossville Dayton Shelbyville Smithville Fayetteville Waverly Linden Parsons Camden Huntingdon Lexington
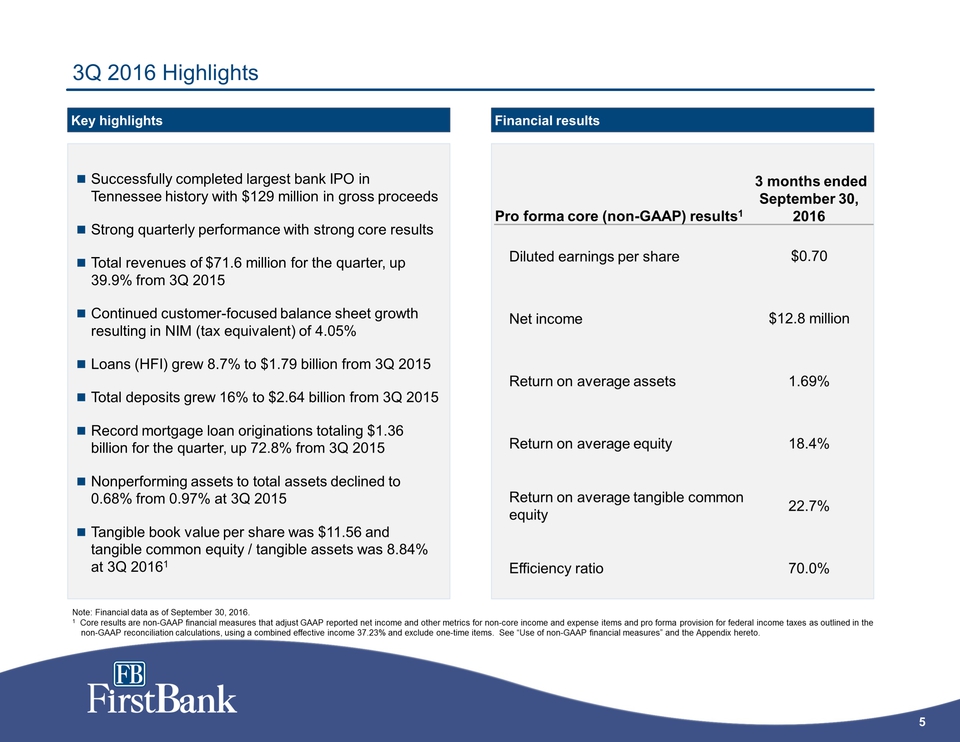
5 FB FirstBank Pro forma core (non-GAAP) results 1 3 months endedSeptember 30, 2016 Diluted earnings per share $0.70 Net income $12.8 million Return on average assets 1.69% Return on average equity 18.4% Return on averagetangible common equity 22.7% Efficiency ratio 70.0% 3Q 2016 Highlights Successfully completed largest bank IPO in Tennessee history with $129 million in gross proceeds Strong quarterly performance with strong core results Total revenues of $71.6 million for the quarter, up 39.9% from 3Q 2015 Continued customer-focused balance sheet growth resulting in NIM (tax equivalent) of 4.05% Loans (HFI) grew 8.7% to $1.79 billion from 3Q 2015 Total deposits grew 16% to $2.64 billion from 3Q 2015 Record mortgage loan originations totaling $1.36 billion for the quarter, up 72.8% from 3Q 2015 Nonperforming assets to total assets declined to 0.68% from 0.97% at 3Q 2015 Tangible book value per share was $11.56 and tangible common equity / tangible assets was 8.84% at 3Q 20161 Key highlights Financial results Note: Financial data as of September 30, 2016. 1 Core results are non-GAAP financial measures that adjust GAAP reported net income and other metrics for non-core income and expense items and pro forma provision for federal income taxes as outlined in the non-GAAP reconciliation calculations, using a combined effective income 37.23% and exclude one-time items. See “Use of non-GAAP financial measures” and the Appendix hereto.
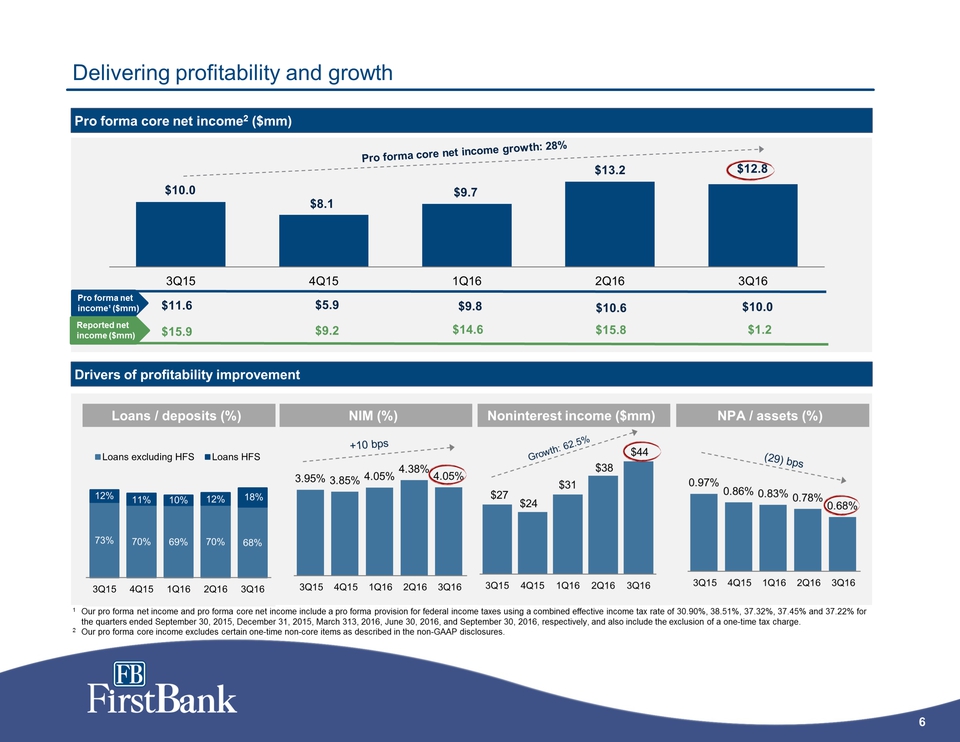
6 FB FirstBank 0.97% 0.86% 0.83% 0.78% 0.68% 3Q15 4Q15 1Q16 2Q16 3Q16 Delivering profitability and growth Drivers of profitability improvement 1Our pro forma net income and pro forma core net income include a pro forma provision for federal income taxes using a combined effective income tax rate of 30.90%, 38.51%, 37.32%, 37.45% and 37.22% for the quarters ended September 30, 2015, December 31, 2015, March 313, 2016, June 30, 2016, and September 30, 2016, respectively, and also include the exclusion of a one-time tax charge. 2Our pro forma core income excludes certain one-time non-core items as described in the non-GAAP disclosures. Pro forma core net income2($mm) 3.95% 3.85% 4.05% 4.38% 4.05% 3Q15 4Q15 1Q16 2Q16 3Q16 NIM (%) $27 $24 $31 $38 $44 3Q15 4Q15 1Q16 2Q16 3Q16 Noninterest income ($mm) NPA / assets (%) $11.6 $5.9 $9.8 $10.6 $10.0 73% 70% 69% 70% 68% 12% 11% 10% 12% 18% 3Q15 4Q15 1Q16 2Q16 3Q16 Loans excluding HFS Loans HFS Loans / deposits (%) +10 bps Growth: 62.5% (29) bps 3Q15 4Q15 1Q16 2Q16 3Q16 $10.0 Pro forma net income¹ ($mm) $15.8 $7.1 $9.7 $13.2 $12.8 Pro forma core net income growth: 28% Delivering profitability and growth Drivers of profitability improvement 1 Our pro forma net income and pro forma core net income include a pro forma provision for federal income taxes using a combined effective income tax rate of 30.90%, 38.51%, 37.32%, 37.45% and 37.22% for the quarters ended September 30, 2015, December 31, 2015, March 313, 2016, June 30, 2016, and September 30, 2016, respectively, and also include the exclusion of a one-time tax charge. 2 Our pro forma core income excludes certain one-time non-core items as described in the non-GAAP disclosures. Pro forma core net income2($mm)
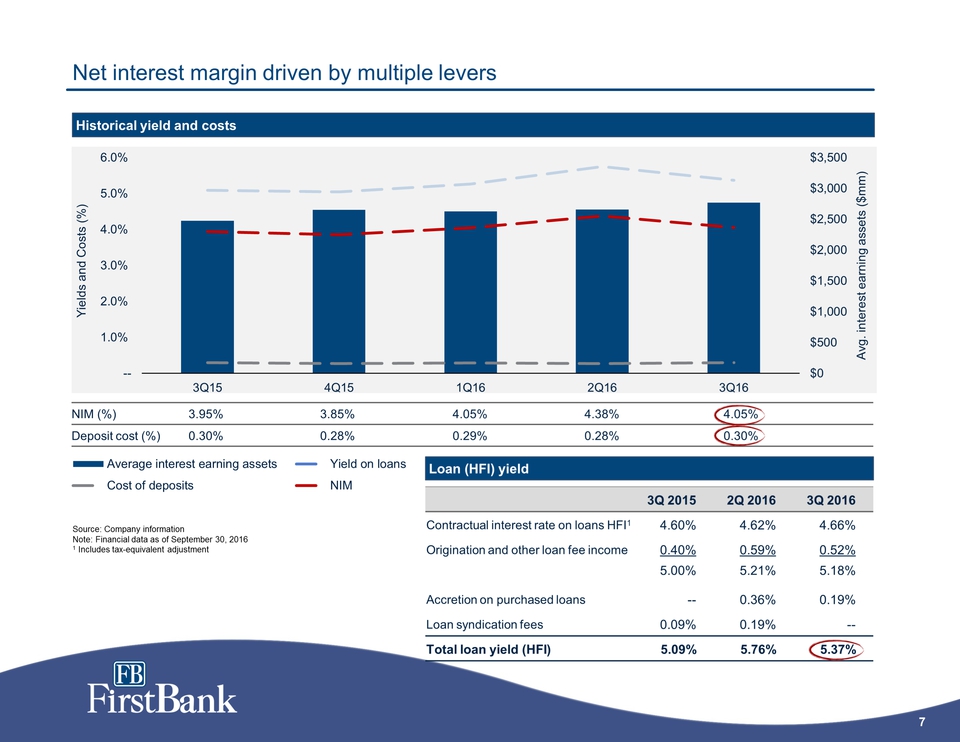
7 FB FirstBank Net interest margin driven by multiple levers Historical yield and costs Source: Company information Note: Financial data as of September 30, 2016 1 Includes tax-equivalent adjustment NIM (%) 3.95% 3.85% 4.05% 4.38% 4.05% Deposit cost (%) 0.30% 0.28% 0.29% 0.28% 0.30% Loan (HFI) yield 3Q 2015 2Q 2016 3Q 2016 Contractual interest rate on loans HFI1 4.60% 4.62% 4.66% Origination and other loan fee income 0.40% 0.59% 0.52% 5.00% 5.21% 5.18% Accretion on purchased loans -- 0.36% 0.19% Loan syndication fees 0.09% 0.19% -- Total loan yield (HFI) 5.09% 5.76% 5.37% Average interest earning assets Yield on loans Cost of deposits NIM $0 $500 $1,000 $1,500 $2,000 $2,500 $3,000 $3,500 -- 1.0% 2.0% 3.0% 4.0% 5.0% 6.0% 3Q15 4Q15 1Q16 2Q16 3Q16 Avg. interest earning assets ($mm) Yields and Costs (%)
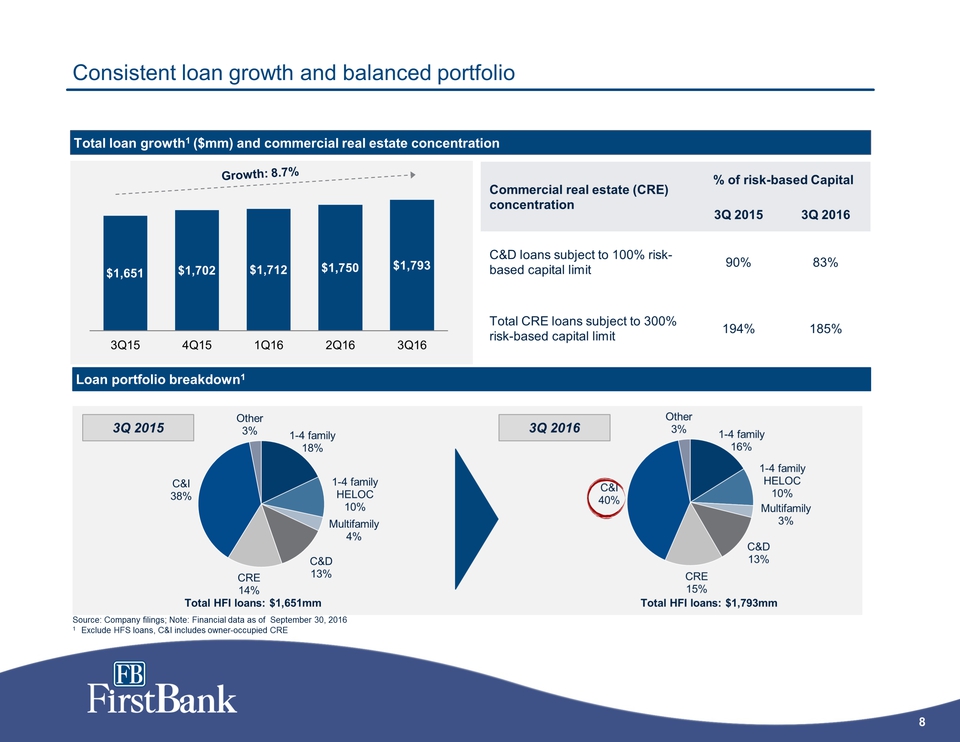
8 FB FirstBank Consistent loan growth and balanced portfolio Total loan growth1($mm) and commercial real estate concentration Total HFI loans: $1,651mm Loan portfolio breakdown 1 3Q 2015 3Q 2016 Total HFI loans: $1,793 mm 1-4 family 16% 1-4 family HELOC 10% Multifamily 3% C&D 13% CRE 15% C&I 40% Other 3% 1-4 family 18% 1-4 family HELOC 10% Multifamily 4% C&D 13% CRE 14% C&I 38% Other 3% Source: Company filings; Note: Financial data as of September 30, 2016 1 Exclude HFS loans, C&I includes owner-occupied CRE $1,651 $1,702 $1,712 $1,750 $1,793 3Q15 4Q15 1Q16 2Q16 3Q16 Commercial realestate (CRE) concentration % of risk-based Capital 3Q 2015 3Q 2016 C&D loans subject to 100% risk-based capital limit 90% 83% Total CRE loans subject to 300% risk-based capital limit 194% 185%
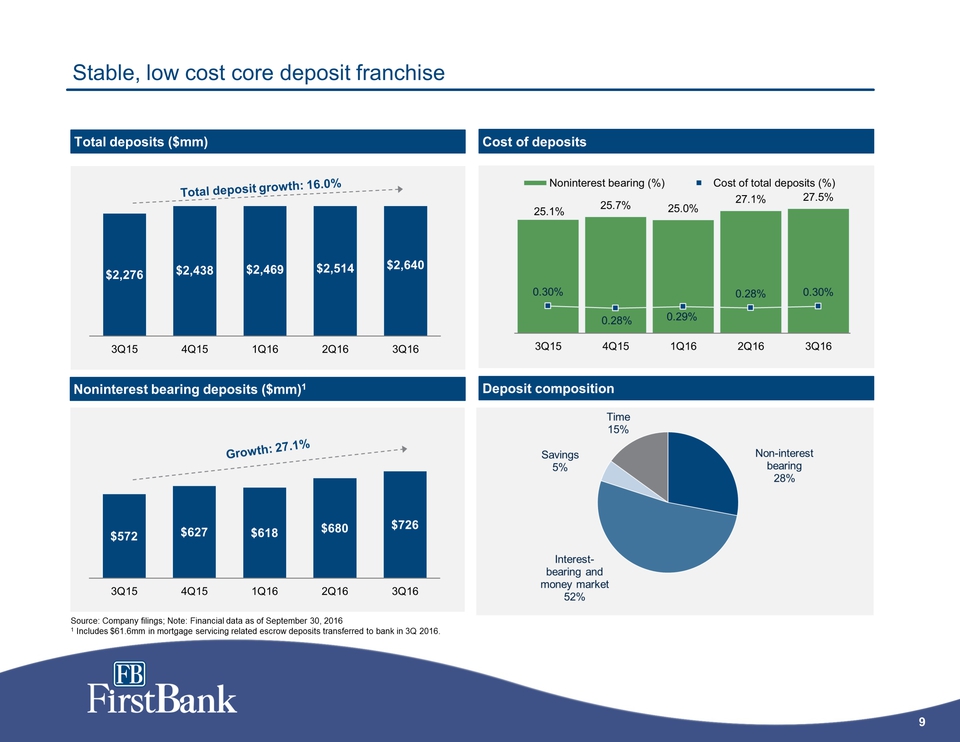
9 FB FirstBank Stable, low cost core deposit franchise 25.1% 25.7% 25.0% 27.1% 27.5% 0.30% 0.28% 0.29% 0.28% 0.30% 0.0% 5.0% 10.0% 15.0% 20.0% 25.0% 30.0% 3Q15 4Q15 1Q16 2Q16 3Q16 Noninterest bearing (%) Cost of total deposits (%) $572 $627 $618 $680 $726 3Q15 4Q15 1Q16 2Q16 3Q16 $2,276 $2,438 $2,469 $2,514 $2,640 3Q15 4Q15 1Q16 2Q16 3Q16 Total deposits ($mm) Source: Company filings; Note: Financial data as of September 30, 2016 1 Includes $61.6mm in mortgage servicing related escrow deposits transferred to bank in 3Q 2016. Noninterest bearing deposits ($mm) 1 Deposit composition Cost of deposits Non-interest bearing 28% Interest-bearing and money market 52% Savings 5% Time 15% Total deposit growth: 16.0%
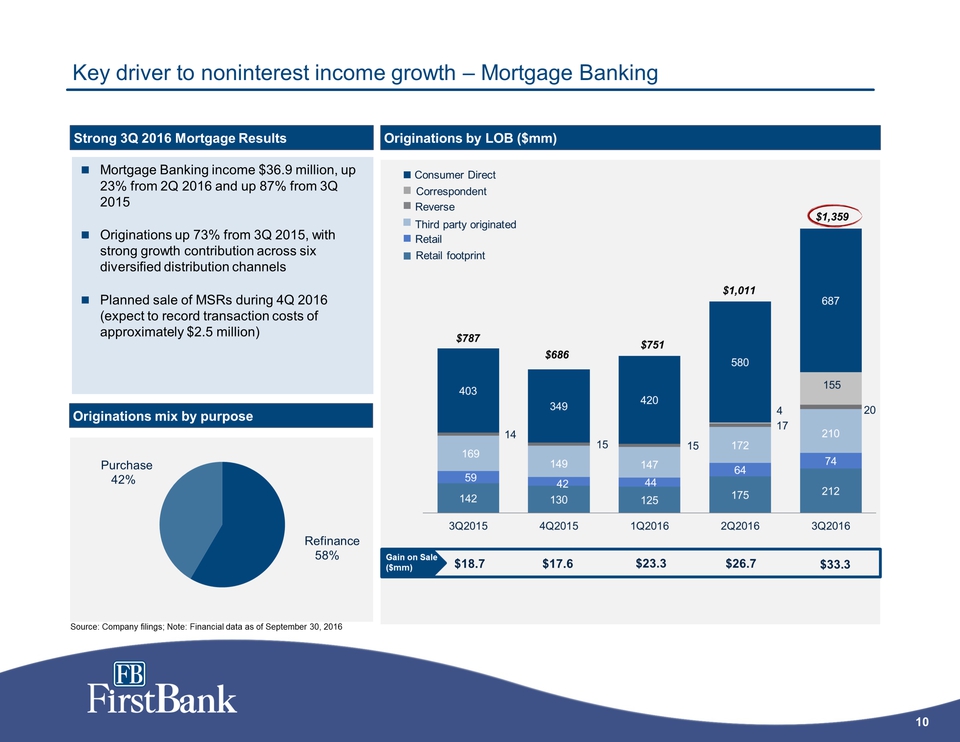
10 FB FirstBank 142 130 125 175 212 59 42 44 64 74 169 149 147 172 210 14 15 15 17 20 4 155 403 349 420 580 687 0 200 400 600 800 1,000 1,200 1,400 1,600 3Q2015 4Q2015 1Q2016 2Q2016 3Q2016 Key driver to noninterest income growth –Mortgage Banking Mortgage Banking income $36.9 million, up 23% from 2Q 2016 and up 87% from 3Q 2015 Originations up 73% from 3Q 2015, with strong growth contribution across six diversified distribution channels Planned sale of MSRs during 4Q 2016 (expect to record transaction costs of approximately $2.5 million) Originations by LOB ($mm) $787 $686 $751 Strong 3Q 2016 Mortgage Results Retail footprint Third party originated Reverse Consumer Direct Originations mix by purpose Refinance 58% Purchase 42% $1,359 Correspondent $1,011 Retail Source: Company filings; Note: Financial data as of September 30, 2016 $18.7 $17.6 $23.3 $26.7 $33.3
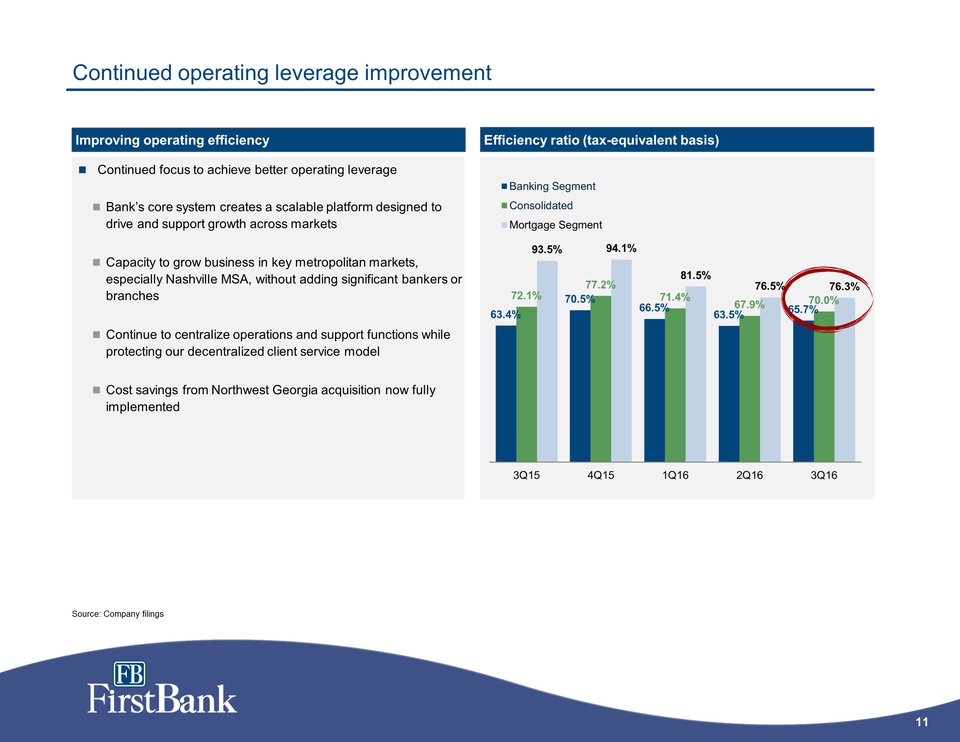
FB FirstBank 11 Continued operating leverage improvement Continued focus to achieve better operating leverage Bank’s core system creates a scalable platform designed to drive and support growth across markets Capacity to grow business in key metropolitan markets, especially Nashville MSA, without adding significant bankers or branches Continue to centralize operations and support functions while protecting our decentralized client service model Cost savings from Northwest Georgia acquisition now fully implemented 63.4% 62.2% 66.3% 63.5% 65.7% 72.1% 71.2% 71.3% 68.1% 70.0% 93.5% 94.1% 81.5% 76.5% 76.3% 3Q15 4Q15 1Q16 2Q16 3Q16 Banking Segment Consolidated Mortgage Segment Efficiency ratio (tax-equivalent basis) Improving operating efficiency Source: Company filings
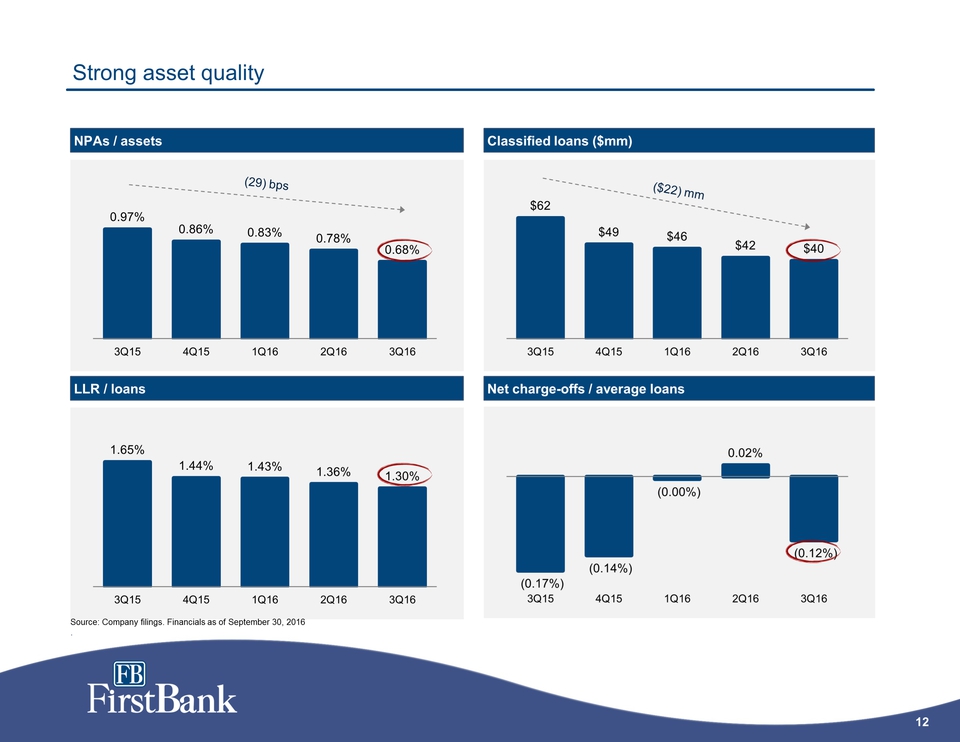
12 FB FirstBank Strong asset quality (0.17%) (0.14%) (0.00%) 0.02% (0.12%) 3Q15 4Q15 1Q16 2Q16 3Q16 1.65% 1.44% 1.43% 1.36% 1.30% 3Q15 4Q15 1Q16 2Q16 3Q16 $62 $49 $46 $42 $40 3Q15 4Q15 1Q16 2Q16 3Q16 0.97% 0.86% 0.83% 0.78% 0.68% 3Q15 4Q15 1Q16 2Q16 3Q16 Source: Company filings. Financials as of September 30, 2016(29) bps ($22) mm NPAs / assets Classified loans ($mm) LLR / loans Net charge-offs / average loans
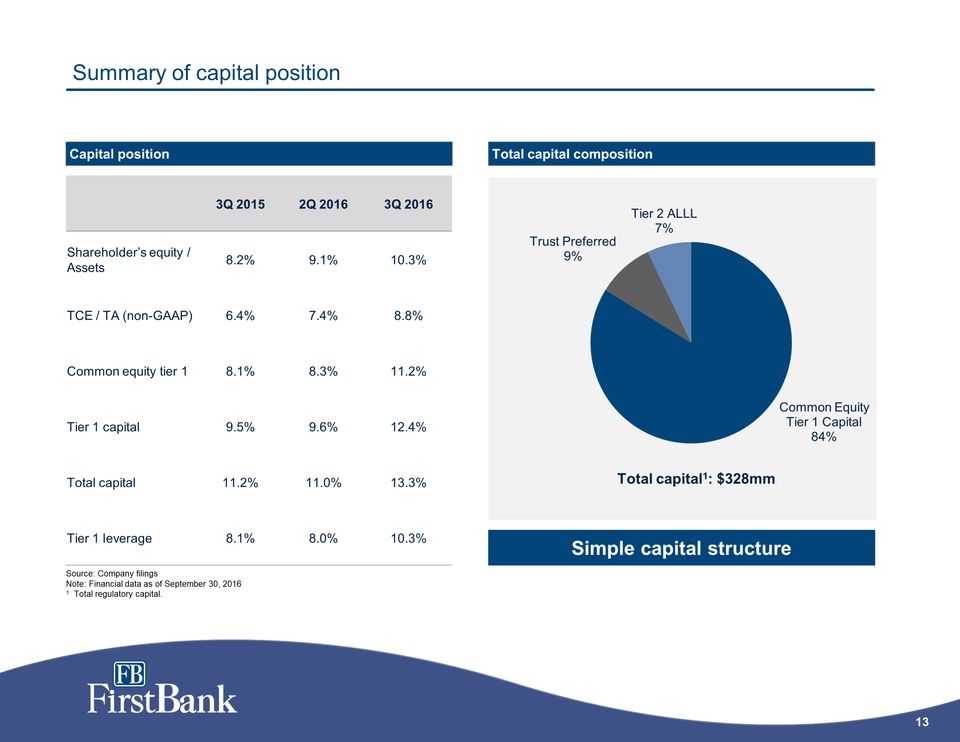
13 FB FirstBank Common Equity Tier 1 Capital 84%Trust Preferred 9% Tier 2 ALLL 7% Total capital 1: $328 mm Summary of capital position Source: Company filings Note: Financial data as of September 30, 2016 1 Total regulatory capital. Capital position Total capital composition 3Q 2015 2Q 2016 3Q 2016 Shareholder’s equity / Assets 8.2% 9.1% 10.3% TCE / TA (non-GAAP) 6.4% 7.4% 8.8% Common equity tier 1 8.1% 8.3% 11.2% Tier 1 capital 9.5% 9.6% 12.4% Total capital 11.2% 11.0% 13.3% Tier 1 leverage 8.1% 8.0% 10.3% Simple capital structure

14 FB FirstBank Appendix
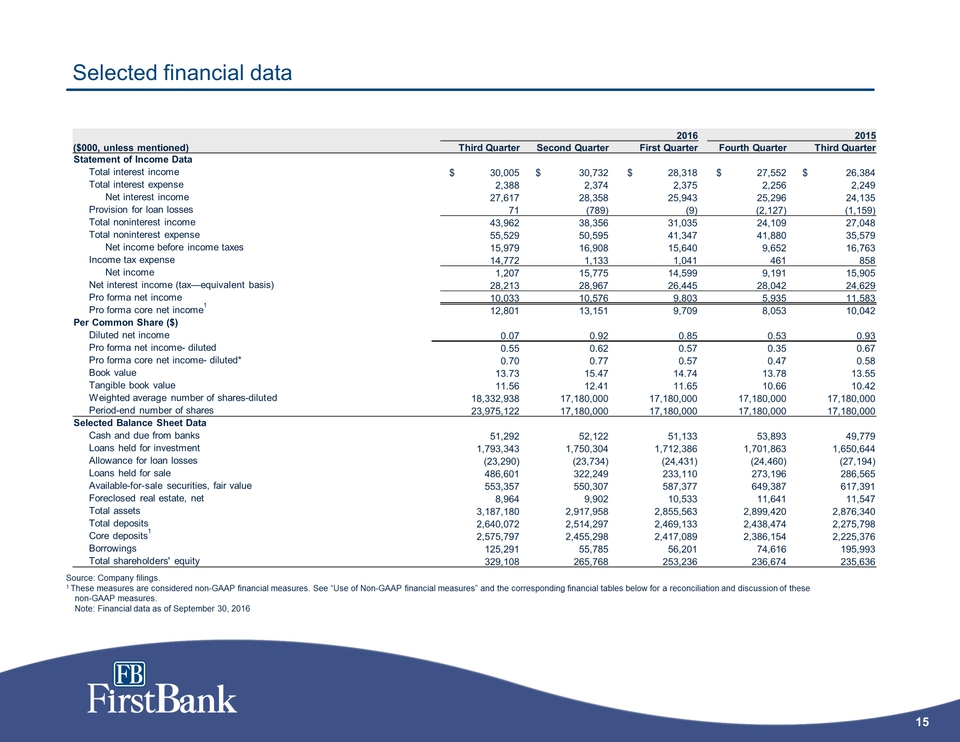
15 FB FirstBank Selected financial data 2016 2015 ($000, unless mentioned) Third Quarter Second Quarter First Quarter Fourth Quarter Third Quarter Statement of Income Data Total interest income $ 30,005 $ 30,732 $ 28,318 $ 27,552 $ 26,384 Total interest expense 2,388 2,374 2,375 2,256 2,249 Net interest income 27,617 28,358 25,943 25,296 24,135 Provision for loan losses 71 (789) (9) (2,127) (1,159) Total noninterest income 43,962 38,356 31,035 24,109 27,048 Total noninterest expense 55,529 50,595 41,347 41,880 35,579 Net income before income taxes 15,979 16,908 15,640 9,652 16,763 Income tax expense 14,772 1,133 1,041 461 858 Net income 1,207 15,775 14,599 9,191 15,905 Net interest income (tax—equivalent basis) 28,213 28,967 26,445 28,042 24,629 Pro forma net income 10,033 10,576 9,803 5,935 11,583 Pro forma core net income1 12,801 13,151 9,709 7,137 10,042 Per Common Share ($) Diluted net income 0.07 0.92 0.85 0.53 0.93 Pro forma net income-diluted 0.55 0.62 0.57 0.35 0.67 Pro forma core net income-diluted* 0.70 0.77 0.57 0.42 0.58 Book value 13.73 15.47 14.74 13.78 13.55 Tangible book value 11.56 12.41 11.65 10.66 10.42 Weighted average number of shares-diluted 18,332,938 17,180,000 17,180,000 17,180,000 17,180,000 Period-end number of shares 23,975,122 17,180,000 17,180,000 17,180,000 17,180,000 Selected Balance Sheet Data Cash and due from banks 51,292 52,122 51,133 53,893 49,779 Loans held for investment 1,793,343 1,750,304 1,712,386 1,701,863 1,650,644 Allowance for loan losses (23,290) (23,734) (24,431) (24,460) (27,194) Loans held for sale 486,601 322,249 233,110 273,196 286,565 Available-for-sale securities, fair value 553,357 550,307 587,377 649,387 617,391 Foreclosed real estate, net 8,964 9,902 10,533 11,641 11,547 Total assets 3,187,180 2,917,958 2,855,563 2,899,420 2,876,340 Total deposits 2,640,072 2,514,297 2,469,133 2,438,474 2,275,798 Core deposits1 2,575,797 2,455,298 2,417,089 2,386,154 2,225,376 Borrowings 125,291 55,785 56,201 74,616 195,993 Total shareholders' equity 329,108 265,768 253,236 236,674 235,636 Source: Company filings. 1 These measures are considered non-GAAP financial measures. See “Use of Non-GAAP financial measures” and the corresponding financial tables below for a reconciliation and discussion of these non-GAAP measures.Note: Financial data as of September 30, 2016
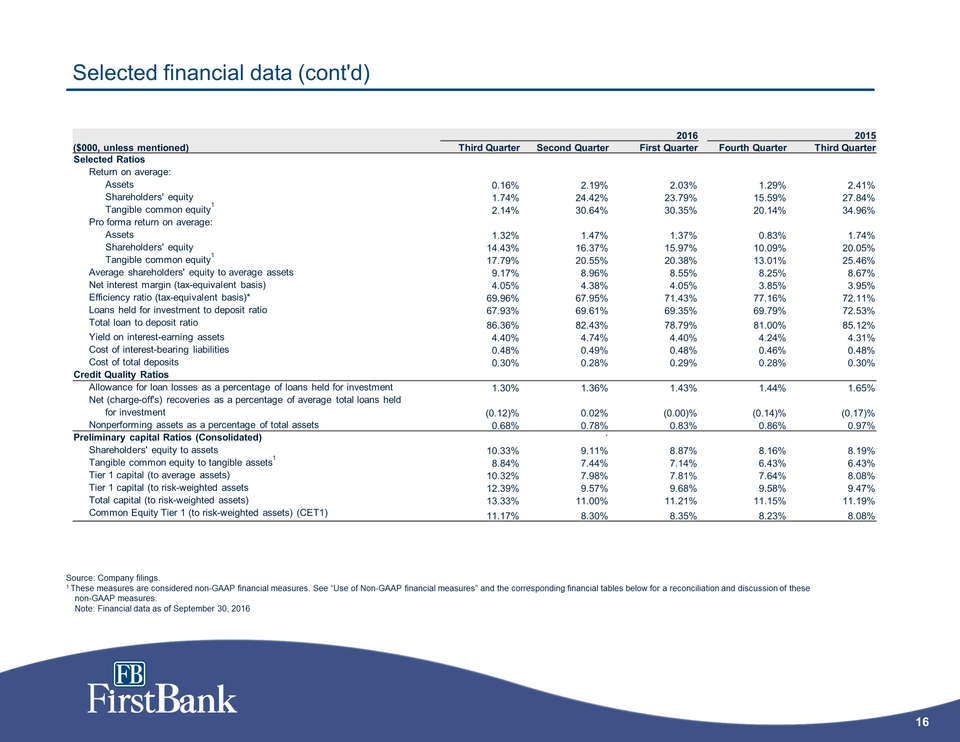
FB FirstBank 16 Selected financial data (cont'd) 2016 2015 ($000, unless mentioned) Third Quarter Second Quarter First Quarter Fourth Quarter Third Quarter Selected Ratios Return on average: Assets 0.16% 2.19% 2.03% 1.29% 2.41% Shareholders' equity 1.74% 24.42% 23.79% 15.59% 27.84% Tangible common equity 1 2.14% 30.64% 30.35% 20.14% 34.96% Pro forma return on average: Assets 1.32% 1.47% 1.37% 0.83% 1.74% Shareholders' equity 14.43% 16.37% 15.97% 10.09% 20.05% Tangible common equity 1 17.79% 20.55% 20.38% 13.01% 25.46% Average shareholders' equity to average assets 9.17% 8.96% 8.55% 8.25% 8.67% Net interest margin (tax-equivalent basis) 4.05% 4.38% 4.05% 3.85% 3.95% Efficiency ratio (tax-equivalent basis)* 69.95% 68.08% 71.26% 71.20% 72.10% Loans held for investment to deposit ratio 67.93% 69.61% 69.35% 69.79% 72.53% Total loan to deposit ratio 86.36% 82.43% 78.79% 81.00% 85.12% Yield on interest-earning assets 4.40% 4.74% 4.40% 4.24% 4.31% Cost of interest-bearing liabilities 0.48% 0.49% 0.48% 0.46% 0.48% Cost of total deposits 0.30% 0.28% 0.29% 0.28% 0.30% Credit Quality Ratios Allowance for loan losses as a percentage of loans held for investment 1.30% 1.36% 1.43% 1.44% 1.65% Net (charge-off's) recoveries as a percentage of average total loans held for investment (0.12)% 0.02% (0.00)% (0.14)% (0.17)% Nonperforming assets as a percentage of total assets 0.68% 0.78% 0.83% 0.86% 0.97% Preliminary capital Ratios (Consolidated) Shareholders' equity to assets 10.33% 9.11% 8.87% 8.16% 8.19% Tangible common equity to tangible assets1 8.84% 7.44% 7.14% 6.43% 6.43% Tier 1 capital (to average assets) 10.32% 7.98% 7.81% 7.64% 8.08% Tier 1 capital (to risk-weighted assets 12.39% 9.57% 9.68% 9.58% 9.47% Total capital (to risk-weighted assets) 13.33% 11.00% 11.21% 11.15% 11.19% Common Equity Tier 1 (to risk-weighted assets) (CET1) 11.17% 8.30% 8.35% 8.23% 8.08% Source: Company filings. 1 These measures are considered non-GAAP financial measures. See “Use of Non-GAAP financial measures” and the corresponding financial tables below for a reconciliation and discussion of these non-GAAP measures.Note: Financial data as of September 30, 2016
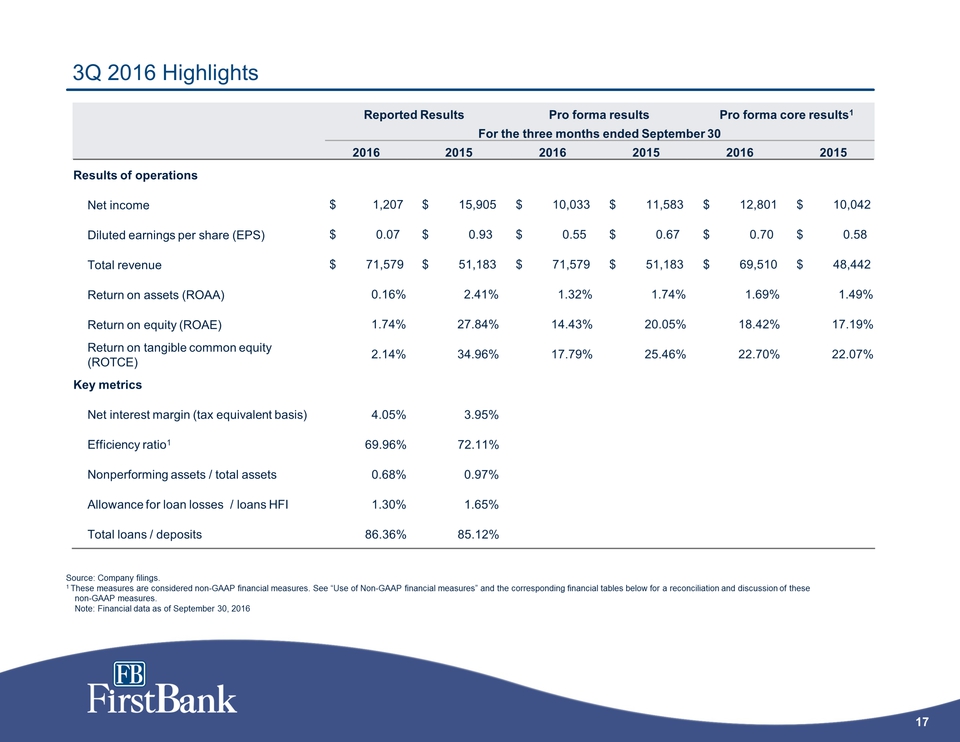
FB FirstBank 17 3Q 2016 Highlights Reported Results Pro forma results Pro forma coreresults1 For the three months ended September 30 2016 2015 2016 2015 2016 2015 Results of operations Net income $ 1,207 $ 15,905 $ 10,033 $ 11,583 $ 12,801 $ 10,042 Diluted earnings per share (EPS) $ 0.07 $ 0.93 $ 0.55 $ 0.67 $ 0.70 $ 0.58 Total revenue $ 71,579 $ 51,183 $ 71,579 $ 51,183 $ 69,510 $ 48,442 Return on assets (ROAA) 0.16% 2.41% 1.32% 1.74% 1.69% 1.49% Return on equity (ROAE) 1.74% 27.84% 14.43% 20.05% 18.42% 17.19% Return on tangible common equity (ROTCE) 2.14% 34.96% 17.79% 25.46% 22.70% 22.07% Key metrics Net interest margin (tax equivalent basis) 4.05% 3.95% Efficiency ratio 1 69.95% 72.10% Nonperforming assets / total assets 0.68% 0.97% Allowance for loan losses / loans HFI 1.30% 1.65% Total loans / deposits 86.36% 85.12% Source: Company filings. 1 These measures are considered non-GAAP financial measures. See “Use of Non-GAAP financial measures” and the corresponding financial tables below for a reconciliation and discussion of these non-GAAP measures.Note: Financial data as of September 30, 2016
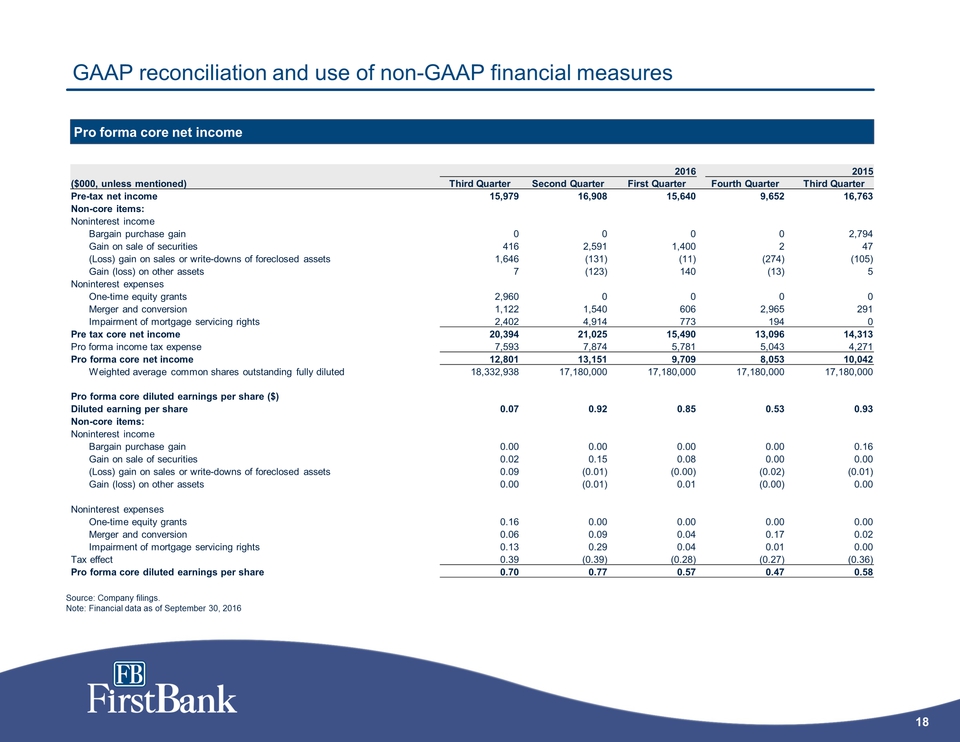
18 FB FirstBank GAAP reconciliation and use of non-GAAP financial measures Tax-equivalent core net income 2016 2015 ($000, unless mentioned) Third Quarter Second Quarter First Quarter Fourth Quarter Third Quarter Pre-tax net income 15,979 16,908 15,640 9,652 16,763 Non-core items: Noninterest income Bargain purchase gain 0 0 0 0 2,794 Gain on sale of securities 416 2,591 1,400 2 47 (Loss) gain on sales or write-downs of foreclosed assets 1,646 (131) (11) (274) (105) Gain (loss) on other assets 7 (123) 140 (13) 5 Noninterest expenses One-time equity grants 2,960 0 0 0 0 Merger and conversion 1,122 1,540 606 1,475 291 Impairment of mortgage servicing rights 2,402 4,914 773 194 0 Pre tax core net income 20,394 21,025 15,490 11,606 14,313 Pro forma income tax expense 7,593 7,874 5,781 4,469 4,271 Pro forma core net income 12,801 13,151 9,709 7,137 10,042 Weighted average common shares outstanding fully diluted 18,332,938 17,180,000 17,180,000 17,180,000 17,180,000 Pro forma core diluted earnings per share ($) Diluted earning per share 0.07 0.92 0.85 0.53 0.93 Non-core items: Noninterest income Bargain purchase gain 0.00 0.00 0.00 0.00 0.16 Gain on sale of securities 0.02 0.15 0.08 0.00 0.00 (Loss) gain on sales or write-downs of foreclosed assets 0.09 (0.01) (0.00) (0.02) (0.01) Gain (loss) on other assets 0.00 (0.01) 0.01 (0.00) 0.00 Noninterest expenses One-time equity grants 0.16 0.00 0.00 0.00 0.00 Merger and conversion 0.06 0.09 0.04 0.09 0.02 Impairment of mortgage servicing rights 0.13 0.29 0.04 0.01 0.00 Tax effect 0.39 (0.39) (0.28) (0.23) (0.36) Pro forma core diluted earnings per share 0.70 0.77 0.57 0.42 0.58 Source: Company filings. Note: Financial data as of September 30, 2016
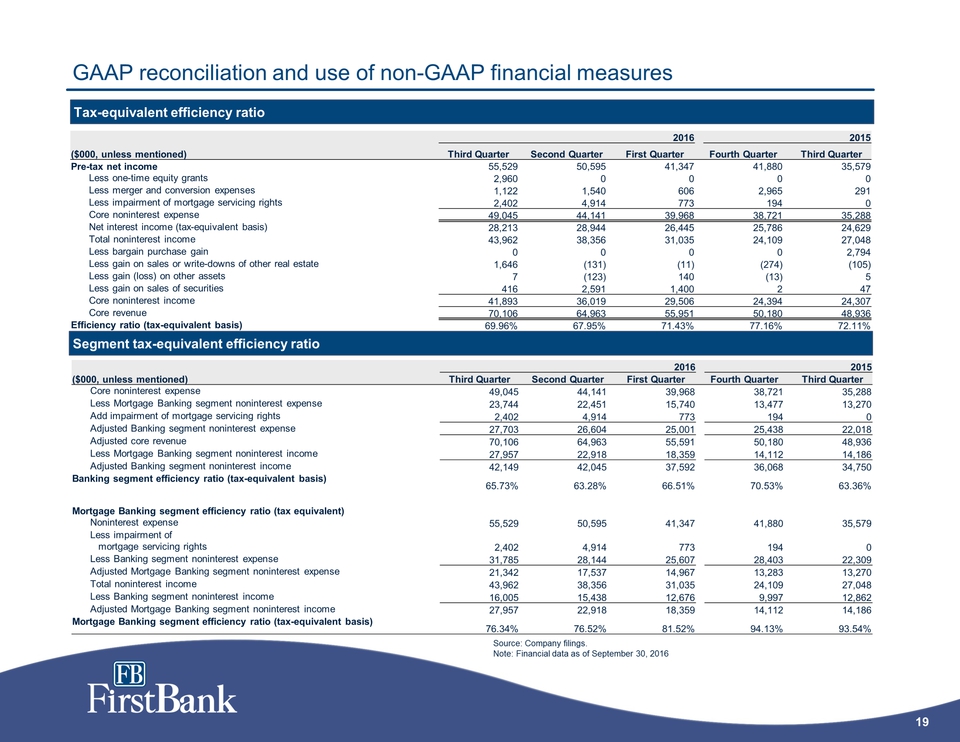
19 FB FirstBank GAAP reconciliation and use of non-GAAP financial measures Tax-equivalent efficiency ratio 2016 2015 ($000, unless mentioned) Third Quarter Second Quarter First Quarter Fourth Quarter Third Quarter Pre-tax net income 55,529 50,595 41,347 41,880 35,579 Less one-time equity grants 2,960 0 0 3,000 0 Less merger and conversion expenses 1,122 1,540 606 2,965 291 Less impairment of mortgage servicing rights 2,402 4,914 773 194 0 Core noninterest expense 49,045 44,141 39,968 35,721 35,288 Net interest income (tax-equivalent basis) 28,213 28,944 26,445 25,786 24,629 Total noninterest income 43,962 38,356 31,035 24,109 27,048 Less bargain purchase gain 0 0 0 0 2,794 Less gain on sales or write-downs of other real estate 1,646 (131) (11) (274) (105) Less gain on sales of securities 416 2,591 1,400 2 47 Core noninterest income 41,900 35,896 29,646 24,381 24,312 Core revenue 70,113 64,840 56,091 50,167 48,941 Efficiency ratio (tax-equivalent basis) 69.95% 68.08% 71.26% 71.20% 72.10% Segment tax-equivalent efficiency ratio 2016 2015 ($000, unless mentioned) Third Quarter Second Quarter First Quarter Fourth Quarter Third Quarter Adjusted noninterest expense 49,045 44,141 39,968 35,721 35,288 Less Mortgage Banking segment noninterest expense 23,744 22,451 15,740 13,477 13,270 Add impairment of mortgage servicing rights 2,402 4,914 773 194 0 Adjusted Banking segment noninterest expense 27,703 26,604 25,001 22,438 22,018 Adjusted core revenue 70,113 64,840 56,091 50,167 48,941 Less Mortgage Banking segment noninterest income 27,957 22,918 18,359 14,112 14,186 Adjusted Banking segment noninterest income 42,156 41,922 37,732 36,055 34,755 Banking segment efficiency ratio (tax-equivalent basis) 65.72% 63.46% 66.26% 62.23% 63.35% Mortgage Banking segment efficiency ratio (tax equivalent) Noninterest expense 55,529 50,595 41,347 41,880 35,579 Less impairment ofmortgage servicing rights 2,402 4,914 773 194 0 Less Banking segment noninterest expense 31,785 28,144 25,607 28,403 22,309 Adjusted Mortgage Banking segment noninterest expense 21,342 17,537 14,967 13,283 13,270 Total noninterest income 43,962 38,356 31,035 24,109 27,048 Less Banking segment noninterest income 16,005 15,438 12,676 9,997 12,862 Adjusted Mortgage Banking segment noninterest income 27,957 22,918 18,359 14,112 14,186 Mortgage Banking segment efficiency ratio (tax-equivalent basis) 76.34% 76.52% 81.52% 94.13% 93.54% Source: Company filings. Note: Financial data as of September 30, 2016
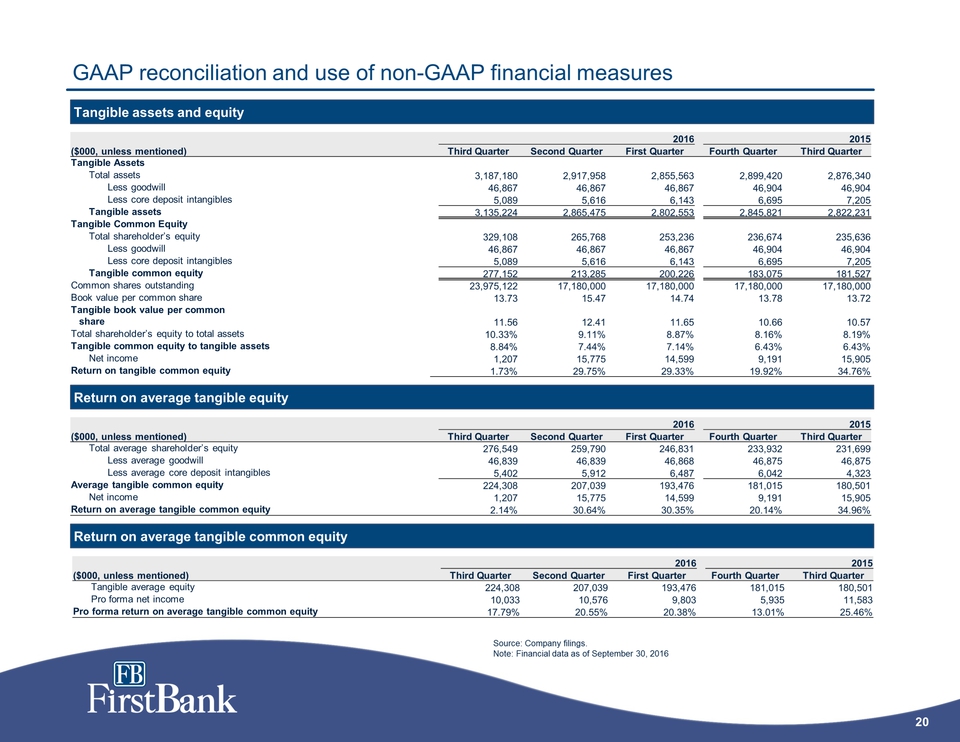
20 FB FirstBank GAAP reconciliation and use of non-GAAP financial measures Tangible assets and equity 2016 2015 ($000, unless mentioned) Third Quarter Second Quarter First Quarter Fourth Quarter Third Quarter Tangible Assets Total assets 3,187,180 2,917,958 2,855,563 2,899,420 2,876,340 Less goodwill 46,867 46,867 46,867 46,904 46,904 Less core deposit intangibles 5,089 5,616 6,143 6,695 7,205 Tangible assets 3,135,224 2,865,475 2,802,553 2,845,821 2,822,231 Tangible Common Equity Total shareholder’s equity 329,108 265,768 253,236 236,674 235,636 Less goodwill 46,867 46,867 46,867 46,904 46,904 Less core deposit intangibles 5,089 5,616 6,143 6,695 7,205 Tangible common equity 277,152 213,285 200,226 183,075 181,527 Common shares outstanding 23,975,122 17,180,000 17,180,000 17,180,000 17,180,000 Book value per common share 13.73 15.47 14.74 13.78 13.72 Tangible book value per common share 11.56 12.41 11.65 10.66 10.57 Total shareholder’s equity to total assets 10.33% 9.11% 8.87% 8.16% 8.19% Tangible common equity to tangible assets 8.84% 7.44% 7.14% 6.43% 6.43% Net income 1,207 15,775 14,599 9,191 15,905 Return on tangible common equity 1.73% 29.75% 29.33% 19.92% 34.76% 2016 2015 ($000, unless mentioned) Third Quarter Second uarter First Quarter Fourth Quarter Third Quarter Total average shareholder’s equity 276,549 259,790 246,831 233,932 231,699 Less average goodwill 46,839 46,839 46,868 46,875 46,875 Less average core deposit intangibles 5,402 5,912 6,487 6,042 4,323 Tangible average common equity 224,308 207,039 193,476 181,015 180,501 Net income 1,207 15,775 14,599 9,191 15,905 Return on average tangible common equity 2.14% 30.64% 30.35% 20.14% 34.96% 2016 2015 ($000, unless mentioned) Third Quarter Second Quarter First Quarter Fourth Quarter Third Quarter Tangible average equity 224,308 207,039 193,476 181,015 180,501 Pro forma net income 10,033 10,576 9,803 5,935 11,583 Pro forma return on average tangible common equity 17.79% 20.55% 20.38% 13.01% 25.46% Return on average tangible equity Return on average tangible common equity Source: Company filings. Note: Financial data as of September 30, 2016
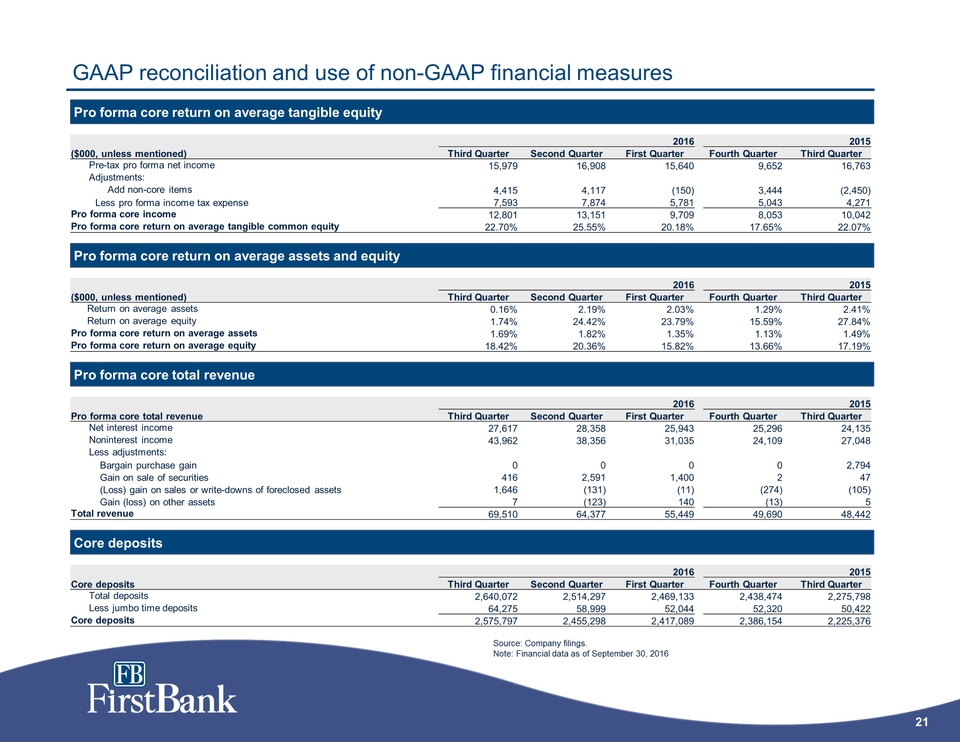
21 FB FirstBank GAAP reconciliation and use of non-GAAP financial measures Pro forma core return on average tangible equity Pro forma core return on average assets and equity Pro forma core total revenue 2016 2015 ($000, unless mentioned) Third Quarter Second Quarter First Quarter Fourth Quarter Third Quarter Pre-tax pro forma net income 15,979 16,908 15,640 9,652 16,763 Adjustments: Add non-core items 4,415 4,117 (150) 1,954 (2,450) Less pro forma income tax expense 7,593 7,874 5,781 4,469 4,271 Pro forma core income 12,801 13,151 9,709 7,137 10,042 Pro forma core return on average tangible common equity 22.70% 25.55% 20.18% 15.64% 22.07% 2016 2015 ($000, unless mentioned) Third Quarter Second Quarter First Quarter Fourth Quarter Third Quarter Return on average assets 0.16% 2.19% 2.03% 1.29% 2.41% Return on average equity 1.74% 24.42% 23.79% 15.59% 27.84% Pro forma core return on average assets 1.69% 1.82% 1.35% 1.00% 1.49% Pro forma core return on average equity 18.42% 20.36% 15.82% 12.10% 17.19% 2016 2015 Pro forma core total revenue Third Quarter Second Quarter First Quarter Fourth Quarter Third Quarter Net interest income 27,617 28,358 25,943 25,296 24,135 Noninterest income 43,962 38,356 31,035 24,109 27,048 Less adjustments: Bargain purchase gain 0 0 0 0 2,794 Gain on sale of securities 416 2,591 1,400 2 47 (Loss) gain on sales or write-downs of foreclosed assets 1,646 (131) (11) (274) (105) Gain (loss) on other assets 7 (123) 140 (13) 5 Total revenue 69,510 64,377 55,449 49,690 48,442 2016 2015 Core deposits Third Quarter Second Quarter First Quarter Fourth Quarter Third Quarter Total deposits 2,640,072 2,514,297 2,469,133 2,438,474 2,275,798 Less jumbo time deposits 64,275 58,999 52,044 52,320 50,422 Core deposits 2,575,797 2,455,298 2,417,089 2,386,154 2,225,376 Core deposits Source: Company filings. Note: Financial data as of September 30, 2016