Attached files
| file | filename |
|---|---|
| 8-K - CURRENT REPORT OF MATERIAL EVENTS OR CORPORATE CHANGES - Hilltop Holdings Inc. | a16-20472_18k.htm |
Exhibit 99.1
Hilltop Holdings Inc. Q3 2016 Earnings Presentation October 28, 2016

Preface 2 200 Crescent Court, Suite 1330 Dallas, TX 75201 Phone: (214) 855-2177 Fax: (817) 887-1687 www.hilltop-holdings.com Please contact: Isabell Novakov Phone: (214) 252-4029 Email: inovakov@hilltop-holdings.com Corporate Headquarters Additional Information FORWARD-LOOKING STATEMENTS This presentation and statements made by representatives of Hilltop Holdings Inc. (“Hilltop” or the “Company”) during the course of this presentation include “forward-looking statements” within the meaning of the Private Securities Litigation Reform Act of 1995. These forward-looking statements involve known and unknown risks, uncertainties and other factors that may cause our actual results, performance or achievements to be materially different from any future results, performance or achievements anticipated in such statements. Forward-looking statements speak only as of the date they are made and, except as required by law, we do not assume any duty to update forward-looking statements. Such forward-looking statements include, but are not limited to, statements concerning such things as our business strategy, our financial condition, our efforts to make strategic acquisitions, the integration of the operations acquired in the SWS Merger, our revenue, our liquidity and sources of funding, market trends, operations and business, stock repurchases, dividend payments, expectations concerning mortgage loan origination volume, expected losses on covered loans and related reimbursements from the Federal Deposit Insurance Corporation (“FDIC”), expected levels of refinancing as a percentage of total loan origination volume, projected losses on mortgage loans originated, anticipated changes in our revenues or earnings, the effects of government regulation applicable to our operations, the appropriateness of our allowance for loan losses and provision for loan losses, the collectability of loans and the outcome of litigation, our other plans, objectives, strategies, expectations and intentions and other statements that are not statements of historical fact, and may be identified by words such as “anticipates,” “believes,” “could,” “estimates,” “expects,” “forecasts,” “goal,” “intends,” “may,” “might,” “plan,” “probable,” “projects,” “seeks,” “should,” “target,” “view” or “would” or the negative of these words and phrases or similar words or phrases. The following factors, among others, could cause actual results to differ from those set forth in the forward-looking statements: (i) our ability to estimate loan losses; (ii) changes in the default rate of our loans; (iii) changes in general economic, market and business conditions in areas or markets where we compete, including changes in the price of crude oil; (iv) risks associated with concentration in real estate related loans; (v) risks associated with merger and acquisition integration, including our ability to promptly and effectively integrate our businesses with those acquired in the SWS Merger and achieve the anticipated synergies and cost savings in connection therewith, as well as the diversion of management time on acquisition- and integration-related issues; (vi) severe catastrophic events in Texas and other areas of the southern United States; (vii) changes in the interest rate environment; (viii) cost and availability of capital; (vix) effectiveness of our data security controls in the face of cyber attacks; (x) changes in state and federal laws, regulations or policies affecting one or more of the our business segments, including changes in regulatory fees, deposit insurance premiums, capital requirements and the Dodd-Frank Wall Street Reform and Consumer Protection Act; (xi) approval of new, or changes in, accounting policies and practices; (xii) changes in key management; (xiii) competition in our banking, broker-dealer, mortgage origination and insurance segments from other banks and financial institutions, as well as investment banking and financial advisory firms, mortgage bankers, asset-based non-bank lenders, government agencies and insurance companies; (xiv) our ability to obtain reimbursements for losses on acquired loans under loss-share agreements with the FDIC to the extent the FDIC determines that we did not adequately manage the covered loan portfolio; (xv) failure of our insurance segment reinsurers to pay obligations under reinsurance contracts; and (xvi) our ability to use excess cash in an effective manner, including the execution of successful acquisitions. For further discussion of such factors, see the risk factors described in the Hilltop Annual Report on Form 10-K for the year ended December 31, 2015 and other reports filed with the Securities and Exchange Commission. All forward-looking statements are qualified in their entirety by this cautionary statement.
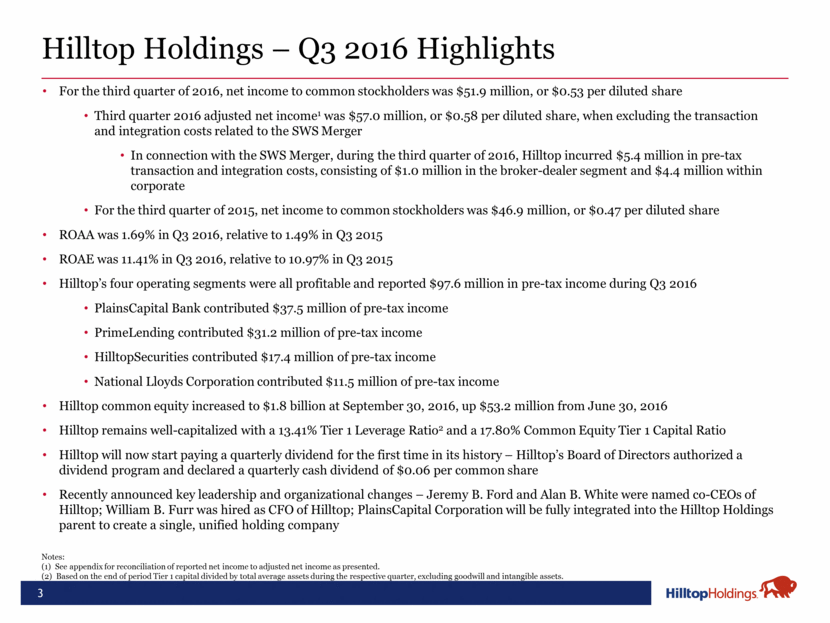
3 Hilltop Holdings – Q3 2016 Highlights For the third quarter of 2016, net income to common stockholders was $51.9 million, or $0.53 per diluted share Third quarter 2016 adjusted net income1 was $57.0 million, or $0.58 per diluted share, when excluding the transaction and integration costs related to the SWS Merger In connection with the SWS Merger, during the third quarter of 2016, Hilltop incurred $5.4 million in pre-tax transaction and integration costs, consisting of $1.0 million in the broker-dealer segment and $4.4 million within corporate For the third quarter of 2015, net income to common stockholders was $46.9 million, or $0.47 per diluted share ROAA was 1.69% in Q3 2016, relative to 1.49% in Q3 2015 ROAE was 11.41% in Q3 2016, relative to 10.97% in Q3 2015 Hilltop’s four operating segments were all profitable and reported $97.6 million in pre-tax income during Q3 2016 PlainsCapital Bank contributed $37.5 million of pre-tax income PrimeLending contributed $31.2 million of pre-tax income HilltopSecurities contributed $17.4 million of pre-tax income National Lloyds Corporation contributed $11.5 million of pre-tax income Hilltop common equity increased to $1.8 billion at September 30, 2016, up $53.2 million from June 30, 2016 Hilltop remains well-capitalized with a 13.41% Tier 1 Leverage Ratio2 and a 17.80% Common Equity Tier 1 Capital Ratio Hilltop will now start paying a quarterly dividend for the first time in its history – Hilltop’s Board of Directors authorized a dividend program and declared a quarterly cash dividend of $0.06 per common share Recently announced key leadership and organizational changes – Jeremy B. Ford and Alan B. White were named co-CEOs of Hilltop; William B. Furr was hired as CFO of Hilltop; PlainsCapital Corporation will be fully integrated into the Hilltop Holdings parent to create a single, unified holding company Notes: (1) See appendix for reconciliation of reported net income to adjusted net income as presented. (2) Based on the end of period Tier 1 capital divided by total average assets during the respective quarter, excluding goodwill and intangible assets.
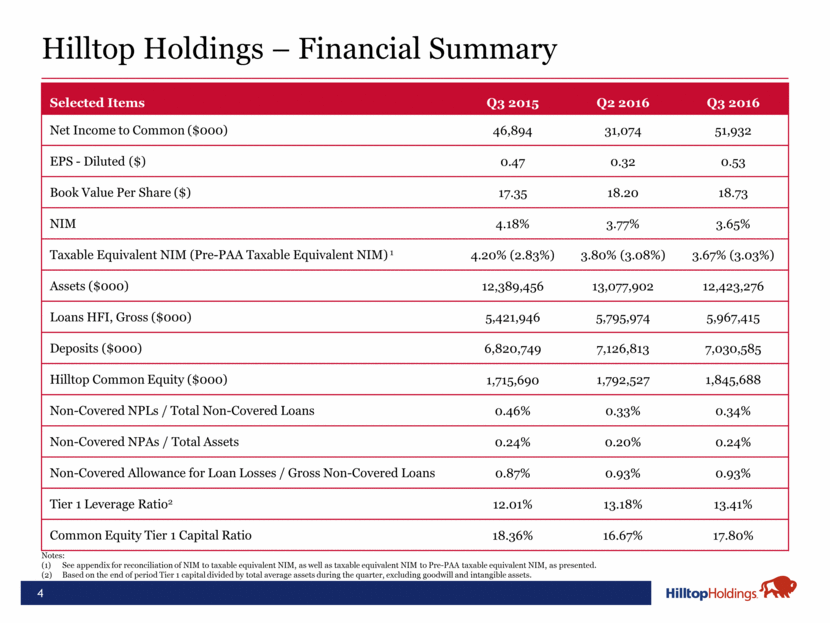
4 Hilltop Holdings – Financial Summary Selected Items Q3 2015 Q2 2016 Q3 2016 Net Income to Common ($000) 46,894 31,074 51,932 EPS - Diluted ($) 0.47 0.32 0.53 Book Value Per Share ($) 17.35 18.20 18.73 NIM 4.18% 3.77% 3.65% Taxable Equivalent NIM (Pre-PAA Taxable Equivalent NIM) 1 4.20% (2.83%) 3.80% (3.08%) 3.67% (3.03%) Assets ($000) 12,389,456 13,077,902 12,423,276 Loans HFI, Gross ($000) 5,421,946 5,795,974 5,967,415 Deposits ($000) 6,820,749 7,126,813 7,030,585 Hilltop Common Equity ($000) 1,715,690 1,792,527 1,845,688 Non-Covered NPLs / Total Non-Covered Loans 0.46% 0.33% 0.34% Non-Covered NPAs / Total Assets 0.24% 0.20% 0.24% Non-Covered Allowance for Loan Losses / Gross Non-Covered Loans 0.87% 0.93% 0.93% Tier 1 Leverage Ratio2 12.01% 13.18% 13.41% Common Equity Tier 1 Capital Ratio 18.36% 16.67% 17.80% Notes: See appendix for reconciliation of NIM to taxable equivalent NIM, as well as taxable equivalent NIM to Pre-PAA taxable equivalent NIM, as presented. Based on the end of period Tier 1 capital divided by total average assets during the quarter, excluding goodwill and intangible assets.
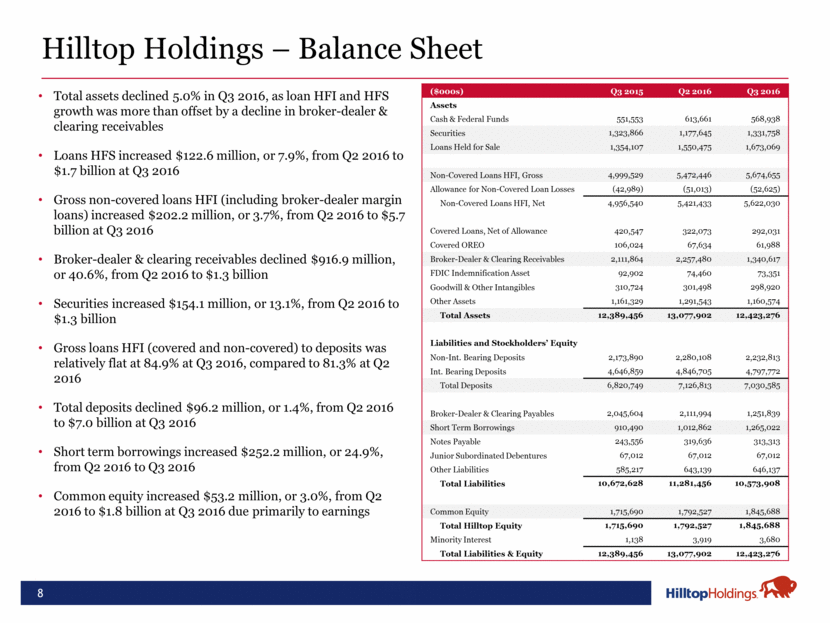
5 Hilltop Holdings – Net Interest Income & Margin Reported taxable equivalent NIM declined by 13 bps in Q3 2016 to 3.67% compared with 3.80% in Q2 2016 NIM decline primarily a result of elevated NIM in Q2 2016 that was due to a nonaccrual loan being paid in full; decline also partially driven by lower securities yields and higher other borrowings costs in Q3 2016 NIM pressures were offset by an increase in yield on other assets as well as a slight decline in cost of interest bearing deposits relative to Q2 2016 For Q3 2016, the NIM and tax equivalent NIM for Hilltop was 64 bps greater due to purchase accounting, driven mainly by: Accretion of discount on loans of $16.0 million Amortization of premium on acquired securities of $0.8 million Hilltop NIM and taxable equivalent NIM was reduced by broker-dealer’s securities financing business, with stated NIM and taxable equivalent NIM impacted by 50 basis points in Q3 2016 Bank taxable equivalent NIM for Q3 2016 was 4.53% (3.63% before PAA) relative to 4.87% (3.83% before PAA) in Q2 2016 Annualized Yields and Rates (%) Q3 2015 Q2 2016 Q3 2016 Interest Earning Assets Loans, Gross 6.64 5.56 5.26 Investment Securities, Taxable 2.24 2.53 2.36 Investment Securities, Non-Taxable 3.85 2.98 2.77 Fed Funds Sold and Securities to Resell 0.07 0.10 0.11 Interest Earning Deposits 0.21 0.50 0.47 Other 1.82 1.54 2.44 Total Int. Earning Assets 4.74 4.27 4.22 Interest Bearing Liabilities Interest Bearing Deposits 0.31 0.34 0.33 Notes Payable and Borrowings 1.36 1.44 1.76 Total Int. Bearing Liabilities 0.75 0.73 0.84 Net Interest Margin 4.18 3.77 3.65 Net Interest Margin (Stated Taxable Equivalent) 4.20 3.80 3.67 Net Interest Margin (Stated Taxable Equivalent Pre-PAA) 2.83 3.08 3.03 Note: See appendix for reconciliation of NIM to taxable equivalent NIM, as well as taxable equivalent NIM to Pre-PAA taxable equivalent NIM, as presented.
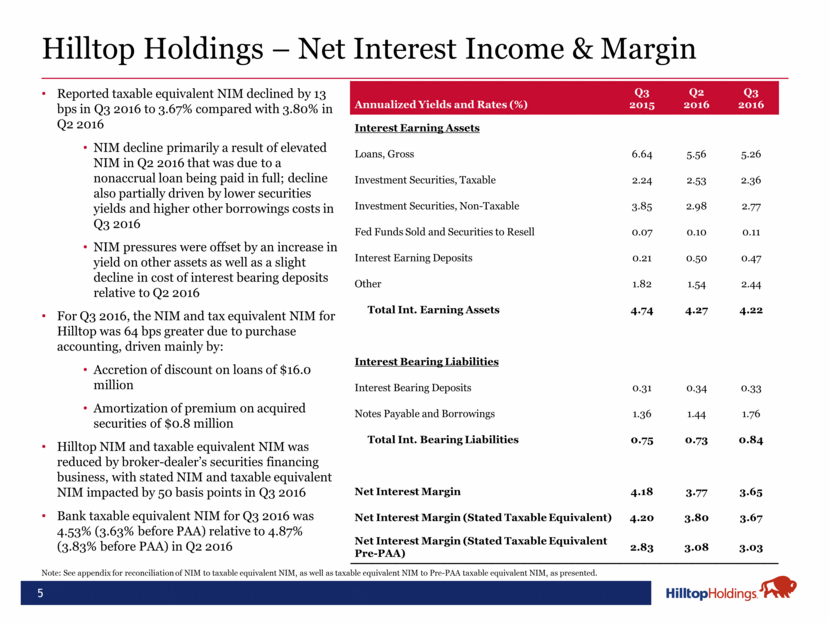
Hilltop Holdings – Noninterest Income Noninterest income for Q3 2016 was $354.5 million, up 19.6% versus Q3 2015 Net gains from the sale of loans, other mortgage production income, and mortgage loan origination fees increased $42.3 million, or 26.4%, from Q3 2015 to $202.2 million in Q3 2016, representing 57% of noninterest income for the quarter Securities and investment advisory fees & commissions increased $4.1 million, or 6.2%, from Q3 2015 to $70.9 million in Q3 2016, representing 20% of noninterest income for the quarter Net insurance premiums earned were $38.7 million in Q3 2016, representing 11% of noninterest income for the quarter 6 160.0 202.2 41.2 38.7 66.7 70.9 28.6 42.6 $296.5 $354.5 $0.0 $50.0 $100.0 $150.0 $200.0 $250.0 $300.0 $350.0 $400.0 Q3 2015 Q3 2016 Noninterest Income ($MM) Other Securities and Investment Advisory Fees & Commissions Net Insurance Premiums Earned Net Gains on Sale of Loans, Mortgage Origination Fees, Other Mortgage Production Income
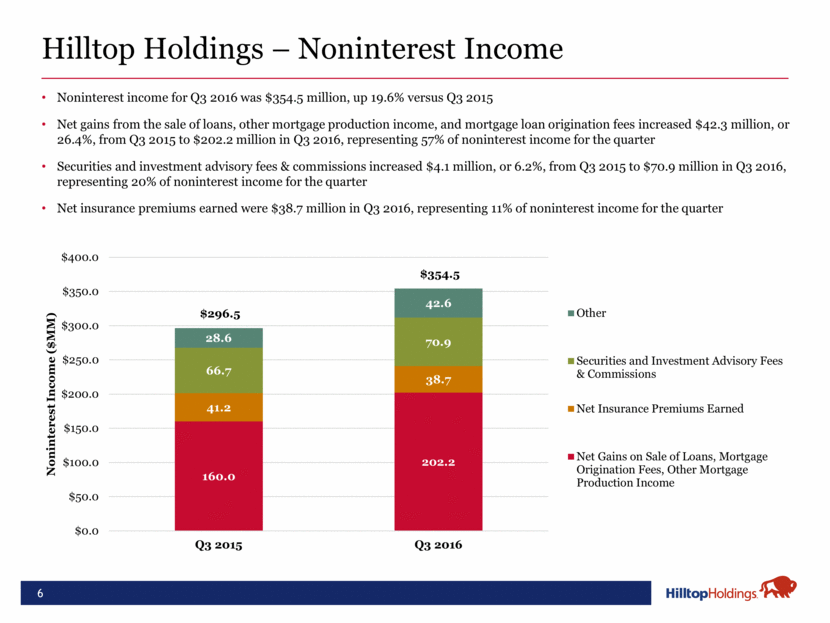
Hilltop Holdings – Noninterest Expense Noninterest expense was $364.1 million in Q3 2016, up 9.2% from Q3 2015 Compensation was $225.2 million in Q3 2016 (compared to $200.6 million in Q3 2015), representing 62% of noninterest expense for the quarter During Q3 2016 we incurred $0.8 million in employee comp. expenses (severance/retention) related to the SWS Merger, compared to $0.4 million in Q3 2015 Loss and LAE and policy acquisition and other underwriting expense were $27.1 million in Q3 2016, representing 7% of noninterest expense for the quarter Occupancy and equipment expense decreased $1.9 million, or 6.4%, from Q3 2015 to $27.5 million in Q3 2016, representing 8% of noninterest expense for the quarter Other expenses increased $9.9 million, or 13.4%, from Q3 2015 to $84.4 million in Q3 2016 During Q3 2016 we incurred $4.6 million in transaction and integration related costs (excluding employee compensation related costs) due to the SWS Merger, compared to $2.4 million in Q3 2015 7 200.6 225.2 29.1 27.1 29.3 27.5 74.4 84.4 $333.5 $364.1 $0.0 $50.0 $100.0 $150.0 $200.0 $250.0 $300.0 $350.0 $400.0 Q3 2015 Q3 2016 Noninterest Expense ($ MM) Other Occupancy and Equipment Loss, LAE, Policy Acquisition and Other Underwriting Expense Compensation and Benefits
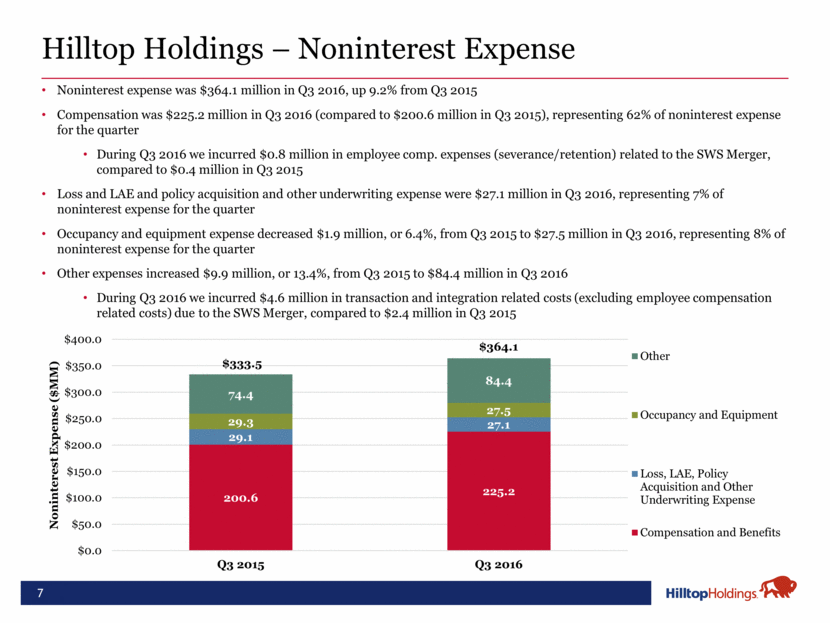
Hilltop Holdings – Balance Sheet Total assets declined 5.0% in Q3 2016, as loan HFI and HFS growth was more than offset by a decline in broker-dealer & clearing receivables Loans HFS increased $122.6 million, or 7.9%, from Q2 2016 to $1.7 billion at Q3 2016 Gross non-covered loans HFI (including broker-dealer margin loans) increased $202.2 million, or 3.7%, from Q2 2016 to $5.7 billion at Q3 2016 Broker-dealer & clearing receivables declined $916.9 million, or 40.6%, from Q2 2016 to $1.3 billion Securities increased $154.1 million, or 13.1%, from Q2 2016 to $1.3 billion Gross loans HFI (covered and non-covered) to deposits was relatively flat at 84.9% at Q3 2016, compared to 81.3% at Q2 2016 Total deposits declined $96.2 million, or 1.4%, from Q2 2016 to $7.0 billion at Q3 2016 Short term borrowings increased $252.2 million, or 24.9%, from Q2 2016 to Q3 2016 Common equity increased $53.2 million, or 3.0%, from Q2 2016 to $1.8 billion at Q3 2016 due primarily to earnings 8 ($000s) Q3 2015 Q2 2016 Q3 2016 Assets Cash & Federal Funds 551,553 613,661 568,938 Securities 1,323,866 1,177,645 1,331,758 Loans Held for Sale 1,354,107 1,550,475 1,673,069 Non-Covered Loans HFI, Gross 4,999,529 5,472,446 5,674,655 Allowance for Non-Covered Loan Losses (42,989) (51,013) (52,625) Non-Covered Loans HFI, Net 4,956,540 5,421,433 5,622,030 Covered Loans, Net of Allowance 420,547 322,073 292,031 Covered OREO 106,024 67,634 61,988 Broker-Dealer & Clearing Receivables 2,111,864 2,257,480 1,340,617 FDIC Indemnification Asset 92,902 74,460 73,351 Goodwill & Other Intangibles 310,724 301,498 298,920 Other Assets 1,161,329 1,291,543 1,160,574 Total Assets 12,389,456 13,077,902 12,423,276 Liabilities and Stockholders’ Equity Non-Int. Bearing Deposits 2,173,890 2,280,108 2,232,813 Int. Bearing Deposits 4,646,859 4,846,705 4,797,772 Total Deposits 6,820,749 7,126,813 7,030,585 Broker-Dealer & Clearing Payables 2,045,604 2,111,994 1,251,839 Short Term Borrowings 910,490 1,012,862 1,265,022 Notes Payable 243,556 319,636 313,313 Junior Subordinated Debentures 67,012 67,012 67,012 Other Liabilities 585,217 643,139 646,137 Total Liabilities 10,672,628 11,281,456 10,573,908 Common Equity 1,715,690 1,792,527 1,845,688 Total Hilltop Equity 1,715,690 1,792,527 1,845,688 Minority Interest 1,138 3,919 3,680 Total Liabilities & Equity 12,389,456 13,077,902 12,423,276
9 Company Operational Updates PlainsCapital Bank Q3 2016 ROAA of 1.09% driven by solid loan growth and core NIM that are helping to offset declining purchase loan accretion Stable deposit costs have contributed to strong taxable equivalent net interest margin of 4.53% (3.63% Pre-PAA) 1 Quarterly non-covered HFI loan growth2 of 4.7% (20.0% annualized) for Q3 2016; favorable loan pipeline with $1.9 billion in total unused commitments and continue to hire new loan officers Outside of the single, isolated large loan charge off in Q2 2016, loan quality continues to be sound as non-covered NPLs were $25.2 million, or 0.34% of total non-covered loans, at Q3 2016 The Bank continues to vigorously pursue legal remedies related to the large loan that was fully charged off in Q2 2016 Energy exposure declined to 3.1% (down $54.8 million) of total loans and classified and criticized energy loans declined $2.1 million to $39.4 million at Q3 2016 6.7% reserve on energy portfolio – 22.3% of energy loans are classified and continue to have no shared national credits in the portfolio Non-interest bearing deposits are 31.8% of total deposits at Q3 2016 Operating 63 branches at 9/30/16; opened new loan production office in Dallas in July PrimeLending PrimeLending results improved significantly relative to Q3 2015, with funded loan volume up 23.4% to $4.5 billion in Q3 2016 Purchase volume of 71% in Q3 2016, relative to industry purchase volume of 53% in Q3 2016 Net gain on sale margin (basis points) continued to improve, with margin in Q3 2016 higher than both Q2 2016 and Q3 2015; improved margin and higher volumes drove improved gain on sale revenue Overall market share of 0.80% in Q3 2016 with purchase market share of 1.07% – continue to add high quality loan officers and maintain strong market share in face of significant refinance environment Note: Mortgage market share per Mortgage Bankers Association as of October 25, 2016. (1) See appendix for reconciliation of taxable equivalent NIM to Pre-PAA taxable equivalent NIM as presented. (2) Non-covered HFI loan growth excludes impact of broker-dealer margin loans held in the broker-dealer segment.
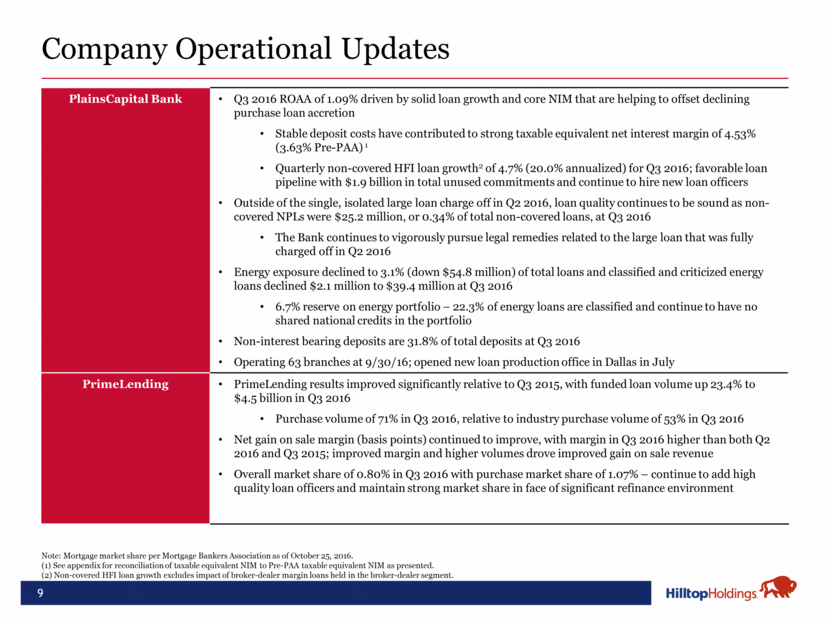
10 Company Operational Updates (Continued) HilltopSecurities After adjusting for transaction and integration costs ($1.0 million), HilltopSecurities earned $18.4 million of pre-tax income during Q3 20161 Strong profitability metrics, with a pre-tax margin of 15.7% and compensation to net revenue ratio of 61.1% during Q3 2016, driven by a 20.9% year-over-year increase in net revenue Improved capital markets and clearing results, continued strength in the Structured Finance and Public Finance business lines and the execution of integration initiatives drove the Q3 2016 financial performance National Lloyds Corporation Strong results for Q3 2016 are due to an end to seasonal severe storms as well as a reflection of management’s efforts to improve the risk profile and profitability of the book of business The anticipated result of some of these initiatives, alongside continued but moderate rate increases, is a decline in policies in force and direct premiums written year over year The Loss & LAE ratio of 41.4% and underwriting expense ratio of 33.6% in Q3 2016 were in line with the Loss & LAE ratio of 42.1% and underwriting expense ratio of 33.3% in Q3 2015 Note: (1) See Appendix for reconciliation of reported pre-tax income to adjusted pre-tax income.
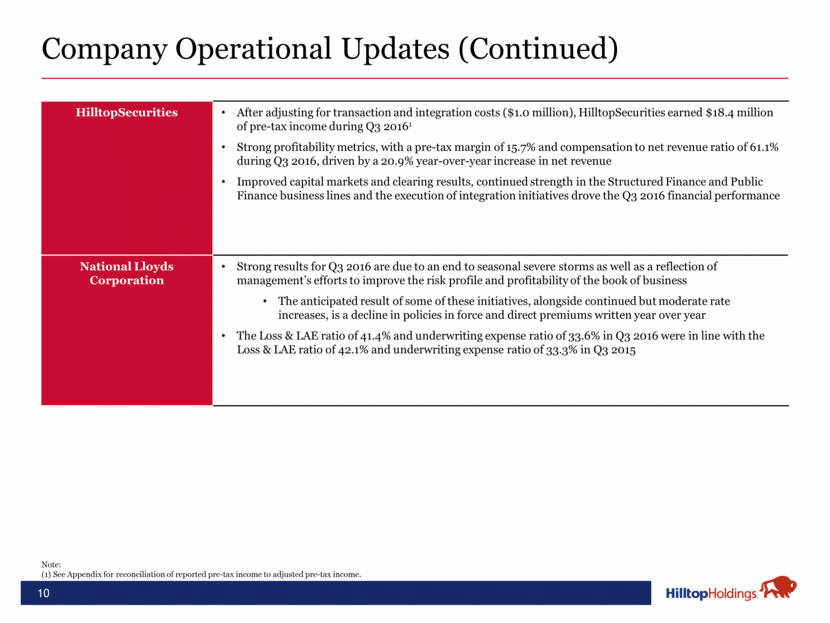
11 Pre-tax income decreased to $37.5 million in Q3 2016 versus $53.6 million in Q3 2015 primarily due to a decrease in accretion of discount on loans of approximately $20.0 million Accretion decline was partially offset by non-covered loan growth, increased warehouse line utilization and a stable core NIM (pre-PAA) Noninterest income decreased compared to Q3 2015 as a result of year over year declines in exchange fees (due to impact of Durbin Amendment) and OREO income Noninterest expense increased slightly compared to Q3 2015 due to increases in headcount and professional fees, as well as lower OREO recoveries PrimeLending funds originations through a $1.8 billion warehouse line from PlainsCapital Bank; $1.5 billion was drawn at September 30, 2016 Tier 1 Leverage Ratio1 declined to 12.65% from 12.72% at Q2 2016 PlainsCapital Bank – Q3 2016 Highlights Reported Summary Results ($000) Q3 2015 Q3 2016 Net Interest Income 105,758 90,549 Provision for Loan Losses 5,615 4,179 Noninterest Income 13,935 12,711 Noninterest Expense 60,518 61,536 Income Before Taxes 53,560 37,545 Key Highlights Q3 2015 Q3 2016 ROAA (%) 1.64 1.09 Taxable Equivalent NIM (%) 2 5.79 4.53 Efficiency (%) 50.6 59.6 Fee Income (%) 11.6 12.3 Assets ($B) $8.3 $9.2 HTH Consolidated Loans HFI by Type HTH Consolidated Deposit Mix by Type Notes: (1) Based on the end of period Tier 1 capital divided by total average assets during the respective quarter, excluding goodwill and intangible assets. (2) See appendix for reconciliation of NIM to taxable equivalent NIM as presented. (3) Loans and deposits by type represents consolidated balances at Hilltop and, therefore, eliminate intercompany balances. Broker-dealer loans represent margin loans to customers and correspondents (held at the broker-dealer). Total Deposits3: $7.0 billion Total Loans3: $6.0 billion C&I 29% Real Estate 49% C&D 13% Consumer 1% Broker - dealer 8% Non Int. Bearing Demand 32% NOW 16% Money Market 24% Demand 6% Savings 4% Time 18%
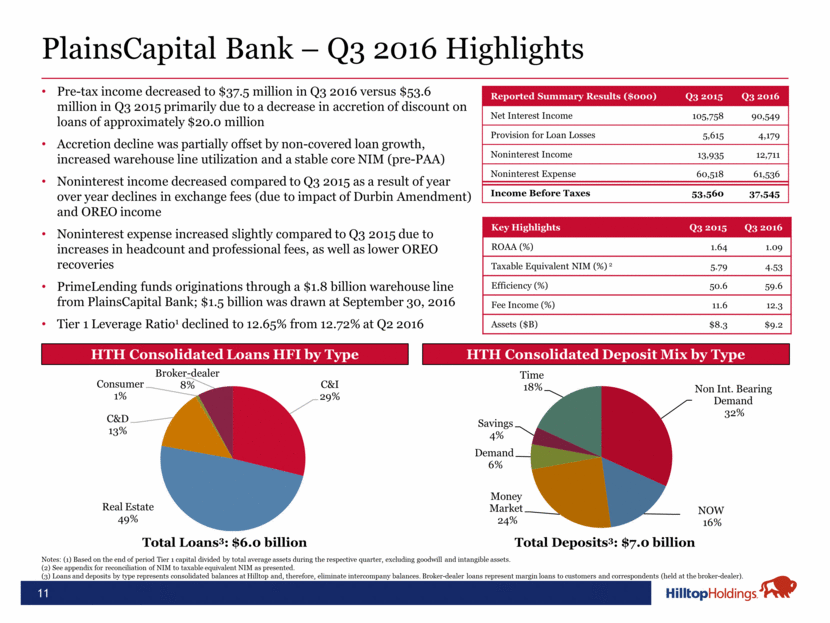
12 PlainsCapital Bank – Energy Exposure Note: (1) Total loans equal to HTH consolidated gross covered and non-covered loans HFI less margin loans held at the broker-dealer. No energy SNC’s in bank loan portfolio Continue to have relatively small balance of loans in Houston and surrounding region, though prudently growing Unfunded energy commitments are subject to borrowing bases and credit review before draw-downs The one large RLOC (that caused significant energy balance increase in Q1 2016) paid down in full in Q3 2016 but the line is still active This RLOC is to an existing customer of the bank and is secured by cash and AAA rated short term bonds of the borrower held in the bank Select Energy Statistics Q3 2015 Q4 2015 Q1 2016 Q2 2016 Q3 2016 Outstanding Energy Balance ($MM) 194.9 179.8 233.5 223.6 168.8 Energy Unfunded Commitments ($MM) 110.0 108.7 102.9 88.5 120.7 Energy Loans / Total Loans HFI1 (%) 4.0 3.6 4.5 4.2 3.1 Criticized Energy Loans ($MM) 0.0 3.4 13.0 12.7 1.8 Performing Classified Energy Loans ($MM) 27.0 25.7 33.4 22.1 24.2 Non-Performing Classified Energy Loans ($MM) 2.8 3.6 4.9 6.7 13.4 Classified and Criticized Energy Loans ($MM) 29.8 32.7 51.3 41.5 39.4 Unimpaired Energy Reserves ($MM) 6.5 7.3 9.2 9.8 10.0 Energy Reserves / Energy Loans (%) 3.4 4.4 4.3 4.7 6.7 Energy NCOs ($MM) 1.1 1.2 0.2 0.4 1.0 Energy Portfolio Breakdown Q3 2015 Q4 2015 Q1 2016 Q2 2016 Q3 2016 Exploration and Production 20% 19% 13% 10% 13% Field Services 15% 21% 22% 22% 26% Pipeline Construction 25% 23% 15% 15% 21% Services 40% 44% 37% 37% 47% Distribution 25% 25% 37% 38% 21% Transportation 7% 7% 7% 9% 11% Midstream 32% 32% 44% 47% 32% Wholesalers 2% 2% 1% 1% 1% Equipment Rentals 5% 1% 0% 0% 0% Equipment Wholesalers 1% 2% 5% 5% 7% Other 8% 5% 6% 6% 8% Total 100% 100% 100% 100% 100%
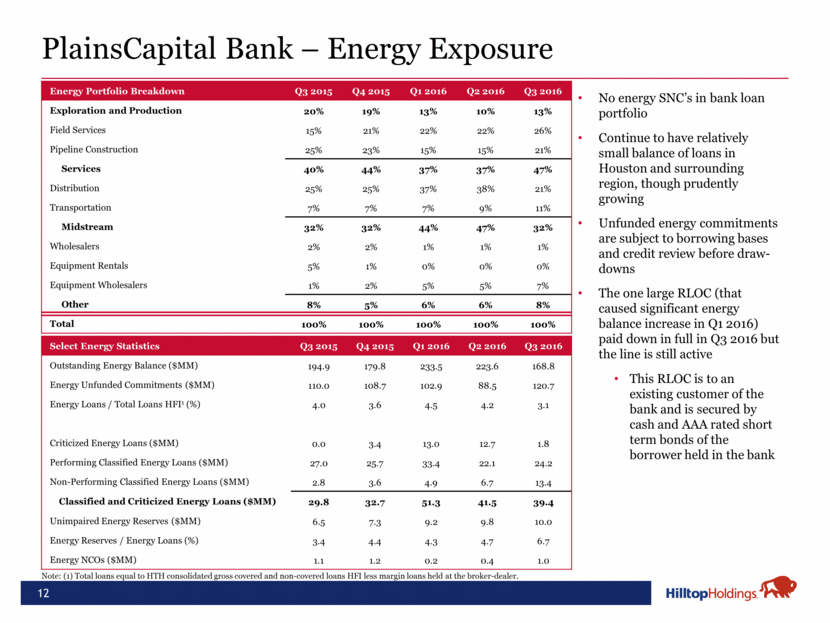
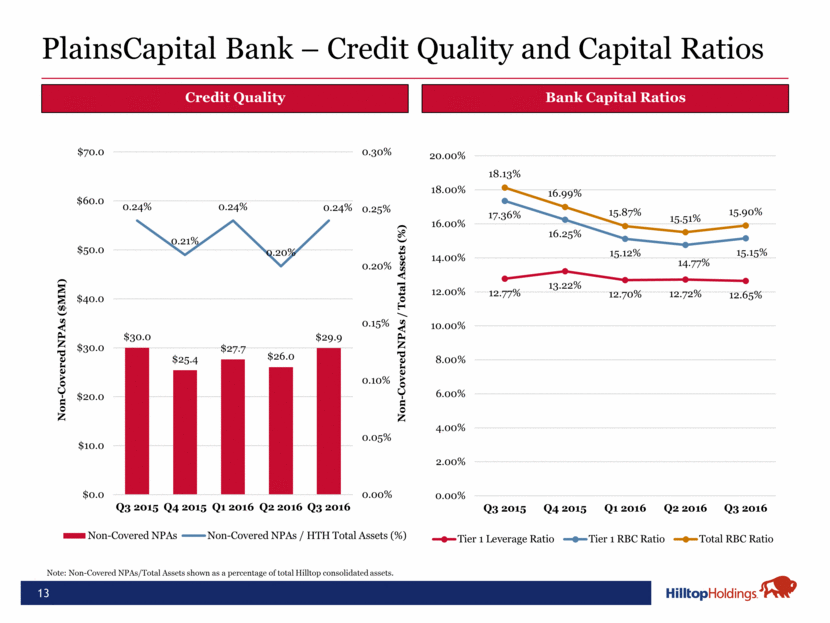
13 PlainsCapital Bank – Credit Quality and Capital Ratios Credit Quality Bank Capital Ratios Note: Non-Covered NPAs/Total Assets shown as a percentage of total Hilltop consolidated assets. 12.77% 13.22% 12.70% 12.72% 12.65% 17.36% 16.25% 15.12% 14.77% 15.15% 18.13% 16.99% 15.87% 15.51% 15.90% 0.00% 2.00% 4.00% 6.00% 8.00% 10.00% 12.00% 14.00% 16.00% 18.00% 20.00% Q3 2015 Q4 2015 Q1 2016 Q2 2016 Q3 2016 Tier 1 Leverage Ratio Tier 1 RBC Ratio Total RBC Ratio $30.0 $25.4 $27.7 $26.0 $29.9 0.24% 0.21% 0.24% 0.20% 0.24% 0.00% 0.05% 0.10% 0.15% 0.20% 0.25% 0.30% $0.0 $10.0 $20.0 $30.0 $40.0 $50.0 $60.0 $70.0 Q3 2015 Q4 2015 Q1 2016 Q2 2016 Q3 2016 Non - Covered NPAs / Total Assets (%) Non - Covered NPAs ($MM) Non-Covered NPAs Non-Covered NPAs / HTH Total Assets (%)
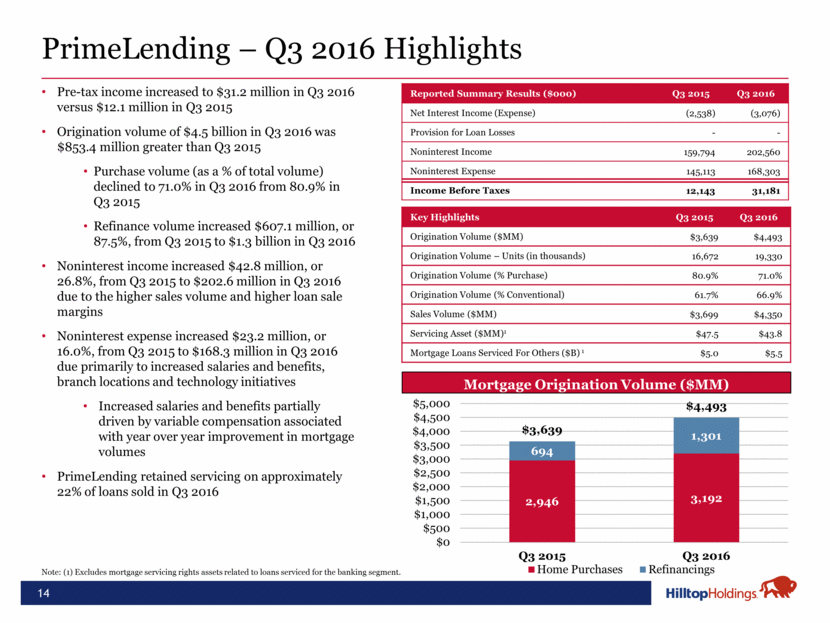
14 PrimeLending – Q3 2016 Highlights Pre-tax income increased to $31.2 million in Q3 2016 versus $12.1 million in Q3 2015 Origination volume of $4.5 billion in Q3 2016 was $853.4 million greater than Q3 2015 Purchase volume (as a % of total volume) declined to 71.0% in Q3 2016 from 80.9% in Q3 2015 Refinance volume increased $607.1 million, or 87.5%, from Q3 2015 to $1.3 billion in Q3 2016 Noninterest income increased $42.8 million, or 26.8%, from Q3 2015 to $202.6 million in Q3 2016 due to the higher sales volume and higher loan sale margins Noninterest expense increased $23.2 million, or 16.0%, from Q3 2015 to $168.3 million in Q3 2016 due primarily to increased salaries and benefits, branch locations and technology initiatives Increased salaries and benefits partially driven by variable compensation associated with year over year improvement in mortgage volumes PrimeLending retained servicing on approximately 22% of loans sold in Q3 2016 Reported Summary Results ($000) Q3 2015 Q3 2016 Net Interest Income (Expense) (2,538) (3,076) Provision for Loan Losses - - Noninterest Income 159,794 202,560 Noninterest Expense 145,113 168,303 Income Before Taxes 12,143 31,181 Key Highlights Q3 2015 Q3 2016 Origination Volume ($MM) $3,639 $4,493 Origination Volume – Units (in thousands) 16,672 19,330 Origination Volume (% Purchase) 80.9% 71.0% Origination Volume (% Conventional) 61.7% 66.9% Sales Volume ($MM) $3,699 $4,350 Servicing Asset ($MM)1 $47.5 $43.8 Mortgage Loans Serviced For Others ($B) 1 $5.0 $5.5 Note: (1) Excludes mortgage servicing rights assets related to loans serviced for the banking segment. Mortgage Origination Volume ($MM) 2,946 3,192 694 1,301 $3,639 $4,493 $0 $500 $1,000 $1,500 $2,000 $2,500 $3,000 $3,500 $4,000 $4,500 $5,000 Q3 2015 Q3 2016 Thousands Home Purchases Refinancings
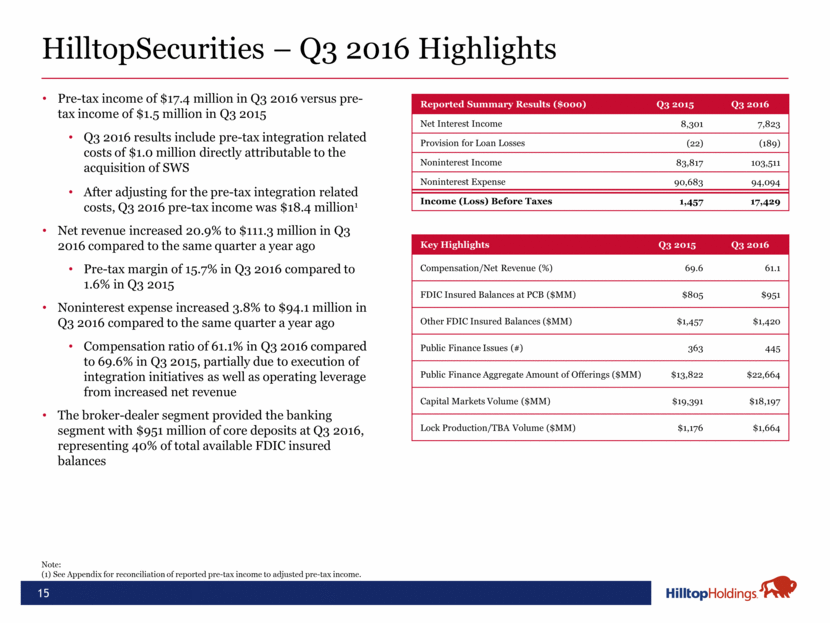
15 HilltopSecurities – Q3 2016 Highlights Pre-tax income of $17.4 million in Q3 2016 versus pre-tax income of $1.5 million in Q3 2015 Q3 2016 results include pre-tax integration related costs of $1.0 million directly attributable to the acquisition of SWS After adjusting for the pre-tax integration related costs, Q3 2016 pre-tax income was $18.4 million1 Net revenue increased 20.9% to $111.3 million in Q3 2016 compared to the same quarter a year ago Pre-tax margin of 15.7% in Q3 2016 compared to 1.6% in Q3 2015 Noninterest expense increased 3.8% to $94.1 million in Q3 2016 compared to the same quarter a year ago Compensation ratio of 61.1% in Q3 2016 compared to 69.6% in Q3 2015, partially due to execution of integration initiatives as well as operating leverage from increased net revenue The broker-dealer segment provided the banking segment with $951 million of core deposits at Q3 2016, representing 40% of total available FDIC insured balances Reported Summary Results ($000) Q3 2015 Q3 2016 Net Interest Income 8,301 7,823 Provision for Loan Losses (22) (189) Noninterest Income 83,817 103,511 Noninterest Expense 90,683 94,094 Income (Loss) Before Taxes 1,457 17,429 Key Highlights Q3 2015 Q3 2016 Compensation/Net Revenue (%) 69.6 61.1 FDIC Insured Balances at PCB ($MM) $805 $951 Other FDIC Insured Balances ($MM) $1,457 $1,420 Public Finance Issues (#) 363 445 Public Finance Aggregate Amount of Offerings ($MM) $13,822 $22,664 Capital Markets Volume ($MM) $19,391 $18,197 Lock Production/TBA Volume ($MM) $1,176 $1,664 Note: (1) See Appendix for reconciliation of reported pre-tax income to adjusted pre-tax income.
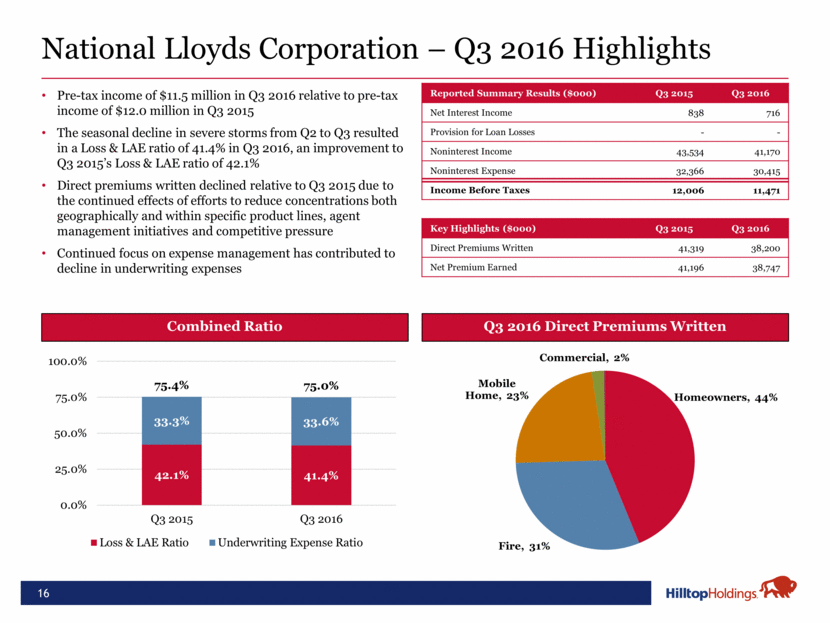
16 National Lloyds Corporation – Q3 2016 Highlights Reported Summary Results ($000) Q3 2015 Q3 2016 Net Interest Income 838 716 Provision for Loan Losses - - Noninterest Income 43,534 41,170 Noninterest Expense 32,366 30,415 Income Before Taxes 12,006 11,471 Combined Ratio Q3 2016 Direct Premiums Written Key Highlights ($000) Q3 2015 Q3 2016 Direct Premiums Written 41,319 38,200 Net Premium Earned 41,196 38,747 Pre-tax income of $11.5 million in Q3 2016 relative to pre-tax income of $12.0 million in Q3 2015 The seasonal decline in severe storms from Q2 to Q3 resulted in a Loss & LAE ratio of 41.4% in Q3 2016, an improvement to Q3 2015’s Loss & LAE ratio of 42.1% Direct premiums written declined relative to Q3 2015 due to the continued effects of efforts to reduce concentrations both geographically and within specific product lines, agent management initiatives and competitive pressure Continued focus on expense management has contributed to decline in underwriting expenses 42.1% 41.4% 33.3% 33.6% 75.4% 75.0% 0.0% 25.0% 50.0% 75.0% 100.0% Q3 2015 Q3 2016 Loss & LAE Ratio Underwriting Expense Ratio Homeowners , 44% Fire , 31% Mobile Home , 23% Commercial , 2%
Questions? 17

Appendix 18
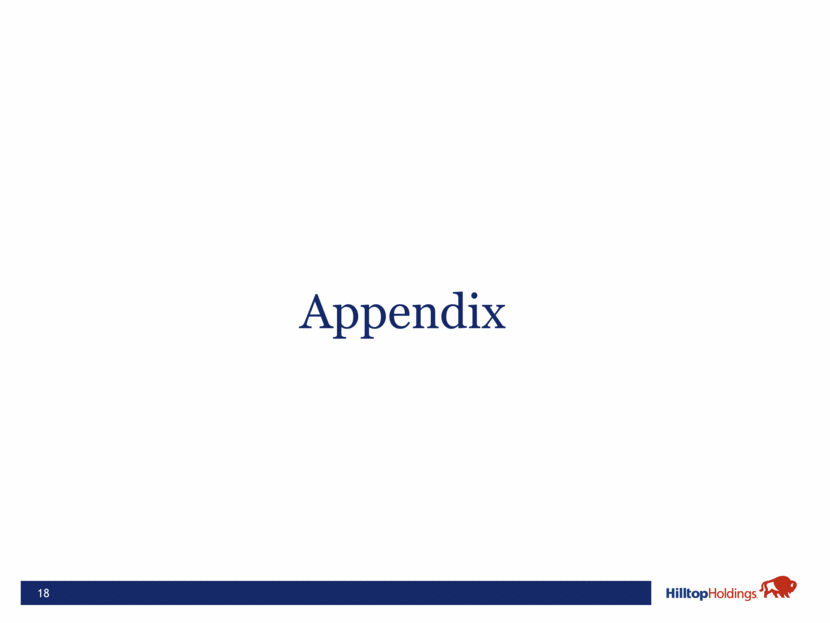
19 Hilltop Non-GAAP to GAAP Reconciliation and Management’s Explanation of Non-GAAP Financial Measures Q3 2016 Reconciliation of Non-GAAP Segment Adjusted Income Before Income Taxes ($MM) Broker-Dealer GAAP Income Before Income Taxes 17.4 Add: Transaction and Integration Costs (pre-tax)1 1.0 Non-GAAP Segment Adjusted Income Before Income Taxes 18.4 Note: (1) Includes various transaction and integration costs associated with the SWS Merger, which closed January 1, 2015. Hilltop presents one measure on pages ten, eleven and fifteen and two measures on pages three, four, five and nine of this presentation that are not measures of financial performance recognized by generally accepted accounting principles in the United States (“GAAP”). These measures are important to investors interested in changes from period to period in income before taxes, net income, net income per diluted share and net interest margin. For companies, such as Hilltop, business combinations can result in purchase accounting adjustments (“PAA”) and the recording of significant amounts of expenses related to those transactions. You should not view this disclosure as a substitute for results determined in accordance with GAAP, and this disclosure is not necessarily comparable to that of other companies that use non-GAAP measures. The following tables reconcile these Hilltop non-GAAP financial measures to the most comparable GAAP financial measures, “segment income before income taxes”, “net income to common shareholders“, “net income per diluted share” and “net interest margin”. Q3 2016 Reconciliation of Non-GAAP Adjusted Net Income ($MM) Diluted EPS ($) GAAP Net Income to HTH Common Shareholders 51.9 0.53 Add: Transaction and Integration Costs1 5.4 0.05 Less: Tax Impact of Transaction and Integration Costs (0.3) (0.00) Non-GAAP Adjusted Net Income 57.0 0.58
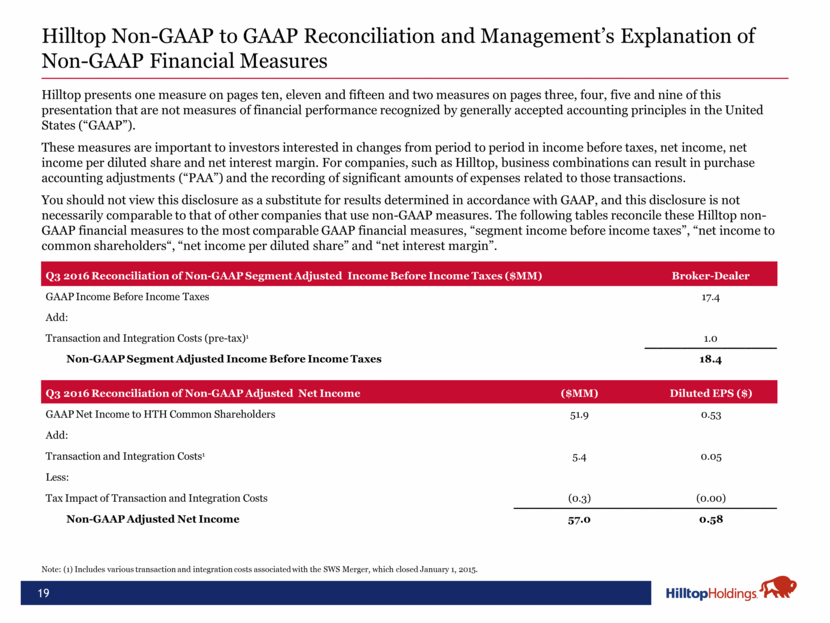
20 Hilltop Non-GAAP to GAAP Reconciliation and Management’s Explanation of Non-GAAP Financial Measures (Continued) Hilltop Consolidated Reconciliation of Non-GAAP Taxable Equivalent NIM (%) Q3 2015 Q2 2016 Q3 2016 NIM 4.18 3.77 3.65 Add: Taxable Equivalent Adjustment1 0.02 0.03 0.02 Non-GAAP Taxable Equivalent NIM 4.20 3.80 3.67 Bank Reconciliation of Non-GAAP Pre-PAA Taxable Equivalent NIM (%) Q3 2015 Q2 2016 Q3 2016 Non-GAAP Taxable Equivalent NIM 4.20 3.80 3.67 Less: Purchase Accounting Adjustment (1.37) (0.72) (0.64) Non-GAAP Pre-PAA Taxable Equivalent NIM 2.83 3.08 3.03 Reconciliation of Non-GAAP Pre-PAA Taxable Equivalent NIM (%) Q3 2015 Q2 2016 Q3 2016 Non-GAAP Taxable Equivalent NIM 5.79 4.87 4.53 Less: Purchase Accounting Adjustment (2.10) (1.04) (0.90) Non-GAAP Pre-PAA Taxable Equivalent NIM 3.69 3.83 3.63 Reconciliation of Non-GAAP Taxable Equivalent NIM (%) Q3 2015 Q2 2016 Q3 2016 NIM 5.77 4.85 4.50 Add: Taxable Equivalent Adjustment1 0.02 0.02 0.03 Non-GAAP Taxable Equivalent NIM 5.79 4.87 4.53 Note: (1) Annualized taxable equivalent adjustments are based on a 35% federal income tax rate.
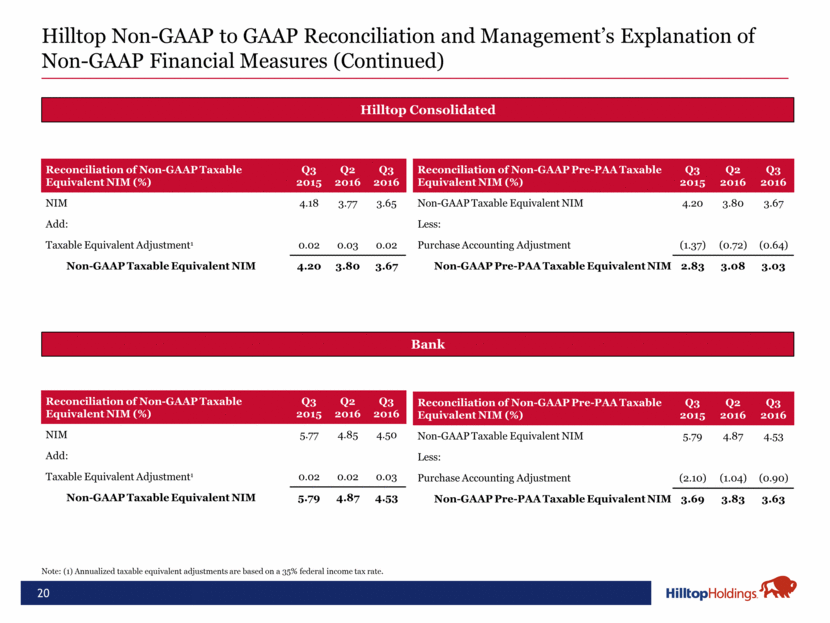
Loan Portfolio by Classification 21 Covered PCI Loans Covered Non-PCI Loans Non-Covered PCI Loans Non-Covered Non-PCI Loans Q3 2016 Total: $55.9 million Q3 2016 Total: $5,618.8 million Q3 2016 Total: $160.3 million Q3 2016 Total: $132.4 million Note: PCI stands for Purchased Credit Impaired loans. Loan classification mix represents consolidated balances at Hilltop and, therefore, eliminate intercompany loans. Broker-dealer loans represent margin loans to customers and correspondents (held at the broker-dealer). Amounts above equal carrying value, after deductions for discount. C&I 30% Real Estate 46% C&D 14% Consumer 1% Broker - dealer 8% C&I 18% Real Estate 75% C&D 7% Consumer 1% C&I 1% Real Estate 96% C&D 3% C&I 2% Real Estate 92% C&D 6%
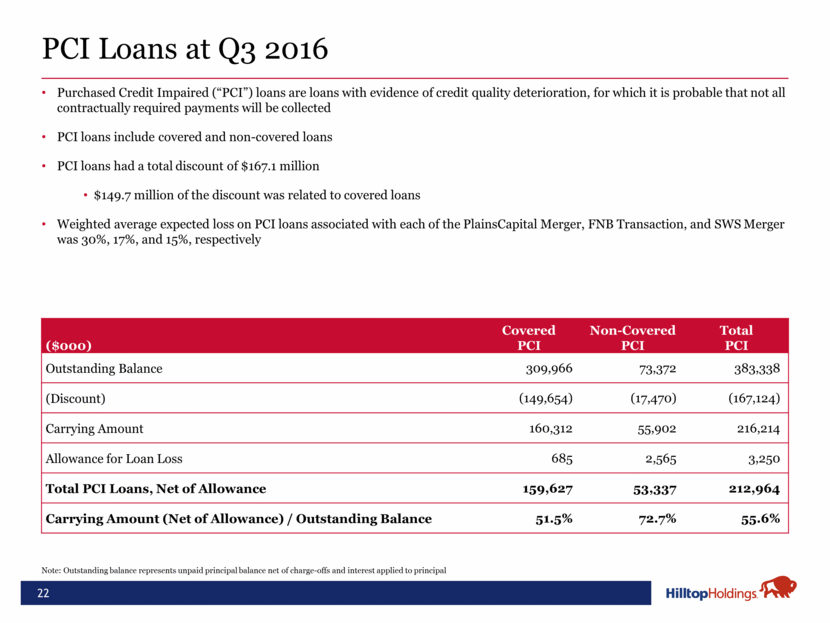
PCI Loans at Q3 2016 22 ($000) Covered PCI Non-Covered PCI Total PCI Outstanding Balance 309,966 73,372 383,338 (Discount) (149,654) (17,470) (167,124) Carrying Amount 160,312 55,902 216,214 Allowance for Loan Loss 685 2,565 3,250 Total PCI Loans, Net of Allowance 159,627 53,337 212,964 Carrying Amount (Net of Allowance) / Outstanding Balance 51.5% 72.7% 55.6% Note: Outstanding balance represents unpaid principal balance net of charge-offs and interest applied to principal Purchased Credit Impaired (“PCI”) loans are loans with evidence of credit quality deterioration, for which it is probable that not all contractually required payments will be collected PCI loans include covered and non-covered loans PCI loans had a total discount of $167.1 million $149.7 million of the discount was related to covered loans Weighted average expected loss on PCI loans associated with each of the PlainsCapital Merger, FNB Transaction, and SWS Merger was 30%, 17%, and 15%, respectively
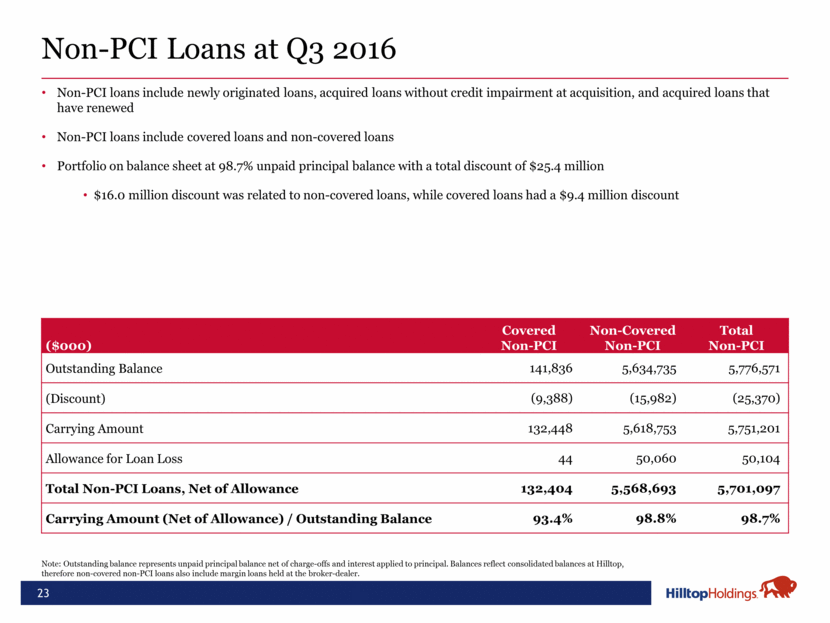
Non-PCI Loans at Q3 2016 23 ($000) Covered Non-PCI Non-Covered Non-PCI Total Non-PCI Outstanding Balance 141,836 5,634,735 5,776,571 (Discount) (9,388) (15,982) (25,370) Carrying Amount 132,448 5,618,753 5,751,201 Allowance for Loan Loss 44 50,060 50,104 Total Non-PCI Loans, Net of Allowance 132,404 5,568,693 5,701,097 Carrying Amount (Net of Allowance) / Outstanding Balance 93.4% 98.8% 98.7% Note: Outstanding balance represents unpaid principal balance net of charge-offs and interest applied to principal. Balances reflect consolidated balances at Hilltop, therefore non-covered non-PCI loans also include margin loans held at the broker-dealer. Non-PCI loans include newly originated loans, acquired loans without credit impairment at acquisition, and acquired loans that have renewed Non-PCI loans include covered loans and non-covered loans Portfolio on balance sheet at 98.7% unpaid principal balance with a total discount of $25.4 million $16.0 million discount was related to non-covered loans, while covered loans had a $9.4 million discount
