Attached files
| file | filename |
|---|---|
| EX-99.1 - EXHIBIT 99.1 - CURTISS WRIGHT CORP | a51447696ex99_1.htm |
| 8-K - CURTISS-WRIGHT CORPORATION 8-K - CURTISS WRIGHT CORP | a51447696.htm |
Exhibit 99.2

1 | October 27, 2016 | © 2016 Curtiss-Wright 3Q 2016 Earnings Conference Call October 27, 2016 NYSE: CW
2 | October 27, 2016 | © 2016 Curtiss-Wright Safe Harbor Statement Please note that the information provided in this presentation is accurate as of the date of the original presentation. The presentation will remain posted on this website from one to twelve months following the initial presentation, but content will not be updated to reflect new information that may become available after the original presentation posting. The presentation contains forward-looking statements including, among other things, management's estimates of future performance, revenue and earnings, our management's growth objectives and our management's ability to produce consistent operating improvements. These forward-looking statements are based on expectations as of the time the statements were made only, and are subject to a number of risks and uncertainties which could cause us to fail to achieve our then-current financial projections and other expectations. This presentation also includes certain non-GAAP financial measures with reconciliations being made available in the earnings release that is posted to our website and furnished with the SEC. We undertake no duty to update this information. More information about potential factors that could affect our business and financial results is included in our filings with the Securities and Exchange Commission, including our Annual Reports on Form 10-K and Quarterly Reports on Form 10-Q, including, among other sections, under the captions, "Risk Factors" and "Management's Discussion and Analysis of Financial Condition and Results of Operations," which is on file with the SEC and available at the SEC's website at www.sec.gov.
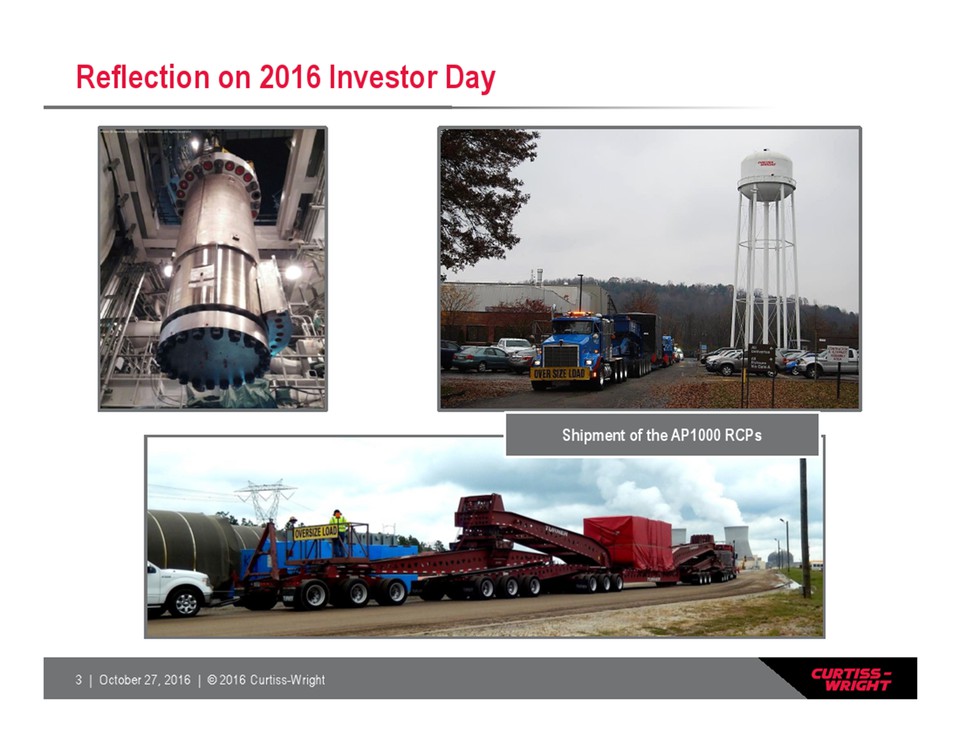
3 | October 27, 2016 | © 2016 Curtiss-Wright Reflection on 2016 Investor Day Shipment of the AP1000 RCPs
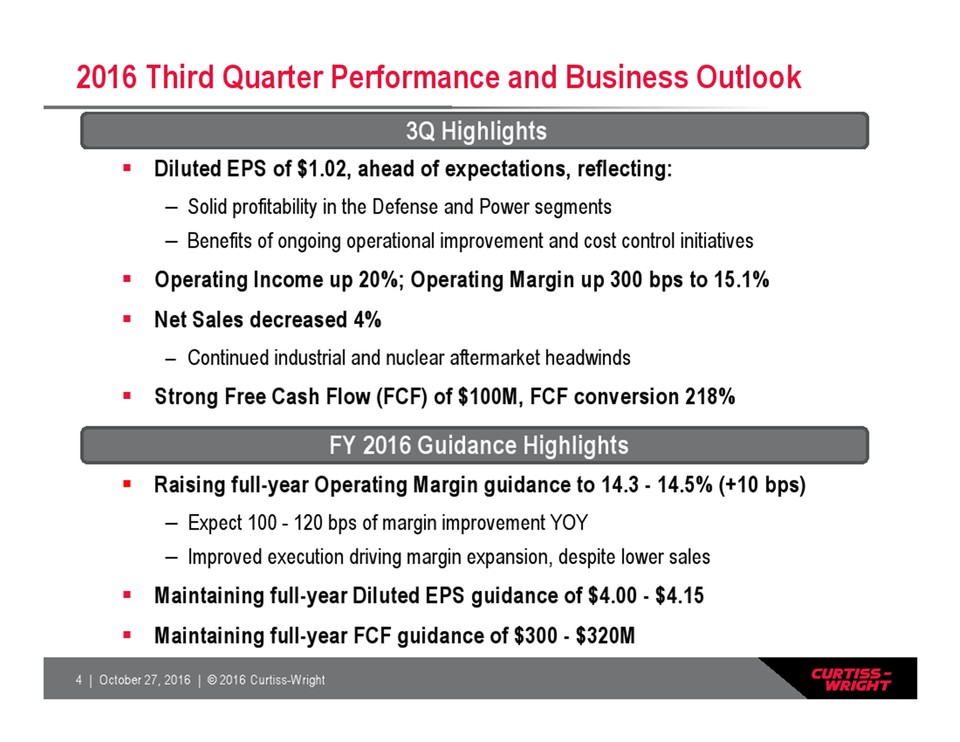
4 | October 27, 2016 | © 2016 Curtiss-Wright 2016 Third Quarter Performance and Business Outlook Diluted EPS of $1.02, ahead of expectations, reflecting: Solid profitability in the Defense and Power segments Benefits of ongoing operational improvement and cost control initiatives Operating Income up 20%; Operating Margin up 300 bps to 15.1% Net Sales decreased 4% Continued industrial and nuclear aftermarket headwinds Strong Free Cash Flow (FCF) of $100M, FCF conversion 218% 3Q Highlights FY 2016 Guidance Highlights Raising full-year Operating Margin guidance to 14.3 - 14.5% (+10 bps) Expect 100 - 120 bps of margin improvement YOY Improved execution driving margin expansion, despite lower sales Maintaining full-year Diluted EPS guidance of $4.00 - $4.15 Maintaining full-year FCF guidance of $300 - $320M
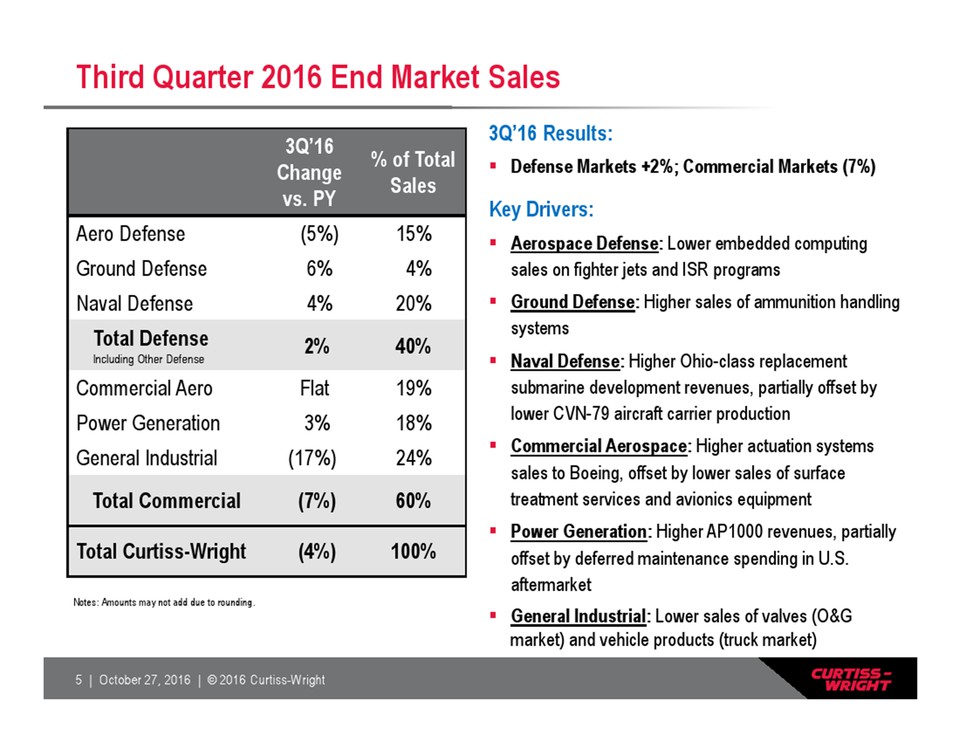
5 | October 27, 2016 | © 2016 Curtiss-Wright Third Quarter 2016 End Market Sales 3Q’16 Results: Defense Markets +2%; Commercial Markets (7%) Key Drivers: Aerospace Defense: Lower embedded computing sales on fighter jets and ISR programs Ground Defense: Higher sales of ammunition handling systems Naval Defense: Higher Ohio-class replacement submarine development revenues, partially offset by lower CVN-79 aircraft carrier production Commercial Aerospace: Higher actuation systems sales to Boeing, offset by lower sales of surface treatment services and avionics equipment Power Generation: Higher AP1000 revenues, partially offset by deferred maintenance spending in U.S. aftermarket General Industrial: Lower sales of valves (O&G market) and vehicle products (truck market) 3Q’16 Change vs. PY % of Total Sales Aero Defense (5%) 15% Ground Defense 6% 4% Naval Defense 4% 20% Total Defense Including Other Defense 2% 40% Commercial Aero Flat 19% Power Generation 3% 18% General Industrial (17%) 24% Total Commercial (7%) 60% Total Curtiss-Wright (4%) 100% Notes: Amounts may not add due to rounding.
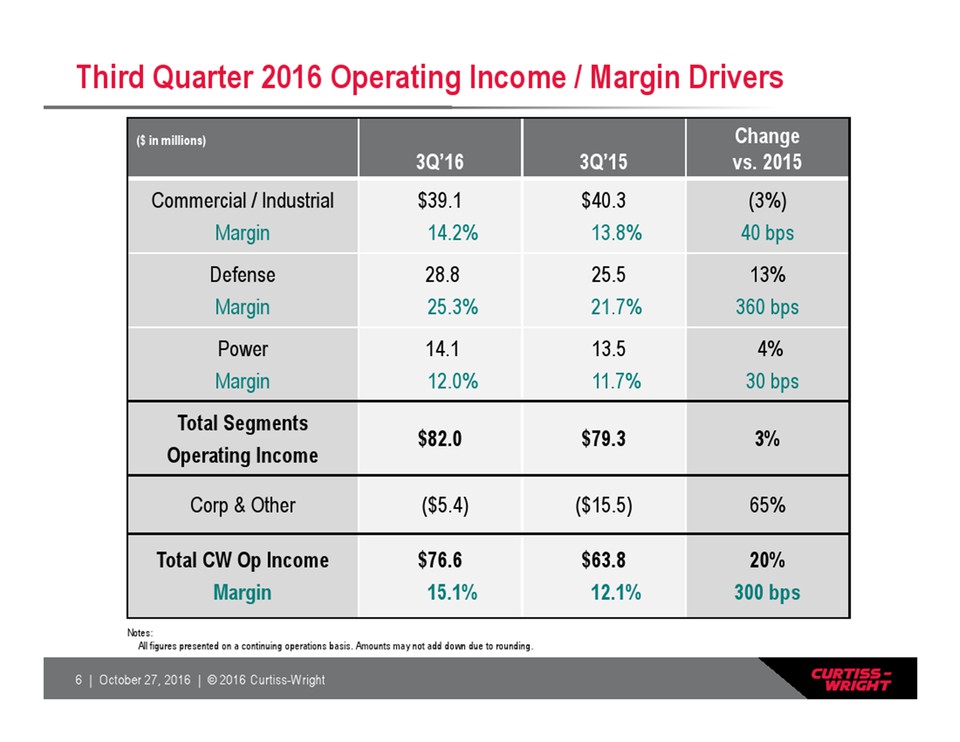
6 | October 27, 2016 | © 2016 Curtiss-Wright Third Quarter 2016 Operating Income / Margin Drivers ($ in millions) 3Q’16 3Q’15 Change vs. 2015 Commercial / Industrial Margin $39.1 14.2% $40.3 13.8% (3%) 40 bps Defense Margin 28.8 25.3% 25.5 21.7% 13% 360 bps Power Margin 14.1 12.0% 13.5 11.7% 4% 30 bps Total Segments Operating Income $82.0 $79.3 3% Corp & Other ($5.4) ($15.5) 65% Total CW Op Income Margin $76.6 15.1% $63.8 12.1% 20% 300 bps Notes: All figures presented on a continuing operations basis. Amounts may not add down due to rounding.
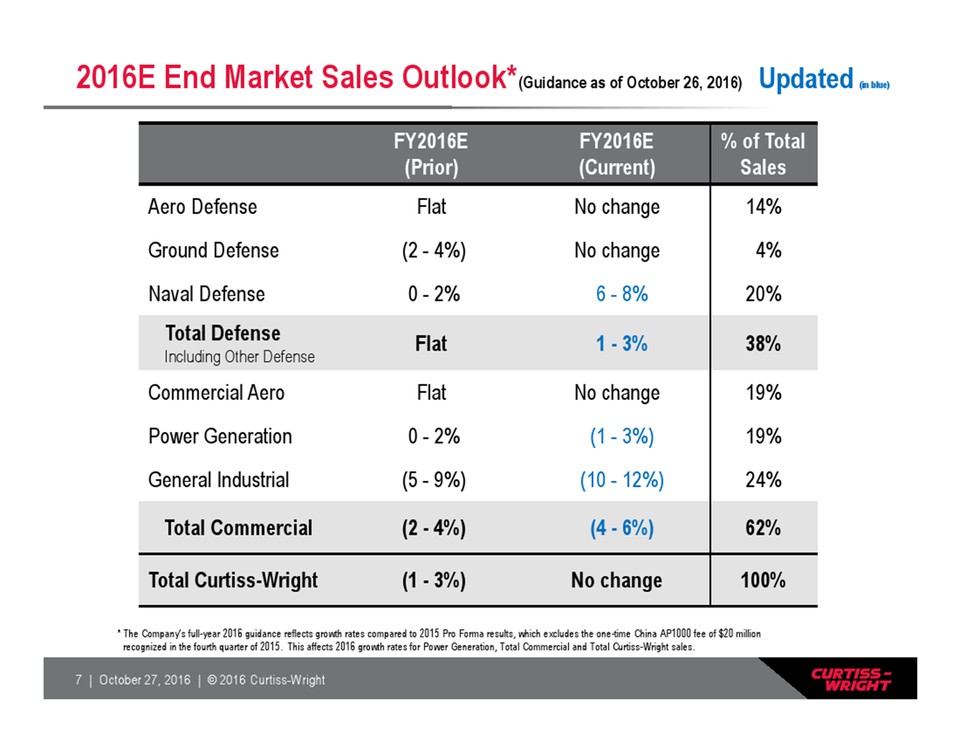
7 | October 27, 2016 | © 2016 Curtiss-Wright 2016E End Market Sales Outlook*(Guidance as of October 26, 2016) Updated (in blue) FY2016E (Prior) FY2016E (Current) % of Total Sales Aero Defense Flat No change 14% Ground Defense (2 - 4%) No change 4% Naval Defense 0 - 2% 6 - 8% 20% Total Defense Including Other Defense Flat 1 - 3% 38% Commercial Aero Flat No change 19% Power Generation 0 - 2% (1 - 3%) 19% General Industrial (5 - 9%) (10 - 12%) 24% Total Commercial (2 - 4%) (4 - 6%) 62% Total Curtiss-Wright (1 - 3%) No change 100% * The Company’s full-year 2016 guidance reflects growth rates compared to 2015 Pro Forma results, which excludes the one-time China AP1000 fee of $20 million recognized in the fourth quarter of 2015. This affects 2016 growth rates for Power Generation, Total Commercial and Total Curtiss-Wright sales.
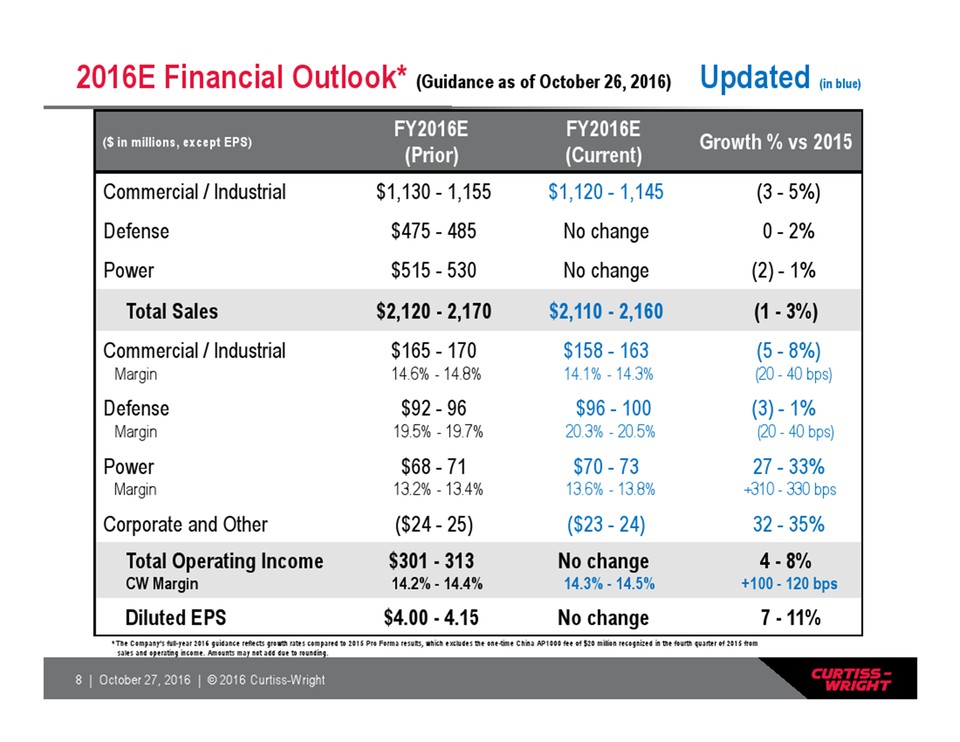
8 | October 27, 2016 | © 2016 Curtiss-Wright ($ in millions, except EPS) FY2016E (Prior) FY2016E (Current) Growth % vs 2015 Commercial / Industrial $1,130 - 1,155 $1,120 - 1,145 (3 - 5%) Defense $475 - 485 No change 0 - 2% Power $515 - 530 No change (2) - 1% Total Sales $2,120 - 2,170 $2,110 - 2,160 (1 - 3%) Commercial / Industrial Margin $165 – 170 14.6% - 14.8% $158 – 163 14.1% - 14.3% (5 - 8%) (20 - 40 bps) Defense Margin $92 – 96 19.5% - 19.7% $96 – 100 20.3% - 20.5% (3) - 1% (20 - 40 bps) Power Margin $68 – 71 13.2% - 13.4% $70 – 73 13.6% - 13.8% 27 - 33% +310 - 330 bps Corporate and Other ($24 - 25) ($23 - 24) 32 - 35% Total Operating Income CW Margin $301 – 313 14.2% - 14.4% No change 14.3% - 14.5% 4 - 8% +100 - 120 bps Diluted EPS $4.00 - 4.15 No change 7 - 11% 2016E Financial Outlook* (Guidance as of October 26, 2016) Updated (in blue) * The Company’s full-year 2016 guidance reflects growth rates compared to 2015 Pro Forma results, which excludes the one-time China AP1000 fee of $20 million recognized in the fourth quarter of 2015 from sales and operating income. Amounts may not add due to rounding.
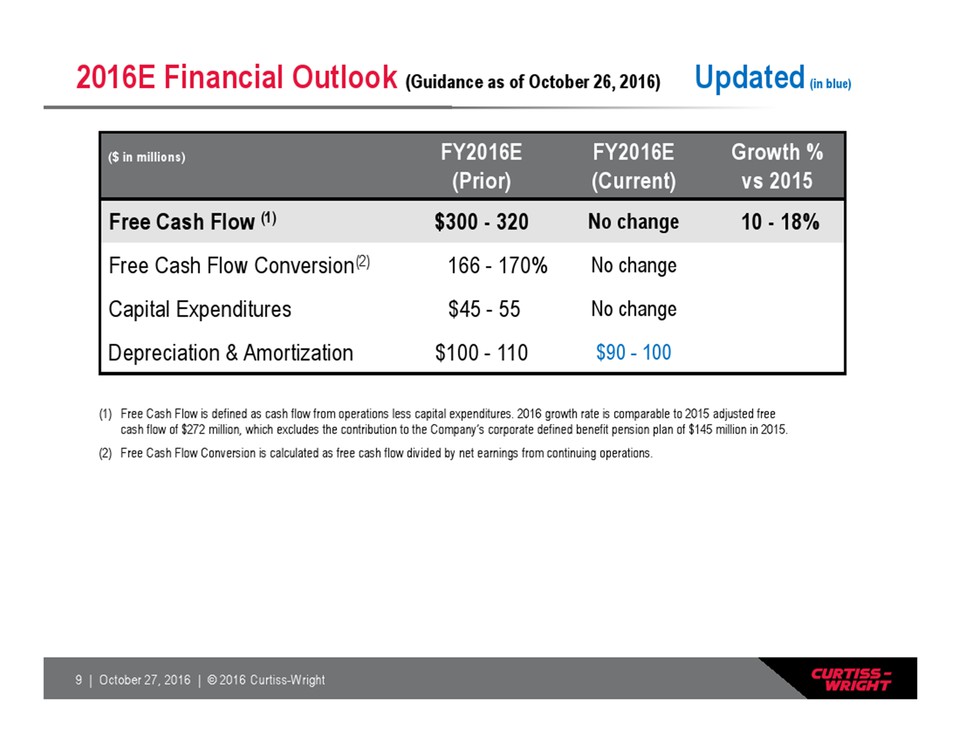
9 | October 27, 2016 | © 2016 Curtiss-Wright 2016E Financial Outlook (Guidance as of October 26, 2016) Updated(in blue) ($ in millions) FY2016E (Prior) FY2016E (Current) Growth % vs 2015 Free Cash Flow (1) $300 - 320 No change 10 - 18% Free Cash Flow Conversion(2) 166 - 170% No change Capital Expenditures $45 - 55 No change Depreciation & Amortization $100 - 110 $90 – 100 (1) Free Cash Flow is defined as cash flow from operations less capital expenditures. 2016 growth rate is comparable to 2015 adjusted free cash flow of $272 million, which excludes the contribution to the Company’s corporate defined benefit pension plan of $145 million in 2015. (2) Free Cash Flow Conversion is calculated as free cash flow divided by net earnings from continuing operations.
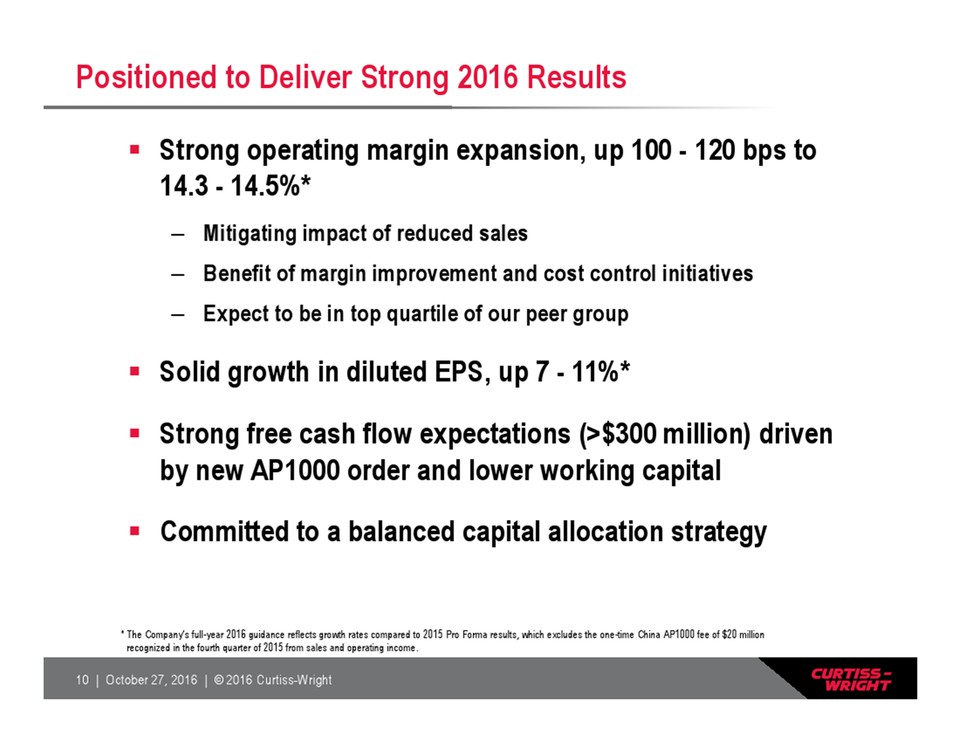
10 | October 27, 2016 | © 2016 Curtiss-Wright Positioned to Deliver Strong 2016 Results Strong operating margin expansion, up 100 - 120 bps to 14.3 - 14.5%* – Mitigating impact of reduced sales – Benefit of margin improvement and cost control initiatives – Expect to be in top quartile of our peer group Solid growth in diluted EPS, up 7 - 11%* Strong free cash flow expectations (>$300 million) driven by new AP1000 order and lower working capital Committed to a balanced capital allocation strategy * The Company’s full-year 2016 guidance reflects growth rates compared to 2015 Pro Forma results, which excludes the one-time China AP1000 fee of $20 million recognized in the fourth quarter of 2015 from sales and operating income.
11 | October 27, 2016 | © 2016 Curtiss-Wright Appendix
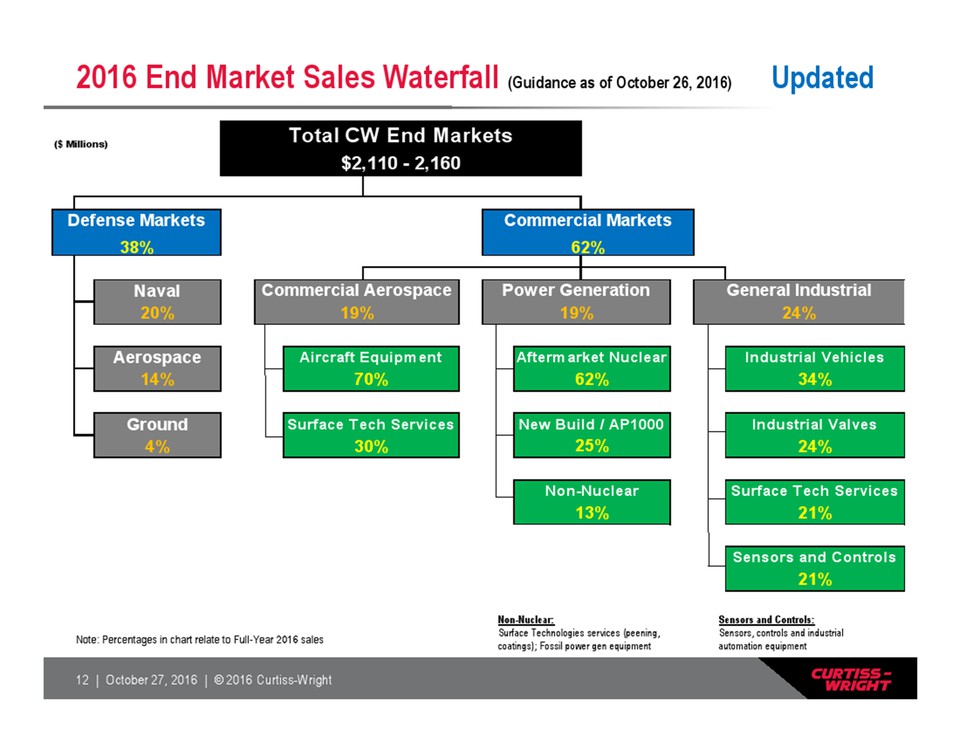
12 | October 27, 2016 | © 2016 Curtiss-Wright 2016 End Market Sales Waterfall (Guidance as of October 26, 2016) Updated Sensors and Controls: Sensors, controls and industrial automation equipment Non-Nuclear: Surface Technologies services (peening, Note: Percentages in chart relate to Full-Year 2016 sales coatings); Fossil power gen equipment ($ Millions) Naval Aerospace Industrial Vehicles Ground Industrial Valves Surface Tech Services Sensors and Controls 13% Commercial Markets Aftermarket Nuclear 62% New Build / AP1000 General Industrial 19% 24% 62% 25% Non-Nuclear 21% 21% 24% 14% Power Generation 4% 20% Aircraft Equipment 70% Surface Tech Services 30% 19% 38% Defense Markets Total CW End Markets $2,110 - 2,160 34% Commercial Aerospace
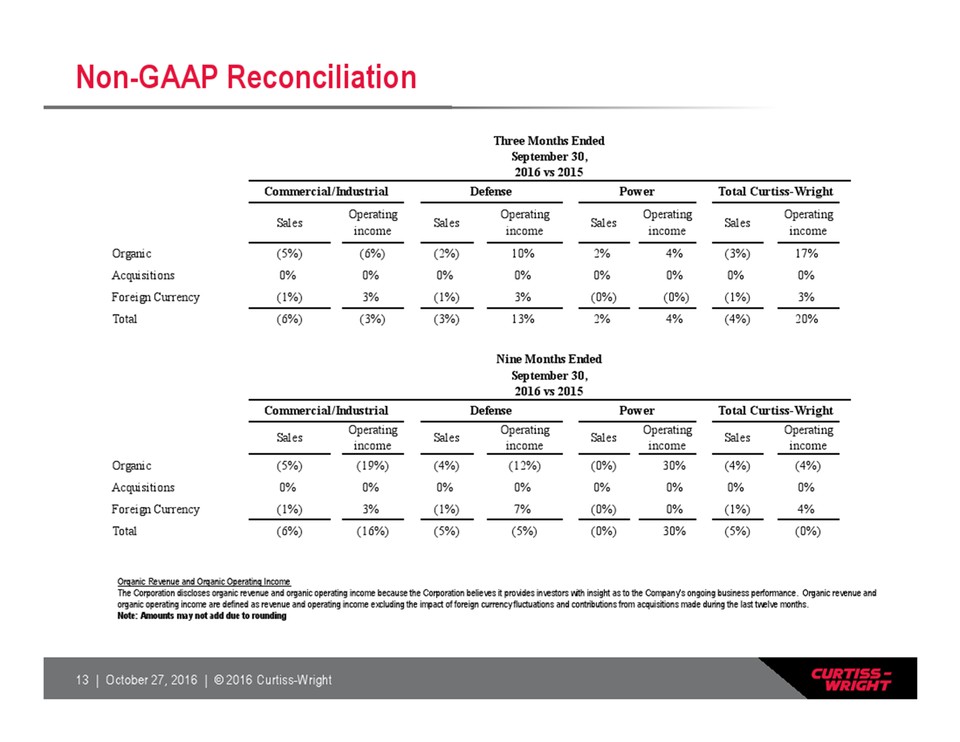
13 | October 27, 2016 | © 2016 Curtiss-Wright Non-GAAP Reconciliation Organic Revenue and Organic Operating Income The Corporation discloses organic revenue and organic operating income because the Corporation believes it provides investors with insight as to the Company’s ongoing business performance. Organic revenue and organic operating income are defined as revenue and operating income excluding the impact of foreign currency fluctuations and contributions from acquisitions made during the last twelve months. Note: Amounts may not add due to rounding Sales Operating income Sales Operating income Sales Operating income Sales Operating income Organic (5%) (6%) (2%) 10% 2% 4% (3%) 17% Acquisitions 0% 0% 0% 0% 0% 0% 0% 0% Foreign Currency (1%) 3% (1%) 3% (0%) (0%) (1%) 3% Total (6%) (3%) (3%) 13% 2% 4% (4%) 20% Sales Operating income Sales Operating income Sales Operating income Sales Operating income Organic (5%) (19%) (4%) (12%) (0%) 30% (4%) (4%) Acquisitions 0% 0% 0% 0% 0% 0% 0% 0% Foreign Currency (1%) 3% (1%) 7% (0%) 0% (1%) 4% Total (6%) (16%) (5%) (5%) (0%) 30% (5%) (0%) Nine Months Ended 2016 vs 2015 Commercial/Industrial Defense Power Total Curtiss-Wright September 30, Three Months Ended 2016 vs 2015 Commercial/Industrial Defense Power Total Curtiss-Wright September 30,