Attached files
| file | filename |
|---|---|
| 8-K - 8-K - CMS ENERGY CORP | d280043d8k.htm |
Exhibit 99.1

CMS ENERGY
Exhibit 99.1
CMS LISTED NYSE
Third Quarter 2016 Results & Outlook October 27, 2016
Jackson Generating Station Ludington Pumped Storage Cross Winds ®Energy Park
Among lowest
acquisition cost ever Fourth largest in the world #2 in renewable sales in the Great Lakes area
CMS ENERGY
This presentation is made as of the
date hereof and contains “forward-looking statements” as defined in Rule 3b-6 of the
Securities Exchange Act of 1934, Rule 175 of the Securities Act of
1933, and relevant legal decisions. The forward-looking statements are subject to risks and uncertainties. All forward-looking statements should be considered in the context of the risk and other factors detailed from time to time in CMS
Energy’s and Consumers Energy’s Securities and Exchange Commission filings. Forward-looking statements should be read in conjunction with “FORWARD-LOOKING STATEMENTS AND
INFORMATION” and “RISK FACTORS” sections of CMS Energy’s and Consumers Energy’s Form 10-K for the year ended
December 31, 2015 and as updated in subsequent 10-Qs. CMS Energy’s and Consumers Energy’s “FORWARD-LOOKING
STATEMENTS AND INFORMATION” and “RISK FACTORS” sections are incorporated herein by reference and discuss important factors that could cause CMS Energy’s and
Consumers Energy’s results to differ materially from those anticipated in such statements. CMS Energy and Consumers Energy undertake no obligation to update any of the information presented herein to reflect facts, events or circumstances
after the date hereof.
The presentation also includes non-GAAP measures when describing CMS Energy’s results of operations and financial performance. A
reconciliation of each of these measures to the most directly comparable GAAP measure is included in the appendix and posted on our website at www.cmsenergy.com.
CMS Energy provides historical financial results on both a reported (GAAP) and adjusted (non-GAAP) basis and provides forward-looking guidance on an adjusted
basis. Adjustments could include items such as discontinued operations, asset sales, impairments, restructuring costs, regulatory items from prior years, or other items. Management views adjusted earnings as a key measure of the company’s
present operating financial performance and uses adjusted earnings for external communications with analysts and investors. Internally, the company uses adjusted earnings to measure and assess performance. Because the company is not able to estimate
the impact of specific line items, which have the potential to significantly impact, favorably or unfavorably, the company’s reported earnings in future periods, the company is not providing reported earnings guidance nor is it providing a
reconciliation for the comparable future period earnings. The adjusted earnings should be considered supplemental information to assist in fully understanding our business results, rather than as a substitute for the reported earnings.
Investors and others should note that CMS Energy routinely posts important information on its website and considers the Investor Relations section,
www.cmsenergy.com/investor-relations, a channel of distribution.
1
Agenda CMS ENERGY
Overview Patti Poppe
Earnings Update President & CEO
The Consumers Energy Way
Unique Model
Financial Results & Outlook Tom Webb
Third Quarter; Full Year Executive VP & CFO
Customer Reinvestment
Sensitivities and Targets
2
EPSa Adjusted Results and Guidance.
CMS ENERGY
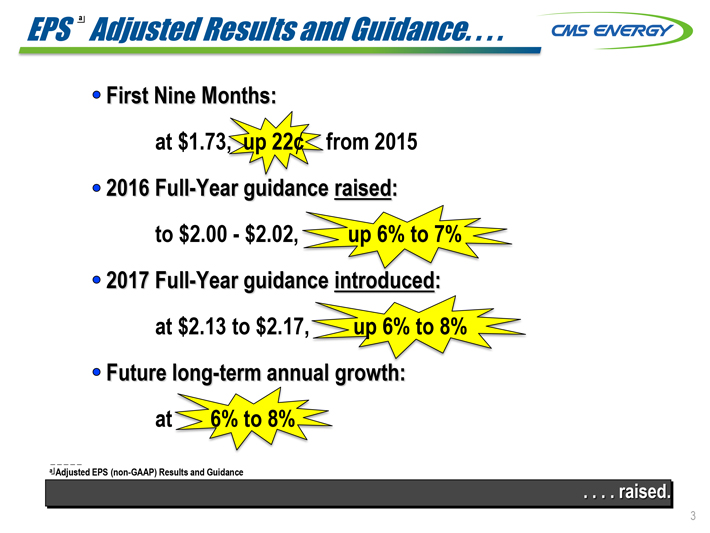
First Nine Months:
• at $1.73, up 22¢ from 2015
2016 Full-Year guidance raised:
• to $2.00 - $2.02, up 6% to 7%
2017 Full-Year guidance introduced:
• at $2.13 to $2.17, up 6% to 8%
Future long-term annual growth:
• at 6% to 8%
a Adjusted EPS (non-GAAP) Results and Guidance
. . . . raised.
3
The Consumers Energy Way CMS ENERGY
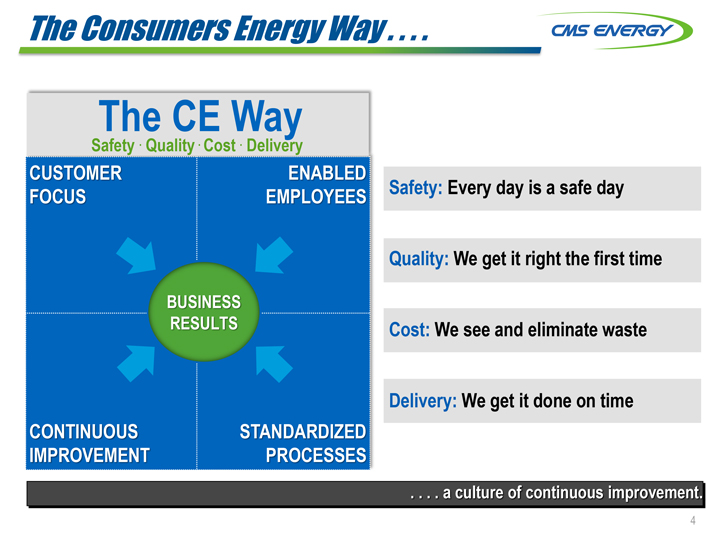
The CE Way
Safety . Quality . Cost . Delivery
CUSTOMER FOCUS
ENABLED EMPLOYEES
BUSINESS RESULTS
CONTINUOUS IMPROVEMENT
STANDARDIZED PROCESSES
Safety: Every day is a safe day
Quality: We get it right the first time
Cost: We see and eliminate waste
Delivery: We get it done on time
. . . . a culture of continuous improvement.
4
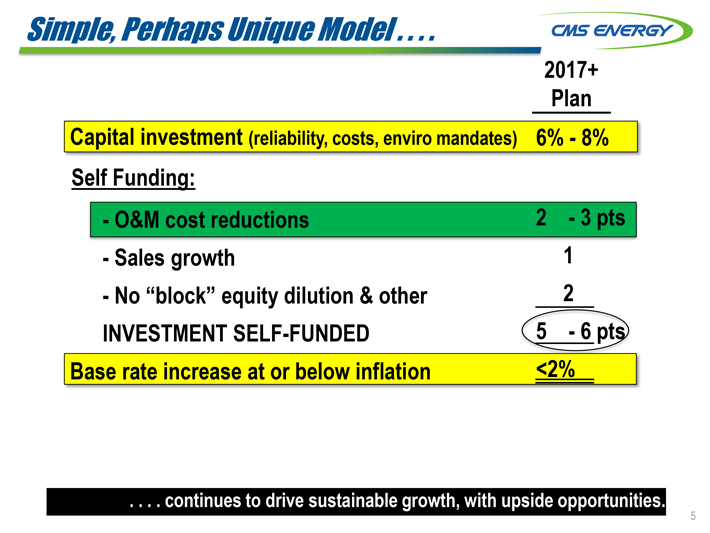
Simple, Perhaps Unique Model . . . .
CMS ENERGY
2017+
Plan
Capital investment (reliability, costs, enviro mandates)
6% - 8%
Self Funding:
- O&M cost reductions
2 - 3 pts
- Sales growth
1
- No “block” equity dilution & other
2
INVESTMENT SELF-FUNDED
5 - 6 pts
Base rate increase at or below inflation
<2%
. . . . continues to drive sustainable growth, with upside opportunities.
5
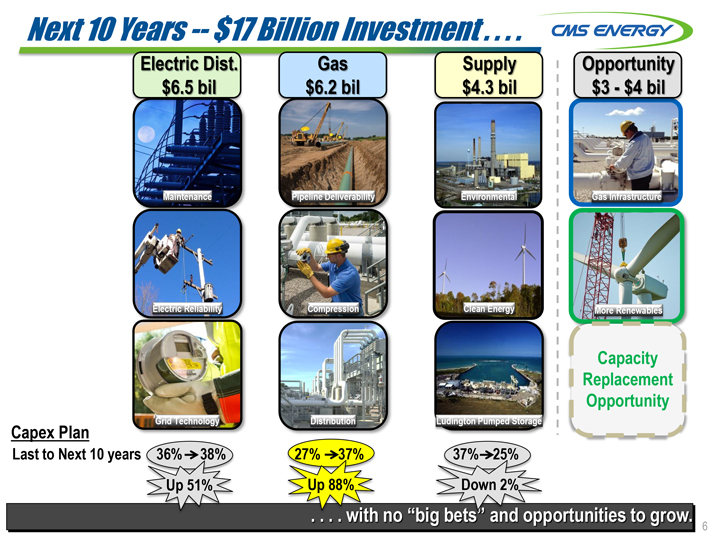
Next 10 Years -- $17 Billion Investment . . . .
CMS ENERGY
Electric Dist.
Gas
Supply
Opportunity
$6.5 bil
$6.2 bil
$4.3 bil
$3 - $4 bil
Maintenance
Pipeline Deliverability
Environmental
Gas Infrastructure
Electric Reliability
Compression
Clean Energy
More Renewables
Capacity
Replacement Opportunity
Grid Technology
Distribution
Ludington Pumped Storage
Capex Plan
Last to Next 10 years
36% 38%
27% 37%
37% 25%
Up 51%
Up 88%
Down 2%
….with no “big bets” and opportunities to grow.
6
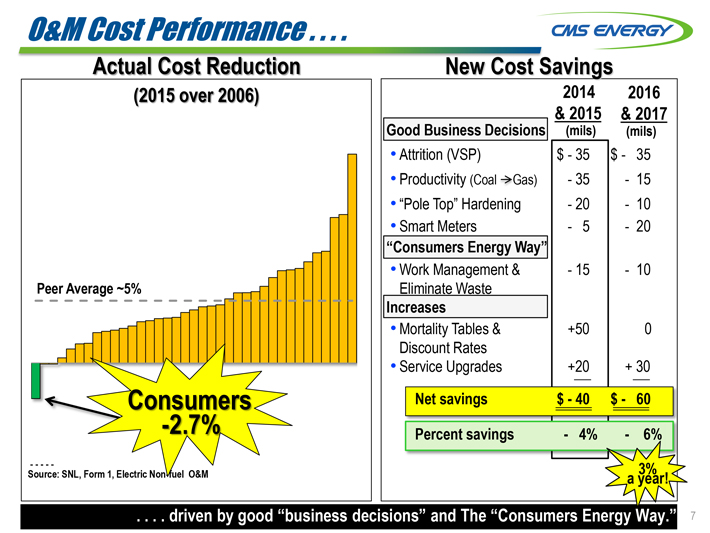
O&M Cost Performance . . . .
CMS ENERGY
Actual Cost Reduction
(2015 over 2006)
Peer Average ~5%
Consumers
-2.7%
Source: SNL, Form 1, Electric Non-fuel O&M
New Cost Savings
2014 & 2015
2016 & 2017
Good Business Decisions
(mils)
(mils)
• Attrition (VSP)
$ - 35
$ - 35
• Productivity (Coal Gas)
- 35
- 15
• “Pole Top” Hardening
- 20
- 10
• Smart Meters
- 5
- 20
“Consumers Energy Way”
• Work Management & Eliminate Waste
- 15
- 10
Increases
• Mortality Tables & Discount Rates
+50
0
• Service Upgrades
+20
+ 30
Net savings
$ - 40
$ - 60
Percent savings
- 4%
- 6%
3%
a year!
. . . . driven by good “business decisions” and The
“Consumers Energy Way.”
7
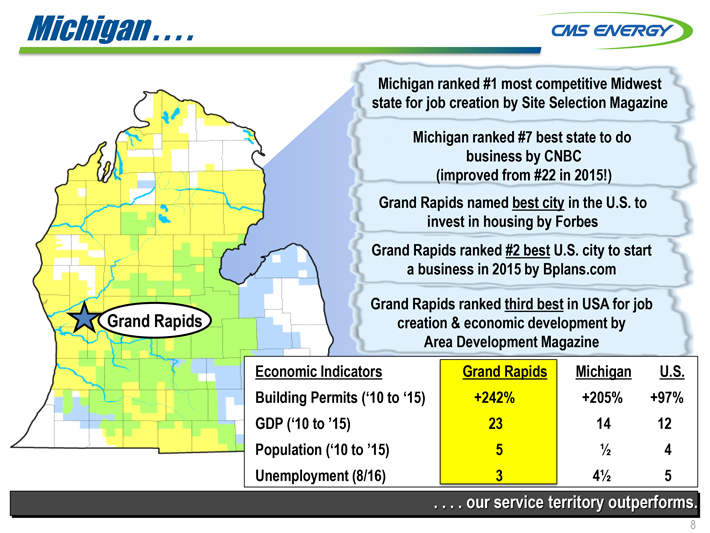
| Michigan. . . . | CMS ENERGY |
Grand Rapids
Michigan ranked #1 most competitive
Midwest state for job creation by Site Selection Magazine
Michigan ranked #7 best state to do business by CNBC
(improved from #22 in 2015!)
Grand Rapids named best city in the U.S. to invest in housing by
Forbes
Grand Rapids ranked #2 best U.S. city to start a business in 2015 by Bplans.com
Grand Rapids ranked third best in USA for job creation & economic development by Area Development Magazine
| Economic Indicators | Grand Rapids |
Michigan | U.S. | |||
| Building Permits (‘10 to ‘15) | +242% | +205% | +97% | |||
| GDP (‘10 to ’15) | 23 | 14 | 12 | |||
| Population (‘10 to ’15) | 5 | 1⁄2 | 4 | |||
| Unemployment (8/16) | 3 | 4 1⁄2 | 5 |
. . . . our service territory outperforms.
8
| Fourth Quarter Outlook . . . . | CMS ENERGY |
Maximize customer reinvestments
Deliver high end of
EPS range
Constructive partnerships
Performance is Power
. . . . focus remains on customers AND investors.
9
2016 Nine Months Adjusted EPS a . . . .
CMS ENERGY
Results
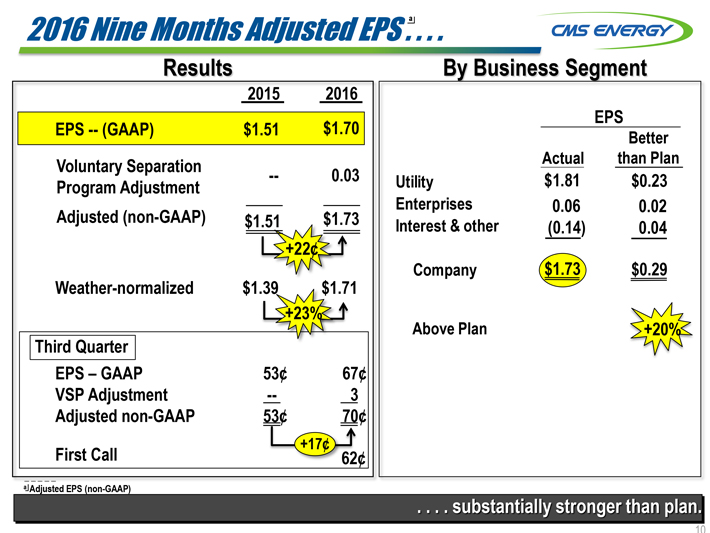
2015
2016
EPS -- (GAAP)
$1.51
$1.70
Voluntary Separation
--
0.03
Program Adjustment
Adjusted (non-GAAP)
$1.51
$1.73
+22¢
Weather-normalized
$1.39
$1.71
+23%
Third Quarter
EPS – GAAP
53¢
67¢
VSP Adjustment
--
3
Adjusted non-GAAP
53¢
70¢
First Call
+17¢
62¢
a Adjusted EPS (non-GAAP)
By Business Segment
EPS
Better
Actual
than Plan
Utility
$1.81
$0.23
Enterprises
0.06
0.02
Interest & other
(0.14)
0.04
Company
$1.73
$0.29
Above Plan
+20%
. . . . substantially stronger than plan.
10
| 2016 EPS a . . . . | CMS ENERGY |
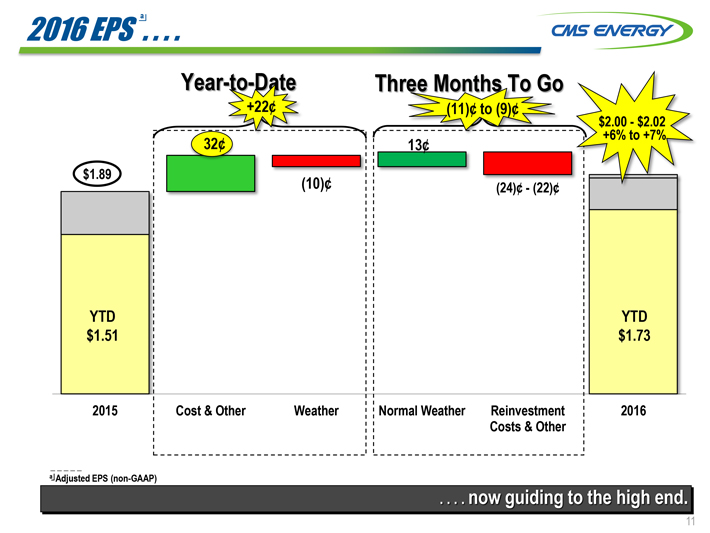
| Year- to- Date |
Three Months To Go |
|||||||||
| +22¢ | (11)¢ to (9)¢ | |||||||||
| $2.00 - $2.02 | ||||||||||
| 32¢ | 13¢ | +6% to +7% | ||||||||
| $1.89 | (10)¢ | (24)¢ - (22)¢ | ||||||||
| YTD | YTD | |||||||||
| $1.51 | $1.73 | |||||||||
| 2015 | Cost & Other |
Weather | Normal Weather |
Reinvestment | 2016 | |||||
| Costs & Other |
a Adjusted EPS (non-GAAP)
. . . . now guiding to the
high end.
11
| 2016 EPS Outlook . . . . | CMS ENERGY |
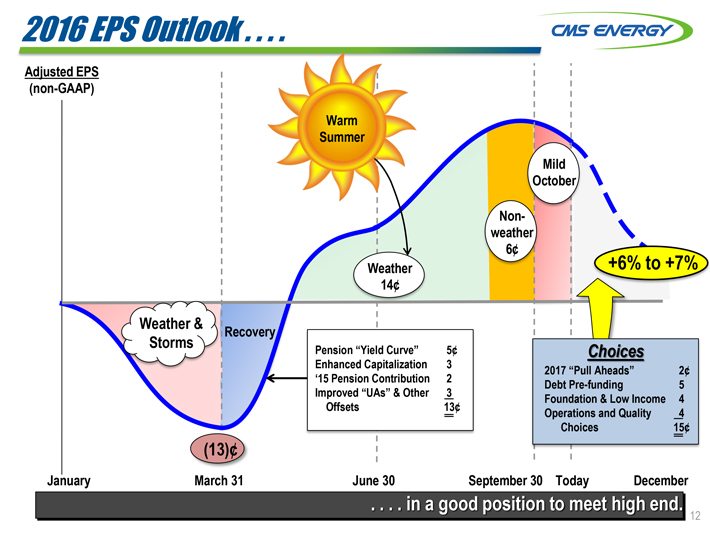
| Adjusted EPS | ||||||||||||||||
| (non-GAAP) | ||||||||||||||||
| Warm | ||||||||||||||||
| Summer | ||||||||||||||||
| Mild | ||||||||||||||||
| October | ||||||||||||||||
| Non- | ||||||||||||||||
| weather | ||||||||||||||||
| 6¢ | ||||||||||||||||
| Weather | +6% to +7% | |||||||||||||||
| 14¢ | ||||||||||||||||
| Weather & |
Recovery | |||||||||||||||
| Storms | Pension “Yield Curve” |
5¢ | Choices | |||||||||||||
| Enhanced Capitalization |
3 | 2017 “Pull Aheads” |
2¢ | |||||||||||||
| ‘15 Pension Contribution |
2 | Debt Pre- funding |
5 | |||||||||||||
| Improved “UAs” & Other |
3 | Foundation & Low Income |
4 | |||||||||||||
| Offsets | 13¢ | Operations and Quality |
4 | |||||||||||||
| Choices | 15¢ | |||||||||||||||
| (13)¢ | ||||||||||||||||
| January | March 31 | June 30 | September 30 | Today | December |
. . . . in a good position to meet high end.
12
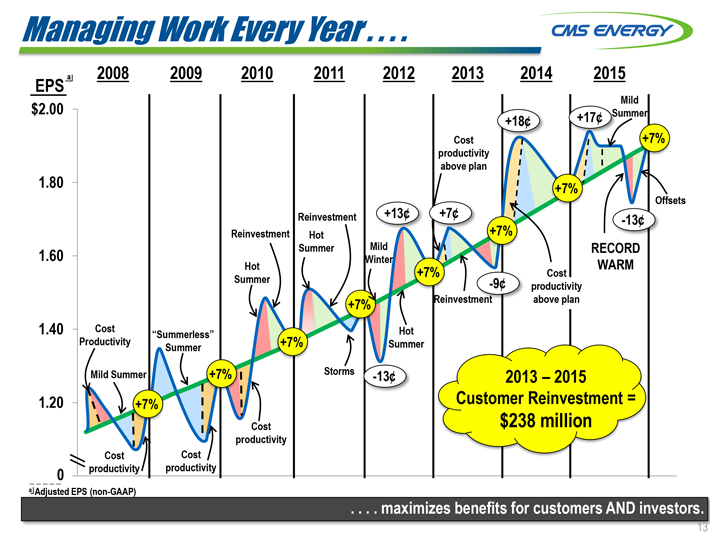
Managing Work Every Year . . . .
CMS ENERGY
a
2008
2009
2010
2011
2012
2013
2014
2015
EPS
Mild
$2.00
Summer
+18¢
+17¢
Cost
+7%
productivity
above plan
1.80
+7%
Offsets
Reinvestment
+13¢
+7¢
-13¢
Reinvestment
Hot
+7%
1.60
Summer
Winter Mild
RECORD
Hot
WARM
+7%
Cost
Summer
-9¢
productivity
+7%
Reinvestment
above plan
1.40
Cost
“Summerless”
Hot
Productivity
Summer
+7%
Summer
Mild Summer
+7%
Storms
-13¢
2013 – 2015
1.20
+7%
Customer Reinvestment =
Cost
$238 million
productivity
Cost
Cost
0
productivity
productivity
a Adjusted EPS (non-GAAP)
. . . . maximizes benefits for customers AND investors.
13
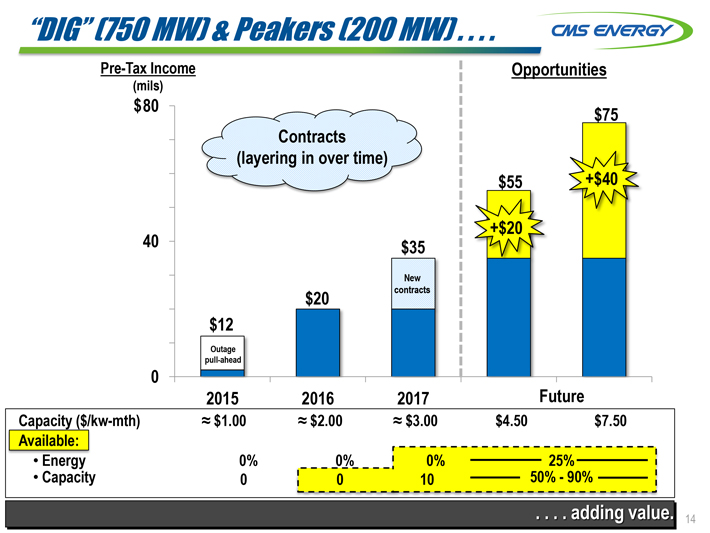
| “DIG” (750 MW) & Peakers (200 MW) | CMS ENERGY |
| Pre-Tax Income | Opportunities | |||||||||
| (mils) | ||||||||||
| $80 | $75 | |||||||||
| Contracts | ||||||||||
| (layering in over time) |
||||||||||
| $55 | +$40 | |||||||||
| +$20 | ||||||||||
| 40 | $35 | |||||||||
| New | ||||||||||
| $20 | contracts | |||||||||
| $12 | ||||||||||
| Outage | ||||||||||
| pull-ahead | ||||||||||
| 0 | ||||||||||
| 2015 | 2016 | 2017 | Future |
| Capacity ($/kw-mth) | $1.00 | $2.00 | $3.00 | $4.50 | $7.50 | |||||
| Available: | ||||||||||
| • Energy | 0% | 0% | 0% | 25% | ||||||
| • Capacity | 0 | 0 | 10 | 50% - 90% |
. . . . adding value.
14
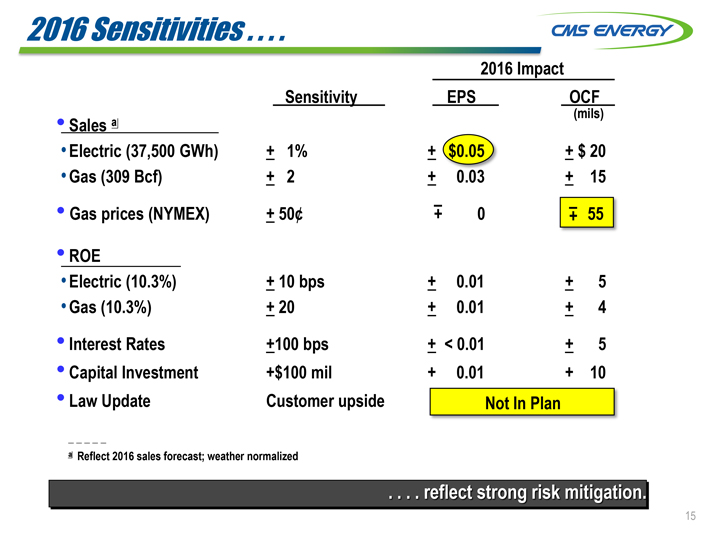
| 2016 Sensitivities | CMS ENERGY |
| 2016 | Impact | |||||
| Sensitivity | EPS | OCF | ||||
| • Sales a | (mils) | |||||
| • Electric (37,500 GWh) | ± 1% | ± $0.05 | ± $ 20 | |||
| • Gas (309 Bcf) | ± 2 | ± 0.03 | ± 15 | |||
| • Gas prices (NYMEX) | ± 50¢ | + – 0 | + – 55 | |||
| • ROE | ||||||
| • Electric (10.3%) | ± 10 bps | ± 0.01 | ± 5 | |||
| • Gas (10.3%) | ± 20 | ± 0.01 | ± 4 | |||
| • Interest Rates | ±100 bps | ± < 0.01 | ± 5 | |||
| • Capital Investment | +$100 mil | + 0.01 | + 10 | |||
| • Law Update | Customer upside | Not In Plan |
a Reflect 2016 sales forecast; weather normalized
. . . . reflect strong risk mitigation.
15
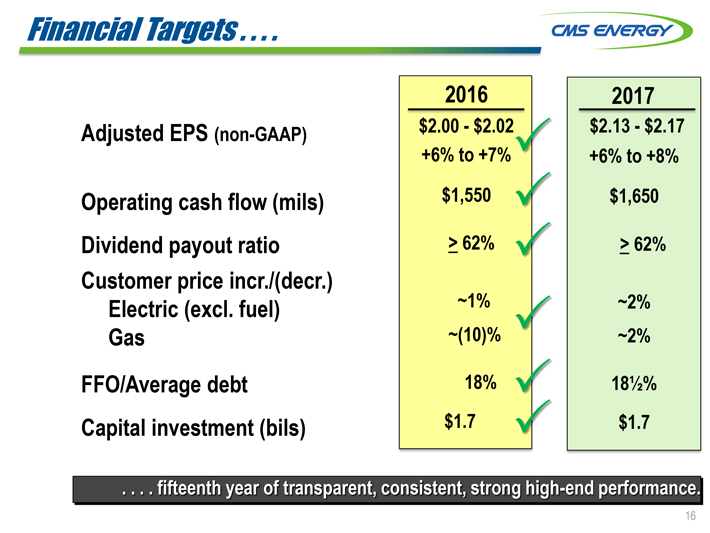
| Financial Targets | CMS ENERGY |
| 2016 | 2017 | |||
| Adjusted EPS (non-GAAP) | $2.00 - $2.02 |
$2.13 - $2.17 | ||
| +6% to +7% |
+6% to +8% | |||
| Operating cash flow (mils) | $1,550 | $1,650 | ||
| Dividend payout ratio | ³ 62% | ³ 62% | ||
| Customer price incr./(decr.) | ||||
| Electric (excl. fuel) | ~1% | ~2% | ||
| Gas | ~(10)% | ~2% | ||
| FFO/Average debt | 18% | 18 1⁄2% | ||
| Capital investment (bils) | $1.7 | $1.7 |
. . . . fifteenth year of transparent, consistent, strong high-end performance.
16
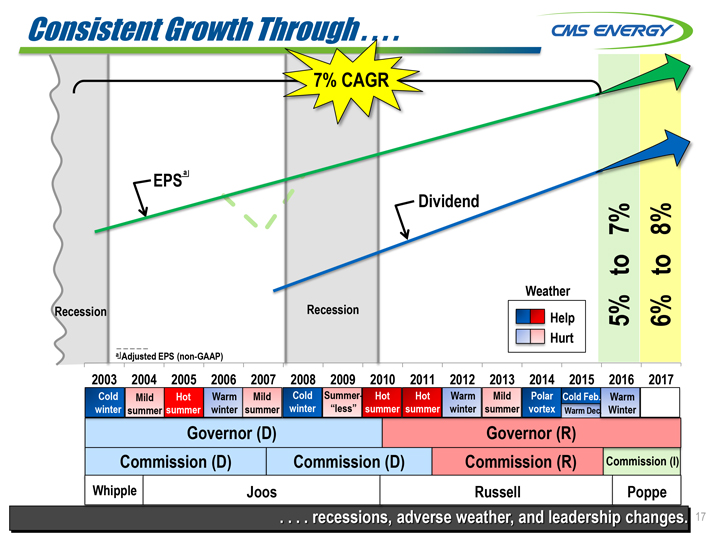
| Consistent Growth Through | CMS ENERGY |
| 7% CAGR | ||||||||||||||
| EPSa | Dividend | 5% to 7% | 6% to 8% | |||||||||||
| Weather | ||||||||||||||
| Recession | Recession | Help | ||||||||||||
| Hurt | ||||||||||||||
| a Adjusted EPS (non-GAAP) |
| 2003 | 2004 | 2005 | 2006 | 2007 | 2008 | 2009 | 2010 | 2011 | 2012 | 2013 | 2014 | 2015 | 2016 | 2017 | ||||||||||||||
| Cold | Mild | Hot | Warm | Mild | Cold | Summer- | Hot | Hot | Warm | Mild | Polar | Cold Feb. | Warm | |||||||||||||||
| winter | summer | summer | winter | summer | winter | “less” | summer | summer | winter | summer | vortex | Warm Dec. | Winter | |||||||||||||||
| Governor (D) | Governor (R) | |||||||||||||||||||||||||||
| Commission (D) | Commission (D) | Commission (R) | Commission (I) | |||||||||||||||||||||||||
| Whipple | Joos | Russell | Poppe |
. . . . recessions, adverse weather, and leadership changes. 17

CMS ENERGY
Q & A
See you at EEI
18
Appendix
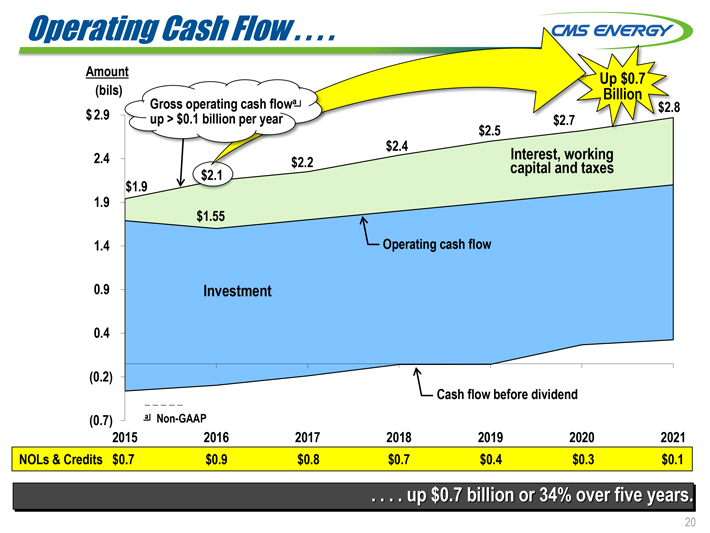
| Operating Cash Flow | CMS ENERGY |
| Amount | Up $0.7 | |||||||||||||
| (bils) | Gross operating cash flowa |
Billion | ||||||||||||
| up > $0.1 billion per year |
||||||||||||||
| $2.9 | ||||||||||||||
| 2.4 | $2.5 | $2.7 | $2.8 | |||||||||||
| $2.1 | $2.2 | $2.4 | Interest, working |
|||||||||||
| $1.9 | Capital and taxes |
|||||||||||||
| 1.9 | ||||||||||||||
| $1.55 | ||||||||||||||
| 1.4 | Operating cash flow |
|||||||||||||
| 0.9 | Investment | |||||||||||||
| 0.4 | ||||||||||||||
| (0.2) | ||||||||||||||
| Cash | flow before dividend |
|||||||||||||
| (0.7) | a Non- GAAP |
|||||||||||||
| 2015 | 2016 | 2017 | 2018 | 2019 | 2020 | 2021 | ||||||||
| NOLs & Credits | $0.7 | $0.9 | $0.8 | $0.7 | $0.4 | $0.3 | $0.1 |
. . . . up $0.7 billion or 34% over five years.
20
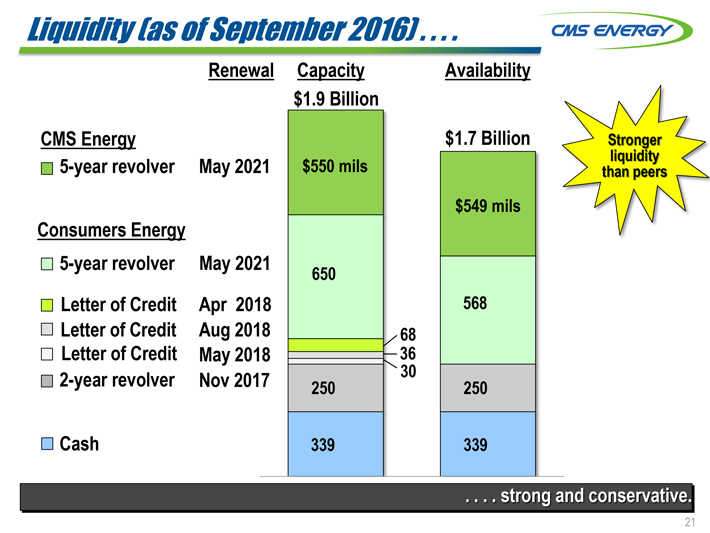
| Liquidity (as of September 2016) . . . . | CMS ENERGY |
| Renewal | Capacity | Availability | ||||||||
| $1.9 Billion | ||||||||||
| CMS Energy | $1.7 Billion | Stronger | ||||||||
| liquidity | ||||||||||
| 5-year revolver | May 2021 | $550 mils | than peers | |||||||
| $549 mils | ||||||||||
| Consumers Energy | ||||||||||
| 5-year revolver | May 2021 | 650 | ||||||||
| Letter of Credit | Apr 2018 | 568 | ||||||||
| Letter of Credit | Aug 2018 | 68 | ||||||||
| Letter of Credit | May 2018 | 36 | ||||||||
| 30 | ||||||||||
| 2-year revolver | Nov 2017 | 250 | 250 | |||||||
| Cash | 339 | 339 |
. . . . strong and conservative.
21
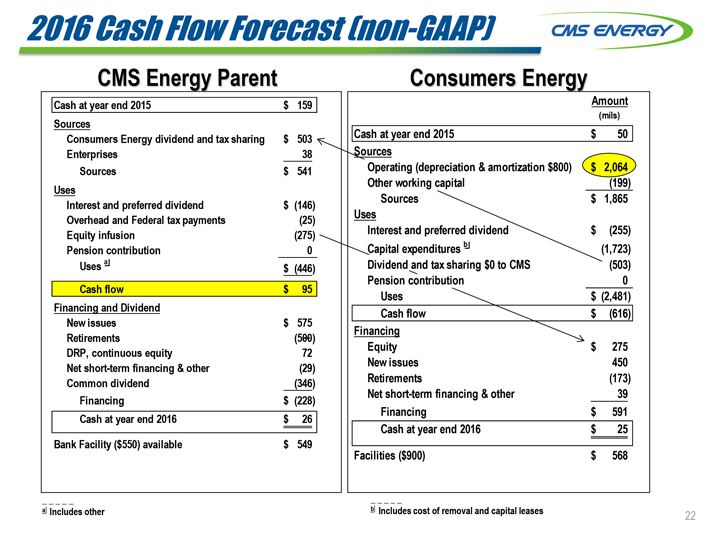
| 2016 Cash Flow Forecast (non-GAAP) | CMS ENERGY |
CMS Energy Parent
| Cash at year end 2015 Sources Consumers Energy dividend and tax sharing Enterprises Sources Uses Interest and preferred dividend Overhead and Federal tax payments Equity infusion Pension contribution Uses a Cash flow Financing and Dividend New issues Retirements DRP, continuous equity Net short-term financing & other Common dividend Financing Cash at year end 2016 Bank Facility ($550) available | $159 $503 38 $541 $(146) (25) (275) 0 $(446) $95 $575 (500)— 72 (29) (346) $(228) $26 $549 |
a Includes other
Consumers Energy
| Cash at year end 2015 Sources Operating (depreciation & amortization $800) Other working capital Sources Uses Interest and preferred dividend Capital expenditures b Dividend and tax sharing $0 to CMS Pension contribution Uses Cash flow Financing Equity New issues Retirements Net short-term financing & other Financing Cash at year end 2016 Facilities ($900) | Amount (mils) $50 $2,064 (199) $1,865 $(255) (1,723) (503) 0 $(2,481) $(616) $275 450 (173) 39 $591 $25 $568 |
b Includes cost of removal and capital leases
22

GAAP Reconciliation
CMS ENERGY
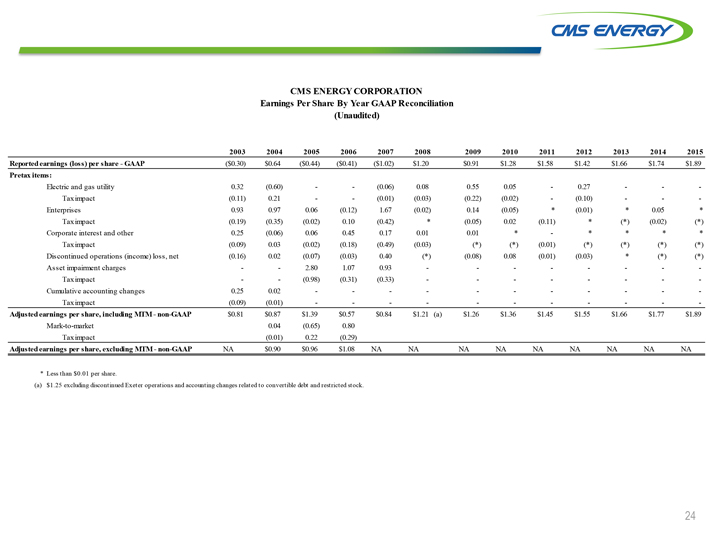
CMS ENERGY CORPORATION
Earnings Per Share By Year GAAP Reconciliation (Unaudited)
| 2003 | 2004 | 2005 | 2006 | 2007 | 2008 | 2009 | 2010 | 2011 | 2012 | 2013 | 2014 | 2015 | ||||||||||||||
| Reported earnings (loss) per share - GAAP | ($0.30) | $0.64 | ($0.44) | ($0.41) | ($1.02) | $1.20 | $0.91 | $1.28 | $1.58 | $1.42 | $1.66 | $1.74 | $1.89 | |||||||||||||
| Pretax items: | ||||||||||||||||||||||||||
| Electric and gas utility | 0.32 | (0.60) | — | — | (0.06) | 0.08 | 0.55 | 0.05 | — | 0.27 | — | — | — | |||||||||||||
| Tax impact | (0.11) | 0.21 | — | — | (0.01) | (0.03) | (0.22) | (0.02) | — | (0.10) | — | — | — | |||||||||||||
| Enterprises | 0.93 | 0.97 | 0.06 | (0.12) | 1.67 | (0.02) | 0.14 | (0.05)* | (0.01)* | 0.05* | ||||||||||||||||
| Tax impact | (0.19) | (0.35) | (0.02) | 0.10 | (0.42)* | (0.05) | 0.02 | (0.11)* | (*) | (0.02) | (*) | |||||||||||||||
| Corporate interest and other | 0.25 | (0.06) | 0.06 | 0.45 | 0.17 | 0.01 | 0.01* | -* | * | * | * | |||||||||||||||
| Tax impact | (0.09) | 0.03 | (0.02) | (0.18) | (0.49) | (0.03) | (*) | (*) | (0.01) | (*) | (*) | (*) | (*) | |||||||||||||
| Discontinued operations (income) loss, net | (0.16) | 0.02 | (0.07) | (0.03) | 0.40 | (*) | (0.08) | 0.08 | (0.01) | (0.03)* | (*) | (*) | ||||||||||||||
| Asset impairment charges | — | — | 2.80 | 1.07 | 0.93 | — | — | — | — | — | — | — | — | |||||||||||||
| Tax impact | — | — | (0.98) | (0.31) | (0.33) | — | — | — | — | — | — | — | — | |||||||||||||
| Cumulative accounting changes | 0.25 | 0.02 | — | — | — | — | — | — | — | — | — | — | — | |||||||||||||
| Tax impact | (0.09) | (0.01) | — | — | — | — | — | — | — | — | — | — | — | |||||||||||||
| Adjusted earnings per share, including MTM - non-GAAP | $0.81 | $0.87 | $1.39 | $0.57 | $0.84 | $1.21 (a) |
$1.26 | $1.36 | $1.45 | $1.55 | $1.66 | $1.77 | $1.89 | |||||||||||||
| Mark-to-market | 0.04 | (0.65) | 0.80 | |||||||||||||||||||||||
| Tax impact | (0.01) | 0.22 | (0.29) | |||||||||||||||||||||||
| Adjusted earnings per share, excluding MTM - non-GAAP | NA | $0.90 | $0.96 | $1.08 | NA | NA | NA | NA | NA | NA | NA | NA | NA |
* Less than $0.01 per share.
(a) $1.25 excluding
discontinued Exeter operations and accounting changes related to convertible debt and restricted stock.
24
CMS ENERGY
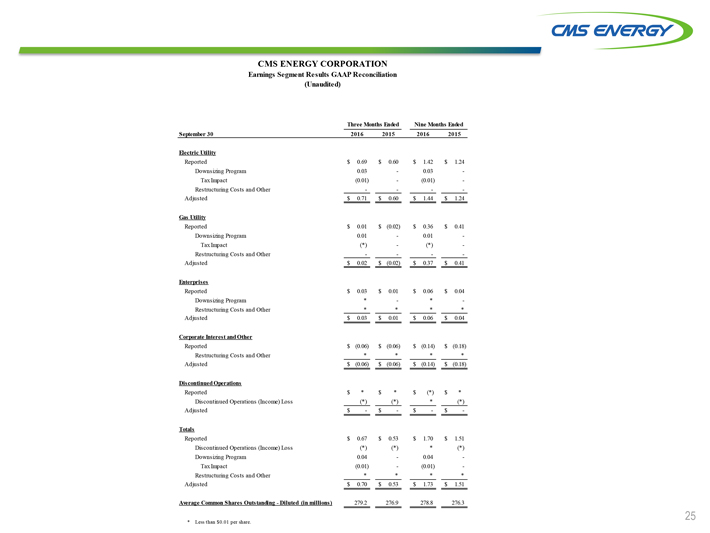
CMS ENERGY CORPORATION
Earnings Segment Results GAAP Reconciliation (Unaudited)
Three Months Ended Nine Months Ended
September 30 2016 2015 2016 2015
Electric Utility
Reported $0.69 $0.60 $1.42 $1.24
Downsizing Program 0.03 — 0.03
—
Tax Impact (0.01) — (0.01) —
Restructuring Costs and Other — — — —
Adjusted $0.71 $0.60 $1.44 $1.24
Gas Utility
Reported $0.01 $(0.02) $0.36 $0.41
Downsizing Program 0.01 — 0.01
—
Tax Impact (*) — (*) —
Restructuring Costs and Other — — — —
Adjusted $0.02 $(0.02) $0.37 $0.41
Enterprises
Reported $0.03 $0.01 $0.06 $0.04
Downsizing Program * -* —
Restructuring Costs and Other * * * *
Adjusted $0.03 $0.01 $0.06 $0.04
Corporate Interest and Other
Reported $(0.06) $(0.06) $(0.14) $(0.18)
Restructuring Costs and Other * * * *
Adjusted $(0.06) $(0.06) $(0.14) $(0.18)
Discontinued Operations
Reported $* $* $(*) $*
Discontinued Operations (Income) Loss (*) (*)* (*)
Adjusted $—
$— $— $—
Totals
Reported
$0.67 $0.53 $1.70 $1.51
Discontinued Operations (Income) Loss (*) (*)* (*)
Downsizing Program 0.04 — 0.04 —
Tax Impact
(0.01) — (0.01) —
Restructuring Costs and Other * * * *
Adjusted $0.70 $0.53 $1.73 $1.51
Average Common Shares Outstanding - Diluted (in millions)
279.2 276.9 278.8 276.3
* Less than $0.01 per share.
25

CMS ENERGY
CMS ENERGY CORPORATION EBITDA GAAP
Reconciliation
12 Months Ended (Unaudited)
| in millions | 09/30/16 | 12/31/15 | 09/30/15 | |||
| Reported earnings - GAAP | $580 | $523 | $513 | |||
| Interest on long-term debt | 404 | 386 | 387 | |||
| Other interest expense | 16 | 14 | 25 | |||
| Allowance for borrowed funds used during construction | (5) | (4) | (3) | |||
| Income tax expense | 287 | 271 | 266 | |||
| Income attributable to noncontrolling interests | 2 | 2 | 2 | |||
| Downsizing program (pretax) | 11 | — | — | |||
| Restructuring costs and other (pretax) | 2 | — | — | |||
| EBIT - Adjusted (1) | 1,297 | 1,192 | 1,190 | |||
| Depreciation and amortization | 783 | 750 | 746 | |||
| EBITDA - Adjusted (1) | $2,080 | $1,942 | $1,936 |
(1) Adjusted (Non-GAAP)
26
CMS ENERGY
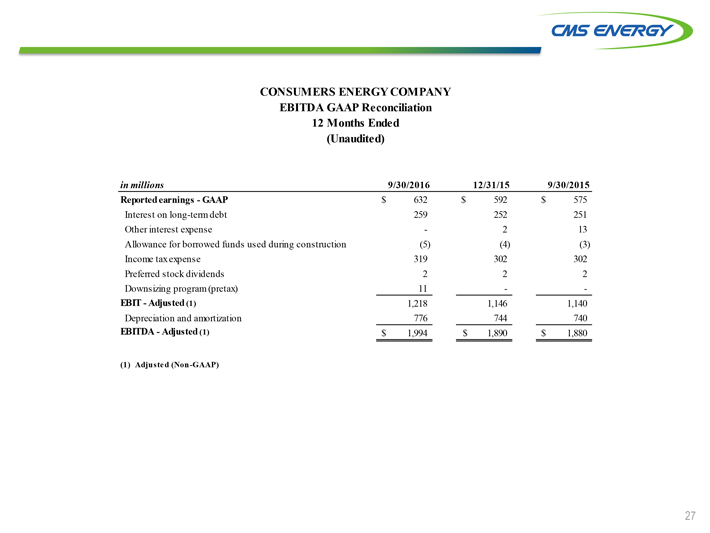
CONSUMERS ENERGY COMPANY EBITDA GAAP
Reconciliation
12 Months Ended (Unaudited)
| in millions | 9/30/2016 | 12/31/15 | 9/30/2015 | |||
| Reported earnings - GAAP | $632 | $592 | $575 | |||
| Interest on long-term debt | 259 | 252 | 251 | |||
| Other interest expense | — | 2 | 13 | |||
| Allowance for borrowed funds used during construction | (5) | (4) | (3) | |||
| Income tax expense | 319 | 302 | 302 | |||
| Preferred stock dividends | 2 | 2 | 2 | |||
| Downsizing program (pretax) | 11 | — | — | |||
| EBIT - Adjusted (1) | 1,218 | 1,146 | 1,140 | |||
| Depreciation and amortization | 776 | 744 | 740 | |||
| EBITDA - Adjusted (1) | $1,994 | $1,890 | $1,880 |
(1) Adjusted (Non-GAAP)
27
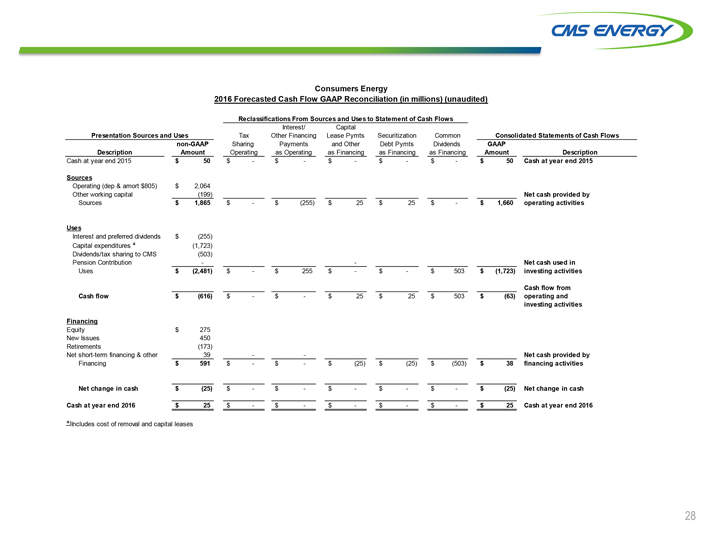
CMS ENERGY
Consumers Energy
2016 Forecasted Cash Flow GAAP Reconciliation (in millions) (unaudited)
Reclassifications From
Sources and Uses to Statement of Cash Flows
Interest/ Capital
Presentation
Sources and Uses Tax Other Financing Lease Pymts Securitization Common Consolidated Statements of Cash Flows
non-GAAP Sharing Payments and Other Debt Pymts
Dividends GAAP
Description Amount Operating as Operating as Financing as Financing as Financing Amount Description
Cash at year end 2015 $50 $— $— $— $— $— $50 Cash at year end 2015
Sources
Operating (dep & amort $805) $2,064
Other working capital (199) Net cash provided by
Sources $1,865 $— $(255) $25
$25 $— $1,660 operating activities
Uses
Interest and
preferred dividends $(255)
Capital expenditures a (1,723)
Dividends/tax
sharing to CMS (503)
Pension Contribution — — Net cash used in
Uses $(2,481) $— $255 $— $— $503 $(1,723) investing activities
Cash flow from
Cash flow $(616) $— $— $25 $25 $503 $(63)
operating and
investing activities
Financing
Equity $275
New Issues 450
Retirements (173)
Net short-term financing & other 39 —
— Net cash provided by
Financing $591 $— $— $(25) $(25) $(503) $38 financing activities
Net change in cash $(25) $— $— $— $— $— $(25) Net change in cash
Cash at year end 2016 $25 $— $— $— $— $— $25 Cash at year end 2016
a Includes cost of removal and capital leases
28
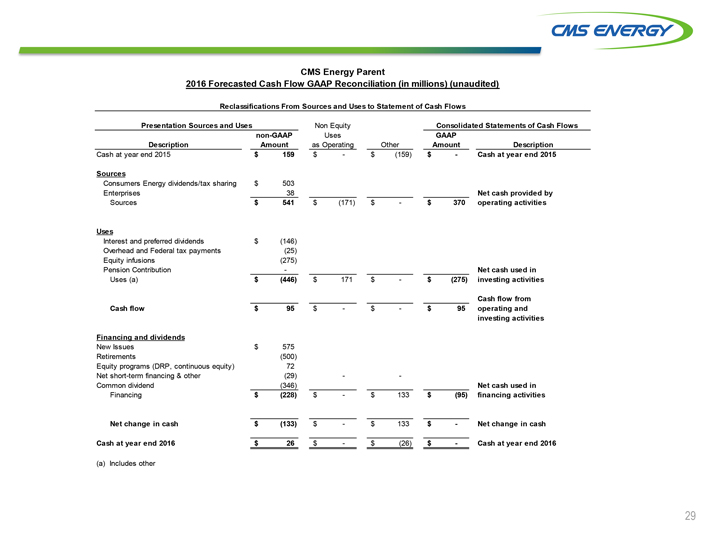
CMS ENERGY
CMS Energy Parent
2016 Forecasted Cash Flow GAAP Reconciliation (in millions) (unaudited)
Reclassifications From
Sources and Uses to Statement of Cash Flows
Presentation Sources and Uses Non Equity Consolidated Statements of Cash Flows
non-GAAP Uses GAAP
Description Amount as Operating Other Amount Description
Cash at year end 2015 $159 $— $(159) $— Cash at year end 2015
Sources
Consumers Energy dividends/tax sharing $503
Enterprises 38 Net cash provided by
Sources $541 $(171) $— $370 operating
activities
Uses
Interest and preferred dividends $(146)
Overhead and Federal tax payments (25)
Equity infusions (275)
Pension Contribution — Net cash used in
Uses (a) $(446) $171
$— $(275) investing activities
Cash flow from
Cash flow $95
$— $— $95 operating and
investing activities
Financing and dividends
New Issues $575
Retirements (500)
Equity programs (DRP, continuous equity) 72
Net short-term financing & other (29) — —
Common
dividend (346) Net cash used in
Financing $(228) $— $133 $(95) financing activities
Net change in cash $(133) $— $133 $— Net change in cash
Cash
at year end 2016 $26 $— $(26) $— Cash at year end 2016
(a) Includes other
29
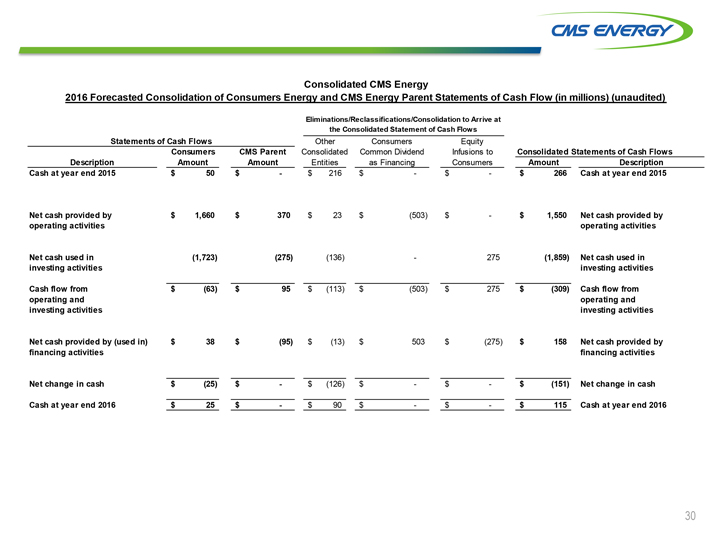
CMS ENERGY
Consolidated CMS Energy
2016 Forecasted Consolidation of Consumers Energy and CMS Energy Parent Statements of Cash Flow (in millions) (unaudited)
| Eliminations/ Reclassifications/ Consolidation to Arrive at | ||||||||||||||
| the Consolidated Statement of Cash Flows | ||||||||||||||
| Statements of Cash Flows | Other | Consumers | Equity | |||||||||||
| Consumers | CMS Parent |
Consolidated | Common Dividend |
Infusions to |
Consolidated Statements of Cash Flows | |||||||||
| Description | Amount | Amount | Entities | as Financing |
Consumers | Amount | Description | |||||||
| Cash at year end 2015 | $50 | $— | $216 | $— | $— | $266 | Cash at year end 2015 | |||||||
| Net cash provided by | $1,660 | $370 | $23 | $(503) | $— | $1,550 | Net cash provided by | |||||||
| operating activities | operating activities | |||||||||||||
| Net cash used in | (1,723) | (275) | (136) | — | 275 | (1,859) | Net cash used in | |||||||
| investing activities | investing activities | |||||||||||||
| Cash flow from | $(63) | $95 | $(113) | $(503) | $275 | $(309) | Cash flow from | |||||||
| operating and | operating and | |||||||||||||
| investing activities | investing activities | |||||||||||||
| Net cash provided by (used in) | $38 | $(95) | $(13) | $503 | $(275) | $158 | Net cash provided by | |||||||
| financing activities | financing activities | |||||||||||||
| Net change in cash | $(25) | $— | $(126) | $— | $— | $(151) | Net change in cash | |||||||
| Cash at year end 2016 | $25 | $— | $90 | $— | $— | $115 | Cash at year end 2016 | |||||||
30
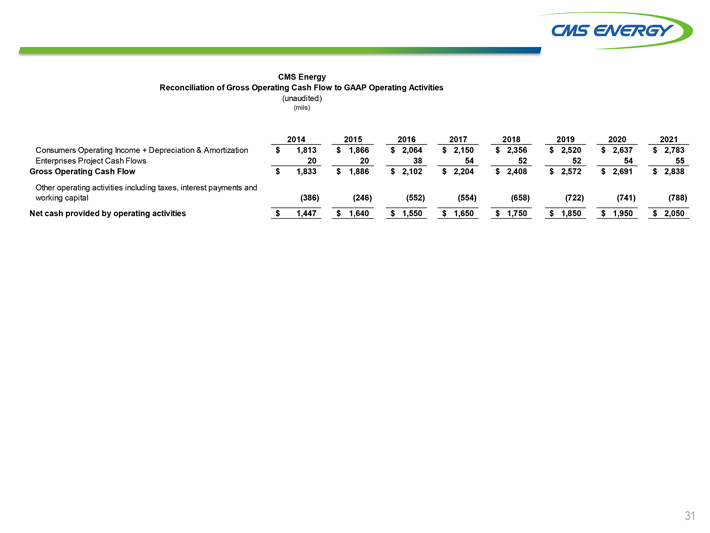
CMS ENERGY
CMS Energy
Reconciliation of Gross Operating Cash Flow to GAAP Operating Activities
(unaudited)
(mils)
| 2014 | 2015 | 2016 | 2017 | 2018 | 2019 | 2020 | 2021 | |||||||||
| Consumers Operating Income + Depreciation & Amortization | $1,813 | $1,866 | $2,064 | $2,150 | $2,356 | $2,520 | $2,637 | $2,783 | ||||||||
| Enterprises Project Cash Flows | 20 | 20 | 38 | 54 | 52 | 52 | 54 | 55 | ||||||||
| Gross Operating Cash Flow | $1,833 | $1,886 | $2,102 | $2,204 | $2,408 | $2,572 | $2,691 | $2,838 | ||||||||
| Other operating activities including taxes, interest payments and | ||||||||||||||||
| working capital | (386) | (246) | (552) | (554) | (658) | (722) | (741) | (788) | ||||||||
| Net cash provided by operating activities | $1,447 | $1,640 | $1,550 | $1,650 | $1,750 | $1,850 | $1,950 | $2,050 |
31