Attached files
| file | filename |
|---|---|
| 8-K - CIRRUS LOGIC, INC. 8-K - CIRRUS LOGIC, INC. | a51447493.htm |
| EX-99.1 - EXHIBIT 99.1 - CIRRUS LOGIC, INC. | a51447493ex99_1.htm |
Exhibit 99.2
CIRRUS LOGIC, INC. 1
October 27, 2016 Dear
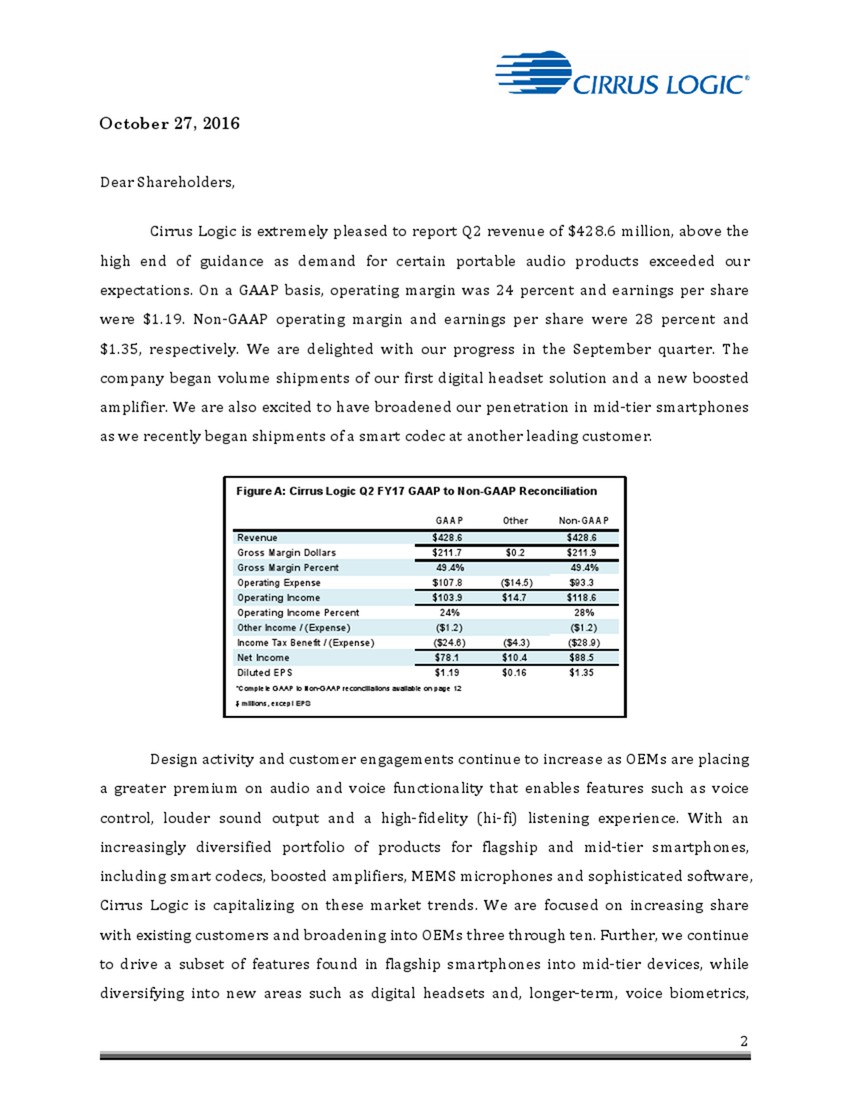
Shareholders, Cirrus Logic is extremely pleased to report Q2 revenue of
$428.6 million, above the high end of guidance as demand for certain
portable audio products exceeded our
expectations.
On a GAAP basis, operating margin was 24 percent and earnings per share
were $1.19. Non-GAAP operating margin and earnings per share were 28
percent and $1.35, respectively. We are delighted with our progress in
the September quarter. The company began volume shipments of our first
digital headset solution and a new boosted amplifier. We are also
excited to have broadened our penetration in mid-tier smartphones as we
recently began shipments of a smart codec at another leading customer.
Design activity and customer engagements continue to increase as OEMs
are placing a greater premium on audio and voice functionality that
enables features such as voice control, louder sound output and a
high-fidelity (hi-fi) listening experience. With an increasingly
diversified portfolio of products for flagship and mid-tier smartphones,
including smart codecs, boosted amplifiers, MEMS microphones and
sophisticated software, Cirrus Logic is capitalizing on these market
trends. We are focused on increasing share with existing customers and
broadening into OEMs three through ten. Further, we continue to drive a
subset of features found in flagship smartphones into mid-tier devices,
while diversifying into new areas such as digital headsets and,
longer-term, voice biometrics, Figure
A: Cirrus Logic Q2 FY17 GAAP to Non-GAAP Reconciliation GAAP Other
Non-GAAP Revenue $428.6 $428.6 Gross Margin Dollars $211.7 $0.2 $211.9
Gross Margin Percent 49.4% 49.4% Operating
Expense $107.8 ($14.5) $93.3 Operating
Income $103.9 $14.7 $118.6 Operating Income Percent 24% 28% Other
Income / (Expense) ($1.2) ($1.2) Income Tax Benefit / (Expense) ($24.6)
($4.3) ($28.9) Net
Income $78.1 $10.4 $88.5 Diluted EPS $1.19 $0.16 $1.35 *Complete
GAAP to Non-GAAP reconciliations available on page 12 $ millions, except
EPS 2
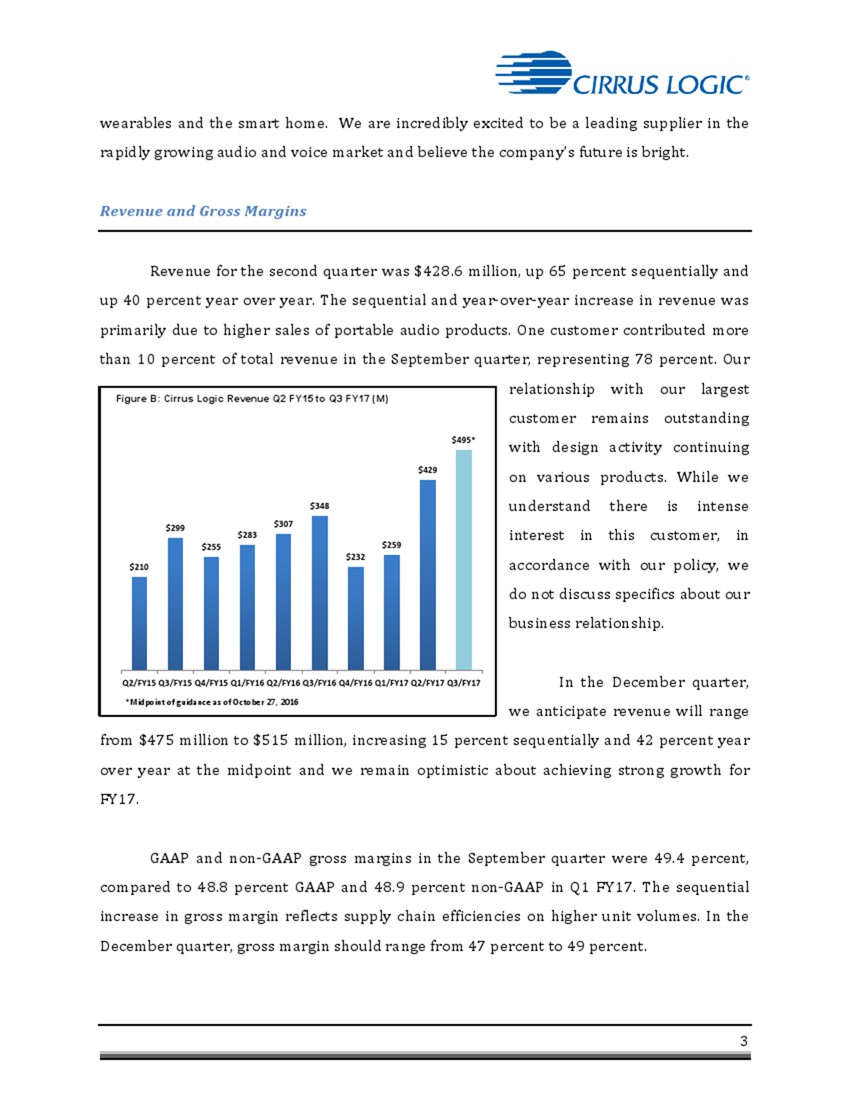
wearables and the smart home. We are incredibly excited to be a leading supplier in the rapidly growing audio and voice market and believe the company’s future is bright. Revenue and Gross Margins Revenue for the second quarter was $428.6 million, up 65 percent sequentially and up 40 percent year over year. The sequential and year-over-year increase in revenue was primarily due to higher sales of portable audio products. One customer contributed more than 10 percent of total revenue in the September quarter, representing 78 percent. Our relationship with our largest customer remains outstanding with design activity continuing on various products. While we understand there is intense interest in this customer, in accordance with our policy, we do not discuss specifics about our business relationship. In the December quarter, we anticipate revenue will range from $475 million to $515 million, increasing 15 percent sequentially and 42 percent year over year at the midpoint and we remain optimistic about achieving strong growth for FY17. GAAP and non-GAAP gross margins in the September quarter were 49.4 percent, compared to 48.8 percent GAAP and 48.9 percent non-GAAP in Q1 FY17. The sequential increase in gross margin reflects supply chain efficiencies on higher unit volumes. In the December quarter, gross margin should range from 47 percent to 49 percent. $210 $299 $255 $283 $307 $348 $232 $259 $429 $495* Q2/FY15 Q3/FY15 Q4/FY15 Q1/FY16 Q2/FY16 Q3/FY16 Q4/FY16 Q1/FY17 Q2/FY17 Q3/FY17 *Midpoint of guidance as of October 27, 2016 Figure B: Cirrus Logic Revenue Q2 FY15 to Q3 FY17 (M)
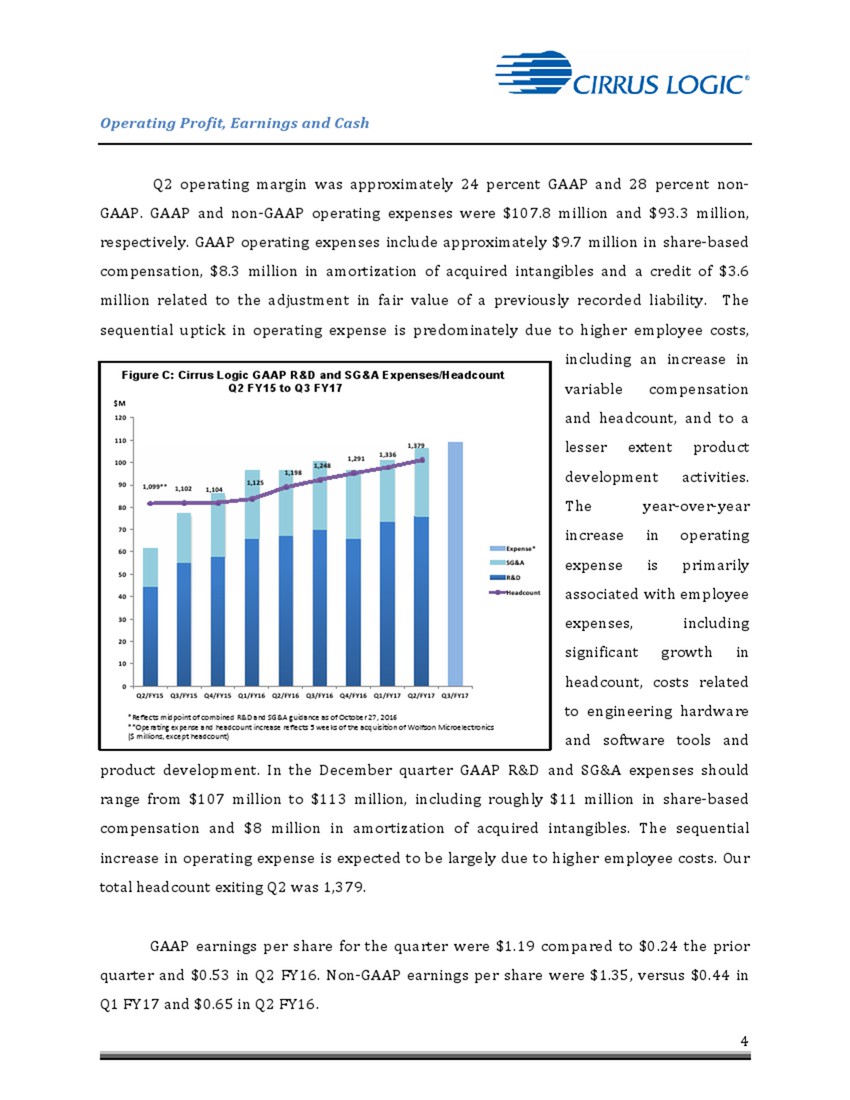
4 Operating Profit, Earnings and Cash Q2 operating margin was approximately 24 percent GAAP and 28 percent non- GAAP. GAAP and non-GAAP operating expenses were $107.8 million and $93.3 million, respectively. GAAP operating expenses include approximately $9.7 million in share-based compensation, $8.3 million in amortization of acquired intangibles and a credit of $3.6 million related to the adjustment in fair value of a previously recorded liability. The sequential uptick in operating expense is predominately due to higher employee costs, including an increase in variable compensation and headcount, and to a lesser extent product development activities. The year-over-year increase in operating expense is primarily associated with employee expenses, including significant growth in headcount, costs related to engineering hardware and software tools and product development. In the December quarter GAAP R&D and SG&A expenses should range from $107 million to $113 million, including roughly $11 million in share-based compensation and $8 million in amortization of acquired intangibles. The sequential increase in operating expense is expected to be largely due to higher employee costs. Our total headcount exiting Q2 was 1,379. GAAP earnings per share for the quarter were $1.19 compared to $0.24 the prior quarter and $0.53 in Q2 FY16. Non-GAAP earnings per share were $1.35, versus $0.44 in Q1 FY17 and $0.65 in Q2 FY16. Figure C: Cirrus Logic GAAP R&D and SG&A Expenses/Headcount Q2 FY15 to Q3 FY17 1,099** 1,102 1,104 1,125 1,198 1,248 1,291 1,336 1,379 0 10 20 30 40 50 60 70 80 90 100 110 120 Q2/FY15 Q3/FY15 Q4/FY15 Q1/FY16 Q2/FY16 Q3/FY16 Q4/FY16 Q1/FY17 Q2/FY17 Q3/FY17 Expense* SG&A R&D Headcount $M *Reflects midpoint of combined R&D and SG&A guidance as of October 27, 2016 **OperaAng expense and headcount increase reflects 5 weeks of the acquisiAon of Wolfson Microelectronics ($ millions, except headcount)
5 Our ending cash balance in the September quarter was $231 million, down from the prior quarter largely due to timing of receivables, payables and the repayment of debt. Cash from operations was approximately $20 million. The company’s balance sheet reflects $140 million of debt, down $20.4 million from the June quarter. Interest expense related to this debt is currently expected to be roughly $500,000 per quarter. The company has approximately $175.8 million remaining in our share repurchase program. We will continue to evaluate potential uses of cash including acquisitions, the repurchase of shares and repayment of debt. Taxes and Inventory GAAP tax expense for the September quarter was $24.6 million, resulting in an effective tax rate of 24 percent. Non-GAAP tax expense and the effective tax rate for the quarter was $28.9 million and 24.6 percent, respectively. Non-GAAP tax expense reflects the effect of higher non-GAAP income in various jurisdictions. We estimate that our worldwide effective tax rate in FY17 will range from 25 percent to 27 percent. The lower range versus our previous expectation of 27 percent to 29 percent reflects improved annual profitability being earned in foreign jurisdictions. Moving forward, we expect this rate to decrease gradually on an annual basis. Q2 inventory was $161.3 million, up from the prior quarter. Inventory in the December quarter is expected to be flat to down slightly as we continue to fulfill product demand. Company Strategy The first half of FY17 has been outstanding for Cirrus Logic, as we have introduced a variety of new products, expanded share with new and existing customers and are on track to deliver significant year-over-year revenue growth. We are pleased with our accomplishments, including ramping our first digital headset solution and expanding our
6 boosted amplifier business. While we are proud of this success we remain focused on the strategic initiatives that we believe are essential to drive opportunities in FY18 and beyond. With an extensive portfolio of hardware and software products that address a wide range of technical and cost requirements, we are participating in markets that are in the early stage of development and have the potential to foster growth for multiple years. We are focused on extending our leadership in digital headsets and boosted amplifiers, as these markets continue to develop. Additionally, we believe we are well positioned to gain share in handset OEMs three through ten and further penetrate mid-tier smartphones as demand for innovative audio and voice solutions gains momentum across a broad range of customers. Finally, longer term we expect to meaningfully increase the revenue contribution from MEMS microphones, introduce new technologies such as voice biometrics and capitalize on new product categories such as wearables and the smart home. We believe interest in sophisticated audio and voice technology across product categories and tiers will continue to accelerate as OEMs strive to introduce devices with differentiated features that enhance the overall consumer experience. As mobile phones become more entrenched in our daily lives through the consumption and production of content, consumers expect an elegant interface with seamless handsfree voice control, louder and higher quality sound output for voice calls, music, video playback and gaming. Enabling these features while reducing power consumption and providing flexibility in the industrial design has become a key focus for many mobile OEMs. Cirrus Logic is uniquely suited to solve these challenges given our expertise in audio signal processing, extensive portfolio of products that spans the audio signal chain and the necessary tools, software and algorithms. In Q2, we made significant progress as we ramped numerous new components into several flagship and mid-tier smartphones, as well as digital headsets. Design activity remained robust across our portfolio as OEMs continue to emphasize the importance of the audio and voice experience, including in emerging markets such as headsets and mid-tier smartphones. Further, the company launched a new ultra-low power smart codec that enables innovative voice features while allowing consumers to enjoy a hi-fi listening experience. As we move into the December quarter, we are optimistic about our future as we continue to ramp exciting new products and customer engagements remain robust.
7 future as we continue to ramp exciting new products and customer engagements remain robust. The use of innovative audio and voice components in mobile devices has traditionally been limited to a few flagship smartphone OEMs. There has been a transformation in this market as OEMs targeting the mid-tier are beginning to adopt features typically found in the high-end in an effort to provide a differentiated consumer experience. Recently, our strategy has been to expand our overall opportunity by leveraging the technology we have developed for flagship smartphones into the mid-tier. Within this market, demand for cost effective components that provide high performance audio and voice capability at very low power and latency is increasing substantially as OEMs strive to provide a hi-fi listening experience. Cirrus Logic has developed a scalable platform of smart codecs that are optimized for this segment and enable a variety of features including karaoke, speaker protection, virtual stereo and always on voice. Additionally, our solutions improve audio quality through the removal of reverberation and echo, while enhancing voice performance and enabling louder sound with less distortion for both the headphone and speaker output. Our products can be found in several mid-tier smartphones on the shelves today and we have started to ramp multiple smart codecs with another leading customer in a variety of new models that are expected to launch over the next several months. While this market is highly fragmented, we believe there is a significant opportunity for the company to leverage our technology and position as the leading provider of innovative audio and voice solutions to take advantage of this fast growing segment. As smartphone OEMs push for differentiation in an increasingly competitive environment, innovation has moved beyond the phone into the accessories that attach to these devices. This trend is fueling the transition of the more than one-billion analog headsets sold annually, which have not historically included semiconductor content, to digitally connected products. Recognizing the forthcoming shift in this technology several years ago, Cirrus Logic leveraged our expertise in ultra-low power, high performance mixed signal processing to develop a portfolio of digital headset products that span the
8 various tiers and price points. At the high end, our smart codec provides high-fidelity audio playback and advanced features such as adaptive active noise cancelling (ANC) across all form factors, including non-sealed earbuds. Addressing the substantially larger mainstream market, where even the most basic digital headset will require an interface device and conversion circuitry, we also provide components that enable a cost-effective high-fidelity audio experience. We are encouraged to see more smartphone OEMs transition to digital connectivity between their handsets and smart accessories, validating the market opportunity for our portfolio of digital headset solutions and enabling compelling new use cases for consumers to enjoy multimedia content on their devices. We are extremely pleased with our progress this past quarter as we began volume shipments in a new hi-fi digital headset. In an effort to maximize our opportunities in this highly fragmented market and support the rapid deployment of digital headsets, the company is developing numerous reference designs targeting the Android and MFi ecosystems. Adoption of our reference designs across the various digital interfaces is advancing as customers’ push to expedite production of new digitally connected headsets. We are actively engaged with a variety of leading mobile and aftermarket accessory OEMs in the design of digital headsets utilizing our hi-fi, smart codec and ANC solutions. We expect the first Cirrus Logic enabled ANC digital headset to be available on the market in Q1 of CY17. While headsets targeting the mainstream are likely to dominate the unit opportunity in the foreseeable future, we are confident that the ability to design an adaptive high-end ANC headset at a lower cost versus the solutions available today, will act as a catalyst and fuel meaningfully higher ANC volumes in the long-term. While we anticipate the revenue contribution from these products will be sizeable in FY17, we expect the transition to digitally connected highfidelity headsets to be a growth vector that spans several years. In summary, we are participating in an industry where demand for complex processing that spans the analog and digital divide is intensifying. As a broader range of OEMs place a premium on audio and voice technology our opportunities are increasing substantially in both existing and new segments of the market, including those that traditionally have not utilized standalone components. Going forward, we expect to
9 continue to leverage our technology developed for mobile into emerging areas such as voice biometrics, virtual reality headsets, wearables and the smart home. Summary and Guidance For the December quarter we expect the following results: Revenue to range between $475 million and $515 million; GAAP gross margin to be between 47 percent and 49 percent; and Combined GAAP R&D and SG&A expenses to range between $107 million and $113 million, including approximately $11 million in share-based compensation expense and $8 million in amortization of acquired intangibles. In conclusion, Q2 was another great quarter for Cirrus Logic as sales of our new digital headset devices as well as boosted amplifiers drove revenue above the high end of guidance. We are delighted with our financial performance over the past few years, and given the breadth of our product portfolio, a robust product roadmap and the expanding demand for compelling audio and voice solutions, we believe the company is well positioned to capitalize on a wide range of growth vectors in coming years. Sincerely, Jason Rhode Thurman Case President and Chief Executive Officer Chief Financial Officer
10 Conference Call Q&A Session Cirrus Logic will host a live Q&A session at 5:30 p.m. EDT today to answer questions related to its financial results and business outlook. Participants may listen to the conference call on the Cirrus Logic website. Participants who would like to submit a question to be addressed during the call are requested to email investor.relations@cirrus.com. A replay of the webcast can be accessed on the Cirrus Logic website approximately two hours following its completion, or by calling (404) 537-3406, or toll-free at (855) 859- 2056 (Access Code: 90417574). Use of Non-GAAP Financial Information To supplement Cirrus Logic's financial statements presented on a GAAP basis, Cirrus has provided non- GAAP financial information, including gross margins, operating expenses, net income, operating profit and income, tax expenses, effective tax rate and diluted earnings per share. A reconciliation of the adjustments to GAAP results is included in the tables below. Non-GAAP financial information is not meant as a substitute for GAAP results, but is included because management believes such information is useful to our investors for informational and comparative purposes. In addition, certain non-GAAP financial information is used internally by management to evaluate and manage the company. The non-GAAP financial information used by Cirrus Logic may differ from that used by other companies. These non-GAAP measures should be considered in addition to, and not as a substitute for, the results prepared in accordance with GAAP. Safe Harbor Statement Except for historical information contained herein, the matters set forth in this news release contain forward-looking statements, including expectations for growth and product ramps in the third quarter fiscal year 2017 and beyond, our estimates of effective tax rates, fiscal year 2017 revenue, gross margin, combined research and development and selling, general and administrative expense levels, share-based compensation expense and amortization of acquired intangibles. In some cases, forwardlooking statements are identified by words such as “expect,” “anticipate,” “foresee,” “target,” “project,” “believe,” “goals,” “opportunity,” “estimates,” “intend,” and variations of these types of words and similar expressions. In addition, any statements that refer to our plans, expectations, strategies or other characterizations of future events or circumstances are forward-looking statements. These forward-looking statements are based on our current expectations, estimates and assumptions and are subject to certain risks and uncertainties that could cause actual results to differ materially. These risks and uncertainties include, but are not limited to, the following: the level of orders and shipments during the third quarter of fiscal year 2017, customer cancellations of orders, or the failure to place orders consistent with forecasts, along with the timing and success of new product ramps; and the risk factors listed in our Form 10-K for the year ended March 26, 2016, and in our other filings with the Securities and Exchange Commission, which are available at www.sec.gov. The foregoing information concerning our business outlook represents our outlook as of the date of this news release, and we

11 undertake no obligation to update or revise any forward-looking statements, whether as a result of new developments or otherwise. Cirrus Logic and Cirrus are registered trademarks of Cirrus Logic, Inc. All other company or product names noted herein may be trademarks of their respective holders. Summary financial data follows: Sep. 24, Jun. 25, Sep. 26, Sep. 24, Sep. 26, 2016 2016 2015 2016 2015 Q2'17 Q1'17 Q2'16 Q2'17 Q2'16 Portable audio products $ 383,410 $ 216,068 $ 257,152 $ 599,478 $ 493,018 Non-portable audio and other products 45,209 43,360 49,604 88,569 96,371 CIRRUS LOGIC, INC. CONSOLIDATED CONDENSED STATEMENT OF OPERATIONS (unaudited) (in thousands, except per share data) Three Months Ended Six Months Ended Net sales 428,619 259,428 306,756 688,047 589,389 Cost of sales 216,920 132,743 164,535 349,663 314,714 Gross profit 211,699 126,685 142,221 338,384 274,675 Gross margin 49.4% 48.8% 46.4% 49.2% 46.6% Research and development 75,673 73,934 67,258 149,607 133,093 Selling, general and administrative 32,089 30,540 30,103 62,629 59,222 Patent agreement and other - - 752 - ( 11,748) Total operating expenses 107,762 104,474 98,113 212,236 180,567 Income from operations 103,937 22,211 44,108 126,148 94,108 Interest expense, net (1,003) (689) (709) (1,692) (1,454) Other income (expense), net (261) 147 (416) (114) (173) Income before income taxes 102,673 21,669 42,983 124,342 92,481 Provision for income taxes 24,608 5,805 8,103 30,413 24,247 Net income $ 78,065 $ 15,864 $ 34,880 $ 93,929 $ 68,234 Basic earnings per share: $ 1.24 $ 0.25 $ 0.55 $ 1.50 $ 1.08 Diluted earnings per share: $ 1.19 $ 0.24 $ 0.53 $ 1.43 $ 1.03 Weighted average number of shares: Basic 62,787 62,450 63,346 62,618 63,310 Diluted 65,717 65,232 66,329 65,521 66,378 Prepared in accordance with Generally Accepted Accounting Principles
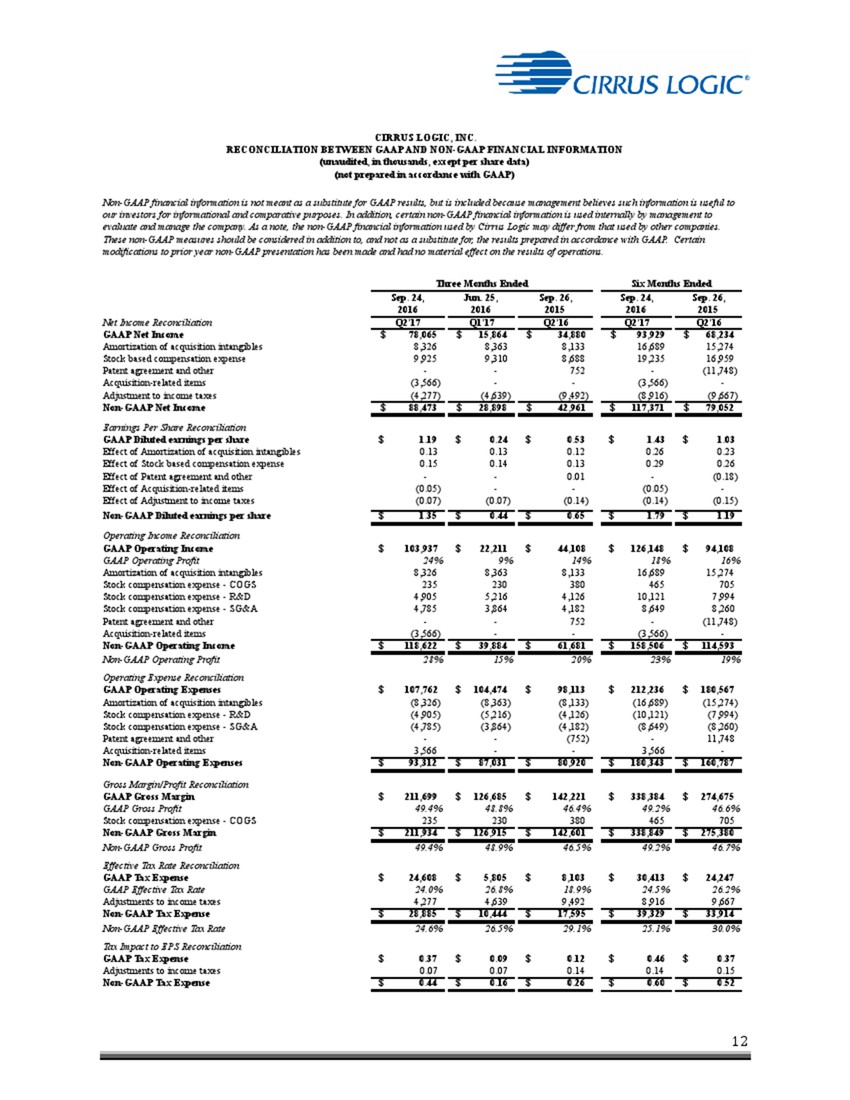
12 Sep. 24, Jun. 25, Sep. 26, Sep. 24, Sep. 26, 2016 2016 2015 2016 2015 Net Income Reconciliation Q2'17 Q1'17 Q2'16 Q2'17 Q2'16 GAAP Net Income $ 78,065 $ 15,864 $ 34,880 $ 93,929 $ 68,234 Amortization of acquisition intangibles 8,326 8,363 8,133 16,689 15,274 Stock based compensation expense 9,925 9,310 8,688 19,235 16,959 Non-GAAP financial information is not meant as a substitute for GAAP results, but is included because management believes such information is useful to our investors for informational and comparative purposes. In addition, certain non-GAAP financial information is used internally by management to evaluate and manage the company. As a note, the non-GAAP financial information used by Cirrus Logic may differ from that used by other companies. These non-GAAP measures should be considered in addition to, and not as a substitute for, the results prepared in accordance with GAAP. Certain modifications to prior year non-GAAP presentation has been made and had no material effect on the results of operations. Three Months Ended Six Months Ended (not prepared in accordance with GAAP) CIRRUS LOGIC, INC. RECONCILIATION BETWEEN GAAP AND NON-GAAP FINANCIAL INFORMATION (unaudited, in thousands, except per share data) Patent agreement and other - - 752 - ( 11,748) Acquisition-related items (3,566) - - (3,566) - Adjustment to income taxes (4,277) (4,639) (9,492) (8,916) (9,667) Non-GAAP Net Income $ 88,473 $ 28,898 $ 42,961 $ 117,371 $ 79,052 Earnings Per Share Reconciliation GAAP Diluted earnings per share $ 1.19 $ 0.24 $ 0.53 $ 1.43 $ 1.03 Effect of Amortization of acquisition intangibles 0.13 0.13 0.12 0.26 0.23 Effect of Stock based compensation expense 0.15 0.14 0.13 0.29 0.26 Effect of Patent agreement and other - - 0.01 - (0.18) Effect of Acquisition-related items (0.05) - - (0.05) - Effect of Adjustment to income taxes (0.07) (0.07) (0.14) (0.14) (0.15) Non-GAAP Diluted earnings per share $ 1.35 $ 0.44 $ 0.65 $ 1.79 $ 1.19 Operating Income Reconciliation GAAP Operating Income $ 103,937 $ 22,211 $ 44,108 $ 126,148 $ 94,108 GAAP Operating Profit 24% 9% 14% 18% 16% Amortization of acquisition intangibles 8,326 8,363 8,133 16,689 15,274 Stock compensation expense - COGS 235 230 380 465 705 Stock compensation expense - R&D 4,905 5,216 4,126 10,121 7,994 Stock compensation expense - SG&A 4,785 3,864 4,182 8,649 8,260 Patent agreement and other - - 752 - ( 11,748) Acquisition-related items (3,566) - - (3,566) - Non-GAAP Operating Income $ 118,622 $ 39,884 $ 61,681 $ 158,506 $ 114,593 Non-GAAP Operating Profit 28% 15% 20% 23% 19% Operating Expense Reconciliation GAAP Operating Expenses $ 107,762 $ 104,474 $ 98,113 $ 212,236 $ 180,567 Amortization of acquisition intangibles (8,326) (8,363) (8,133) (16,689) ( 15,274) Stock compensation expense - R&D (4,905) (5,216) (4,126) (10,121) (7,994) Stock compensation expense - SG&A (4,785) (3,864) (4,182) (8,649) (8,260) Patent agreement and other - - (752) - 11,748 Acquisition-related items 3,566 - - 3,566 - Non-GAAP Operating Expenses $ 93,312 $ 87,031 $ 80,920 $ 180,343 $ 160,787 Gross Margin/Profit Reconciliation GAAP Gross Margin $ 211,699 $ 126,685 $ 142,221 $ 338,384 $ 274,675 GAAP Gross Profit 49.4% 48.8% 46.4% 49.2% 46.6% Stock compensation expense - COGS 235 230 380 465 705 Non-GAAP Gross Margin $ 211,934 $ 126,915 $ 142,601 $ 338,849 $ 275,380 Non-GAAP Gross Profit 49.4% 48.9% 46.5% 49.2% 46.7% Effective Tax Rate Reconciliation GAAP Tax Expense $ 24,608 $ 5,805 $ 8,103 $ 30,413 $ 24,247 GAAP Effective Tax Rate 24.0% 26.8% 18.9% 24.5% 26.2% Adjustments to income taxes 4,277 4,639 9,492 8,916 9,667 Non-GAAP Tax Expense $ 28,885 $ 10,444 $ 17,595 $ 39,329 $ 33,914 Non-GAAP Effective Tax Rate 24.6% 26.5% 29.1% 25.1% 30.0% Tax Impact to EPS Reconciliation GAAP Tax Expense $ 0.37 $ 0.09 $ 0.12 $ 0.46 $ 0.37 Adjustments to income taxes 0.07 0.07 0.14 0.14 0.15 Non-GAAP Tax Expense $ 0.44 $ 0.16 $ 0.26 $ 0.60 $ 0.52
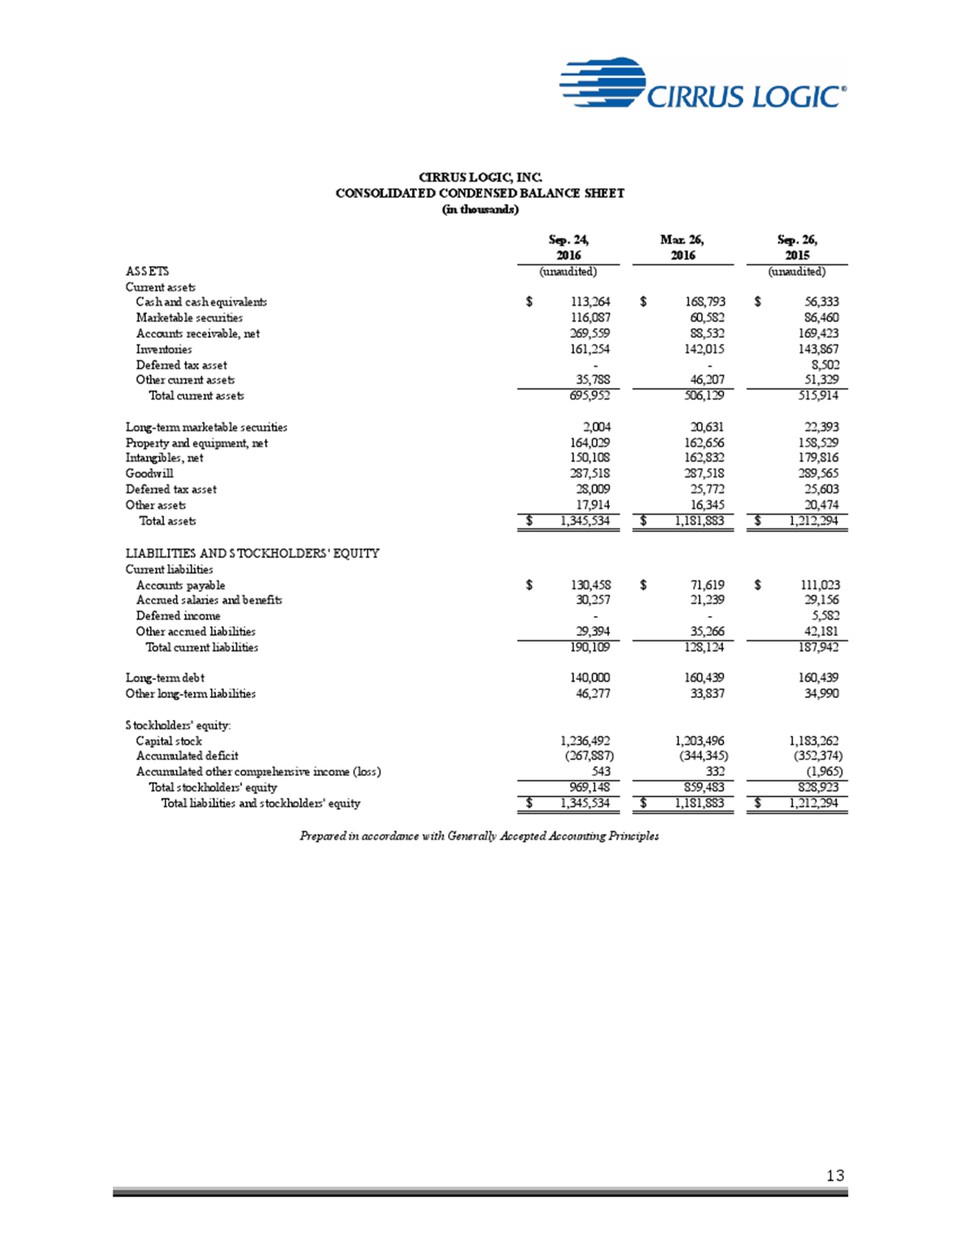
13CIRRUS LOGIC, INC. CONSOLIDATED CONDENSED BALANCE SHEET (in thousands) ASSETS (unaudited) (unaudited) Current assets Cash and cash equivalents $ 113,264 $ 168,793 $ 56,333 Marketable securities 116,087 60,582 86,460 Accounts receivable, net 269,559 88,532 169,423 Inventories 161,254 142,015 143,867 Deferred tax asset - - 8,502 Other current assets 35,788 46,207 51,329 Total current assets 695,952 506,129 515,914 Long-term marketable securities 2,004 20,631 22,393 Property and equipment, net 164,029 162,656 158,529 Intangibles, net 150,108 162,832 179,816 Goodwill 287,518 287,518 289,565 Deferred tax asset 28,009 25,772 25,603 Other assets 17,914 16,345 20,474 Total assets $ 1,345,534 $ 1,181,883 $ 1,212,294 LIABILITIES AND STOCKHOLDERS' EQUITY Current liabilities Accounts payable $ 130,458 $ 71,619 $ 111,023 Accrued salaries and benefits 30,257 21,239 29,156 Deferred income - - 5,582 Other accrued liabilities 29,394 35,266 42,181 Total current liabilities 190,109 128,124 187,942 Long-term debt 140,000 160,439 160,439 Other long-term liabilities 46,277 33,837 34,990 Stockholders' equity: Capital stock 1,236,492 1,203,496 1,183,262 Accumulated deficit (267,887) (344,345) (352,374) Accumulated other comprehensive income (loss) 543 332 (1,965) Total stockholders' equity 969,148 859,483 828,923 Total liabilities and stockholders' equity $ 1,345,534 $ 1,181,883 $ 1,212,294 Prepared in accordance with Generally Accepted Accounting Principles Sep. 24, Mar. 26, Sep. 26, 2016 2016 2015