Attached files
| file | filename |
|---|---|
| 8-K - FORM 8-K - Howmet Aerospace Inc. | d278490d8k.htm |
Exhibit 99.1
Launching November 1, 2016
ARCONIC
Innovation, engineered.
Important Information
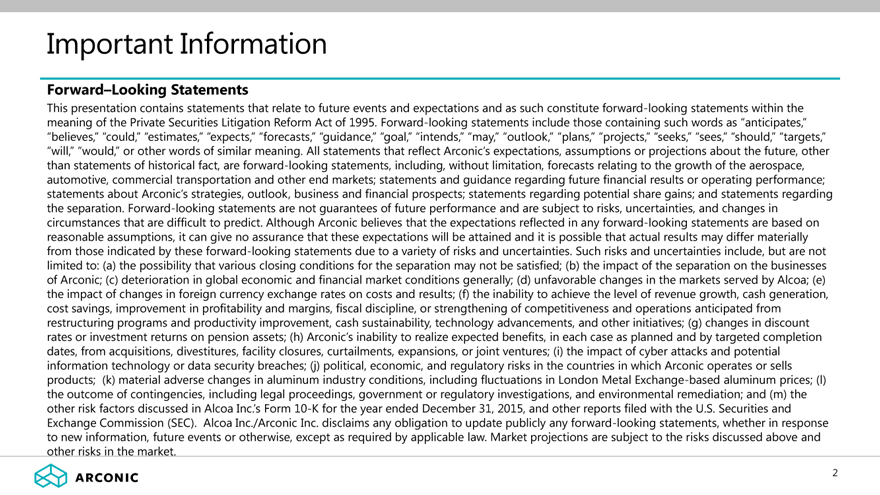
Forward–Looking Statements
This presentation contains statements that relate to future events and expectations and as such constitute forward-looking statements within the meaning of the Private Securities Litigation Reform Act of 1995. Forward-looking statements include those containing such words as “anticipates,” “believes,” “could,” “estimates,” “expects,” “forecasts,” “guidance,” “goal,” “intends,” “may,” “outlook,” “plans,” “projects,” “seeks,” “sees,” “should,” “targets,” “will,” “would,” or other words of similar meaning. All statements that reflect Arconic’s expectations, assumptions or projections about the future, other than statements of historical fact, are forward-looking statements, including, without limitation, forecasts relating to the growth of the aerospace, automotive, commercial transportation and other end markets; statements and guidance regarding future financial results or operating performance; statements about Arconic’s strategies, outlook, business and financial prospects; statements regarding potential share gains; and statements regarding the separation. Forward-looking statements are not guarantees of future performance and are subject to risks, uncertainties, and changes in circumstances that are difficult to predict. Although Arconic believes that the expectations reflected in any forward-looking statements are based on reasonable assumptions, it can give no assurance that these expectations will be attained and it is possible that actual results may differ materially from those indicated by these forward-looking statements due to a variety of risks and uncertainties. Such risks and uncertainties include, but are not limited to: (a) the possibility that various closing conditions for the separation may not be satisfied; (b) the impact of the separation on the businesses of Arconic; (c) deterioration in global economic and financial market conditions generally; (d) unfavorable changes in the markets served by Alcoa; (e) the impact of changes in foreign currency exchange rates on costs and results; (f) the inability to achieve the level of revenue growth, cash generation, cost savings, improvement in profitability and margins, fiscal discipline, or strengthening of competitiveness and operations anticipated from restructuring programs and productivity improvement, cash sustainability, technology advancements, and other initiatives; (g) changes in discount rates or investment returns on pension assets; (h) Arconic’s inability to realize expected benefits, in each case as planned and by targeted completion dates, from acquisitions, divestitures, facility closures, curtailments, expansions, or joint ventures; (i) the impact of cyber attacks and potential information technology or data security breaches; (j) political, economic, and regulatory risks in the countries in which Arconic operates or sells products; (k) material adverse changes in aluminum industry conditions, including fluctuations in London Metal Exchange-based aluminum prices; (l) the outcome of contingencies, including legal proceedings, government or regulatory investigations, and environmental remediation; and (m) the other risk factors discussed in Alcoa Inc.’s Form 10-K for the year ended December 31, 2015, and other reports filed with the U.S. Securities and Exchange Commission (SEC). Alcoa Inc./Arconic Inc. disclaims any obligation to update publicly any forward-looking statements, whether in response to new information, future events or otherwise, except as required by applicable law. Market projections are subject to the risks discussed above and other risks in the market.
ARCONIC
2
Important Information (continued)
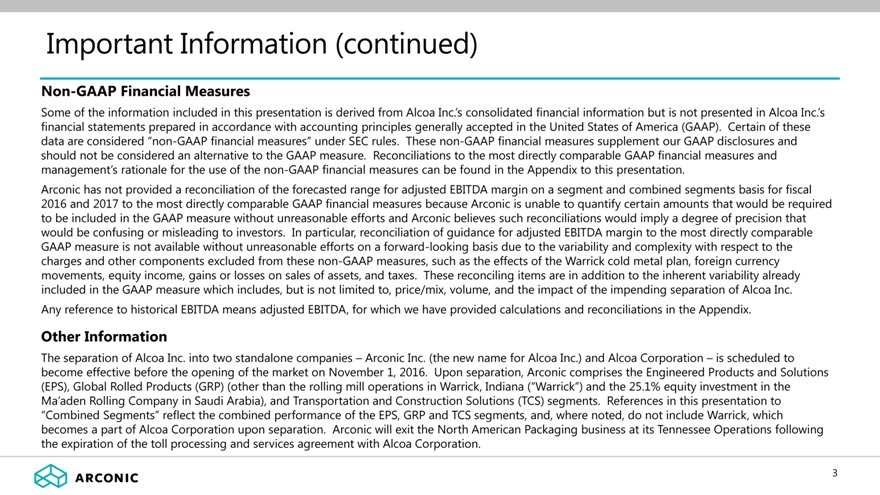
Non-GAAP Financial Measures
Some of the information included in this presentation is derived from Alcoa Inc.’s consolidated financial information but is not presented in Alcoa Inc.’s financial statements prepared in accordance with accounting principles generally accepted in the United States of America (GAAP). Certain of these data are considered “non-GAAP financial measures” under SEC rules. These non-GAAP financial measures supplement our GAAP disclosures and should not be considered an alternative to the GAAP measure. Reconciliations to the most directly comparable GAAP financial measures and management’s rationale for the use of the non-GAAP financial measures can be found in the Appendix to this presentation.
Arconic has not provided a reconciliation of the forecasted range for adjusted EBITDA margin on a segment and combined segments basis for fiscal 2016 and 2017 to the most directly comparable GAAP financial measures because Arconic is unable to quantify certain amounts that would be required to be included in the GAAP measure without unreasonable efforts and Arconic believes such reconciliations would imply a degree of precision that would be confusing or misleading to investors. In particular, reconciliation of guidance for adjusted EBITDA margin to the most directly comparable GAAP measure is not available without unreasonable efforts on a forward-looking basis due to the variability and complexity with respect to the charges and other components excluded from these non-GAAP measures, such as the effects of the Warrick cold metal plan, foreign currency movements, equity income, gains or losses on sales of assets, and taxes. These reconciling items are in addition to the inherent variability already included in the GAAP measure which includes, but is not limited to, price/mix, volume, and the impact of the impending separation of Alcoa Inc. Any reference to historical EBITDA means adjusted EBITDA, for which we have provided calculations and reconciliations in the Appendix.
Other Information
The separation of Alcoa Inc. into two standalone companies – Arconic Inc. (the new name for Alcoa Inc.) and Alcoa Corporation – is scheduled to become effective before the opening of the market on November 1, 2016. Upon separation, Arconic comprises the Engineered Products and Solutions
(EPS), Global Rolled Products (GRP) (other than the rolling mill operations in Warrick, Indiana (“Warrick”) and the 25.1% equity investment in the
Ma’aden Rolling Company in Saudi Arabia), and Transportation and Construction Solutions (TCS) segments. References in this presentation to “Combined Segments” reflect the combined performance of the EPS, GRP and TCS segments, and, where noted, do not include Warrick, which becomes a part of Alcoa Corporation upon separation. Arconic will exit the North American Packaging business at its Tennessee Operations following the expiration of the toll processing and services agreement with Alcoa Corporation.
ARCONIC
3

Launching a Strong Company – Arconic
Key Strengths
Strongly Positioned in Attractive Markets
Secular growth, compelling margins: Aerospace and Transportation (~65% revenues)
Solid growth, attractive margins: Specialty, Industrial, Building & Construction (~35% revenues)
Clear Market Leader in Major Sectors
~70% Revenues #1/#2 leadership positions Major supplier to the industry leaders in all sectors
Driver of Differentiated Innovation / Advanced Technology Solutions
Development partner to industry leaders driving share gain
Unparalleled capabilities in multi-materials, manufacturing processes, and application engineering Track record of breakthrough advances Innovation-driven engineering culture and extensive R&D base
Compelling Financial Profile
Attractive margin profile with significant future profitable growth upside
Relentless pursuit of cost reduction; consistently delivering productivity improvements Disciplined capital allocation with priority on high-return uses Retained interest of 19.9% of Alcoa Corporation available for monetization
Management Team and Culture Focused on Performance and Creating Value
Proven track record Strong value orientation
4
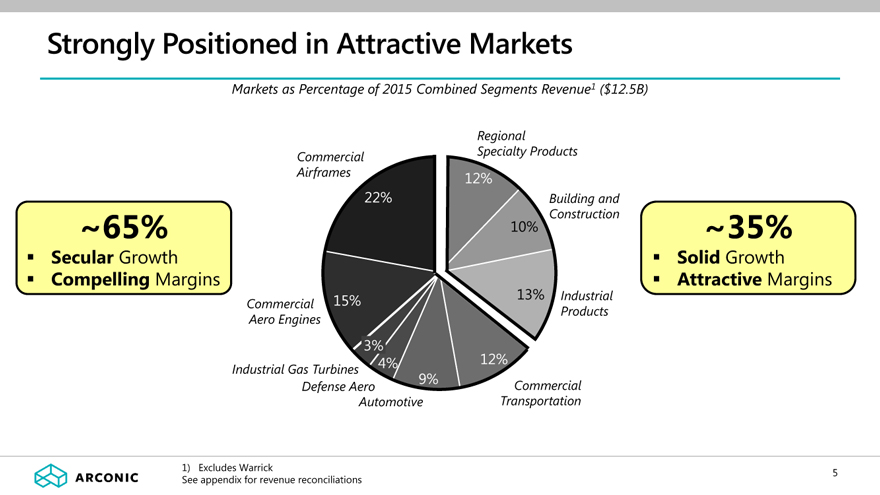
Strongly Positioned in Attractive Markets
Markets as Percentage of 2015 Combined Segments Revenue1 ($12.5B)
~65%
Secular Growth
Compelling Margins
Commercial Airframes
Commercial Aero Engines
Industrial Gas Turbines Defense Aero Automotive
Regional
Specialty Products
Building and Construction
Industrial Products
Commercial Transportation
22%
12%
15%
3%
4%
9%
12%
13%
10%
~35%
Solid Growth
Attractive Margins
1) Excludes Warrick
See appendix for revenue reconciliations
ARCONIC
5
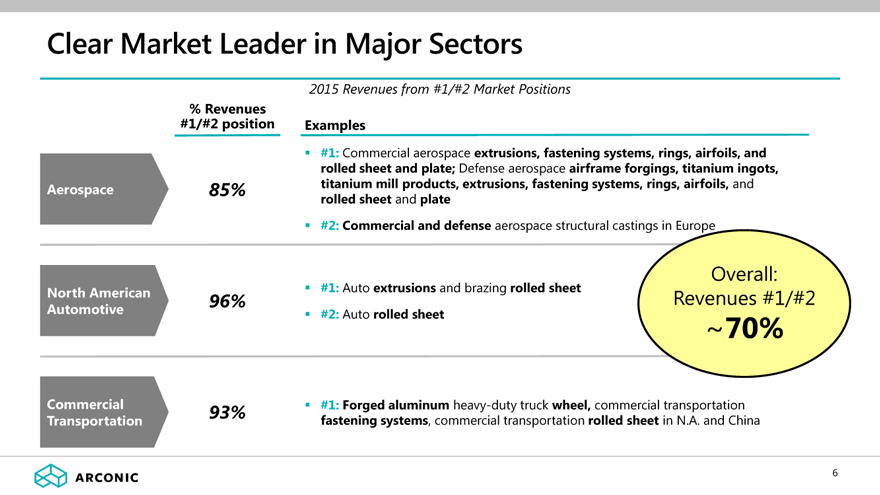
Clear Market Leader in Major Sectors
2015 Revenues from #1/#2 Market Positions
% Revenues #1/#2 position
Examples
Aerospace
85%
#1: Commercial aerospace extrusions, fastening systems, rings, airfoils, and rolled sheet and plate; Defense aerospace airframe forgings, titanium ingots, titanium mill products, extrusions, fastening systems, rings, airfoils, and rolled sheet and plate
#2: Commercial and defense aerospace structural castings in Europe
North American Automotive
#1: Auto extrusions and brazing rolled sheet
96%
#2: Auto rolled sheet
Commercial Transportation
93%
#1: Forged aluminum heavy-duty truck wheel, commercial transportation fastening systems, commercial transportation rolled sheet in N.A. and China
Overall:
Revenues #1/#2
~70%
ARCONIC
6
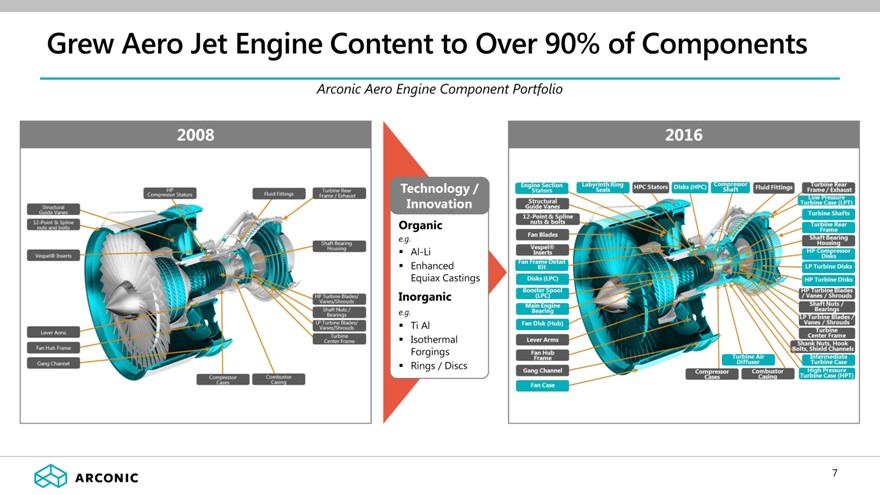
Grew Aero Jet Engine Content to Over 90% of Components
Arconic Aero Engine Component Portfolio
2008
Technology / Innovation
Organic
e.g.
Al-Li ? Enhanced Equiax Castings
Inorganic
e.g. :
Ti Al ? Isothermal Forgings ? Rings / Discs
2016
7
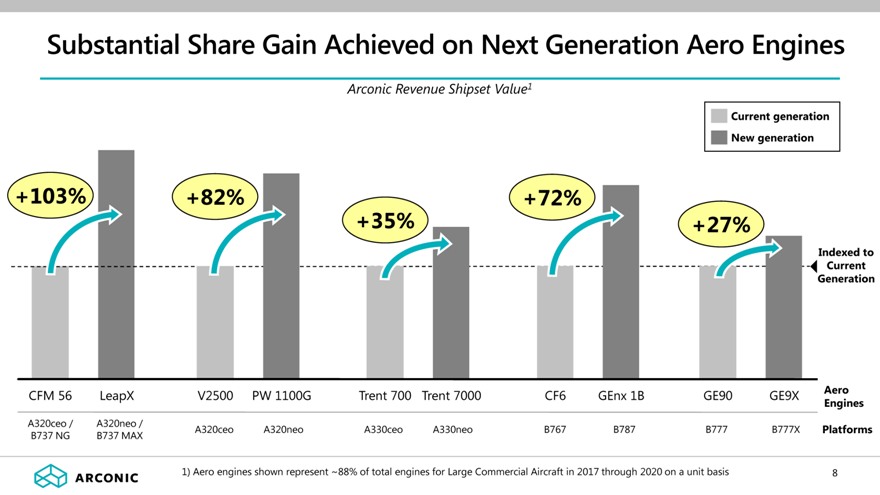
Substantial Share Gain Achieved on Next Generation Aero Engines
Arconic Revenue Shipset Value1
Current generation
New generation
+103%
+82%
+72%
+35%
+27%
Indexed to Current Generation
CFM 56
LeapX
V2500
PW 1100G
Trent 700
Trent 7000
CF6
GEnx 1B
GE90
GE9X
Aero Engines
A320ceo / B737 NG
A320neo / B737 MAX
A320ceo
A320neo
A330ceo
A330neo
B767
B787
B777
B777X
Platforms
1) Aero engines shown represent ~88% of total engines for Large Commercial Aircraft in 2017 through 2020 on a unit basis
ARCONIC
8
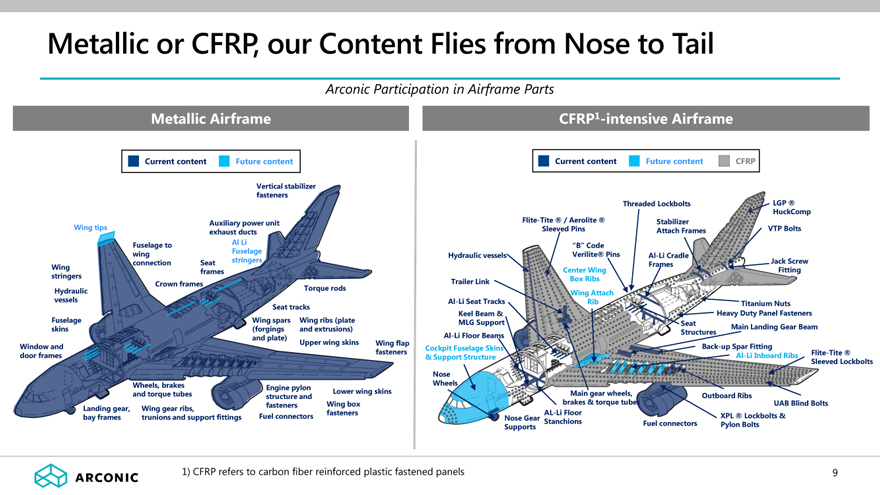
Metallic or CFRP, our Content Flies from Nose to Tail Arconic Participation in Airframe Parts Metallic Airframe Current content Future content Wing tips Wing stringers Hydraulic vessels Fuselage skins Window and door frames Fuselage to wing connection Crown frames Seat frames Auxiliary power unit exhaust ducts Al Li Fuselage stringers Vertical stabilizer fasteners Landing gear, bay frames Wheels, brakes and torque tubes Wing gear ribs, trunions and support fittings Torque rods Seat tracks Wing spars (forgings and plate) Wing ribs (plate and extrusions) Upper wing skins Wing flap fasteners Lower wing skins Wing box fasteners Engine pylon structure and fasteners Fuel connectors CFRP1-intensive Airframe Current content Future content CFRP Hydraulic vessels Trailer Link Al-Li Seat Tracks Keel Beam & MLG Support Al-Li Floor Beams Cockpit Fuselage Skins & Support Structure Nose Wheels Flite-Tite ® / Aerolite ® Sleeved Pins “B” Code Verilite® Pins Center Wing Box Ribs Wing Attach Rib Nose Gear Supports AL-Li Floor Stanchions Main gear wheels, brakes & torque tubes Threaded Lockbolts Stabilizer Attach Frames Al-Li Cradle FramesLGP ® HuckComp VTP Bolts Jack Screw Fitting Seat Structures Titanium Nuts Heavy Duty Panel Fasteners Main Landing Gear Beam Back-up Spar Fitting Al-Li Inboard Ribs Flite-Tite ® Sleeved Lockbolts Outboard Ribs Fuel connectors XPL ® Lockbolts & Pylon Bolts UAB Blind Bolts 1) CFRP refers to carbon fiber reinforced plastic fastened panels ARCONIC 9
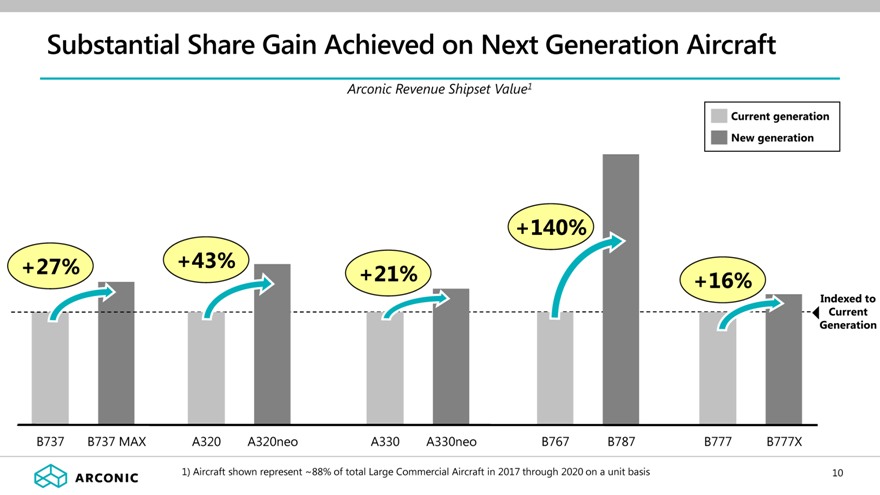
Substantial Share Gain Achieved on Next Generation Aircraft Arconic Revenue Shipset Value1 Current generation New generation +27% +43% +21% +140% +16% Indexed to Current Generation B737 B737 MAX A320 A320neo A330 A330neo B767 B787 B777 B777X 1) Aircraft shown represent ~88% of total Large Commercial Aircraft in 2017 through 2020 on a unit basis ARCONIC 10
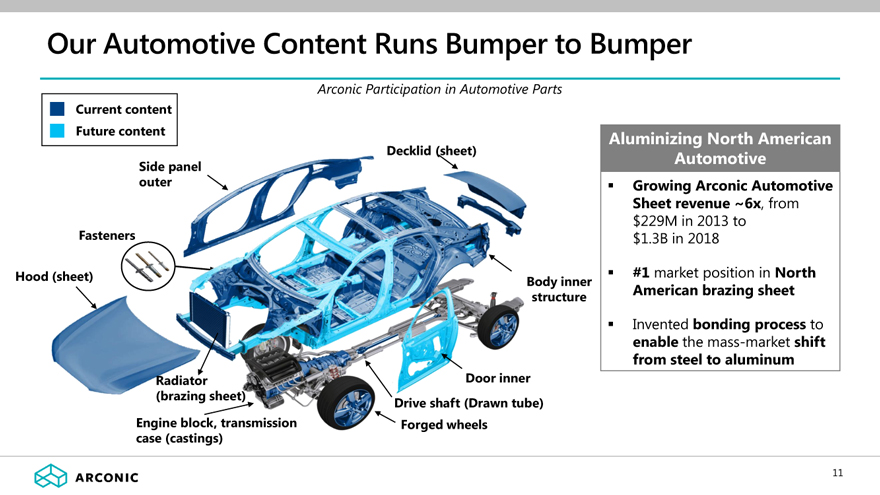
Our Automotive Content Runs Bumper to Bumper Arconic Participation in Automotive Parts Current content Future content Side panel outer Fasteners Hood (sheet) Decklid (sheet) Radiator (brazing sheet) Engine block, transmission case (castings) Body inner structure Door inner Drive shaft (Drawn tube) Forged wheels Aluminizing North American Automotive Growing Arconic Automotive Sheet revenue ~6x, from $229M in 2013 to $1.3B in 2018 #1 market position in North American brazing sheet Invented bonding process to enable the mass-market shift from steel to aluminum ARCONIC 11
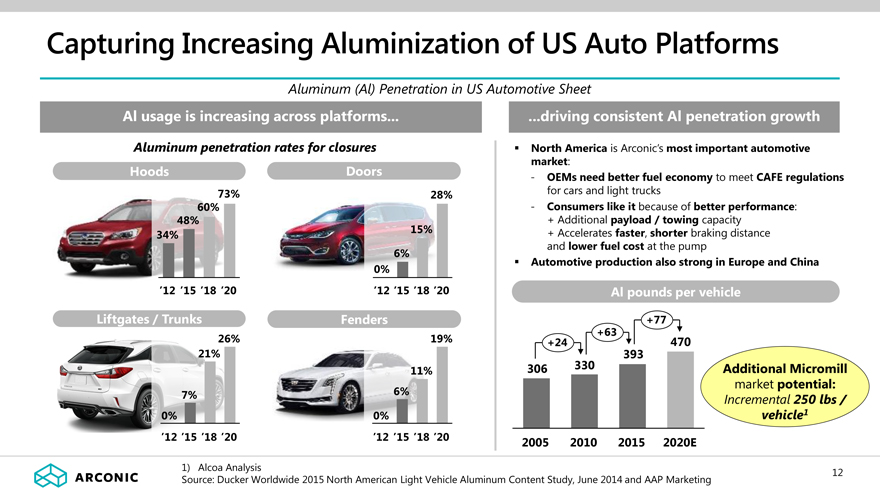
Capturing Increasing Aluminization of US Auto Platforms
Aluminum (Al) Penetration in US Automotive Sheet
Al usage is increasing across platforms
Aluminum penetration rates for closures
Hoods Doors
73% 28% 60% 48% 34% 15% 6% 0%
‘12 ‘15 ‘18 ‘20 ‘12 ‘15 ‘18 ‘20
Liftgates / Trunks Fenders
26% 19% 21% 11%
7% 6%
0% 0%
‘12 ‘15 ‘18 ‘20 ‘12 ‘15 ‘18 ‘20
...driving consistent Al penetration growth
North America is Arconic’s most important automotive market:
- OEMs need better fuel economy to meet CAFE regulations for cars and light trucks
- Consumers like it because of better performance:
+ Additional payload / towing capacity
+ Accelerates faster, shorter braking distance and lower fuel cost at the pump
Automotive production also strong in Europe and China
Al pounds per vehicle
+77 +63 +24 470
393
306 330 Additional Micromill market potential:
Incremental 250 lbs / vehicle1
2005 2010 2015 2020E
1) Alcoa Analysis Source: Ducker Worldwide 2015 North American Light Vehicle Aluminum Content Study, June 2014 and AAP Marketing
12
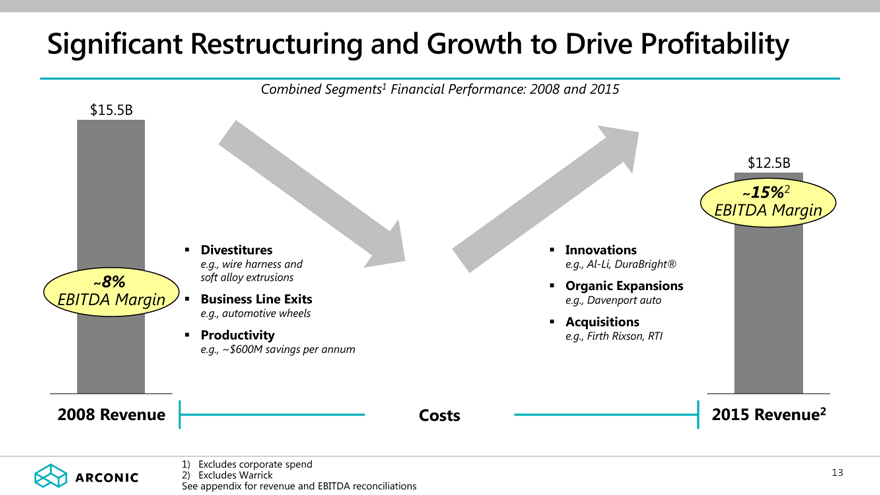
Significant Restructuring and Growth to Drive Profitability Combined Segments1 Financial Performance: 2008 and 2015 $15.5B EBITDA ~8% Margin Divestitures e.g., wire harness and soft alloy extrusions Business Line Exits e.g., automotive wheels Productivity e.g., ~$600M savings per annum Innovations e.g., Al-Li, DuraBright® Organic Expansions e.g., Davenport auto Acquisitions e.g., Firth Rixson, RTI $12.5B ~15%2 EBITDA Margin 2008 Revenue Costs 2015 Revenue2 1) Excludes corporate spend 2) Excludes Warrick See appendix for revenue and EBITDA reconciliations ARCONIC 12
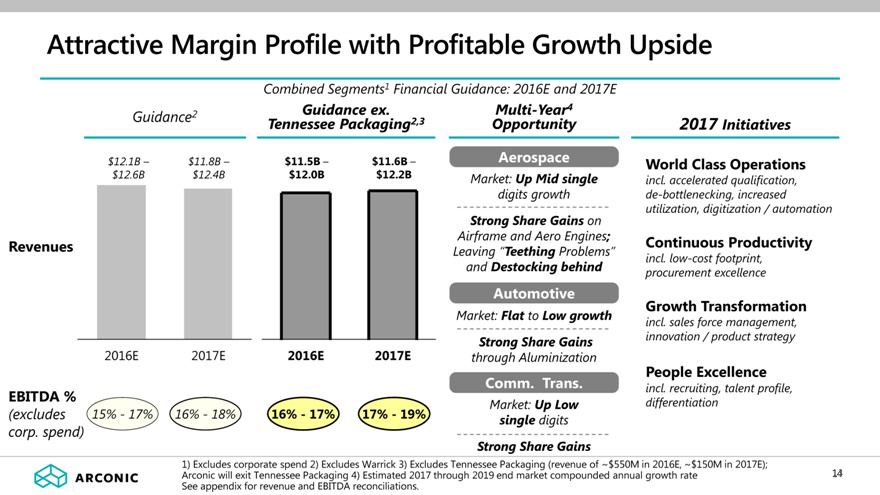
Attractive Margin Profile with Profitable Growth Upside
Combined Segments1 Financial Guidance: 2016E and 2017E
Guidance2
$12.1B – $11.8B – $12.6B $12.4B
Revenues
2016E 2017E
Guidance ex. Tennessee Packaging2,3
$11.5B – $11.6B – $12.0B $12.2B
2016E 2017E
Multi-Year4 Opportunity
Aerospace
Market: Up Mid single digits growth Strong Share Gains on Airframe and Aero Engines;
Leaving “Teething Problems” and Destocking behind
Automotive
Market: Flat to Low growth Strong Share Gains through Aluminization
Comm. Trans.
Market: Up Low single digits Strong Share Gains
2017 Initiatives
World Class Operations
incl. accelerated qualification, de-bottlenecking, increased utilization, digitization / automation
Continuous Productivity
incl. low-cost footprint, procurement excellence
Growth Transformation
incl. sales force management, innovation / product strategy
People Excellence
incl. recruiting, talent profile, differentiation
EBITDA %
(excludes 15% - 17% 16% - 18% 16% - 17% 17% - 19% corp. spend)
1) Arconic Excludes will corporate exit Tennessee spend Packaging 2) Excludes 4) Warrick Estimated 3) 2017 Excludes through Tennessee 2019 end Packaging market (revenue compounded of ~$ annual 550M in growth 2016E, rate ~$150M in 2017E); See appendix for revenue and EBITDA reconciliations.
13
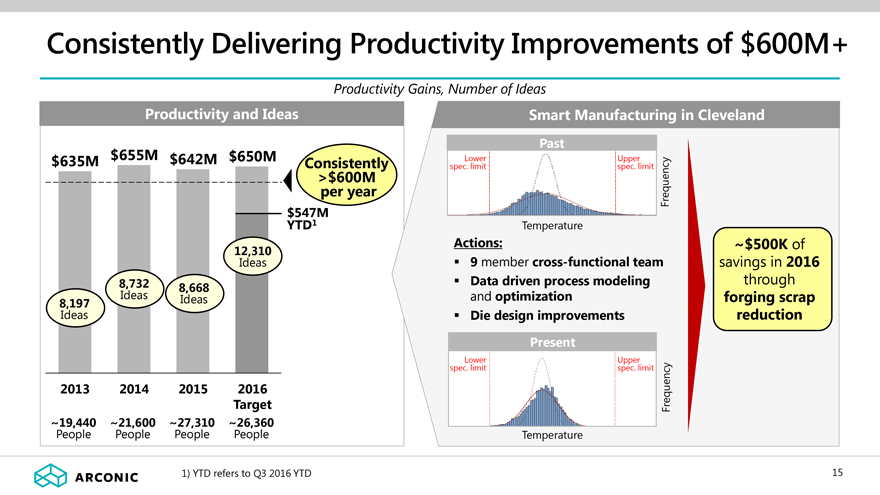
Consistently Delivering Productivity Improvements of $600M+
Productivity Gains, Number of Ideas
Productivity and Ideas
$635M $655M $642M $650M
Consistently
>$600M per year $547M YTD1
12,310
Ideas
8,732 8,668
Ideas Ideas
8,197
Ideas
2013 2014 2015 2016 Target
~19,440 ~21,600 ~27,310 ~26,360
People People People People
Smart Manufacturing in Cleveland
Past
Lower Upper
spec. limit spec. limit
Frequency
Temperature
Actions: ~$500K of
9 member cross-functional team savings in 2016
Data driven process modeling through
and optimization forging scrap
Die design improvements reduction
Present
Lower Upper
spec. limit spec. limit
Frequency
Temperature
1) YTD refers to Q3 2016 YTD 15

Leading Edge in Additive Manufacturing Helps Customers Win
APPLICATION MATERIAL KNOWLEDGE SCIENCE
e.g. e.g.
- World-class team
- Wide range of industries
e.g., Aero Engines, Airframes, Auto, of experts Comm. Trans., Bldg. & Constr. - Leading in alloy and
- Deep customer process development intimacy and coating
DESIGN MANUFACTURING OPTIMIZATION TECHNIQUES e.g. QUALIFICATION e.g.
- New 3D design tools, - Broad range of simulations/predictive EXPERTISE process expertise
models e.g. e.g., forgings, castings, powder
- Certification process production
- Rapid prototyping e.g., powder grain structure
- Hybrid solutions
- Inspection Know e.g., AmpliforgeTM
How
16
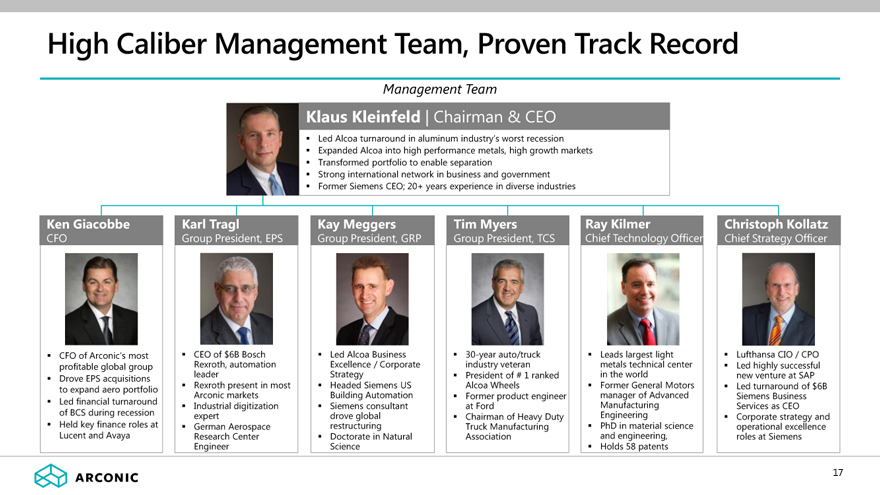
High Caliber Management Team, Proven Track Record
Management Team
Klaus Kleinfeld Chairman & CEO
Led Alcoa turnaround in aluminum industry’s worst recession
Expanded Alcoa into high performance metals, high growth markets
Transformed portfolio to enable separation
Strong international network in business and government
Former Siemens CEO; 20+ years experience in diverse industries
Ken Giacobbe
CFO
CFO of Arconic’s most profitable global group
Drove EPS acquisitions to expand aero portfolio
Led financial turnaround of BCS during recession
Held key finance roles at Lucent and Avaya
Karl Tragl
Group President, EPS
CEO of $6B Bosch Rexroth, automation leader
Rexroth present in most Arconic markets
Industrial digitization expert
German Aerospace Research Center Engineer
Kay Meggers
Group President, GRP
Led Alcoa Business Excellence / Corporate Strategy
Headed Siemens US Building Automation
Siemens consultant drove global restructuring
Doctorate in Natural Science
Tim Myers
Group President, TCS
30-year auto/truck industry veteran
President of # 1 ranked Alcoa Wheels
Former product engineer at Ford
Chairman of Heavy Duty Truck Manufacturing Association
Ray Kilmer
Chief Technology Officer
Leads largest light metals technical center in the world
Former General Motors manager of Advanced Manufacturing Engineering
PhD in material science and engineering,
Holds 58 patents
Christoph Kollatz
Chief Strategy Officer
Lufthansa CIO / CPO
Led highly successful new venture at SAP
Led turnaround of $6B Siemens Business Services as CEO
Corporate strategy and operational excellence roles at Siemens
ARCONIC
14
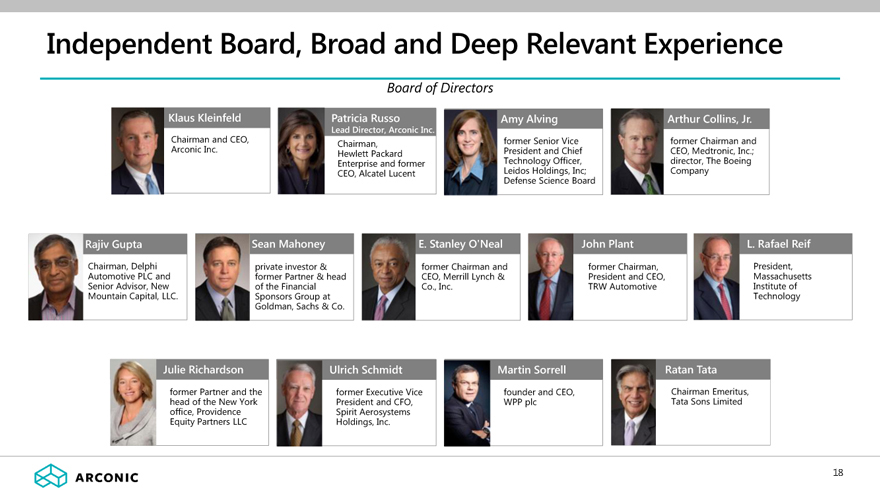
Independent Board, Broad and Deep Relevant Experience
Board of Directors
Klaus Kleinfeld
Chairman and CEO, Arconic Inc.
Patricia Russo
Lead Director, Arconic Inc.
Chairman,
Hewlett Packard Enterprise and former CEO, Alcatel Lucent
Amy Alving
former Senior Vice President and Chief Technology Officer, Leidos Holdings, Inc; Defense Science Board
Arthur Collins, Jr.
former Chairman and CEO, Medtronic, Inc.; director, The Boeing Company
Rajiv Gupta
Chairman, Delphi Automotive PLC and Senior Advisor, New Mountain Capital, LLC.
Sean Mahoney
private investor & former Partner & head of the Financial Sponsors Group at Goldman, Sachs & Co.
E. Stanley O’Neal
former Chairman and CEO, Merrill Lynch & Co., Inc.
John Plant
former Chairman, President and CEO, TRW Automotive
L. Rafael Reif
President, Massachusetts Institute of Technology
Julie Richardson
former Partner and the head of the New York office, Providence Equity Partners LLC
Ulrich Schmidt
former Executive Vice President and CFO, Spirit Aerosystems Holdings, Inc.
Martin Sorrell
founder and CEO, WPP plc
Ratan Tata
Chairman Emeritus, Tata Sons Limited
ARCONIC
15
Customer and Talent Focused Culture
Mission and Values
ARCONIC
Everyone, Everyday,
Everywhere…
We win when our customers win – we innovate, deliver and operate as world class.
We excel as high performance teams – safely, with respect and integrity.
ARCONIC
16
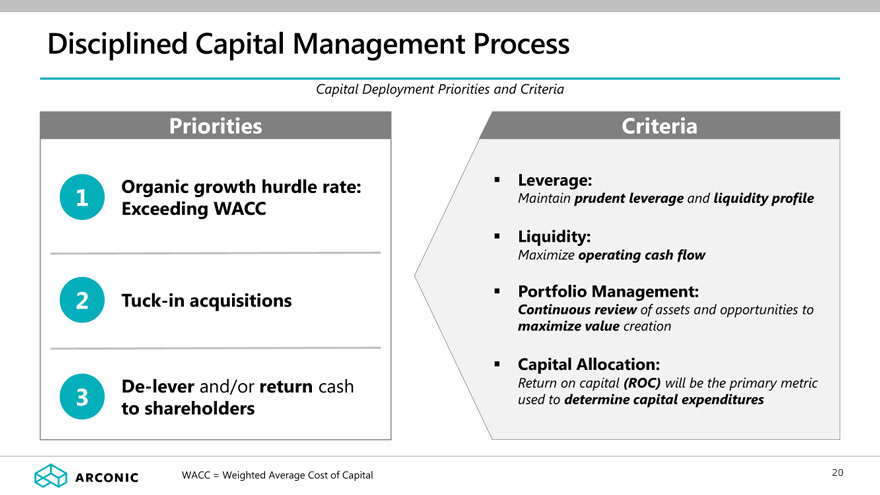
Disciplined Capital Management Process
Capital Deployment Priorities and Criteria
Priorities
1 Organic growth hurdle rate: Exceeding WACC
2 Tuck-in acquisitions
3 De-lever and/or return cash to shareholders
Criteria
Leverage:
Maintain prudent leverage and liquidity profile
Liquidity:
Maximize operating cash flow
Portfolio Management:
Continuous review of assets and opportunities to maximize value creation
Capital Allocation:
Return on capital (ROC) will be the primary metric used to determine capital expenditures
WACC = Weighted Average Cost of Capital
ARCONIC
17
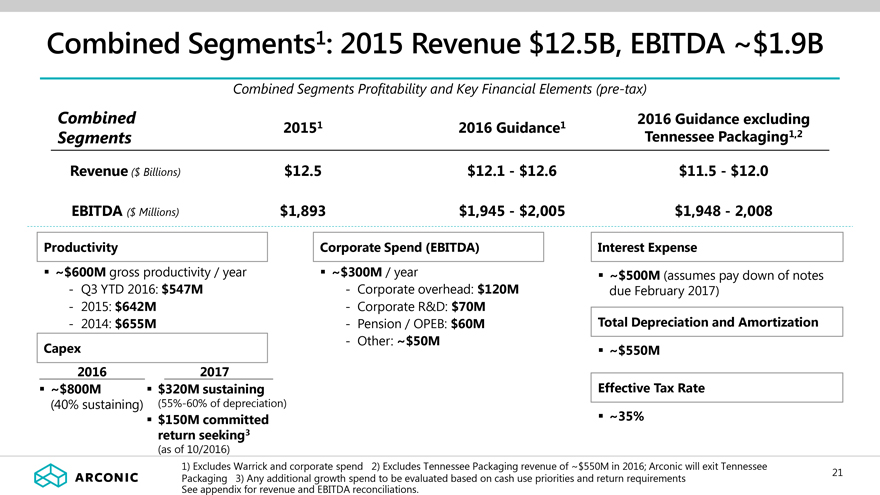
Combined Segments1: 2015 Revenue $12.5B, EBITDA ~$1.9B
Combined Segments Profitability and Key Financial Elements (pre-tax)
Combined 2016 Guidance excluding
20151 2016 Guidance1
Segments Tennessee Packaging1,2
Revenue ($ Billions) $12.5 $12.1 - $12.6 $11.5 - $12.0
EBITDA ($ Millions) $1,893 $1,945 - $2,005 $1,948 - 2,008
Productivity
~$600M gross productivity / year
- Q3 YTD 2016: $547M
- 2015: $ 642M
- 2014: $ 655M
Capex
2016 2017
~$800M $320M sustaining
(40% sustaining) (55%-60% of depreciation)
$150M committed
return seeking3
(as of 10/2016)
Corporate Spend (EBITDA)
~$300M / year
- Corporate overhead: $120M
- Corporate R&D: $70M
- Pension / OPEB: $60M
- Other: ~$50M
Interest Expense
~$500M (assumes pay down of notes
due February 2017)
Total Depreciation and Amortization
~$550M
Effective Tax Rate
~35%
1) Excludes Warrick and corporate spend 2) Excludes Tennessee Packaging revenue of ~$550M in 2016; Arconic will exit Tennessee
Packaging 3) Any additional growth spend to be evaluated based on cash use priorities and return requirements
See appendix for revenue and EBITDA reconciliations.
21
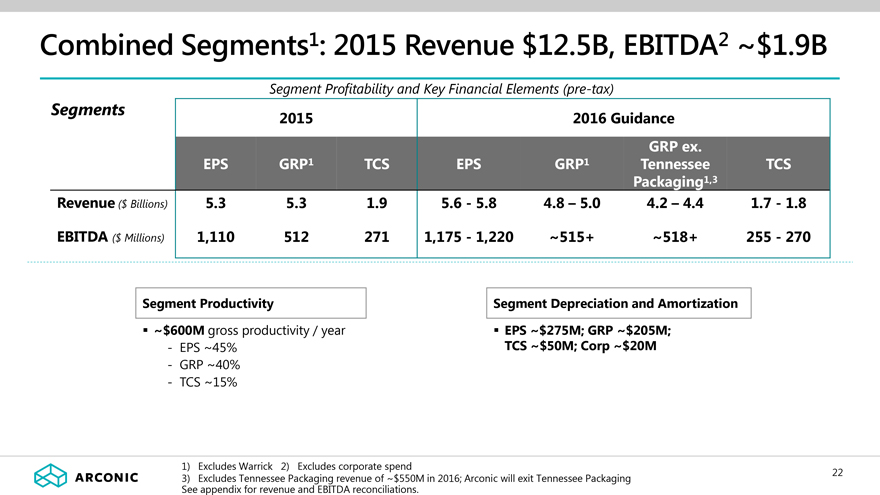
Combined Segments1: 2015 Revenue $12.5B, EBITDA2 ~$1.9B
Segment Profitability and Key Financial Elements (pre-tax)
Segments 2015 2016 Guidance
GRP ex.
EPS GRP1 TCS EPS GRP1 Tennessee TCS
Packaging1,3
Revenue ($ Billions) 5.3 5.3 1.9 5.6 - 5.8 4.8 – 5.0 4.2 – 4.4 1.7 - 1.8
EBITDA ($ Millions) 1,110 512 271 1,175 - 1,220 ~515+ ~518+ 255 - 270
Segment Productivity
~$600M gross productivity / year
- EPS ~45%
- GRP ~40%
- TCS ~15%
Segment Depreciation and Amortization
EPS ~$275M; GRP ~$205M;
TCS ~$50M; Corp ~$20M
1) Excludes Warrick 2) Excludes corporate spend
3) Excludes Tennessee Packaging revenue of ~$550M in 2016; Arconic will exit Tennessee Packaging
See appendix for revenue and EBITDA reconciliations.
22
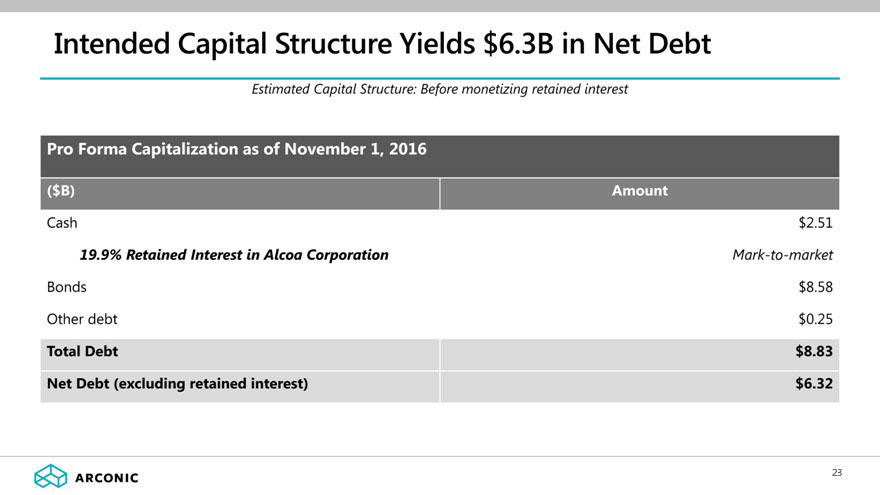
Intended Capital Structure Yields $6.3B in Net Debt
Estimated Capital Structure: Before monetizing retainer interest
Pro Forma Capitalization as of November 1, 2016
($B) Amount
Cash $2.51
19.9% Retained Interest in Alcoa Corporation Mark-to-market
Bonds $8.58
Other debt $0.25
Total Debt $8.83
Net Debt (excluding retained interest) $6.32
ARCONIC 20
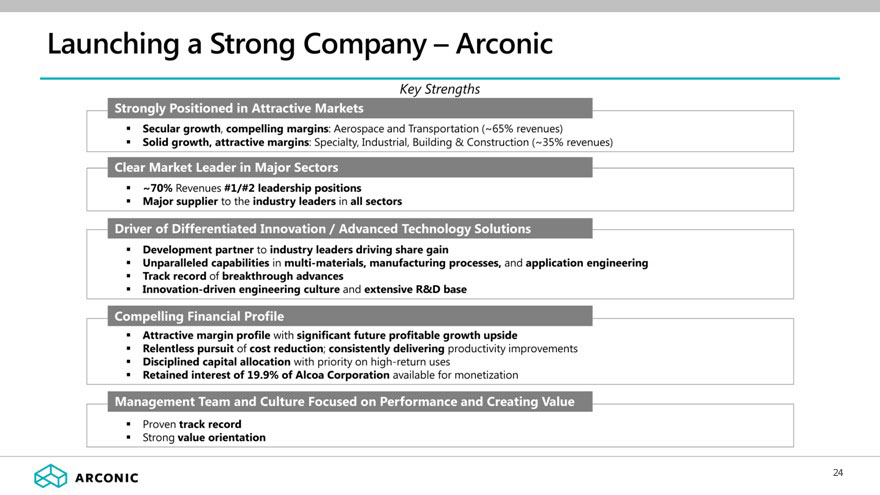
Launching a Strong Company – Arconic
Key Strengths
Strongly Positioned in Attractive Markets
Secular growth, compelling margins: Aerospace and Transportation (~65% revenues)
Solid growth, attractive margins: Specialty, Industrial, Building & Construction (~35% revenues)
Clear Market Leader in Major Sectors
~70% Revenues #1/#2 leadership positions Major supplier to the industry leaders in all sectors
Driver of Differentiated Innovation / Advanced Technology Solutions
Development partner to industry leaders driving share gain
Unparalleled capabilities in multi-materials, manufacturing processes, and application engineering Track record of breakthrough advances Innovation-driven engineering culture and extensive R&D base
Compelling Financial Profile
Attractive margin profile with significant future profitable growth upside
Relentless pursuit of cost reduction; consistently delivering productivity improvements Disciplined capital allocation with priority on high-return uses Retained interest of 19.9% of Alcoa Corporation available for monetization
Management Team and Culture Focused on Performance and Creating Value
Proven track record Strong value orientation
21
Appendix
ARCONIC
Innovation, engineered.
ARCONIC 22
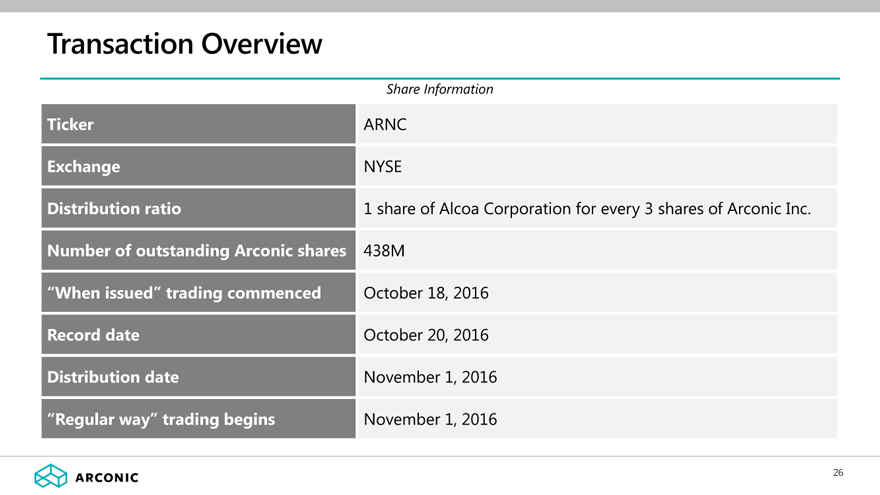
Transaction Overview
Share Information
Ticker ARNC
Exchange NYSE
Distribution ratio 1 share of Alcoa Corporation for every 3 shares of Arconic Inc.
Number of outstanding Arconic shares 438M
“When issued” trading commenced October 18, 2016
Record date October 20, 2016
Distribution date November 1, 2016
“Regular way” trading begins November 1, 2016
ARCONIC 23
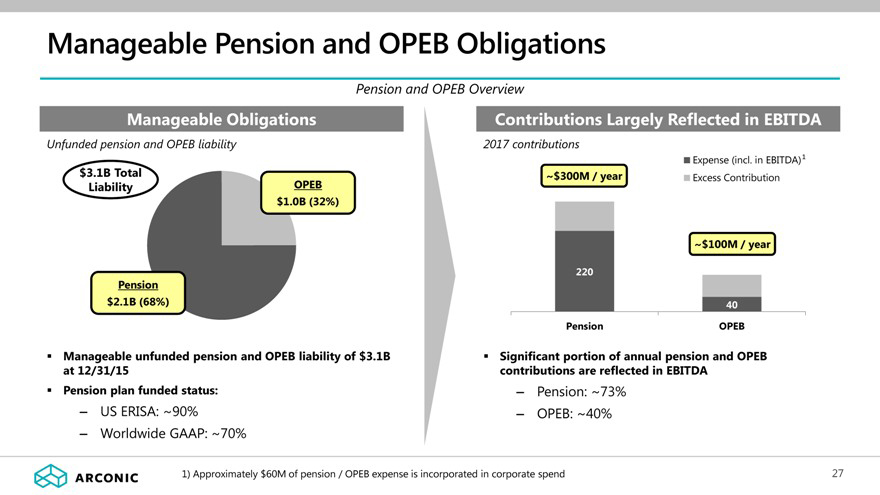
Manageable Pension and OPEB Obligations
Pension and OPEB Overview
Manageable Obligations
Unfunded pension and OPEB liability $3.1B Total OPEB
Liability $1.0B (32%)
Pension $2.1B (68%)
Manageable unfunded pension and OPEB liability of $3.1B at 12/31/15 Pension plan funded status:
US ERISA: ~90%
Worldwide GAAP: ~70%
Contributions Largely Reflected in EBITDA
2017 contributions
Expense (incl. in EBITDA) 1
~$300M / year Excess Contribution
~$100M / year
220
40 Pension OPEB
Significant portion of annual pension and OPEB contributions are reflected in EBITDA
Pension: ~73%
OPEB: ~40%
1) Approximately $60M of pension / OPEB expense is incorporated in corporate spend
24
Near-term Financial Reporting
Near-term Financial Reporting Overview
Arconic Unaudited Pro Formas (November 2016):
- Include income statements for the six months ended June 30, 2016 and the fiscal years ended December 31, 2015, December 31, 2014, and December 31, 2013. Includes balance sheet as of June 30, 2016.
- Illustrate the estimated effects of the separation of Alcoa Corporation from the historical combined company (Alcoa Inc. which will be renamed as Arconic). Shared costs not specifically identified as Alcoa Corporation such as Selling, General, and Administrative Expense, Research and Development Expense, Interest Expense, and Taxes will remain in Arconic’s historical results.
- Results are not necessarily indicative of what Arconic’s past or future results of operations or financial condition would have been had the separation been completed prior to the dates presented.
Arconic 3rd Quarter 2016 10-Q (November 2016):
- For the final time, the 3rd Quarter 2016 10-Q filed by Arconic will include Alcoa Corporation’s results, including comparable historical periods, in Arconic’s continuing operations.
Arconic 4th Quarter Earnings Release (January 2017) and Annual 2016 10-K (February 2017):
- Beginning in the fourth quarter of 2016, Alcoa Corporation’s historical financial results for periods prior to the separation will be reflected in Arconic’s consolidated financial statements as discontinued operations.
ARCONIC 25
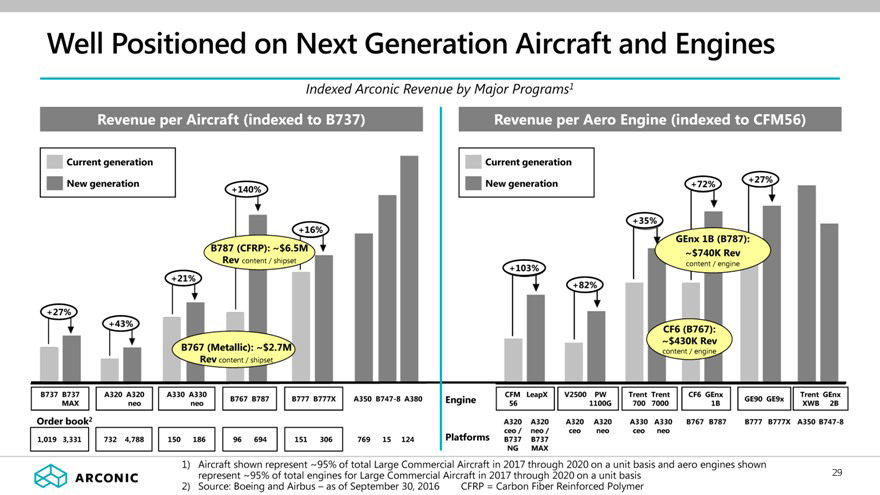
Well Positioned on Next Generation Airframes and Engines
Indexed Arconic Revenue by Major Programs1
Revenue per Airframe (indexed to B737 NG)
Current generation
New generation
+27% +43% +21% +140% +16% B787 (CFRP): ~$6.5M Rev content / shipset
B767 (Metallic): ~$2.7M Rev content / shipset
B737 B737 MAX A320 A320 neo A330 A330 neo B767 B787 B777 B777X A350 B747-8 A380
Order book2
1,019 3,331 732 4,788 150 186 96 694 151 306 769 15 124
Revenue per Aero Engine (indexed to CFM56)
Current generation
New generation
+103% +82% +35% +72% +27%
GEnx 1B (B787): ~$740K Rev content / engine
CF6 (B767): ~$430K Rev content / engine
Engine
CFM LeapX 56 V2500 PW 1100G Trent Trent 700 7000 CF6 GEnx 1B GE90 GE9x Trent GEnx XWB 2B
Platforms
A320 ceo / B737 NG A320 neo / B737 MAX A320 ceo A320 neo A330 ceo A330 neo B767 B787 B777 B777X A350 B747-8
1) Aircraft shown represent ~95% of total Large Commercial Aircraft in 2017 through 2020 on a unit basis and aero engines shown represent ~95% of total engines for Large Commercial Aircraft in 2017 through 2020 on a unit basis
2) Source: Boeing and Airbus – as of September 30, 2016 CFRP = Carbon Fiber Reinforced Polymer
ARCONIC 26
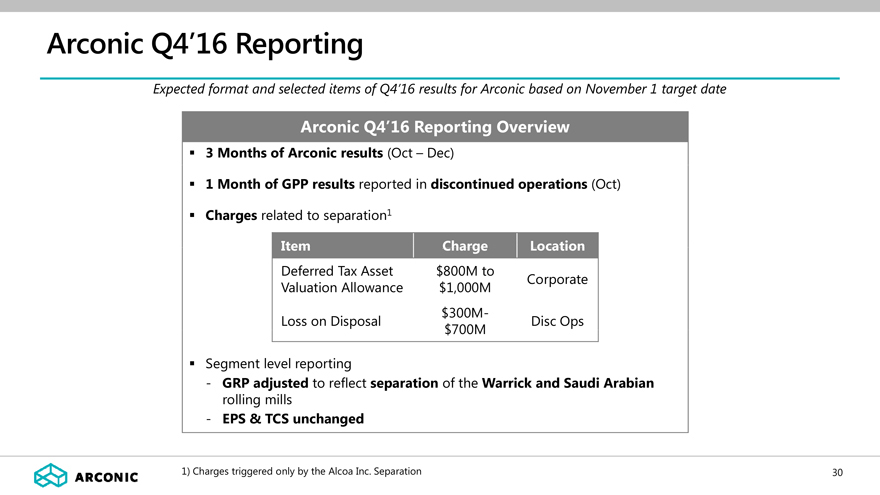
Arconic Q4’16 Reporting
Expected format and selected items of Q4’16 results for Arconic based on November 1 target date
Arconic Q4’16 Reporting Overview
3 Months of Arconic results (Oct – Dec)
1 Month of GPP results reported in discontinued operations (Oct)
Charges related to separation1
Item Charge Location
Deferred Tax Asset $800M to Corporate
Valuation Allowance $1,000M
$300M-
Loss on Disposal Disc Ops
$700M
Segment level reporting
- GRP adjusted to reflect separation of the Warrick and Saudi Arabian
rolling mills
- EPS & TCS unchanged
1) Charges triggered only by the Alcoa Inc. Separation 30
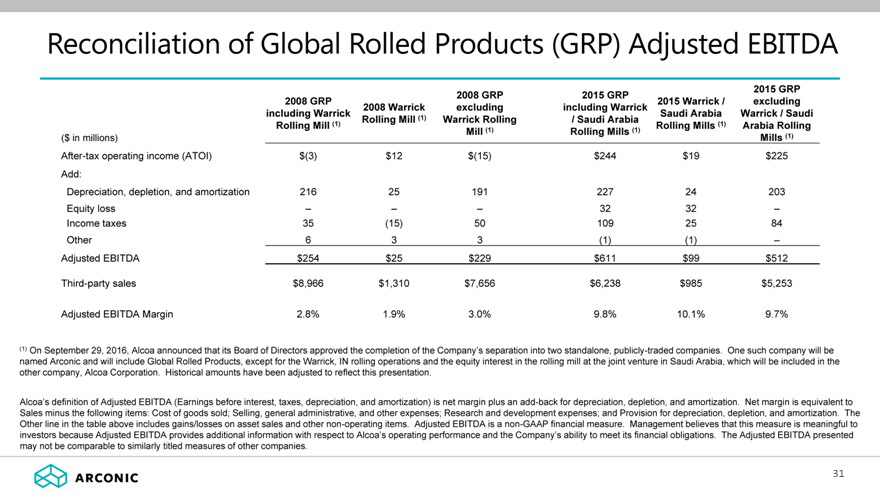
Reconciliation of Global Rolled Products (GRP) Adjusted EBITDA
2008 GRP2015 GRP2015 GRP
2008 GRP 2015 Warrick /excluding
2008 Warrickexcludingincluding Warrick
including Warrick Saudi ArabiaWarrick / Saudi
Rolling Mill (1)Warrick Rolling/ Saudi Arabia
Rolling Mill (1) Rolling Mills (1)Arabia Rolling
Mill (1)Rolling Mills (1)
($ in millions) Mills (1)
After-tax operating income (ATOI) $(3) $12$(15)$244$19$225
Add:
Depreciation, depletion, and amortization 216 2519122724203
Equity loss – ––3232–
Income taxes 35 (15)501092584
Other 6 33(1)(1)–
Adjusted EBITDA $254 $25$229$611$99$512
Third-party sales $8,966 $1,310$7,656$6,238$985$5,253
Adjusted EBITDA Margin 2.8% 1.9%3.0%9.8%10.1%9.7%
(1) On September 29, 2016, Alcoa announced that its Board of Directors approved the completion of the Company’s separation into two standalone, publicly-traded companies. One such company will be named Arconic and will include Global Rolled Products, except for the Warrick, IN rolling operations and the equity interest in the rolling mill at the joint venture in Saudi Arabia, which will be included in the other company, Alcoa Corporation. Historical amounts have been adjusted to reflect this presentation.
Alcoa’s definition of Adjusted EBITDA (Earnings before interest, taxes, depreciation, and amortization) is net margin plus an add-back for depreciation, depletion, and amortization. Net margin is equivalent to Sales minus the following items: Cost of goods sold; Selling, general administrative, and other expenses; Research and development expenses; and Provision for depreciation, depletion, and amortization. The Other line in the table above includes gains/losses on asset sales and other non-operating items. Adjusted EBITDA is a non-GAAP financial measure. Management believes that this measure is meaningful to investors because Adjusted EBITDA provides additional information with respect to Alcoa’s operating performance and the Company’s ability to meet its financial obligations. The Adjusted EBITDA presented may not be comparable to similarly titled measures of other companies.
27
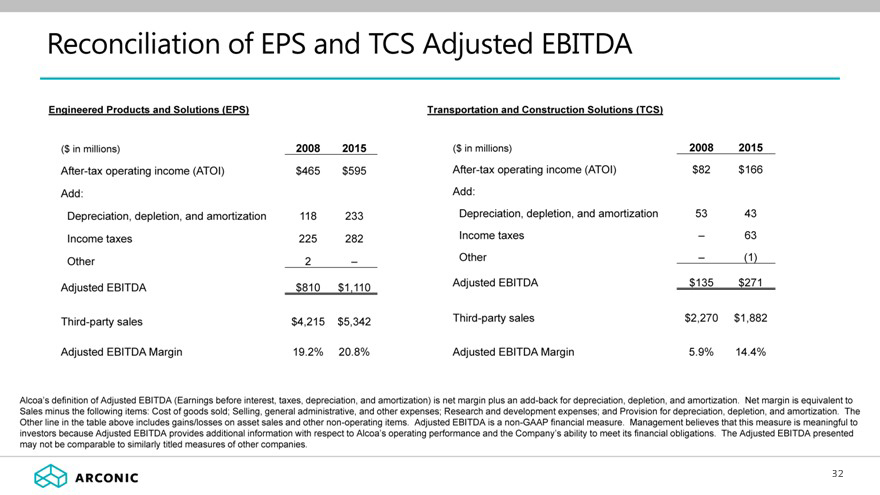
Reconciliation of EPS and TCS Adjusted EBITDA
Engineered Products and Solutions (EPS) Transportation and Construction Solutions (TCS)
($ in millions) 2008 2015($ in millions)20082015
After-tax operating income (ATOI) $465 $595After-tax operating income (ATOI)$82$166
Add: Add:
Depreciation, depletion, and amortization 118 233Depreciation, depletion, and amortization5343
Income taxes 225 282Income taxes–63
Other 2 –Other–(1)
Adjusted EBITDA $810 $1,110Adjusted EBITDA$135$271
Third-party sales $4,215 $5,342Third-party sales$2,270$1,882
Adjusted EBITDA Margin 19.2% 20.8%Adjusted EBITDA Margin5.9%14.4%
Alcoa’s definition of Adjusted EBITDA (Earnings before interest, taxes, depreciation, and amortization) is net margin plus an add-back for depreciation, depletion, and amortization. Net margin is equivalent to Sales minus the following items: Cost of goods sold; Selling, general administrative, and other expenses; Research and development expenses; and Provision for depreciation, depletion, and amortization. The Other line in the table above includes gains/losses on asset sales and other non-operating items. Adjusted EBITDA is a non-GAAP financial measure. Management believes that this measure is meaningful to investors because Adjusted EBITDA provides additional information with respect to Alcoa’s operating performance and the Company’s ability to meet its financial obligations. The Adjusted EBITDA presented may not be comparable to similarly titled measures of other companies.
28
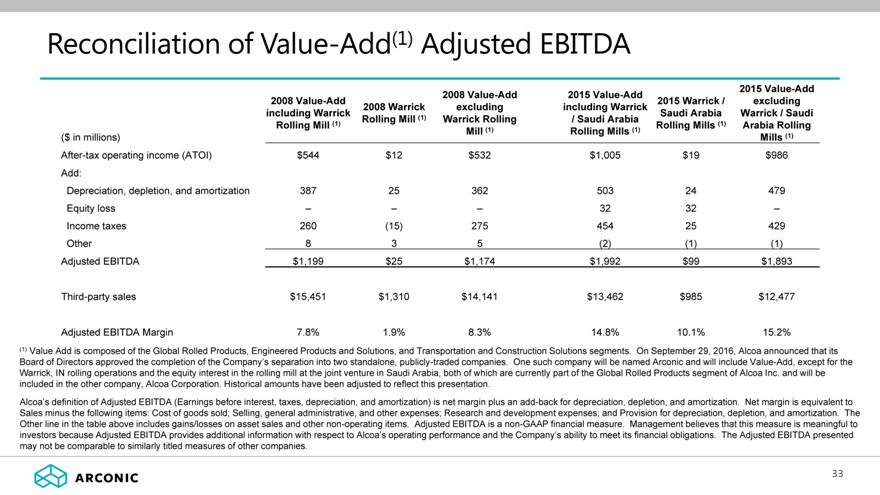
Reconciliation of Value-Add(1) Adjusted EBITDA
2008 Value-Add2015 Value-Add2015 Value-Add
2008 Value-Add 2015 Warrick /excluding
2008 Warrickexcludingincluding Warrick
including Warrick Saudi ArabiaWarrick / Saudi
Rolling Mill (1)Warrick Rolling/ Saudi Arabia
Rolling Mill (1) Rolling Mills (1)Arabia Rolling
Mill (1)Rolling Mills (1)
($ in millions) Mills (1)
After-tax operating income (ATOI) $544 $12$532$1,005$19$986
Add:
Depreciation, depletion, and amortization 387 2536250324479
Equity loss – ––3232–
Income taxes 260 (15)27545425429
Other 8 35(2)(1)(1)
Adjusted EBITDA $1,199 $25$1,174$1,992$99$1,893
Third-party sales $15,451 $1,310$14,141$13,462$985$12,477
Adjusted EBITDA Margin 7.8% 1.9%8.3%14.8%10.1%15.2%
(1) Value Add is composed of the Global Rolled Products, Engineered Products and Solutions, and Transportation and Construction Solutions segments. On September 29, 2016, Alcoa announced that its
Board of Directors approved the completion of the Company’s separation into two standalone, publicly-traded companies. One such company will be named Arconic and will include Value-Add, except for the Warrick, IN rolling operations and the equity interest in the rolling mill at the joint venture in Saudi Arabia, both of which are currently part of the Global Rolled Products segment of Alcoa Inc. and will be included in the other company, Alcoa Corporation. Historical amounts have been adjusted to reflect this presentation.
Alcoa’s definition of Adjusted EBITDA (Earnings before interest, taxes, depreciation, and amortization) is net margin plus an add-back for depreciation, depletion, and amortization. Net margin is equivalent to Sales minus the following items: Cost of goods sold; Selling, general administrative, and other expenses; Research and development expenses; and Provision for depreciation, depletion, and amortization. The Other line in the table above includes gains/losses on asset sales and other non-operating items. Adjusted EBITDA is a non-GAAP financial measure. Management believes that this measure is meaningful to investors because Adjusted EBITDA provides additional information with respect to Alcoa’s operating performance and the Company’s ability to meet its financial obligations. The Adjusted EBITDA presented may not be comparable to similarly titled measures of other companies.
29